2023 11 17 A STRONG ECONOMY

Create successful ePaper yourself
Turn your PDF publications into a flip-book with our unique Google optimized e-Paper software.
Operated by:<br />
QUALITY OF LIFE:<br />
A <strong>STRONG</strong> <strong>ECONOMY</strong>
Quality of Life Subcommittee<br />
Dariel Bateman<br />
Beth Blowes<br />
Jeneane Fast<br />
Kehlar Hillyer<br />
Leah Kennedy<br />
Joelle Lamport-Lewis<br />
Barb Leavitt<br />
Robin Spence-Haffner<br />
Jennifer Rojas<br />
Nancy Summers<br />
Kathy Vassilakos<br />
Special thanks given to advisors<br />
from Huron Perth Public Health:<br />
Erica Clark, PhD<br />
Angela Willert<br />
The Social Research & Planning Council is funded by:<br />
City of Stratford, Town of St. Marys,<br />
County of Perth, through the Department of Social Services,<br />
the County of Huron and United Way Perth-Huron.<br />
Thank you to all the community partners who<br />
contributed to this project. We value your contribution.<br />
Social Research & Planning Council<br />
United Centre, 32 Erie St., Stratford, ON N5A 2M4<br />
Tel: 519-271-7730<br />
Email: srpc@perthhuron.unitedway.ca<br />
www.perthhuron.unitedway.ca/social-research-planning-council
<strong>ECONOMY</strong><br />
Economic factors have a critical impact on quality of life.<br />
Employment is a significant contributor to overall quality of life.<br />
Together, income, financial security and employment directly<br />
impact one’s ability to afford essentials such as adequate housing,<br />
food, energy, internet and transportation. Emotional, physical and<br />
mental well-being is connected to access to these critical rights<br />
and factors.
INCOME<br />
Incomes in Perth-Huron are lower than<br />
provincial median<br />
Income has a significant impact on quality of life and is one<br />
of the most important social determinants of health. Living<br />
with low income can lead to incredible stress as low-income<br />
individuals and families try to get by while dealing with<br />
substandard housing, food insecurity, poor working conditions,<br />
unstable employment and discrimination. 1<br />
As of 2020, the median after-tax household income in Perth<br />
is $74,500 and $70,000 in Huron. By comparison, it is $79,500<br />
in Ontario. For one-person households, the median after-tax<br />
income is $37, 600 in Perth and $36,400 in Huron. It is $39,200 in<br />
Ontario. 2<br />
While low income is an indicator of living in poverty, it is not the<br />
same thing. Poverty is complex and can be described as not<br />
having enough money or access to resources to enjoy a decent<br />
standard of living. It extends beyond having enough income to<br />
afford only necessities — such as food or shelter — and is about<br />
exclusion. As such, poverty is difficult to define. In this report we<br />
refer to specific forms of poverty: energy poverty, food insecurity<br />
and housing poverty.<br />
Learn more about poverty. Visit Stats Canada’s Dimensions of<br />
Poverty Hub: www.statcan.gc.ca/en/topics-start/poverty<br />
2020 Median<br />
household<br />
income<br />
Perth<br />
$74,500<br />
Huron<br />
$70,000<br />
Ontario<br />
$79,500<br />
2020 Median<br />
one-person<br />
household<br />
income<br />
Perth<br />
$37,600<br />
Huron<br />
$36,400<br />
Ontario<br />
$39,200<br />
Page 4 A Strong Economy
In our region, 45% of residents over the age of 15 made<br />
less than a living wage as of 2020. According to Living<br />
Wage Canada, a living wage is the hourly wage every adult in a<br />
household needs to earn to cover basic expenses and participate<br />
in the community. In Ontario, a specific living wage is calculated<br />
for every region.<br />
The minimum wage is the lowest wage an employer can legally<br />
pay their staff. It is not based on a calculation of the cost of living,<br />
nor adjusted annually.<br />
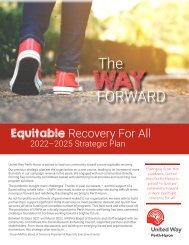
The most recent living wage for Perth-Huron, released in<br />
November <strong>2023</strong>, is $22.75 per hour. As of October 1, <strong>2023</strong>, the<br />
Ontario minimum wage is $16.65 per hour and $15.60 for students.<br />
The gap between minimum wage and living wage in<br />
Perth-Huron is now over $6 per hour.<br />
45%*<br />
of residents over<br />
the age of 15 made<br />
less than a living<br />
wage as of 2020<br />
*Calculated with 2020 taxfiler data<br />
and based upon 2022 Living Wage<br />
Rate<br />
www.livingwage.ca<br />
Graph 1: <strong>2023</strong> Living Wage Breakdown; Perth-Huron<br />
Source: Ontario Living Wage Network<br />
*Figures represent an aggregation of three household types and a 35-hour work week<br />
A: Two working adults with two children<br />
B: One working adult with one child<br />
C: One working adult<br />
Page 5 A Strong Economy
RECOMMENDATIONS<br />
Employers increase their rates of pay to a living wage and<br />
certify with the Ontario Living Wage Network.<br />
Employers currently paying a living wage ensure<br />
procurement policies and supply chain decisions reflect<br />
the local living wage.<br />
The provincial government raises the minimum wage to a<br />
living wage.
Women, racialized workers and new immigrants are<br />
disproportionately represented in the lowest paid worker bracket.<br />
The lowest paid workers are often more vulnerable and more likely to<br />
be precariously employed.<br />
The number of working poor in Canada is growing. In the Social<br />
Research & Planning Council’s recent report, Household Food<br />
Insecurity in Perth and Huron, more than 700 respondents reported<br />
being food insecure or at risk of food insecurity. Of the food insecure<br />
respondents, 64% had full-time employment.<br />
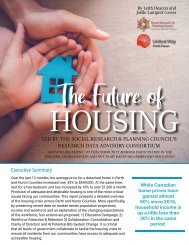
The following chart displays the difference in individual income<br />
between men and women based on data from the 2021 census. In<br />
both counties, women earned consistently less than men.<br />
Read Household Food<br />
Insecurity in Perth and Huron:<br />
perthhuron.unitedway.ca/<br />
research/<br />
Graph 2: Median total income in 2020<br />
Source: Statistics Canada<br />
$60,000<br />
$50,000<br />
$49,200<br />
$47,600<br />
Median Income is the value at<br />
which half the individuals earn<br />
below and half the individuals<br />
earn above.<br />
$40,000<br />
$37,600<br />
$35,600<br />
$30,000<br />
$20,000<br />
$10,000<br />
*Statistics Canada data for<br />
Perth-Huron does not reference<br />
transgender or non-binary<br />
identities. Instead, data is broken<br />
down by men+ (which includes<br />
men, boys and some non-binary<br />
persons) and women+ (which<br />
includes women, girls and some<br />
non-binary persons).<br />
$0<br />
Perth<br />
Huron<br />
Men<br />
Women<br />
Page 7 A Strong Economy
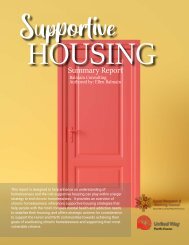
Graph 3: Projected median household income<br />
Source: Environics Canada<br />
$76,000<br />
$75,500<br />
$75,434<br />
$75,000<br />
$74,500<br />
$74,247<br />
$74,000<br />
$73,863<br />
$73,500<br />
$73,286<br />
$73,000<br />
2022 2025 2027 2032<br />
RECOMMENDATION<br />
Employers in all sectors perform a salary<br />
audit to collect gender pay discrepancy data<br />
and address any pay inequities that emerge.
The Number of Low-Income Households<br />
Dropped Due to Federal Assistance Programs<br />
The LIM-AT is defined as half the median family income after tax<br />
and varies based upon family size. LIMs are the most frequently<br />
used measurement internationally, especially when making<br />
comparisons between countries. It is widely used because it<br />
is simple to measure, not necessarily because it is the best<br />
measure of poverty. 3<br />
20%<br />
18%<br />
16%<br />
14%<br />
12%<br />
10%<br />
Graph 4: Low-Income Population Based on LIM-AT by Age (%)<br />
Source: Statistics Canada<br />
8%<br />
6%<br />
4%<br />
2%<br />
0%<br />
Perth 2016 Perth 2021 Huron 2016 Huron 2021<br />
0-<strong>17</strong> 18-64 65+<br />
From 2016 to 2021, the number of youth ages zero to <strong>17</strong> living in lowincome<br />
households dropped considerably in Perth-Huron. This likely<br />
reflects the financial support provided by the Canada Child Benefit,<br />
introduced in 2016, which provides a significant increase for lowincome<br />
households as compared to the previous benefits system. 4<br />
The financial support provided through the Canada Emergency<br />
Response Benefit (CERB) to individuals 15 years or older who had<br />
earned $5,000 or more in the previous year and whose employment<br />
was affected by COVID-19 is another probable factor. Meanwhile, the<br />
number of individuals over 65 living in low-income households has<br />
increased slightly. 5<br />
Page 9 A Strong Economy
~19%<br />
of total income in<br />
our region came<br />
from government<br />
transfers in 2020<br />
Social Assistance Programs Supplement<br />
Incomes of Financially Insecure Households<br />
Government transfers cover a wide range of programs including<br />
Employment Insurance, the Canada Pension Plan and Old Age<br />
Security. In Perth, 18% of an individual’s total income comes<br />
from government transfers on average. In Huron it is 20%. In<br />
Ontario it is <strong>17</strong>%. 6<br />
Ontario Works (OW) provides money for food, shelter and<br />
other costs to people in financial need who are at least 16 and<br />
participate in employment activities. The Ontario Disability<br />
Support Program (ODSP) provides financial assistance and<br />
employment to people with disabilities. To receive ODSP, the<br />
individual must be 18 years old, be in financial need and meet<br />
the program’s definition of a person with a disability. Ontario<br />
increased the ODSP rate in July <strong>2023</strong>. However, the last Ontario<br />
Works increase was in 2018. While the number of OW cases has<br />
remained steady since 20<strong>17</strong> in Perth-Huron, ODSP caseloads<br />
increased between 2018 and 2020.<br />
RECOMMENDATION<br />
The provincial government increases social assistance<br />
rates to the equivalent of a living wage so recipients<br />
can more adequately meet their basic needs, increase<br />
earnings exemptions and exemption rates and index<br />
rates to inflation.
Food Insecurity Impacts the Healthcare System<br />
Food insecurity means insecure access to food because of<br />
financial constraints. 7 The Social Research & Planning Council<br />
conducted a survey in November 2022 to better understand the<br />
nature and severity of household food insecurity regionally. More<br />
than 700 digital and paper surveys were analyzed. Findings of<br />
this survey revealed that 63% of respondents experienced food<br />
insecurity in the past year. Other findings can be seen in the<br />
charts below.<br />
Graph 5: Children and adults cut size of meals or skipped meals (past year)<br />
Source: SRPC Food Insecurity Survey<br />
Some months but not every month<br />
Only one or two months<br />
Almost every month<br />
0% 5% 10% 15% 20% 25% 30% 35%<br />
Children<br />
Adults<br />
Graph 6: Does income meet everyday needs?<br />
Source: SRPC Food Insecurity Survey<br />
2%<br />
Prefer not<br />
to answer<br />
35%<br />
Meets most<br />
everyday needs<br />
24%<br />
Does not meet<br />
everyday needs<br />
39%<br />
Meets some of<br />
everyday needs<br />
Page <strong>11</strong> A Strong Economy
Of respondents, 87% said they had to sacrifice their household<br />
food budget to pay for other living expenses such as rent or<br />
mortgage, transportation and utilities. A reduced food budget<br />
results in a compromised quality and/or quantity of food. The<br />
SRPC survey validates the finding that poverty is the root<br />
cause of food insecurity. 8<br />
Graph 7: Mental health implications of inadequate food budget<br />
Source: SRPC Food Insecurity Survey<br />
Prefer not to answer<br />
None of the above<br />
Have suicidal thoughts<br />
Isolated<br />
Irritable/Angry<br />
Aggressive/Hyperactive<br />
Depressed/Frustrated/Powerless/Shame<br />
Anxious and stressed<br />
0% 10% 20% 30% 40% 50% 60% 70% 80% 90%<br />
According to an Ontario study, kids in food insecure<br />
households are more likely to access healthcare for mental<br />
health and substance use. In other words, household food<br />
insecurity increases strain on the healthcare system. 9<br />
Page 12 A Strong Economy
In 2022, the cost of groceries for a family of four in Perth-Huron<br />
was $249 per week, or approximately $1,076 per month. A family of<br />
four relying on Ontario Works therefore needs to spend 39% of their<br />
income on food. Combined with the 52% of their income they must<br />
spend on rent, that leaves just 9%, or $261, each month for all other<br />
expenses. Households without children receive much less.<br />
For households earning minimum wage, working precarious jobs,<br />
receiving social assistance or living on a fixed income, it’s difficult<br />
to manage. The following table, taken from Huron Perth Public<br />
Health’s report The Real Cost of Eating in Huron and Perth 2022 * ,<br />
compares households receiving different social assistance benefits<br />
and how much money they have left after covering rent and food.<br />
Some benefits are not sufficient to cover even that. The table also<br />
shows the median Ontario income, highlighting the disparity with<br />
those who must survive on social assistance. 10 Maytree’s Welfare<br />
in Canada, 2022 report found that based on Toronto’s poverty line,<br />
social assistance rates in Ontario leave all family types living in<br />
deep poverty. Given that Perth-Huron’s living wage rate is only a<br />
couple of dollars less than Toronto’s, it is likely families would be<br />
living in deep poverty here as well. <strong>11</strong><br />
*Huron Perth Public Health<br />
surveys the average price of 61<br />
food items from multiple grocery<br />
stores across the region. These<br />
average prices are then used to<br />
calculate the cost of one week’s<br />
worth of groceries.<br />
Households with Child(ren)<br />
Households without Child(ren)<br />
Income Source<br />
Scenario 1 Scenario 2 Scenario 3 Scenario 4 Scenario 5<br />
Ontario<br />
Works<br />
Median<br />
Ontario<br />
Income<br />
Ontario<br />
Works<br />
Income (After tax)<br />
ODSP<br />
Senior<br />
OAS/GIS<br />
Total Monthly Income $2,760 $9,323 $863 $1309 $1,885<br />
Expenses<br />
Housing $1,423 $1,423 $742 $1,258 $1,258<br />
Food $1,076 $1,076 $386 $386 $279<br />
Monthly Income Remaining for Other Expenses<br />
$261 $6,824 -$265 -$335 $348<br />
% Income Required for Rent 52% 15% 86% 96% 67%<br />
% Income Required for Food 39% 12% 45% 29% 15%<br />
Table 1: Income and expenses table<br />
Source: The Real Cost of Eating in Huron and Perth 2022<br />
RECOMMENDATION<br />
All levels of government establish policies that support<br />
income-based solutions to food insecurity including a<br />
living wage and guaranteed income.<br />
Page 13 A Strong Economy
EMPLOYMENT<br />
More of the Perth population is active in labour<br />
force, more men than women in labour force<br />
The labour force participation rate speaks to the proportion<br />
of the overall population over the age of 15 that is working or<br />
actively seeking work. In Perth, 66.3% of the population 15 and<br />
over is actively participating in the labour force. In this instance,<br />
a high participation rate and a low unemployment rate indicate<br />
a robust job market. However, the participation rates for men<br />
and women are significantly different. The participation rate for<br />
men is 72% and for women it is 60.8%. A similar trend is evident<br />
in Huron, with an overall participation rate of 60.9% but 66% for<br />
men and 55.9% for women. 12<br />
Historically, Perth-Huron — as part of the Stratford-Bruce<br />
Peninsula economic region — has one of the lowest<br />
unemployment rates in Ontario. The following graph displays<br />
the average unemployment rate in the Stratford-Bruce Peninsula<br />
region and Ontario over the past seven years. While the<br />
unemployment rate rose during the COVID-19 pandemic, it has<br />
since returned to pre-pandemic levels.<br />
Graph 8: Unemployment rate in Stratford-Bruce Peninsula and Ontario<br />
Source: Statistics Canada, Labour Force Survey, <strong>2023</strong>. Data has not been seasonally adjusted.<br />
10<br />
9<br />
8<br />
7<br />
Unemployment Rate (%)<br />
6<br />
5<br />
4<br />
3<br />
2<br />
1<br />
0<br />
2016 20<strong>17</strong> 2018 2019 2020 2021 2022<br />
Year<br />
Page 15 A Strong Economy<br />
Stratford-Bruce Peninsula<br />
Ontario
1,636<br />
children on<br />
waitlist in Perth<br />
265<br />
children on<br />
waitlist in Huron<br />
The lack of early childhood<br />
educators has impacted the<br />
delivery of services in Perth-<br />
Huron. Licensed daycares,<br />
as well as multiple before<br />
and after school childcare<br />
programs ceased operating<br />
in mid-<strong>2023</strong>.<br />
Childcare Options Are in Short Supply<br />
While the workforce in Canada rebounded following the<br />
COVID-19 pandemic, reports indicate workforce gaps between<br />
men and women remain and childcare has been identified as<br />
a significant contributing factor. During the pandemic, more<br />
than 1.6 million women in Canada left the workforce. Women are<br />
more likely to work in sectors that were more directly impacted<br />
by COVID-19, such as education, childcare, service and tourism.<br />
The biggest decline in participation rates was for women who<br />
had school-aged children. Even among men, participation gaps<br />
exist for those with children and those without. The largest<br />
participation gap is 18.4% between men and women with<br />
children under the age of six. 13<br />
Among women who are not working, the main reasons they<br />
report being out of the workforce are personal and family<br />
responsibilities. Women working part-time reported that<br />
childcare was the biggest reason they could not work fulltime.<br />
14<br />
Huron 2019 2020 2021 2022<br />
Number of licensed childcare spaces 1,509 1,509 1,509 1,509<br />
Number of licensed private home childcare providers 21 14 12 13<br />
Number of children on the waitlist for licensed childcare 475 244 280 265<br />
Childcare fee subsidy (average per month) 475 350 180 239<br />
Table 2: Childcare spaces in Huron<br />
Source: Huron County<br />
Perth 2019 2020 2021 2022<br />
Number of licensed childcare spaces 1,989 2,030 2,078 2,094<br />
Number of licensed private home childcare providers 15 10 6 5<br />
Number of children on the waitlist for licensed childcare 814 1,034 1,166 1,636<br />
Childcare fee subsidy (average per month) 477 4<strong>17</strong> 384 379<br />
Table 3: Childcare spaces in Perth<br />
Source: City of Stratford<br />
Page 16 A Strong Economy
A Greater Percentage of People in Perth and<br />
Huron are Self-employed Compared to the<br />
Province<br />
Most workers in Perth and Huron work as employees, while close<br />
to one in five are self-employed. Compared to the province, this<br />
region has more self-employed people with 18% in Perth and 21%<br />
in Huron compared to 15% in Ontario. 15<br />
Graph 9: Self-employed workers in Perth and Huron<br />
Source: Statistics Canada<br />
HURON<br />
PERTH<br />
18% Self-employed 21%<br />
82% Employee<br />
79%
The next chart displays labour force occupation by National<br />
Occupation Classification (NOC), Canada’s system for<br />
describing occupations. NOC codes help organize and explain<br />
job descriptions, educational requirements, skill requirements<br />
and related jobs. 16<br />
The top occupations in Perth and Huron are trades, transport,<br />
equipment operator and sales and service. In Perth, those<br />
fields are followed by business, finance and administration. In<br />
Huron, they are followed by natural resources and agriculture.<br />
Graph 10: Labour force occupation in Perth and Huron by National Occupational Classification*<br />
Source: Statistics Canada<br />
*This is not an exhaustive list<br />
Natural/Applied Sciences<br />
Health<br />
Education/Law/Social/Community & Gov. Services<br />
Natural Resources/Agriculture<br />
Manufacturing/Utilities<br />
Business/Finance/Administration<br />
Trades/Transport/Equipment Operators<br />
Sales/Service<br />
0% 5% 10% 15% 20% 25%<br />
Huron Perth<br />
In both Perth and Huron the industries with the greatest number<br />
of businesses are agriculture, real estate and construction. <strong>17</strong><br />
Industry Perth Huron<br />
Agriculture 26% 35%<br />
Real Estate + Rental & Leasing 15% 16%<br />
Construction 9% 8%<br />
Retail Trade 7% 6%<br />
Table 4: Industries with the most businesses<br />
Source: 4 County Labour Market Planning Board<br />
Page 18 A Strong Economy
SMALL BUSINESSES<br />
Small business and non-profits play an important<br />
role in rural well-being<br />
Perth and Huron have a large share of micro (one to four<br />
employees) and very small (five to nine employees) businesses<br />
— including non-profits — that contribute siginificantly to the<br />
economy. Huron has a very large proportion of small businesses,<br />
with only 0.02% of businesses having more than 100 employees.<br />
Additionally, 74% of businesses in Huron are classified as selfoperated.<br />
In Perth, 0.07% of businesses have more than 100<br />
employees and 70% of businesses are classified as self-operated. 18<br />
Small businesses also contribute to quality of life in many ways.<br />
They are reflective of the communities in which they operate and<br />
strengthen connections and relationships. Small businesses have<br />
a high rate of participation in community, purchasing goods and<br />
services from other local businesses, holding fundraisers and<br />
volunteering at local events. As of <strong>2023</strong>, 51% of business in Perth<br />
and 54% in Huron have one to four employees. 19<br />
The non-profit<br />
sector contributes<br />
7.9%<br />
to the Ontario’s GDP<br />
and employs<br />
844,000<br />
people<br />
77% of whom are<br />
women.<br />
Source: The Ontario Non-Profit<br />
Network<br />
Perth County small business trends<br />
Existing entrepreneurs — in business prior to<br />
2020 — are more likely to be interested in selling<br />
or reducing their services.<br />
Young entrepreneurs are the majority of new<br />
business owners.<br />
Trending industries include sustainable retail,<br />
micro-focused (single) food products, digital<br />
services and senior support services.<br />
Huron County small business trends<br />
The majority of existing businesses are in a stable<br />
position and expect to maintain size, with a<br />
moderate number wanting to expand.<br />
Mid- and late-career professionals are starting<br />
new businesses.<br />
Trending industries include small batch farming<br />
and small agri-food retailers, artisanal and craft<br />
businesses, specialty and gift retail.<br />
Table 5: Small business trends<br />
Source:Invest Stratford; Huron County Small Business and Entrepreneur Centre.<br />
Non-profits and private sector businesses experienced many<br />
changes due to COVID-19 restrictions and closures, exacerbating<br />
issues such as increased costs, workforce recruitment and<br />
retention and housing shortages. Many non-profits are using<br />
reserves to continue operations so the need for government<br />
funding remains high.<br />
Page 19 A Strong Economy
RECOMMENDATIONS<br />
The federal government extends the interest-free<br />
full loan repayment period (i.e., the qualifying period<br />
for partial loan forgiveness) by at least one year, to<br />
December 31, 2024, for Canada Emergency Business<br />
Account (CEBA)* and Regional Relief and Recovery<br />
Fund (RRRF)** loans.<br />
All levels of government provide stable, long-term<br />
and flexible operational funding for non-profits that<br />
keeps pace with inflation and reflects the true costs of<br />
delivering programs and services.<br />
Provincial and municipal government increases funding<br />
and resources to support and encourage small business<br />
entrepreneurship.<br />
*The federal CEBA program offered interest-free loans of up to $60,000 to small<br />
businesses and non-profits.<br />
**The RRRF is part of the national COVID-19 Economic Response Plan to ease<br />
financial pressures caused by the pandemic. 25% was allocated for the tourism<br />
sector
Location of Work is Varied<br />
During the pandemic, many businesses were forced to shut down<br />
in-person operations and began functioning remotely with many<br />
employees working from home. 20 In May 2020, roughly 37% of<br />
working Canadians were working from home . According to the<br />
2021 census, only 21% of people in Perth-Huron work at home<br />
in comparison to 30% in Ontario, although some people have a<br />
hybrid work situation. 21<br />
21%<br />
of people in<br />
Perth-Huron<br />
work at home<br />
Graph <strong>11</strong>: Location of work in Perth and Huron compared to Ontario<br />
Source: Statistics Canada<br />
Usual place of work<br />
No fixed place<br />
Worked at home<br />
0% 10% 20% 30% 40% 50% 60% 70% 80%<br />
Ontario<br />
Perth and Huron
employs<br />
4,200 people<br />
Most people in Ontario commute within the community they<br />
live. Perth’s numbers are similar to the province, but in Huron<br />
only 39% of workers commute within their municipality, 33%<br />
commute outside of their municipality but within their county<br />
and 28% commute outside of Huron. Length of commute is<br />
directly related to subjective quality of life, with longer commutes<br />
meaning less time spent with family and friends, less time spent<br />
on recreation and leisure and lower life satisfaction. 22<br />
Bruce Power is by far the largest employer in the Stratford-Bruce<br />
Peninsula region with over 4,200 employees, some of whom<br />
commute from Huron and Perth. There is a significant indirect<br />
economic impact on the region as thousands of people are<br />
indirectly employed by hundreds of companies providing goods<br />
and services to Bruce Power. 23<br />
Graph 12: Commuting for work<br />
Source: Statistics Canada<br />
Commute outside of county<br />
Commute outside of municipality<br />
(but within county)<br />
Commute within municipality<br />
0% 20% 40% 60% 80%<br />
Ontario Huron Perth<br />
Employees who fully or partially work from home may reduce the need for childcare, decrease<br />
GHG emissions and risk of traffic accidents by reducing the commute.<br />
RECOMMENDATION<br />
Employers provide as much flexibility as feasible to<br />
accommodate the diverse needs of the workforce.<br />
According to a study conducted by researchers from the School of Environmental Design and Rural<br />
Development at the University of Guelph, average savings for rural telecommuters could range<br />
from $8,820 to $23,964 per year depending on the number of days telecommuted per week.<br />
Source: https://www.sciencedirect.com/science/article/pii/S0308596<strong>11</strong>8301046<br />
Page 22 A Strong Economy
HOUSING AND LIVING STANDARDS<br />
Housing is a human right<br />
While it is often treated as a commodity, adequate housing is a<br />
human right according to Canadian and international law. This<br />
means every person has the right to secure housing without<br />
the fear of eviction or losing their home. People should also be<br />
able to live in a neighbourhood that aligns with their culture<br />
and where they have access to employment, schools and<br />
services. 24<br />
Rates of homeownership are higher in Perth and Huron<br />
than across the province. In Ontario, 68% of people own the<br />
home they live in and about 31% rent. In Perth, 72% of people<br />
own their home while 28% rent. In Huron, 78% of people own<br />
their home and 22% rent.<br />
Housing is generally considered “affordable” if all shelter<br />
costs amount to less than 30% of a household’s before-tax<br />
income. 25 Shelter costs include rent, mortgage payments and<br />
any necessary repairs. In our region, fewer homeowners than<br />
renters are living in unaffordable housing. In Perth, <strong>17</strong>% of<br />
homeowners spend more than 30% of their income on shelter<br />
costs while the number is 16% in Huron. By contrast, almost<br />
33% of renter households in Perth and 31% in Huron are<br />
spending 30% or more of their income on shelter costs.<br />
Subsidized housing refers to any housing subsidized in a<br />
variety of ways to make it financially accessible to low-income<br />
individuals and families. It includes rent-geared-to-income<br />
housing, co-op housing, social housing, public housing,<br />
government-assisted housing, non-profit housing and housing<br />
subsidized by rent supplements and housing allowances. 26 In<br />
Perth, 14% of tenants live in subsidized housing while 15% of<br />
tenants in Huron live in subsidized housing. 27 Waitlists for<br />
subsidized housing are long and, anecdotally, many<br />
individuals will have to wait as much as five years to<br />
move into housing.<br />
In Perth and Huron 14% of tenant households are in<br />
core housing need. This means their housing is some<br />
combination of unaffordable, inadequate and unsuitable<br />
and the median acceptable alternative housing would also be<br />
unaffordable. 28<br />
The number of people facing homelessness is on the<br />
rise with a <strong>17</strong>-person increase in Perth between 2018<br />
and 2021 and a dramatic 69-person increase in Huron.<br />
Graph 13: Rates of homeownership<br />
Source: Statistics Canada<br />
ONTARIO<br />
PERTH<br />
HURON<br />
68%<br />
32%<br />
72%<br />
28%<br />
78%<br />
22%<br />
Own<br />
Rent<br />
Own<br />
Rent<br />
Own<br />
Rent<br />
For the purposes of<br />
regulations, the Ontario<br />
government and the City of<br />
Stratford define an “affordable<br />
residential unit” as a unit<br />
which costs 80% or less of<br />
the average market rent or<br />
purchase price.<br />
Page 23 A Strong Economy
14%<br />
of Perth-Huron<br />
people are<br />
experiencing<br />
housing poverty<br />
129<br />
of people in Perth<br />
have identified<br />
as experiencing<br />
homelessness<br />
Both Huron County and the City of Stratford maintain a By Name List<br />
of people who are experiencing homelessness inPerth and Huron.<br />
The number of people fluctuates for a variety of reasons including<br />
securing housing, moving away, losing contact with housing support<br />
services, becoming ineligible for supports or passing away. On the<br />
other end, individuals may return to the By Name List because they<br />
moved back to the Perth region or became eligible, regained contact<br />
with services or are again experiencing homelessness. In Perth in the<br />
last 12 months, a median of 6.5 individuals per month were identified<br />
for the first time as experiencing homelessness. 29 In Huron, there<br />
was a gradual increase in the number of people on the By Name List<br />
between September 2022 and May <strong>2023</strong>, with no more than seven<br />
people coming on or off the list each month. Between May <strong>2023</strong><br />
and June <strong>2023</strong> there was an increase of 26 people. This increase<br />
was because of work done by partners such as employment centres<br />
and hospitals to connect with individuals experiencing chronic<br />
homelessness. 30<br />
In 2018 in Huron, the biggest reasons for homelessness were family<br />
conflicts, incarceration and an inability to pay rent or a mortgage.<br />
In 2021, however, the reasons for most people were family conflicts,<br />
abuse and illness, mental conditions or lack of income. In Perth, most<br />
people experiencing homelessness in 2018 stated it was because of<br />
relationship breakdown, addiction or substance abuse and unsafe<br />
housing conditions. In 2021, the main reasons were relationship and<br />
family issues, housing and financial issues and health and corrections<br />
31, 32<br />
issues.<br />
Some Causes of<br />
Homelessness<br />
Systemic Barriers<br />
Low income, inadequate<br />
supports for vulnerable<br />
populations<br />
Examples of Self-<br />
Identified Causes<br />
Incarceration, relationship<br />
breakdowns/divorce,<br />
unsafe housing conditions<br />
Some Exacerbating<br />
Factors<br />
Relationship Conflict<br />
Abuse, illness or<br />
mental health<br />
Lack of Housing<br />
Eviction, unaffordable<br />
housing, unsafe housing<br />
conditions<br />
Personal Challenge<br />
Relational, behavioural,<br />
emotional or physical<br />
Discrimination<br />
by race, gender, sexual<br />
orientation or ability<br />
Addiction<br />
or substance misuse
Graph 14: Number of people facing homelessness in Huron<br />
Source: Huron County, Housing Services<br />
100<br />
90<br />
84<br />
90<br />
83<br />
80<br />
70<br />
60<br />
50<br />
40<br />
42<br />
44<br />
37<br />
39<br />
48 49<br />
53<br />
57 58<br />
30<br />
20<br />
10<br />
0<br />
Graph 15: Number of people facing homelessness in Perth<br />
Source: City of Stratford<br />
180<br />
<strong>17</strong>0<br />
160<br />
140<br />
120<br />
100<br />
120<br />
102<br />
103<br />
87<br />
140<br />
129<br />
120<br />
80<br />
60<br />
40<br />
20<br />
0<br />
2019 2020 2021 2022<br />
Total Homeless<br />
Chronic Homeless<br />
Page 25 A Strong Economy
Graph 16: Number of people on the housing waitlist<br />
Source: City of Stratford, Huron County<br />
700<br />
650<br />
600<br />
550<br />
500<br />
450<br />
400<br />
350<br />
300<br />
Jan Feb Mar Apr May Jun Jul Aug Sep Oct Nov Dec<br />
Huron<br />
Perth<br />
*There is no Huron<br />
data for October and<br />
no Perth data for<br />
December.<br />
Housing market is tight<br />
Housing prices have been increasing for decades but<br />
jumped significantly after 2020, with a difference of almost<br />
$200,000 in the average price between 2020 and 2021.<br />
Graph <strong>17</strong>: Average price of houses sold in Huron-Perth<br />
Source: The Huron Perth Association of Realtors<br />
800<br />
700<br />
600<br />
Average Price (K)<br />
500<br />
400<br />
300<br />
200<br />
100<br />
0<br />
2013 2014 2015 2016 20<strong>17</strong> 2018 2019 2020 2021 2022
Housing Spectrum<br />
Home<br />
Ownership<br />
Private Rental<br />
Affordable<br />
Rental &<br />
Ownership<br />
Public &<br />
Community<br />
Housing<br />
Supportive<br />
Housing<br />
Shelters/Crisis<br />
Accommodation<br />
Experiencing<br />
Homelessness<br />
Page 27 A Strong Economy
Page 28 Economics
Graph 18: Average price for one-bedroom rentals<br />
Source: City of Stratford<br />
$1,400<br />
$1,200<br />
$1,000<br />
$800<br />
$600<br />
$400<br />
$200<br />
$0<br />
20<strong>17</strong> 2018 2019 2020 2021 2022<br />
Stratford<br />
North Perth<br />
The Canada Mortgage and Housing Corporation’s (CMHC) Rental<br />
Market Survey collects rent rates, availability, vacancy and turnover<br />
data for urban areas with populations of 10,000 or more. These are<br />
used in setting government housing policies. The survey targets<br />
private structures that have been on the market for at least three<br />
months and have at least three rental units. While useful for urban<br />
areas such as the City or Stratford and North Perth (Listowel), data<br />
is not available for most areas in Perth and Huron.<br />
The Alternate Average Market Rent (AAMR) surveys to collect<br />
accurate data on current rental market prices from residential<br />
advertisements in areas not covered by the CMHC survey. While<br />
the CMHC survey includes both occupied and available rental<br />
units, the AAMR covers units that are available for rent, providing<br />
an accurate reflection of rental prices. The AAMR also covers<br />
structures with 1–2 units and is not restricted to structures with<br />
three or more units. Many units in both the Perth and Huron rental<br />
markets are owned by landowners with only one or two units.<br />
Having accurate rental housing data is important because it forms<br />
the basis of the housing benefit amount used for social assistance<br />
calculations and increases the possibility of recipients of housing<br />
allowances being able to afford rental units in the private market.<br />
Page 29 A Strong Economy
2020 AAMR<br />
from CMHC<br />
2021 Service<br />
Manager Area<br />
Rental Scan<br />
%<br />
Difference<br />
One bedroom $889 $1,253 41%<br />
Two bedrooms $1,034 $1,487 44%<br />
Three plus bedrooms $1,182 $1,894 60%<br />
Table 6: Comparison Between CMHC AAMRs and Local Rental Housing Costs<br />
City of Stratford. (2021). 2021-2 Request Alternate Average Market Rents Business Case.<br />
2022 AAMR<br />
from COHB*<br />
2022 Service<br />
Manager Area<br />
Rental Scan<br />
%<br />
Difference<br />
One bedroom $954 $1,345 41%<br />
Two bedrooms $1,144 $1,428 25%<br />
Three plus bedrooms $1,381 $1,800 30%<br />
Table 7: Comparison Between COHB AAMRs and Local Rental Housing Costs<br />
Huron County. (2022)<br />
*The CMHC does not<br />
collect rental data<br />
in Huron due to a<br />
small population size.<br />
Instead, the Canada-<br />
Ontario Housing<br />
Benefit (COHB) data<br />
is used for the Huron<br />
County comparison.<br />
RECOMMENDATION<br />
The federal government and the Canadian Mortgage and<br />
Housing Corporation utilize an alternative methodology for the<br />
Rental Market Survey to collect data in rural areas that is both<br />
reliable and reflective of rural communities and their housing<br />
markets.
The following chart displays the Approved Alternate Market<br />
Rents (AAMR) in Perth for 2021. If a family makes the median<br />
after-tax income in Perth and Huron ($73,286 in 2022),<br />
29% of their income would go to rent if they were renting a<br />
two-bedroom rental based on the AAMR. For a one-person<br />
household, the median yearly after-tax income is $37,000.<br />
With this level, a one-bedroom rental would account for 46%<br />
of their income and a bachelor would account for 35% of<br />
their income.<br />
The<br />
median<br />
household<br />
earning $73,286<br />
spends 29%<br />
on rent<br />
Graph 19: Alternate Average Market Rent in Perth 2021<br />
Source: City of Stratford<br />
The median<br />
one-adult<br />
household<br />
earning $37,000<br />
spends 46%<br />
on rent<br />
Many factors play into this leap in prices. On the demand<br />
side, the COVID-19 pandemic and related public health<br />
measures increased demand for larger dwellings with more<br />
rooms, while remote work allowed city dwellers to relocate<br />
to smaller centres. Low interest rates and rising prices<br />
gave homeowners more equity to leverage for purchasing<br />
additional properties. 33 Rising prices also may have created<br />
a sense of urgency for new buyers, who didn’t want to miss<br />
out or get stuck. Others may have bought simply to flip<br />
properties in a hot market, or to convert downscale housing<br />
into upscale housing as an investment strategy. 34 Meanwhile,<br />
many potential buyers now find that homes are out of reach<br />
and they must stay in the rental market. 35 As a result the<br />
rental market is limited, with fewer units available overall.<br />
Simultaneously, immigration levels have increased to meet<br />
labour needs (including in construction), creating further<br />
demand for units.<br />
Dr. Andrew Boozary is a primary<br />
care physician and the Executive<br />
Director of Population Health and<br />
Social Medicine at the University<br />
Health Network (UHN) in Toronto.<br />
With the UHN, Dr. Boozary has<br />
been doing innovative work<br />
helping people experiencing<br />
homelessness. Along with a wider<br />
movement in Canada and the<br />
United States, they have launched<br />
a project to build and provide<br />
permanent housing for vulnerable<br />
populations. In addition to helping<br />
people facing homelessness, the<br />
project — built on what used to<br />
be a UHN parking lot — helps<br />
hospitals cut the costs of caring<br />
for homeless patients. According<br />
to Boozary, “The air you breathe,<br />
the job you have, the income<br />
and social connections you<br />
have, are a much larger driver of<br />
health outcomes than how many<br />
primary care visits or surgeries<br />
you get access to as a patient.”<br />
With this project, Boozary will be<br />
able to “prescribe” housing for<br />
those who need it most. 36
A<br />
In addition to its more positive<br />
elements, Bill 23 controversially<br />
opened certain Greenbelt lands<br />
to development. After a critical<br />
report form the Auditor General<br />
and significant public backlash,<br />
housing minister Steve Clark<br />
stepped down and Doug Ford<br />
vowed to return those lands to the<br />
Greenbelt.<br />
On the supply side, new housing has been severely constricted<br />
for many years by local land-use regulation and zoning rules. In<br />
many communities, it is simply against the rules to build many<br />
types of housing, particularly dense housing like apartment<br />
buildings, on most residential land. 37 Current regulation also<br />
empowers residents to block development, even if it is in the<br />
interest of the community. This means housing providers must<br />
often spend years navigating bureaucracy and facing down local<br />
opposition to deliver even small amounts of housing to market.<br />
This drives up development expenses which are ultimately<br />
passed on through higher prices. This is on top of the rising<br />
costs of raw materials and labour. 38<br />
Additionally, in the mid-nineties both the federal and provincial<br />
governments divested from new affordable, social and nonprofit<br />
housing. Social housing is now the responsibility of<br />
Ontario municipalities, who, of all levels of government, have the<br />
least capacity to fund it. While investments at the higher levels<br />
of government have increased in the past twenty years, for<br />
instance through the National Housing Strategy, many of these<br />
programs have been modest and the demand from affordable<br />
housing providers is incredibly high. 39<br />
The demand for housing has increased dramatically while<br />
supply of all kinds has been choked off. Wages are not<br />
keeping pace with the cost of housing and it has become<br />
unaffordable for many in our area. Fortunately, the province and<br />
local governments are taking steps to increase supply through<br />
initiatives such as Ontario’s Bill 23 A and the investStratford<br />
Attainable Market Housing Project. These are welcome steps<br />
but much more can be done.<br />
RECOMMENDATIONS<br />
All levels of government collaborate with the private<br />
and non-profit sectors to incentivize and facilitate the<br />
development of affordable housing, particularly tailored to<br />
rural municipalities.<br />
The provincial government increases funding for<br />
municipalities and non-profits to expand access to and<br />
availability of supportive and transitional housing, as well<br />
as other emergency and long-term supports and services.<br />
Page 32 A Strong Economy
Energy Poverty is Higher in Rural Areas<br />
Households experience energy poverty when they face<br />
significant challenges in adequately meeting home energy<br />
needs, paying for home energy costs or affording other<br />
necessities because of energy costs. Energy poverty is<br />
often linked with household income because low-income<br />
households are more likely to live in lower-efficiency homes<br />
requiring more energy. Moderate-income households may<br />
also struggle because energy use increases with income.<br />
Households experiencing energy poverty are<br />
significantly more likely to suffer from poorer general<br />
and mental health. 40 Households in rural regions are<br />
more likely to experience energy poverty than households<br />
in urban areas. The possible reasons for this are a greater<br />
reliance upon electricity rather than natural gas to heat<br />
homes and water, higher transmission charges and overall<br />
41, 42<br />
larger home sizes in rural areas versus urban.<br />
Several municipalities within Perth-Huron are not serviced<br />
by natural gas. This means households are paying more<br />
to heat their homes and water, increasing the cost of<br />
living significantly. Additionally, there are competitive<br />
disadvantage for businesses. Portions of Ashfield-<br />
Colbourne-Wawanosh, Morris-Turnberry and Perth<br />
East do not yet have natural gas service. 43 The<br />
Low-Income Energy Assistance Program (LEAP) offers<br />
emergency financial help for people who are behind on their<br />
electricity or natural gas bills and are faced with having their<br />
service disconnected. To qualify, household income must<br />
fall below a certain limit based on how many people live in<br />
the house and the total household income. 44 In Stratford,<br />
approximately 39% of households spend more than 6% of<br />
their income on energy costs, meaning they have a high to<br />
extreme home energy cost burden.<br />
6%<br />
Any household that spends<br />
more than 6% of after-tax<br />
income on home energy<br />
costs is considered to live in<br />
energy poverty.<br />
Citation Anon. 2019. Energy Poverty<br />
in Canada: A CUSP Backgrounder.<br />
The Ontario Energy Board<br />
estimates the average<br />
residential household uses<br />
750 kWh/month.<br />
Hydro One rural low-density<br />
customers used an average<br />
of 1,190 kWh/month.<br />
Citation Anon. 2019. Energy Poverty<br />
in Canada: A CUSP Backgrounder.<br />
More information about<br />
eligibility and the amount<br />
available here: Low-income<br />
Energy Assistance Program |<br />
Ontario Energy Board (oeb.ca)<br />
RECOMMENDATIONS<br />
Governments and utility providers apply a human rights lens<br />
when providing utility services to rural customers, ensuring all<br />
customers have universal access to services and clean energy.<br />
The federal government allocates funds for low-income<br />
households to improve energy efficiency, move towards net-zero<br />
emissions targets and decrease energy poverty for vulnerable<br />
households.<br />
Page 33 A Strong Economy
Internet Access and Broadband<br />
Investment is Needed<br />
Internet access has become a necessity for nearly all of<br />
us. The internet enables access to information, education,<br />
healthcare and, increasingly, employment in remote and<br />
rural communities. 45 The following map displays internet<br />
access in Perth and Huron counties. Many municipalities<br />
have 91–100% coverage, meaning over 90% of the<br />
municipality has internet access. Howick ranks lowest in<br />
terms of broadband coverage in Perth-Huron, followed<br />
by Perth East. Municipal governments have made highspeed<br />
broadband internet access a priority and significant<br />
infrastructure investments have been or will be made. 46<br />
91-100%<br />
81-90%<br />
71-80%<br />
61-10%<br />
51-60%<br />
Page 35 A Strong Economy<br />
Map 1: Broadband coverage<br />
Source: Connected North
The following map displays broadband projects funded by the<br />
Province of Ontario. 47<br />
Planning<br />
Under<br />
Construction<br />
Complete<br />
Map 2: Broadband projects<br />
Source: Connected North<br />
RECOMMENDATION<br />
Government and providers invest further in universal access to<br />
broadband and cellular service, ensuring all residents have the critical<br />
infrastructure to support their inclusion.
Transportation Issues Are Prevalent<br />
Transportation issues are prevalent in the rural parts of our<br />
region, making it difficult for residents to take advantage<br />
of opportunities that would be easily accessible in more<br />
densely populated centres. Employment, education, health<br />
appointments and social activities often involve travel across<br />
significant distances and therefore require reliable and<br />
affordable transportation options. When these are not available,<br />
people miss out on key opportunities, especially affecting<br />
people living on low-incomes and the elderly. While many<br />
services transitioned to online delivery because of COVID-19,<br />
this is still inaccessible for more isolated rural clients who do not<br />
have internet access.<br />
Non-profits and volunteers have filled the gap for some<br />
residents. For instance, ONE CARE’s EasyRide service provides<br />
transportation to seniors, people with disabilities and those in<br />
low-serviced areas.<br />
The City of Stratford operates a public transit system with<br />
seven routes and regular Monday–Friday service. On Saturdays<br />
and Sundays people can access an on-demand system.<br />
Stratford Transit also includes services for people with physical<br />
challenges. The City of Stratford has a transportation service<br />
called Parallel Transit, also known as the “Mobility Bus,” that<br />
provides transportation within the City of Stratford for physically<br />
challenged individuals who are unable to access Stratford<br />
Transit. 48<br />
Municipalities in Perth County have also collaborated on the PC<br />
Connect transit service, connecting communities within Perth<br />
County to each other and with Kitchener-Waterloo and London.<br />
GO Transit piloted service to Stratford and St. Marys on the<br />
London to Toronto route from October 2021 to October <strong>2023</strong>.<br />
During the two years of operation, there was a weekday<br />
commuter train to the GTA. VIA Rail also services Stratford daily<br />
on the Sarnia to Toronto line, but the once daily schedule is<br />
limiting.<br />
Due to the geographic size and sparse population<br />
of Perth-Huron, providing a sufficient transportation<br />
system is logistically and financially challenging. There<br />
are significant costs for individuals who must rely on taxis or<br />
charter services and these costs are particularly challenging<br />
for those living on restricted incomes. While strides have been<br />
made, transportation remains a barrier to quality of life for some<br />
in our rural region. Limited options for transportation make<br />
everyday activities such as grocery shopping and getting to<br />
appointments more complicated and costly, leading to social<br />
isolation.
Table 8: PC Connect ridership (# of rides)<br />
Source: Perth County<br />
Funding Year 3<br />
Nov 2020–Mar 2021<br />
Funding Year 4<br />
Apr 2021–Mar 2022<br />
Funding Year 5<br />
Apr 2022–Mar <strong>2023</strong><br />
Funding Year 6 (partial)<br />
Apr <strong>2023</strong>–July <strong>2023</strong><br />
(in progress at time of writing)<br />
Route A<br />
Perth<br />
North<br />
Route B<br />
Perth<br />
South<br />
Transportation Within the Region<br />
PC Connect is a public transit service that offers<br />
transportation in Stratford, St. Marys, Perth County,<br />
London and Kitchener/Waterloo.<br />
Route 1<br />
KW to<br />
Listowel<br />
Route 2<br />
KW to St.<br />
Marys<br />
Route 3<br />
London to<br />
Stratford<br />
Totals<br />
342 87 55 186 94 764<br />
1,<strong>11</strong>6 578 872 978 1,127 4,671<br />
2,715 975 1,865 3,513 2,229 <strong>11</strong>,363<br />
1,324 621 1,390 1,675 1,253 6,263<br />
Totals 5,498 2,261 4,182 6,343 4,773 23,055<br />
Map 3: Perth County transit routes through the PC Connect service<br />
Source: perthcounty.ca<br />
Page 38 A Strong Economy
Map 4: Huron County transit routes through the Huron Shores Area Transit<br />
Source: huronshoresareatransit.ca<br />
RECOMMENDATION<br />
Governments, community members and businesses<br />
explore alternatives to a fixed route transit system to meet<br />
transportation needs of the public, students, seniors and the<br />
workforce.<br />
Page 39 A Strong Economy
TOURISM<br />
*The following data is from RTO4 for the Huron, Perth, Waterloo<br />
and Wellington region<br />
In 2019, over 10 million people visited the region. Most<br />
of these visitors were from Ontario, with about 154,000 from<br />
other provinces or territories and about <strong>11</strong>7,000 from outside<br />
of Canada. Most of these visitors did not stay overnight,<br />
with approximately 80% of visitors only staying one day.<br />
A little over 20% of visitors traveled for pleasure and 10%<br />
traveled for business. Other reasons for travel included<br />
visiting friends and family, shopping and attending festivals<br />
and events. The most popular accommodation types were<br />
private homes or cottages and hotels and motels. The most<br />
common activities visitors participated in were seeing<br />
friends or relatives, shopping, going to restaurants or bars<br />
and outdoor sports or activities. Over 30% of visitors<br />
were under the age of 35.<br />
The following table displays hotel statistics in the region<br />
from 2016 to 2020.<br />
2016 20<strong>17</strong> 2018 2019 2020<br />
Occupancy Rate 60.5% 60.3% 63.8% 63.9% 33.0%<br />
Average Daily Rate $<strong>11</strong>3.71 $<strong>11</strong>7.<strong>17</strong> $128.38 $131.84 $107.26<br />
Revenue per Available Room $68.77 $70.68 $81.89 $84.30 $35.35<br />
Table 9: Hotel statistics<br />
Source: Regional Toursim Organization 4<br />
*The following data is Huron specific from their visitor survey<br />
In 2022, Huron County Economic Development surveyed 609<br />
Ontario residents who visited Huron for business, pleasure<br />
or a personal trip in the past year. Goderich was the most<br />
visited with 51% of respondents visiting, followed by Bayfield<br />
with 25% and Port Albert and Clinton with 14% each. Of<br />
the 94% of respondents who visited as a personal trip,<br />
49% indicated their primary reason was visiting the beach/<br />
lakeshore. More than half (55%) of respondents stayed<br />
overnight, staying an average of two nights with 40% staying<br />
in a hotel or motel. About 20% stayed in a private home and<br />
roughly 20% stayed at an Airbnb or vacation rental. The<br />
following table displays the average amount spent by visitors<br />
during their stay, who completed the survey.<br />
Page 41 A Strong Economy
Amount Spent<br />
Accommodation $396<br />
Recreation and Entertainment $168<br />
Transportation $204<br />
Food and Beverage $210<br />
Shopping $157<br />
Total $1, 135<br />
Table 10: Amount spent by tourists in Huron County<br />
Source: Huron County<br />
RECOMMENDATION<br />
Municipal governments consider introducing a<br />
Municipal Accommodation Tax (MAT) to offset other<br />
budgetary items.<br />
The MAT is sometimes known as a hotel or lodging<br />
tax. It supplements municipal funds for tourism<br />
with revenues raised from visitors. The revenue<br />
generated by a MAT could offset other budget items,<br />
allowing municipalities to designate that money to<br />
priority projects such as affordable housing.
Local Theatres Contribute Significantly<br />
to the Local Economy<br />
While the COVID-19 crisis disrupted many areas of the<br />
economy, certain sectors were particularly affected including<br />
accommodation, food services, arts, entertainment, recreation<br />
and retail. Due to their nature, these sectors were affected more<br />
dramatically than others by public health measures to limit<br />
COVID-19 transmission and changes in consumer behaviour.<br />
Throughout 2020–2022, many consumers were hesitant to<br />
patronize businesses even when they were able to open or<br />
remain open. A survey by Statistics Canada from 2022 found<br />
that 63% of people in Perth and Huron avoided large gatherings<br />
and crowds and 30% avoided leaving the house at all except for<br />
essential errands.<br />
Local theatres are an important part of our cultural landscape<br />
and tourism economies and were hit hard by the pandemic;<br />
having to close entirely for one or more years and operate with<br />
reduced capacities. Theatres like the Stratford Festival and the<br />
Blyth Festival showed great ingenuity in adapting with outdoor<br />
performance spaces, while the Huron County Playhouse offered<br />
weekly mask-only performances. Now, they are doing the<br />
challenging work of rebuilding capacity, with steady progress as<br />
audiences reconnect with greater confidence.
The Blyth Festival is one of Canada’s only theatre companies<br />
producing exclusively Canadian content. Prior to 2020, the<br />
Festival’s box office sales were steadily increasing, reaching<br />
over 23,000 visitors for five plays. Prior to the COVID-19<br />
pandemic, the Blyth Festival was able to accommodate an<br />
indoor capacity of 373 seats for each performance in 2018<br />
and 2019. In 2020, the season was cancelled due to COVID-19<br />
restrictions. Upon reopening in 2021, the Festival pivoted<br />
to using an outdoor theatre that could only accommodate<br />
95 seats per performance, a big drop from pre-pandemic<br />
capacity. Due to US border restrictions, there were no out-ofcountry<br />
ticket sales. In 2022, the Festival continued to rebuild<br />
its capacity, selling up to 150 tickets per performance.<br />
The Stratford Festival is a major driver of Stratford’s tourism<br />
economy, both as an employer and through generating<br />
significant business for restaurants, stores and other local<br />
attractions. After cancelling the entire 2020 season, the<br />
Festival returned in 2021 with dramatically restricted capacity<br />
in two outdoor “canopy” venues. In the 2022 season, the<br />
Festival made major strides in rebuilding its pre-pandemic<br />
audience with attendance up almost tenfold from 2021, an<br />
estimated economic impact of $87.9 million on the area. 49<br />
The Huron Country Playhouse had pre-COVID attendance of<br />
73,343 people in one year. In 2020 and 2021, the theatre was<br />
closed entirely. When it reopened in 2022 attendance reached<br />
32,612 (65% of the total capacity). Due to the ongoing recovery<br />
from the pandemic, the Playhouse mounted fewer productions<br />
and thus made fewer seats available. In <strong>2023</strong>, attendance is<br />
predicted to be over 50,000 for the season, 75% of the total<br />
capacity and 75% of pre-COVID-19 attendance.<br />
RECOMMENDATION<br />
The provincial government makes the Ontario<br />
Staycation Tax Credit an annual offering, providing<br />
economic support to the tourism and hospitality<br />
sector.<br />
The Ontario Staycation Tax Credit allowed Ontario<br />
residents to claim 20% of their Ontario accommodation<br />
expenses on their personal income tax and benefit return.<br />
Page 44 A Strong Economy
Recommendation<br />
Individual &<br />
Community<br />
Businesses &<br />
Organization<br />
Municipal<br />
Gov.<br />
Provincial<br />
/Federal<br />
Gov.<br />
1<br />
2<br />
3<br />
4<br />
5<br />
6<br />
7<br />
8<br />
9<br />
10<br />
Employers increase their rates of pay to a living wage<br />
and certify with the Ontario Living Wage Network.<br />
(p.6)<br />
Employers currently paying a living wage ensure<br />
procurement policies and supply chain decisions<br />
reflect the local living wage. (p.6)<br />
The provincial government raises the minimum wage<br />
to a living wage. (p.6)<br />
Employers in all sectors perform both a salary audit<br />
to collect gender pay discrepancy data and address<br />
any pay inequities that emerge. (p.8)<br />
The provincial government increases social<br />
assistance rates to the equivalent of a living wage<br />
so recipients can more adequately meet their basic<br />
needs, increase earnings exemptions and exemption<br />
rates for recipients and index rates to inflation. (p.10)<br />
All levels of government establish policies that<br />
support income-based solutions to food insecurity<br />
including a living wage and guaranteed income.<br />
(p.13)<br />
Provincial and municipal government increases<br />
funding and resources to support and encourage<br />
small business entrepreneurship. (p.20)<br />
The federal government extends the interest-free<br />
full loan repayment period (i.e., the qualifying period<br />
for partial loan forgiveness) by at least one year, to<br />
December 31, 2024, for Canada Emergency Business<br />
Account (CEBA) and Regional Relief and Recovery<br />
Fund (RRRF) loans. (p.20)<br />
All levels of government provide stable, long-term<br />
and flexible operational funding for nonprofits that<br />
keeps pace with inflation and reflects the true costs<br />
of delivering programs and services. (p.20)<br />
Employers provide as much flexibility as feasible to<br />
accommodate the diverse needs of the workforce.<br />
(p.22)<br />
Page 45 A Strong Economy
Recommendation<br />
Individual &<br />
Community<br />
Businesses &<br />
Organization<br />
Municipal<br />
Gov.<br />
Provincial<br />
/Federal<br />
Gov.<br />
<strong>11</strong><br />
12<br />
13<br />
14<br />
15<br />
16<br />
<strong>17</strong><br />
18<br />
19<br />
The federal government and the Canadian Mortgage<br />
and Housing Corporation utilize an alternative<br />
methodology for the Rental Market Survey to collect<br />
data in rural areas that is both reliable and reflective<br />
of rural communities and their housing markets.<br />
(p.30)<br />
All levels of government collaborate with the private<br />
and non-profit sectors to incentivize and facilitate<br />
the development of affordable housing, particularly<br />
tailored to rural municipalities. (p.32)<br />
The provincial government increases funding for<br />
municipalities and non-profits to expand access<br />
to and availability of supportive and transitional<br />
housing, as well as other emergency and long-term<br />
supports and services. (p.32)<br />
Governments and utility providers apply a human<br />
rights lens when providing utility services to rural<br />
customers, ensuring all customers have universal<br />
access to services and clean energy. (p.33)<br />
The federal government allocates funds for lowincome<br />
households to improve energy efficiency,<br />
move towards net-zero emissions targets and<br />
decrease energy poverty for vulnerable households.<br />
(p.33)<br />
Government and providers invest further in universal<br />
access to broadband and cellular service, ensuring<br />
all residents have the critical infrastructure to support<br />
their inclusion. (p.35)<br />
Governments, community members and businesses<br />
explore alternatives to a fixed route transit system to<br />
meet transportation needs. (p.39)<br />
Municipal governments consider introducing a<br />
Municipal Accommodation Tax (MAT) to offset other<br />
budgetary items. (p.42)<br />
The provincial government makes the Ontario<br />
Staycation Tax Credit an annual offering, providing<br />
economic support to the tourism and hospitality<br />
sector. (p.44)<br />
Page 46 A Strong Economy
References<br />
1 Mikkonen, J., & Raphael, D. (n.d.). Social Determinants of Health: A quick guide for health for<br />
professionals. Kids New to Canada.<br />
https://kidsnewtocanada.ca/uploads/documents/Social_Determinants_of_Health.pdf<br />
2 Statistics Canada. <strong>2023</strong>. (table). Census Profile. 2021 Census of Population. Statistics Canada<br />
Catalogue no. 98-316-X2021001. Ottawa. Released March 29, <strong>2023</strong>. https://www12.statcan.gc.ca/<br />
census-recensement/2021/dp-pd/prof/index.cfm?Lang=E (accessed September 5, <strong>2023</strong>)<br />
3 Statistics Canada. (2019, January 3). Low-income measure, after tax (LIM-AT). Dictionary,<br />
Census of Population, 2016.<br />
https://www12.statcan.gc.ca/census-recensement/2016/ref/dict/fam021-eng.cfm<br />
4 Dudu, A., Eden, Z., McLean, N., & Iordache, T. (<strong>2023</strong>, June 8). Is the Canada Child Benefit an<br />
effective policy? Impacts on earnings and incomes . Finances of the Nation.<br />
https://financesofthenation.ca/2021/10/28/is-the-canada-child-benefit-an-effective-policy-impactson-earnings-and-incomes/<br />
5 Service Canada. (<strong>2023</strong>, June 27). Canada Emergency Response Benefit (CERB). Government of<br />
Canada. https://www.canada.ca/en/services/benefits/ei/cerb-application.html#h2.03<br />
6 Statistics Canada. <strong>2023</strong>. (table). Census Profile. 2021 Census of Population. Statistics Canada<br />
Catalogue no. 98-316-X2021001. Ottawa. Released March 29, <strong>2023</strong>. https://www12.statcan.gc.ca/<br />
census-recensement/2021/dp-pd/prof/index.cfm?Lang=E (accessed September 5, <strong>2023</strong>).<br />
7 PROOF (n.d). Identifying Policy Options to Reduce Household Food Insecurity.<br />
https://proof.utoronto.ca/food-insecurity/<br />
8 United Way Perth-Huron (<strong>2023</strong>). Food Insecurity Report. https://perthhuron.unitedway.ca/wpcontent/uploads/<strong>2023</strong>/07/<strong>2023</strong>-06-22-Food-Security-Report-UPDATE.pdf<br />
9 Grassa, J. L. (<strong>2023</strong>, July 25). Kids who go hungry more likely to access care for Mental Health,<br />
substance use: Ontario study. CBC News. https://www.cbc.ca/news/health/food-insecurity-mentalhealth-youth-ontario-1.69<strong>11</strong>381#:~:text=The%20children%20were%20between%20the,access%20<br />
to%20an%20appropriate%20diet.<br />
10 Huron Perth Public Health (2022). The Real Cost of Eating 2022<br />
<strong>11</strong> Maytree. (n.d.). Components of welfare incomes. https://maytree.com/changing-systems/<br />
data-measuring/welfare-in-canada/ontario/<br />
12 Statistics Canada. <strong>2023</strong>. (table). Census Profile. 2021 Census of Population. Statistics Canada<br />
Catalogue no. 98-316-X2021001. Ottawa. Released March 29, <strong>2023</strong>. (accessed September 5, <strong>2023</strong>).<br />
https://www12.statcan.gc.ca/census-recensement/2021/dp-pd/prof/index.cfm?Lang=E<br />
13 MacKenzie-Sutter, H. (<strong>2023</strong>, June 6). Child care keeping women out of workforce despite<br />
COVID rebound: Report - BNN bloomberg. BNN Bloomberg. https://www.bnnbloomberg.ca/child-carekeeping-women-out-of-workforce-despite-covid-rebound-report-1.1929386<br />
14 MacKenzie-Sutter, H. (<strong>2023</strong>, June 6). Child care keeping women out of workforce despite<br />
COVID rebound: Report - BNN bloomberg. BNN Bloomberg. https://www.bnnbloomberg.ca/child-carekeeping-women-out-of-workforce-despite-covid-rebound-report-1.1929386<br />
15 Statistics Canada. <strong>2023</strong>. (table). Census Profile. 2021 Census of Population. Statistics Canada<br />
Catalogue no. 98-316-X2021001. Ottawa. Released March 29, <strong>2023</strong>. (accessed September 5, <strong>2023</strong>).<br />
https://www12.statcan.gc.ca/census-recensement/2021/dp-pd/prof/index.cfm?Lang=E<br />
16 Statistics Canada. <strong>2023</strong>. (table). Census Profile. 2021 Census of Population. Statistics Canada
Catalogue no. 98-316-X2021001. Ottawa. Released March 29, <strong>2023</strong>. (accessed September 5, <strong>2023</strong>).<br />
https://www12.statcan.gc.ca/census-recensement/2021/dp-pd/prof/index.cfm?Lang=E<br />
<strong>17</strong> Four County Labour Market Planning Board. (2021, October). Business counts - four county<br />
labour market planning board. https://www.planningboard.ca/wp-content/uploads/2021/12/<br />
Business-Counts-Report-OCT-2021-FINAL.pdf<br />
18 Four County Labour Market Planning Board. (2021, October). Business counts - four county<br />
labour market planning board. https://www.planningboard.ca/wp-content/uploads/2021/12/<br />
Business-Counts-Report-OCT-2021-FINAL.pdf<br />
19 Raw data obtained from 5 County Labour Market Planning Board<br />
20 Clarke, S., & Hardy, V. (2022, August 24). Working from home during the COVID-19 pandemic:<br />
How rates in Canada and the United States compare.<br />
https://doi.org/10.25318/36280001202200800001-eng<br />
21 Statistics Canada. <strong>2023</strong>. (table). Census Profile. 2021 Census of Population. Statistics Canada<br />
Catalogue no. 98-316-X2021001. Ottawa. Released March 29, <strong>2023</strong>. https://www12.statcan.gc.ca/<br />
census-recensement/2021/dp-pd/prof/index.cfm?Lang=E (accessed September 5, <strong>2023</strong>).<br />
22 Han, L., Peng, C., & Xu, Z. (2022). The effect of commuting time on quality of life: Evidence from<br />
China. International Journal of Environmental Research and Public Health, 20(1), 573.<br />
https://doi.org/10.3390/ijerph20010573<br />
23 Bruce Power. (<strong>2023</strong>, June 1). Bruce Power’s Mid-Term Update. https://www.brucepower.com/<br />
wp-content/uploads/<strong>2023</strong>/08/230035A-CNSC-Mid-term-Report_R002_Accessible_AX.pdf<br />
24 United Nations. (n.d.). The human right to adequate housing. OHCHR. https://www.ohchr.org/<br />
en/special-procedures/sr-housing/human-right-adequate-housing<br />
25 Canada Mortgage and Housing Corporation. (2018, March 31). About Affordable<br />
Housing in Canada. https://www.cmhc-schl.gc.ca/professionals/industry-innovation-andleadership/industry-expertise/affordable-housing/about-affordable-housing/affordablehousing-in-canada#:~:text=What%20is%20affordable%20housing%3F,a%20household%27s%20<br />
before%2Dtax%20income.<br />
26 Statistics Canada. (2016, January 4). Subsidized housing. National Household Survey (NHS)<br />
Dictionary. https://www12.statcan.gc.ca/nhs-enm/20<strong>11</strong>/ref/dict/dwelling-logements0<strong>17</strong>-eng.cfm<br />
27 Statistics Canada. <strong>2023</strong>. (table). Census Profile. 2021 Census of Population. Statistics Canada<br />
Catalogue no. 98-316-X2021001. Ottawa. Released March 29, <strong>2023</strong>. https://www12.statcan.gc.ca/<br />
census-recensement/2021/dp-pd/prof/index.cfm?Lang=E (accessed September 5, <strong>2023</strong>).<br />
28 City of Stratford<br />
29 County of Huron, Housing Services<br />
30 Heisel, D., & Randle, J. (2022, September 21). Core Housing Need in Canada. Statistics Canada.<br />
https://www150.statcan.gc.ca/n1/pub/<strong>11</strong>-627-m/<strong>11</strong>-627-m2022056-eng.htm<br />
31 2018 Homeless Enumeration Report for Stratford, Perth County and St Marys<br />
32 2018 Homeless Enumeration for Huron County<br />
33 Canadian Housing Evidence Collaborative. (<strong>2023</strong>). IUHF Journal Summer <strong>2023</strong><br />
34 WOWA (n.d.) Understanding the BRRRR Method in Canada.<br />
https://wowa.ca/brrrr-method-canada<br />
35 Cyca, M. (<strong>2023</strong>, June 5). The End of Homeownership. Macleans Canada.<br />
https://macleans.ca/longforms/the-end-of-homeownership/<br />
Page 48 Strong Economy
36 Rosalsky, G. (<strong>2023</strong>, February 7). This doctor wants to prescribe a cure for homelessness. NPR.<br />
https://files.ontario.ca/mmah-housing-affordability-task-force-report-en-2022-02-07-v2.pdf<br />
37 City of Stratford, Transit<br />
38 Housing Affordability Task force (2022). Report of the Ontario Housing Affordability Task<br />
Force. https://files.ontario.ca/mmah-housing-affordability-task-force-report-en-2022-02-07-v2.pdf<br />
39 Deng, A., Leviten-Reid, C., & Thériault, L. (<strong>2023</strong>a). Can they build or not? nonprofit housing<br />
development in an ERA of government re-engagement. Canadian Journal of Nonprofit and Social<br />
Economy Research, 14(1). https://doi.org/10.29<strong>17</strong>3/cjnser586<br />
40 Riva, M., Kingunza Makasi, S., O’Sullivan, K.C. et al. Energy poverty: an overlooked determinant<br />
of health and climate resilience in Canada. Can J Public Health <strong>11</strong>4, 422–431 (<strong>2023</strong>).<br />
https://doi.org/10.<strong>17</strong>269/s41997-023-00741-0<br />
41 Alleckna, M. (2019, November 27). Energy poverty in Canada: How each province performs.<br />
EnergyRates.ca. https://energyrates.ca/energy-poverty-in-canada-how-each-province-performs/<br />
42 Energy Rates (n.d.). Energy Poverty in Canada: How Each Province Performs.<br />
https://energyrates.ca/energy-poverty-in-canada-how-each-province-performs/<br />
43 Ontario Energy Board. (2020, October 30). Report to the Minister of Energy, Northern<br />
Development and Mines and to the Associate Minister of Energy. https://www.oeb.ca/sites/default/<br />
files/OEB-Natural-Gas-Expansion-Report-to-Ministers-20201030.pdf<br />
44 Ontario Energy Board. (n.d.). Bill assistance programs. https://www.oeb.ca/consumerinformation-and-protection/bill-assistance-programs<br />
https://www.oeb.ca/consumer-information-andprotection/bill-assistance-programs/low-income-energy-assistance-program<br />
45 University of Birmingham. (<strong>2023</strong>, April 7). Internet access must become human right or we<br />
risk ever-widening inequality. https://www.sciencedaily.com/releases/<strong>2023</strong>/04/230407094243.<br />
htm#:~:text=Internet%20access%20must%20become%20human%20right%20or%20we%20risk%20<br />
ever%2Dwidening%20inequality,-Date%3A%20April%207&text=Summary%3A,right%2C%20a%20<br />
new%20study%20reveals.<br />
46 Connected north (n.d.) Ontario Broadband Information<br />
47 Connected north (n.d.) Ontario Broadband Information<br />
46 City of Stratford, Transit<br />
49 Stratford Festival. (<strong>2023</strong>, April 1).<br />
https://www.stratfordfestival.ca/Media/NewsReleases/<strong>2023</strong>-04-01/<br />
About the SRPC<br />
The Social Research & Planning Council (SRPC), operated by United Way Perth-<br />
Huron, is comprised of community representatives who are dedicated to the collection,<br />
analysis and distribution of information relating to social trends and issues in Perth and<br />
Huron Counties. The SRPC approaches its work in two ways:<br />
1. Commissioning research into specific social issues.<br />
2. Developing recommendations for community improvement based on local findings<br />
and working collaboratively with community members to implement change.
Additional Resources<br />
How Much is Enough? The Impact of Low Incomes on Households and Communities in Perth-Huron: https://<br />
perthhuron.unitedway.ca/wp-content/uploads/2019/10/2019-09-05-How-Much-is-Enough-Website-version-<br />
FINAL.pdf<br />
Statistics Canada Dimensions of Poverty Hub: https://www.statcan.gc.ca/en/topics-start/poverty<br />
Living Wage in Perth-Huron: https://perthhuron.unitedway.ca/research/living-wage/<br />
Household Food Insecurity in Perth-Huron <strong>2023</strong>-06-22-Food-Security-Report-UPDATE.pdf (unitedway.ca)<br />
The Real Cost of Eating Huron and Perth 2022: https://www.hpph.ca/en/partners-and-professionals/resources/<br />
Documents/REPORT_Cost-of-eating-in-HP_Oct-2022.pdf<br />
Four County Labour Market Planning Board’s Precarious Living Study:<br />
https://www.planningboard.ca/reports/precariouslivingstudy/<br />
Ontario Nonprofit Network’s 2022 State of the Sector:<br />
https://theonn.ca/publication/2022-state-of-the-sector-policy-report/<br />
Huron County Business Retention & Expansion Project<br />
Social Research & Planning Council’s Supportive Housing Report:<br />
https://perthhuron.unitedway.ca/wp-content/uploads/2021/06/2021-Supportive-Housing-Report.pdf<br />
Stratford, Perth County and St. Marys Housing and Homelessness Plan: https://www.stratford.ca/en/inside-cityhall/resources/Social_Services/Housing/HHP-AR-2020-Summary.ACC.pdf<br />
Huron County Housing and Homelessness 2021 Annual Report: https://www.huroncounty.ca/wp-content/<br />
uploads/2022/07/2021-Housing-and-Homelessness-report.pdf<br />
City of Stratford Transportation Master Plan Draft Report: https://engagestratford.ca/transportation-master-plan<br />
Municipal Accommodation Tax White Paper: https://perthhuron.unitedway.ca/research/
WRITING<br />
Areeba Ahmad<br />
Kristin Crane<br />
Will Wellington<br />
EDITING<br />
Chad Alberico<br />
DESIGN<br />
Sonya Heyen<br />
CONTRIBUTING<br />
PHOTOGRAPHY<br />
Fred Gonder<br />
Copyright © The Social Research & Planning<br />
Council <strong>2023</strong>. This work is copyrighted. It<br />
may be reproduced in whole or in part for<br />
educational use subject to the inclusion of an<br />
acknowledgement of the source.<br />
Icons made by SlidesToGo