2023 11 17 A DIVERSE COMMUNITY
Create successful ePaper yourself
Turn your PDF publications into a flip-book with our unique Google optimized e-Paper software.
Operated by:<br />
QUALITY OF LIFE:<br />
A <strong>DIVERSE</strong> <strong>COMMUNITY</strong>
Quality of Life Subcommittee<br />
Dariel Bateman<br />
Beth Blowes<br />
Jeneane Fast<br />
Kehlar Hillyer<br />
Leah Kennedy<br />
Joelle Lamport-Lewis<br />
Barb Leavitt<br />
Robin Spence Haffner<br />
Jennifer Rojas<br />
Nancy Summers<br />
Kathy Vassilakos<br />
Special thanks given to advisors<br />
from Huron Perth Public Health:<br />
Erica Clark, PhD<br />
Angela Willert<br />
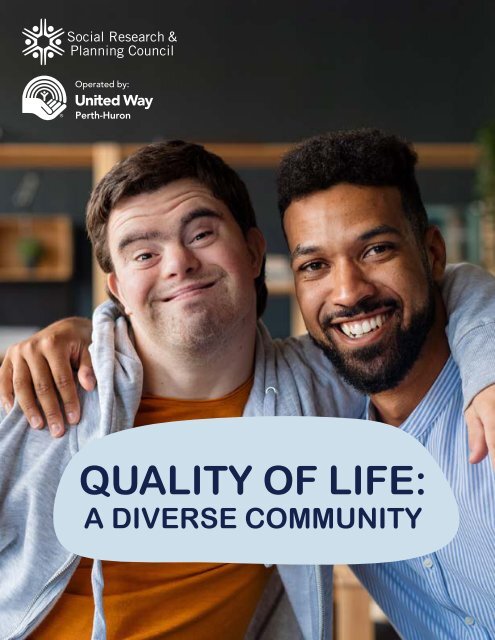
A <strong>DIVERSE</strong> <strong>COMMUNITY</strong><br />
A community can be diverse in many ways. It might be home to<br />
people from a range of ethnic, racial and cultural backgrounds.<br />
Or community members may have different lifestyles, interests,<br />
values and experiences. Encouraging and maintaining a diverse<br />
community involves appreciating and respecting the ways people<br />
can be different from one another. Jean Augustine, Canada’s first<br />
Black woman member of Parliament, said, “Diversity is a key<br />
component of high performing societies. Greater outcomes emerge<br />
when people come together regardless of race, lineage, religion or<br />
gender. Canada and the world’s future success will be increasingly<br />
tied to our capacity to harness different backgrounds, skills, attitudes,<br />
experiences and perspectives. The advantages this brings are<br />
limitless.” 1,2,3,4<br />
When we reflect diversity such as race, gender, age, ethnicity,<br />
socioeconomic status, culture and disability in our communities and<br />
structures, we’re more likely to have greater engagement and better<br />
outcomes for all. 5 It is important to consider the interconnected<br />
nature of these categorizations. A racialized person who also has<br />
a low socioeconomic status has very different experiences than<br />
someone who is not racialized but has a low socioeconomic status.<br />
Although there is plenty of variation among residents of Perth and<br />
Huron, our region is less diverse than other parts of the province,<br />
something we share with other rural regions.<br />
The Social Research & Planning Council is funded by:<br />
City of Stratford, Town of St. Marys,<br />
County of Perth, through the Department of Social Services,<br />
County of Huron and United Way Perth-Huron.<br />
Thank you to all the community partners who<br />
contributed to this project. We value your contribution.<br />
Social Research & Planning Council<br />
United Centre, 32 Erie St., Stratford, ON N5A 2M4<br />
Tel: 519-271-7730<br />
Email: srpc@perthhuron.unitedway.ca<br />
www.perthhuron.unitedway.ca/social-research-planning-council<br />
Page 3 Environment
PEOPLE IN OUR REGION<br />
Indigenous Population in Perth-Huron<br />
is Small But Significant<br />
Indigenous refers to people who identify as First Nations, Métis<br />
or Inuit. First Nations refers to a broad range of Indigenous<br />
communities who are distinct from the Métis and Inuit. Métis<br />
refers to communities or individuals of mixed Indigenous<br />
and European ancestry. Inuit refers to an Indigenous people<br />
historically located in the Arctic. 6<br />
There are no First Nations reserves within Perth and Huron<br />
County borders. The closest communities are the Saugeen<br />
Ojibway Nation to the north and the Chippewas of Kettle and<br />
Stony Point First Nation to the south. Both communities sit on<br />
the shores of Lake Huron and are each home to roughly 1,000<br />
residents. It is important to acknowledge that Perth County<br />
is located on the traditional territory of the Haudenosaunee,<br />
Anishinaabe and Attiwandaronk (Neutral) peoples. Huron County<br />
is located on the traditional territory of the Haudenosaunee<br />
(Iroquois), Ojibway/Chippewa, Anishinaabe and Attiwandaronk<br />
(Neutral) peoples.<br />
Indigenous peoples lived, hunted, fished, farmed and traded<br />
on this land for generations and many maintain their traditions<br />
to this day. Indigenous culture has deep and meaningful<br />
connections to the land and water, which are home to spiritual<br />
and cultural heritage sites as well as ancestral resting place.<br />
The Anishinaabe follow the lessons of the Seven Grandfathers<br />
and their clan system is made up of seven different clans. The<br />
Saugeen Ojibway Nation is located to the north of Perth-Huron<br />
and they are fishing people who have fished in their traditional<br />
territory for generations. In <strong>17</strong>93, the Saugeen Ojibway Nation<br />
identified as Anishinaabe. Their clans are inherited through an<br />
individual’s father. Much like the Anishinaabe in the south, these<br />
clans are named after symbolic animals, birds or fish.<br />
The Historic Saugeen Métis have lived along the Lake Huron<br />
shoreline from Georgian Bay to south of Goderich since the early<br />
1800s.<br />
2,300<br />
individuals in the<br />
Perth-Huron region<br />
identify as Indigenous<br />
To discover the traditional<br />
territory and treaties in<br />
your municipality visit:<br />
perthhuron.unitedway.ca/<br />
community-resources/<br />
land-acknowledgement/<br />
Some Anishinaabemowin<br />
words were taken by<br />
English settlers and we<br />
still commonly use them<br />
today: for example, mooz<br />
(moose) 7<br />
Self-Identified Indigenous Population Perth Huron Ontario<br />
Total Indigenous identity for the<br />
population in private households*<br />
1.5%<br />
(1,235) of<br />
total pop.<br />
1.9%<br />
(1,140) of<br />
total pop.<br />
2.9%<br />
(406,585) of<br />
total pop.<br />
First Nations 50% 55% 62%<br />
Métis 43% 39% 33%<br />
Inuk (Inuit) 2% 0% 1%<br />
Indigenous responses not listed above 4% 5% 2%<br />
Table 1: Self-Identified Indigenous Population<br />
Source: Statistics Canada, Census 2021. Indigenous population.<br />
The traditional language of the Anishinaabe is Anishinaabemowin,<br />
an Algonquian language. The Haudenosaunee traditional<br />
languages are comprised of many languages including Mohawk,<br />
Oneida, Onondaga, Seneca, Tuscarora, Wyandot and Cayuga. The<br />
most widely spoken is Mohawk. Language is critically important<br />
to the survival of Indigenous people and their cultures and there is<br />
Indigenous-led work to revitalize traditional languages lost through<br />
assimilative policies and residential schools.<br />
The table displays the percentage of Indigenous people in Perth and<br />
Huron compared to Ontario as a whole.<br />
*The estimates associated with this topic are<br />
affected by the incomplete enumeration of some<br />
reserves and settlements. These numbers are selfreported<br />
and may not be an accurate representation<br />
due to the lasting implications of colonization,<br />
limiting the individuals who disclose their<br />
Indigenous identity.<br />
Page 4 A Diverse Community
According to 2020 data from Environics Analytics, 80% of people in<br />
Perth and 82% in Huron think that respect for Indigenous culture<br />
is a shared value to a great or moderate extent in Canada. These<br />
numbers could be even stronger today following the establishment<br />
of the National Day for Truth and Reconciliation by the federal<br />
government in 2021 after the discovery of unmarked burial sites at<br />
former residential schools across the country. 8 Continued change<br />
speaks to the relentless work Indigenous peoples have put into<br />
protecting their identities and fighting for their rights.<br />
Friendship Centres provide<br />
culturally-based programs and<br />
services to Indigenous peoples<br />
living in urban centres or offreserve.<br />
The Truth and Reconciliation<br />
Commission, established in 2008,<br />
formally documented the history and<br />
impacts of Canada’s residential school<br />
system which operated between 1831 and 1996. It is estimated that<br />
150,000 First Nations, Inuit and Métis children were forcibly separated<br />
from their families and made to attend residential schools. Thousands<br />
died at those schools or because of the horrendous abuse they<br />
experienced in the system and thousands remain missing. The Truth and<br />
Reconciliation Commission released its final report along with 94 Calls<br />
to Action in 2015 after years of gathering testimonies from survivors and<br />
witnesses. 9<br />
RECOMMENDATIONS<br />
Learn about Canada’s colonial roots and take<br />
responsibility for meeting the Calls to Action issued by<br />
the Truth and Reconciliation Commission.<br />
Engage with the local Indigenous community to<br />
identify and establish self-determined resources in<br />
Perth-Huron, such as Friendship Centres, that will<br />
provide opportunities for collaboration and learning.<br />
Page 6 A Diverse Community<br />
Photo by:<br />
Fred Gonder
Racialized Population * is Small For Province,<br />
Like Other Rural Areas<br />
According to Statistics Canada, 5.5% of the population<br />
in Perth and 2% of the population in Huron are racialized<br />
populations. While this is much smaller than the provincial<br />
number of 34.3%, these percentages are consistent with<br />
other rural regions. Compared to some other rural areas, Perth<br />
and Huron have a slightly larger population of racialized groups.<br />
The largest racialized population in Perth is South Asian, while in<br />
Huron the largest population is Black. 10<br />
of Huron is<br />
2% 6%<br />
racialized<br />
of Perth is<br />
racialized<br />
Graph 1: Racialized Populations in Perth and Huron<br />
Source: Statistics Canada, Census 2021. Visible minority section.<br />
34%<br />
*According to the Government of<br />
Canada these are “persons, other<br />
than Aboriginal peoples, who are<br />
non-Caucasian in race or nonwhite<br />
in colour.”<br />
In 2021 Census analytical and<br />
communications products, the<br />
term “visible minority” has been<br />
replaced by the terms “racialized<br />
population” or “racialized groups”,<br />
reflecting the increased use of<br />
these terms in the public sphere.<br />
of Ontario is<br />
racialized<br />
Graph 2: Ethnic Origins in Perth<br />
Source: Statistics Canada, Census 2021. Ethnic origins section.<br />
Ethnic Origin<br />
Swiss<br />
Mennonite<br />
Welsh<br />
European<br />
Caucasian (White)<br />
British Isles<br />
Polish<br />
Dutch<br />
Italian<br />
German<br />
French<br />
Scottish<br />
Irish<br />
English<br />
Canadian<br />
PERTH<br />
0% 5% 10% 15% 20% 25% 30%<br />
Racialized Population<br />
Multiple<br />
Other<br />
Japanese<br />
Korean<br />
West Asian<br />
Southeast Asian<br />
Latin American<br />
Arab<br />
Filipino<br />
Black<br />
Chinese<br />
South Asian<br />
0% 5% 10% 15% 20% 25% 30%<br />
Percent of Total Racialized Populations<br />
Huron<br />
Perth<br />
Most Residents Are of European Ancestry<br />
In the 2021 census, the top five ethnic or cultural origins in Perth-<br />
Huron were English, German, Scottish, Irish and Canadian.<br />
The following charts show the main ethnic or cultural origins<br />
identified.<br />
Page 8 A Diverse Community<br />
Race and ethnicity are not<br />
interchangeable. We are limited<br />
in the data we can access and<br />
we cannot alter terms. The data<br />
presented is based on Statistics<br />
Canada’s categories and<br />
terminology and may not reflect<br />
the way people self-identify<br />
or racialized groups identify<br />
themselves.<br />
Graph 3: Ethnic Origins in Huron<br />
Source: Statistics Canada, Census 2021. Ethnic origins section.<br />
Ethnic Origin<br />
Swiss<br />
Mennonite<br />
Welsh<br />
European<br />
Caucasian (White)<br />
British Isles<br />
Polish<br />
Dutch<br />
Italian<br />
German<br />
French<br />
Scottish<br />
Irish<br />
English<br />
Canadian<br />
Ethnicity refers to the variety of<br />
behaviours, beliefs and traditions<br />
commonly held by a group of people with<br />
shared geography, religion, customs,<br />
history and/or language. <strong>11</strong><br />
Percent of Total Population<br />
0% 5% 10% 15% 20% 25% 30% 35%<br />
Percent of Total Population<br />
Race is a socially constructed<br />
identity that groups people<br />
based on perceived shared<br />
characteristics, often physical<br />
traits. 12<br />
HURON<br />
Culture is the mix of beliefs, knowledge,<br />
traditions and norms shared by a group<br />
of people with a common geography,<br />
social context, ethnicity, language,<br />
religion and/or history. It is passed on to<br />
subsequent generations. 13
The Amish and Mennonite Population is a<br />
Distinctive Part of Our Region<br />
Perth and Huron are home to a significant Mennonite population.<br />
Since the first recorded Mennonite arrival in <strong>17</strong>86, waves of<br />
Mennonite immigrants have come to Ontario from Pennsylvania,<br />
Eastern Europe, Mexico and the Canadian Prairies.<br />
Although they all share common Anabaptist Christian roots,<br />
there are significant variations among congregations based<br />
on theological differences. Some reject all modern technology,<br />
including electricity, and can be seen driving a horse and buggy<br />
down country roads. Others use technology freely and are fully<br />
integrated into the broader community. They share beliefs in<br />
pacifism and a community-focused life. 14<br />
Many of the more traditional communities speak West Germanic<br />
languages at home, such as Low German and Pennsylvania<br />
Dutch. Notable groups include Old Order Mennonites, Russian<br />
Mennonites and Old Order Amish. As of 20<strong>11</strong>, there were 59,000<br />
self-identified Mennonites in Ontario, 20% of whom belonged to<br />
more conservative communities. 15<br />
Although we do not have data to describe the diverse<br />
Mennonite populations in Perth-Huron more precisely, their<br />
presence adds to the distinctive character of our region.<br />
Far Fewer Non-Citizens Live Here Than<br />
Elsewhere in Province<br />
The Perth-Huron population is mainly made up of Canadian<br />
citizens. The following table outlines the percentage of Canadian<br />
citizens, permanent residents and non-permanent citizens in<br />
Perth, Huron and Ontario. Non-citizens make up a much smaller<br />
percentage of the population in Perth and Huron than in Ontario.<br />
Citizenship Status for Private Households Perth Huron Ontario<br />
Canadian citizens 97% 98.3% 90%<br />
Not Canadian citizens<br />
(Permanent Residents)<br />
Non-permanent residents<br />
(work or study permit or who have claimed refugee status)<br />
Table 2: Citizenship Status for Private Households<br />
Source: Statistics Canada, Census 2021. Immigration, place of birth, and citizenship section.<br />
1.5% 0.9% 7.2%<br />
0.7% 0.4% 2.7%
Perth Has a Higher Rate of Recent Immigration<br />
According to the 2021 census, Huron is home to 4,200<br />
immigrants and Perth, 7,310 immigrants. In other words,<br />
7% of the population in Huron and 9.1% of the population<br />
in Perth was born outside Canada. While these numbers are<br />
lower than the province overall, they are consistent with other<br />
rural areas in Ontario. 16<br />
Most of the immigrants in Perth and Huron arrived here before<br />
1980, which is not true of the province. Perth outpaces Huron<br />
in terms of recent immigration, where 12.5% of the total<br />
immigrant population arrived here between 2016 and 2021,<br />
compared to only 6.5% in Huron. <strong>17</strong><br />
Across Perth, Huron and the rest of Ontario, most immigrants<br />
were between the ages of 25 and 44 when they arrived in<br />
Canada. However, Perth has seen significantly more young<br />
immigrants proportionally than Ontario as a whole. This<br />
chart displays the age distribution of immigrants.<br />
Graph 4: Recent Immigrants in Perth and Huron<br />
Source: Statistics Canada, Census 2021. Immigration section.<br />
Number of Immigrants<br />
300<br />
250<br />
200<br />
150<br />
100<br />
8.4%<br />
of the Perth-Huron<br />
population was born<br />
outside Canada<br />
49%<br />
of immigrants<br />
in Perth-Huron<br />
arrived in Canada<br />
as economic<br />
immigrants<br />
Newcomer is an inclusive term<br />
used in this report to refer to<br />
anyone who has left another<br />
country and lives in Canada.<br />
Temporary Foreign Workers<br />
are individuals who are neither<br />
Canadian citizens nor permanent<br />
residents and work in Canada in<br />
positions facing labour shortages<br />
that are unfilled by Canadians.<br />
The most common places of birth among recent immigrants differs<br />
between Perth and Huron. In Perth, 50% of recent immigrants were<br />
from Asia and 33% were from the Americas. By contrast, 47% of<br />
recent immigrants in Huron were from the Americas and 30% were<br />
from Asia. Almost 70% of all immigrants living in Huron are from<br />
Europe compared to 50% in Perth. These regions are broken down<br />
further in the chart.<br />
48.5% of immigrants in Perth-Huron arrived in Canada as<br />
economic immigrants, selected for their potential to contribute to<br />
the Canadian economy. Graph 6 displays the admission categories<br />
and applicant types for people in Perth, Huron and Ontario. 18<br />
The data in this report was collected prior to the arrival of Ukrainians<br />
who came to Canada under the Canada-Ukraine Authorization for<br />
Emergency Travel (CUAET) special measures. These measures were<br />
introduced by the Government of Canada in 2022 after the Russian<br />
invasion of Ukraine, allowing Ukrainians and their family members to<br />
live, work and study in Canada until they can safely return home. As<br />
of July <strong>2023</strong>, over 166,000 Ukrainians have come to Canada through<br />
this program. In Huron County alone, approximately 70 Ukrainians<br />
arrived between March 2022 and June <strong>2023</strong>. In Perth, 93 individuals<br />
in the CUAET immigration class have accessed government-funded<br />
settlement services. 19<br />
In July <strong>2023</strong>, the Canadian government announced a new pathway<br />
to permanent residency for people who fled Ukraine, are temporary<br />
residents, who want to stay in Canada and have one or more family<br />
members in Canada. This new permanent resident pathway will<br />
begin October 23, <strong>2023</strong>.<br />
In August 2020, there were over 500 temporary foreign<br />
workers in Perth-Huron. This number was estimated to be<br />
less than half of what is typical for our region during the<br />
peak agricultural season. *<br />
*The source for all information in this report is Employment and Social<br />
Development Canada’s (ESDC) Labour Market Impact Assessment (LMIA)<br />
System and Immigration, Refugee and Citizenship Canada’s (IRCC)<br />
Integrated Case Management System (ICMS).<br />
50<br />
0<br />
Stratford Perth Huron<br />
0-18 19-44 45 and over<br />
Settlement services are free and help newcomers settle in their<br />
community. Learn more:<br />
In Huron: Huron County Immigration Partnership ‘Get Settlement<br />
Support’<br />
https://www.huroncounty.ca/economic-development/our-services/<br />
immigration-partnership/<br />
In Perth: YMCA of Three Rivers:<br />
www.ymcathreerivers.ca/settlement-services<br />
Page 12 A Diverse Community<br />
Page 13 A Diverse Community
Graph 5: Place of Birth for Recent Immigrants<br />
Source: Statistics Canada, Census 2021. Immigration section.<br />
Graph 6: Admission Category and Applicant Type<br />
Source: Statistics Canada, Census 2021. Immigration section.<br />
Australia<br />
Syria<br />
Philippines<br />
Refugees<br />
India<br />
Place of Birth<br />
China<br />
United Kingdom<br />
United States of America<br />
Mexico<br />
Jamaica<br />
Colombia<br />
Admission Category<br />
Sponsored by family<br />
Economic immigrants<br />
Brazil<br />
0% 5% 10% 15% 20% 25%<br />
Percent of Total Recent Immigration Population<br />
Huron Perth<br />
0 50 100 150 200 250 300 350 400 450 500<br />
Number of Recent Immigrants<br />
Huron Stratford Perth<br />
Term<br />
Admission Category<br />
Applicant Type<br />
Immigrant<br />
Economic<br />
Immigrants<br />
Immigrants<br />
Sponsored by Family<br />
Refugees<br />
Definition<br />
Refers to the name of the immigration program or group of programs under which<br />
an immigrant has been granted, for the first time, the right to live in Canada<br />
permanently by immigration authorities.<br />
Refers to whether an immigrant was identified as the principal applicant, the<br />
spouse or the dependent on their application for permanent residence.<br />
Refers to a person who is, or who has been, a landed immigrant or permanent<br />
resident. Such a person has been granted the right to live in Canada permanently<br />
by immigration authorities.<br />
Includes immigrants who have been selected for their ability to contribute to<br />
Canada’s economy through meeting labour market needs, to own and manage<br />
or build a business, to make a substantial investment, to create their own<br />
employment or to meet specific provincial or territorial labour market needs.<br />
Includes immigrants who were sponsored by a Canadian citizen or permanent<br />
resident and were granted permanent resident status based on their relationship<br />
either as the spouse, partner, parent, grand-parent, child or other relative of this<br />
sponsor.<br />
Includes immigrants who were granted permanent resident status based on a<br />
well-founded fear of returning to their home country.<br />
Page 15 A Diverse Community
RECOMMENDATIONS<br />
The federal government, through IRCC, provides<br />
funding to establish an Immigration Partnership to<br />
better support newcomers and newcomer-serving<br />
organizations in Stratford, St. Marys and Perth County.<br />
Local agencies and government collect data in a<br />
manner that complies with the Ontario government’s<br />
Data Standards for the Identification and Monitoring<br />
of Systemic Racism.<br />
24% of People in Ontario Identify as<br />
Having a Disability<br />
Every five years, Statistics Canada conducts the Canadian<br />
Survey on Disability (CSD). According to the most recent survey<br />
from 20<strong>17</strong>, 24.1% of people in Ontario identify as persons with<br />
either a visible or non-visible disability. 14.7% of people aged 15<br />
to 44, 31.2% aged 45 to 74 and 53.5% aged 75 and over identify<br />
as persons with a disability. Data for the next CSD is currently<br />
being collected. 20<br />
RECOMMENDATION<br />
24%<br />
The Canadian government has introduced new temporary-topermanent<br />
residency pathways to meet its immigration targets,<br />
particularly to address labour force challenges in essential sectors<br />
such as healthcare, hospitality and trades. The new pathways will<br />
support international students and temporary foreign workers. This<br />
presents Perth and Huron Counties with an opportunity given our<br />
substantial number of temporary workers. Access to these new<br />
pathways is offered on a competitive basis to those best positioned for<br />
success. Our communities should offer services that help temporary<br />
residents qualify for these programs.<br />
Local data on disabilities was not available. We<br />
recommend local agencies and governments<br />
collaborate to ensure the availability of quality data on<br />
those living with disabilities.<br />
It is important to recognize the challenges individuals may experience when deciding<br />
to disclose information about their disability. They may be faced with private or public<br />
discrimination due to both visible and non-visible disabilities.<br />
RECOMMENDATIONS<br />
Page 16 A Diverse Community<br />
Provincial and federal governments fund programs<br />
and services such as settlement, employment,<br />
language learning, etc., for temporary residents. This<br />
will give them a better experience in the community<br />
and a better chance to transition to permanent<br />
residency.<br />
Municipal government, community members,<br />
organizations and business engage with Immigration<br />
Partnerships and other programs to support<br />
newcomers, regardless of immigration status, to<br />
create welcoming communities
Significant Gap in Data<br />
on the 2SLGBTQI+* Community<br />
There is a lot of missing data when it comes to<br />
the 2SLGBTQI+ population in Perth and Huron.<br />
Currently, there is limited data available from Statistics<br />
Canada through the last census. Out of <strong>11</strong>,782,845 people<br />
in Ontario, around 24,000 identify as transgender and<br />
roughly 15,000 as non-binary persons. However, Statistics<br />
Canada data for our region does not reference transgender<br />
or non-binary identities. Instead, data is broken down by<br />
men+ (which includes men, boys and some non-binary<br />
persons) and women+ (which includes women, girls<br />
and some non-binary persons). Similar patterns are seen<br />
for data on sexual orientation and, while it is collected,<br />
it cannot always be reported. Data must be aggregated<br />
this way because of small population sizes and to protect<br />
the confidentiality of respondents. Unfortunately it also<br />
prevents us from understanding our community.<br />
* 2SLGBTQI+ refers to the<br />
Canadian community.<br />
• 2S: Two-Spirit<br />
• L: Lesbian<br />
• G: Gay<br />
• B: Bisexual<br />
• T: Transgender<br />
• Q: Queer<br />
• I: Intersex<br />
• +: inclusive of people<br />
who identify as part of<br />
sexual and gender diverse<br />
communities who use<br />
additional terminologies<br />
RECOMMENDATION<br />
If surveys allow people to choose a gender identity<br />
other than male/female, findings should reflect where<br />
possible while protecting privacy. Recent Statistics<br />
Canada data on COVID-19 offers the option to see<br />
data on 2SLGBTQI+ respondents without reporting on<br />
particular sexual orientations or non-binary genders.<br />
This is a step in the right direction, but more granular<br />
data is required.<br />
Local agencies and governments ensure that gender<br />
diverse options for self-identification are available in<br />
surveys and other data collection tools.<br />
SMALL PERCENTAGE OF POPULATION<br />
SPEAKS LANGUAGES OTHER THAN<br />
ENGLISH<br />
Knowledge of Official Languages<br />
In Perth and Huron, over 99% of the population can speak English, French<br />
or both. This is slightly higher than the provincial numbers. Only 0.7% of the<br />
population in Perth and Huron speak neither English nor French. In all of Ontario<br />
this number is 2.4%. 21<br />
Mother Tongue<br />
In Perth, 88.5% of the population spoke one of Canada’s official languages as<br />
a first language, 0.01% spoke Indigenous languages and 10.3% spoke other<br />
languages. For Huron, 91% spoke one of the official languages, 0.01% spoke<br />
Indigenous languages and 8.3% spoke other languages. 22<br />
Language Spoken at Home<br />
Most people in Perth and Huron (95%) speak primarily English at home. Less<br />
than 1% primarily speak French at home. Of the households that speak nonofficial<br />
languages at home, most (81% in Perth, 91% in Huron) speak Indo-<br />
European languages, particularly Germanic languages. The following chart<br />
displays other language families people identified as the most spoken at home.<br />
There is a significant difference between Perth and Huron regarding Italic and<br />
Indo-Iranian languages spoken at home. The number of households speaking<br />
Italic and Indo-Iranian languages in Perth is significantly higher. 23<br />
Graph 7: Language Most Spoken at Home<br />
Source: Statistics Canada, Census 2021. Language.<br />
Language Group<br />
Tai-Kadai languages<br />
Chinese languages<br />
Sino-Tibetan languages<br />
Italic (Romance) languages<br />
Indo-Iranian languages<br />
Dravidian languages<br />
Austronesian languages<br />
Semitic languages<br />
Afro-Asiatic languages<br />
0% 2% 4% 6% 8% 10% 12%<br />
Percent of Total Population<br />
Huron<br />
Perth<br />
Page 19 A Diverse Community
Language Family Region of Origin Language<br />
Tai-Kadai<br />
Southern China, Northeast India,<br />
Southeast Asia<br />
Lao, Thai<br />
Sino-Tibetan China, India, Myanmar, Nepal Mandarin, Cantonese<br />
Italic (Romance)<br />
Indo-Iranian<br />
Dravidian<br />
Austronesian<br />
Italy, Spain, Portugal, Romania<br />
India, Iran, Afghanistan, Tajikistan, Iraq,<br />
Turkey, Pakistan, some areas of the<br />
Caucasus Mountains<br />
Southern India, Northeast Sri Lanka,<br />
Southwest Pakistan<br />
Philippines, Indonesia, Madagascar,<br />
Vietnam, Cambodia, Laos, Taiwan<br />
Italian, Portuguese, Romanian,<br />
Spanish<br />
Gujarati, Hindi, Nepali, Punjabi,<br />
Urdu, Persian<br />
Malayalam, Tamil, Telugu<br />
Ilocano, Pangasinan, Tagalog<br />
Afro-Asiatic North Africa, Southwest Asia Amharic, Arabic, Tigrigna<br />
Indo-European<br />
Europe, Asia, Northern India<br />
Balto-Slavic, Polish, Russian,<br />
Serbian, Ukrainian, Germanic<br />
(German, Pennsylvania Dutch),<br />
Dutch, Low German, Plaudietsch,<br />
Greek<br />
1<br />
2<br />
3<br />
4<br />
5<br />
Recommendation<br />
Learn about Canada’s colonial roots and take<br />
responsibility for meeting the Calls to Action issued<br />
by the Truth and Reconciliation Commission. (p.6)<br />
Engage with the local Indigenous community to<br />
identify and establish self-determined resources,<br />
such as Friendship Centres in Perth-Huron, that<br />
will among other things, provide opportunities for<br />
collaboration and learning. (p.6)<br />
The federal government, through IRCC, provides<br />
funding to establish an Immigration Partnership to<br />
better support newcomers and newcomer-serving<br />
organizations in Stratford, St. Marys and Perth<br />
County. (p.16)<br />
Provincial and federal governments fund programs<br />
and services such as settlement, employment,<br />
language learning, etc., for temporary residents. (p.16)<br />
Municipal government, community members,<br />
organizations and business engage with Immigration<br />
Partnerships and other programs to support<br />
newcomers, regardless of immigration status, to<br />
create welcoming communities. (p.16)<br />
Individual /<br />
Community<br />
Organizations<br />
Businesses<br />
Municipal<br />
Gov.<br />
Provincial<br />
/Federal<br />
Gov.<br />
RELIGIOUS DIVERSITY<br />
According to Statistics Canada, 65% of the<br />
population in Perth-Huron identifies as Christian,<br />
33% practices no religion and/or holds a<br />
secular perspective (e.g., atheism, agnosticism,<br />
humanism) and 2% practice various other<br />
religions (Buddhist, Hindu, Jewish, Muslim,<br />
Sikh), Traditional (North American Indigenous<br />
Spirituality). 24<br />
Graph 7: Religious Identity<br />
Source: Statistics Canada, Census 2021.<br />
6<br />
7<br />
8<br />
Local agencies and governments collaborate to<br />
ensure the availability of quality data on those living<br />
with disabilities. (p.<strong>17</strong>)<br />
Local agencies and government collect data in a<br />
manner that complies with the Ontario government’s<br />
Data Standards for the Identification and Monitoring<br />
of Systemic Racism (p.<strong>17</strong>)<br />
Local agencies and governments ensure that gender<br />
diverse options for self-identification are available in<br />
surveys and other data collection tools. (p.18)<br />
65% Christian 33%<br />
No religion/<br />
secular<br />
2%<br />
Other<br />
Page 21 A Diverse Community
References<br />
1 The importance of Culture in New Zealand (Minister of Art, 2009). Retrieved from<br />
https://mch.govt.nz/files/HowImportantIsCulture.pdf (December 2022)<br />
2 Meaning and Significance of Culture (Kapur, 2020). Article. Retrieved from https://www.<br />
researchgate.net/publication/344664806_Meaning_and_Significance_of_Culture (January <strong>2023</strong>)<br />
3 Diversity. Jean Augustine. (n.d.). http://jeanaugustine.ca/diversity-2/<br />
4 Importance of culture for sustainable development (Bervar, 2019). Vol <strong>17</strong>, Number 3. Retrieved<br />
from https://doi.org/10.26493/1854-6935.<strong>17</strong>.195-209 (January <strong>2023</strong>)<br />
5 https://inclusive.princeton.edu/sites/g/files/toruqf1831/files/pu-report-diversity-outcomes.pdf<br />
(Holoien, n.d.)<br />
6 Crown-Indigenous Relations and Northern Affairs Canada. (2022, August 30). Indigenous peoples<br />
and Communities. Indigenous peoples and communities.<br />
https://www.rcaanc-cirnac.gc.ca/eng/<strong>11</strong>00100013785/1529102490303<br />
7 Haudenosaunee Confederacy. (2018, April <strong>17</strong>). Languages.<br />
https://www.haudenosauneeconfederacy.com/languages/<br />
8 Environics Analytics. Community Life 2021.<br />
9 The Canadian Encyclopedia. (2020, January 15). Residential Schools in Canada (plain-language<br />
summary). The Canadian Encyclopedia.<br />
https://thecanadianencyclopedia.ca/en/article/residential-schools-in-canada-plain-language-summary<br />
10 Statistics Canada. <strong>2023</strong>. (table). Census Profile. 2021 Census of Population. Statistics Canada<br />
Catalogue no. 98-316-X2021001. Ottawa. Released March 29, <strong>2023</strong>. https://www12.statcan.gc.ca/<br />
census-recensement/2021/dp-pd/prof/index.cfm?Lang=<br />
<strong>11</strong> Canadian Race Relations Foundation Glossary of Terms<br />
12 Government of Canada: Anti-racism lexicon<br />
13 Canadian Race Relations Foundation Glossary of Terms<br />
14 Daynard, T. (2022, September 29). A brief guide to mennonites and Amish – especially old order<br />
– in Ontario. Terry Daynard’s Blog. https://tdaynard.com/2020/07/01/a-brief-guide-to-mennonites-andamish-especially-old-order-in-ontario/<br />
15 University of Waterloo. (2022, December 21). Who are the Mennonites?. Conrad Grebel University<br />
College. https://uwaterloo.ca/grebel/about-grebel/who-are-mennonites<br />
19 Statistics Canada. <strong>2023</strong>. (table). Census Profile. 2021 Census of Population. Statistics Canada<br />
Catalogue no. 98-316-X2021001. Ottawa. Released March 29, <strong>2023</strong>.<br />
https://www12.statcan.gc.ca/census-recensement/2021/dp-pd/prof/index.cfm?Lang=E<br />
20 Statistics Canada. <strong>2023</strong>. (table). Census Profile. 2021 Census of Population. Statistics Canada<br />
Catalogue no. 98-316-X2021001. Ottawa. Released March 29, <strong>2023</strong>.<br />
https://www12.statcan.gc.ca/census-recensement/2021/dp-pd/prof/index.cfm?Lang=E<br />
21 Statistics Canada. <strong>2023</strong>. (table). Census Profile. 2021 Census of Population. Statistics Canada<br />
Catalogue no. 98-316-X2021001. Ottawa. Released March 29, <strong>2023</strong>.<br />
https://www12.statcan.gc.ca/census-recensement/2021/dp-pd/prof/index.cfm?Lang=E<br />
22 Statistics Canada. <strong>2023</strong>. (table). Census Profile. 2021 Census of Population. Statistics Canada<br />
Catalogue no. 98-316-X2021001. Ottawa. Released March 29, <strong>2023</strong>.<br />
https://www12.statcan.gc.ca/census-recensement/2021/dp-pd/prof/index.cfm?Lang=E<br />
23 Statistics Canada. <strong>2023</strong>. (table). Census Profile. 2021 Census of Population. Statistics Canada<br />
Catalogue no. 98-316-X2021001. Ottawa. Released March 29, <strong>2023</strong>.<br />
https://www12.statcan.gc.ca/census-recensement/2021/dp-pd/prof/index.cfm?Lang=E<br />
24 Statistics Canada. <strong>2023</strong>. (table). Census Profile. 2021 Census of Population. Statistics Canada<br />
Catalogue no. 98-316-X2021001. Ottawa. Released March 29, <strong>2023</strong>.<br />
https://www12.statcan.gc.ca/census-recensement/2021/dp-pd/prof/index.cfm?Lang=E<br />
Additional Resources<br />
Truth and Reconciliation Commission of Canada: Calls to Action:<br />
https://ehprnh2mwo3.exactdn.com/wp-content/uploads/2021/01/Calls_to_Action_English2.pdf<br />
Stratford Public Library Indigenous Connections Hub: https://spl.bibliocommons.com/list/<br />
share/379726997_spl_shauna/2<strong>17</strong>7096829_indigenous_connections_hub%20%3Ctarget=%22_<br />
blank%22%3E<br />
16 Statistics Canada. <strong>2023</strong>. (table). Census Profile. 2021 Census of Population. Statistics Canada<br />
Catalogue no. 98-316-X2021001. Ottawa. Released March 29, <strong>2023</strong>.<br />
https://www12.statcan.gc.ca/census-recensement/2021/dp-pd/prof/index.cfm?Lang=E<br />
<strong>17</strong> Statistics Canada. <strong>2023</strong>. (table). Census Profile. 2021 Census of Population. Statistics Canada<br />
Catalogue no. 98-316-X2021001. Ottawa. Released March 29, <strong>2023</strong>.<br />
https://www12.statcan.gc.ca/census-recensement/2021/dp-pd/prof/index.cfm?Lang=E<br />
18 Statistics Canada. <strong>2023</strong>. (table). Census Profile. 2021 Census of Population. Statistics Canada<br />
Catalogue no. 98-316-X2021001. Ottawa. Released March 29, <strong>2023</strong>.<br />
https://www12.statcan.gc.ca/census-recensement/2021/dp-pd/prof/index.cfm?Lang=E<br />
Page 22 A Diverse Community<br />
About the SRPC<br />
The Social Research & Planning Council (SRPC), operated by United Way Perth-<br />
Huron, is comprised of community representatives who are dedicated to the collection,<br />
analysis and distribution of information relating to social trends and issues in Perth and<br />
Huron Counties. The SRPC approaches its work in two ways:<br />
1. Commissioning research into specific social issues.<br />
2. Developing recommendations for community improvement based on local findings<br />
and working collaboratively with community members to implement change.
WRITING<br />
Areeba Ahmad<br />
Kristin Crane<br />
Will Wellington<br />
EDITING<br />
Chad Alberico<br />
DESIGN<br />
Sonya Heyen<br />
Copyright © The Social Research & Planning<br />
Council <strong>2023</strong>. This work is copyrighted. It<br />
may be reproduced in whole or in part for<br />
educational use subject to the inclusion of an<br />
acknowledgement of the source.<br />
Icons made by SlidesToGo.


