High Availability Theoretical Basics - Schneider Electric
High Availability Theoretical Basics - Schneider Electric
High Availability Theoretical Basics - Schneider Electric

You also want an ePaper? Increase the reach of your titles
YUMPU automatically turns print PDFs into web optimized ePapers that Google loves.
Mathematics <strong>Basics</strong><br />
<strong>High</strong> <strong>Availability</strong> <strong>Theoretical</strong> <strong>Basics</strong><br />
In many situations a detected disruption fortunately does not mean the end of a<br />
device’s life. This is usually the case for the automation and control systems being<br />
discussed, which are repairable entities. As a result, the ability to predict the number<br />
of shutdowns, due to a detected disruption over a specified period of time, is useful to<br />
estimate the budget required for the replacement of inoperative parts.<br />
In addition, knowing this figure can help you maintain an adequate inventory of spare<br />
parts. Put simply, the question "Will a device work for a particular period" can only be<br />
answered as a probability; hence the concept of Reliability.<br />
According to the MIL-STD-721C standard, the definition of reliability R(t) of a given<br />
system is the probability of that system to perform its intended function under stated<br />
conditions for a stated period of time. As an example, a system featured by 0.9999<br />
reliability over a year has a 99.99% probability of functioning properly throughout an<br />
entire year.<br />
Note: The reliability is systematically indicated for a given period of time, for example<br />
one year.<br />
Referring to the system model we considered with the "bathtub curve,” one<br />
characteristic is its constant Failure Rate, during the useful life. In that portion of its<br />
lifetime, the Reliability of the considered system will follow an exponential law, given<br />
by the following formula: R(t) = e -λt , where λ stands for the Failure Rate.<br />
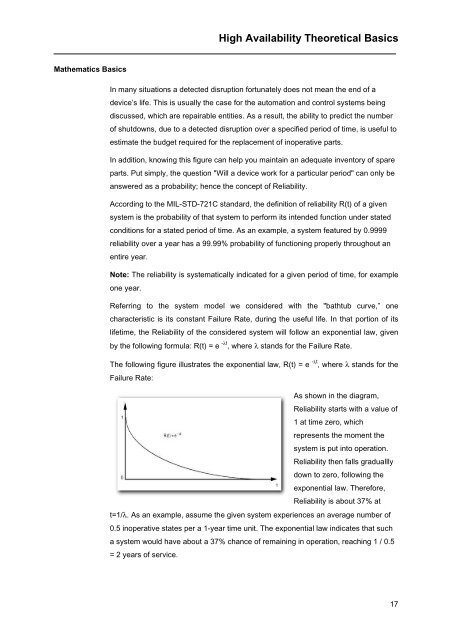
The following figure illustrates the exponential law, R(t) = e -λt , where λ stands for the<br />
Failure Rate:<br />
As shown in the diagram,<br />
Reliability starts with a value of<br />
1 at time zero, which<br />
represents the moment the<br />
system is put into operation.<br />
Reliability then falls graduallly<br />
down to zero, following the<br />
exponential law. Therefore,<br />
Reliability is about 37% at<br />
t=1/λ. As an example, assume the given system experiences an average number of<br />
0.5 inoperative states per a 1-year time unit. The exponential law indicates that such<br />
a system would have about a 37% chance of remaining in operation, reaching 1 / 0.5<br />
= 2 years of service.<br />
17