- Page 1 and 2: i2 Analyst’s Notebook 7 Creating
- Page 3 and 4: Contents About This Guide 7 Getting
- Page 5 and 6: Contents 7: Working with Theme Line
- Page 7 and 8: About This Guide Intended audience
- Page 9 and 10: Conventions Dates and times i2 Serv
- Page 11 and 12: Getting Started This chapter introd
- Page 13 and 14: Using this guide • i2 Analyst’s
- Page 15 and 16: Using the online help Getting Start
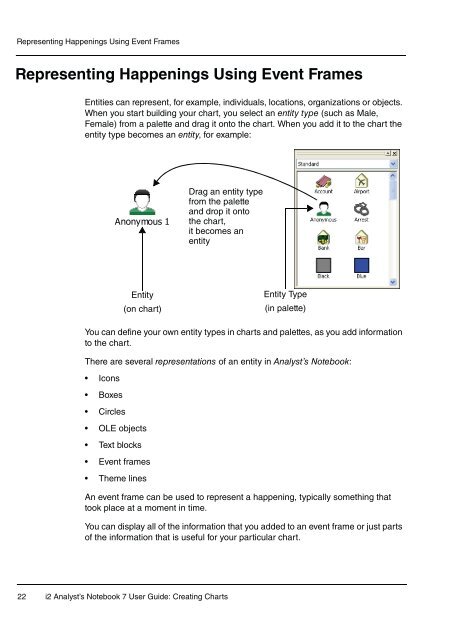
- Page 17 and 18: 1 Introducing Some Basic Features T
- Page 19 and 20: Scenario Chapter 1: Introducing Som
- Page 21: Chapter 1: Introducing Some Basic F
- Page 25 and 26: 2. Select Data\Identity to display
- Page 27 and 28: Chapter 1: Introducing Some Basic F
- Page 29 and 30: How do I change the format of the d
- Page 31 and 32: The two event frames are displayed
- Page 33 and 34: Chapter 1: Introducing Some Basic F
- Page 35 and 36: How do I create a custom property?
- Page 37 and 38: Chapter 1: Introducing Some Basic F
- Page 39 and 40: Adding further event frames Chapter
- Page 41 and 42: Chapter 1: Introducing Some Basic F
- Page 43 and 44: Chapter 1: Introducing Some Basic F
- Page 45 and 46: Chapter 1: Introducing Some Basic F
- Page 47 and 48: Meeting arranged Meeting starts Mee
- Page 49 and 50: How do I link items? Chapter 1: Int
- Page 51 and 52: Adding more links Meeting arranged
- Page 53 and 54: Chapter 1: Introducing Some Basic F
- Page 55 and 56: Chapter 1: Introducing Some Basic F
- Page 57 and 58: 4. Release the left mouse button. 5
- Page 59 and 60: Chapter 1: Introducing Some Basic F
- Page 61 and 62: Chapter 1: Introducing Some Basic F
- Page 63 and 64: Using the in-line Spelling Checker
- Page 65 and 66: Chapter 1: Introducing Some Basic F
- Page 67 and 68: How do I choose a printer? Chapter
- Page 69 and 70: : Chapter 1: Introducing Some Basic
- Page 71 and 72: . How do I print a chart? Chapter 1
- Page 73 and 74:
Handling Chart Items 2 This chapter
- Page 75 and 76:
Scenario Chapter 2: Handling Chart
- Page 77 and 78:
Chapter 2: Handling Chart Items 5.
- Page 79 and 80:
The payphone is displayed on your c
- Page 81 and 82:
How do I change the type of an enti
- Page 83 and 84:
Chapter 2: Handling Chart Items In
- Page 85 and 86:
6. Add the following grading inform
- Page 87 and 88:
Naming conventions Chapter 2: Handl
- Page 89 and 90:
Chapter 2: Handling Chart Items 3.
- Page 91 and 92:
Marc BAKER Chapter 2: Handling Char
- Page 93 and 94:
Chapter 2: Handling Chart Items 4.
- Page 95 and 96:
Multiple connection The example bel
- Page 97 and 98:
How do I change the display propert
- Page 99 and 100:
Chapter 2: Handling Chart Items 2.
- Page 101 and 102:
Chapter 2: Handling Chart Items Add
- Page 103 and 104:
Chapter 2: Handling Chart Items 3.
- Page 105 and 106:
Chapter 2: Handling Chart Items 5.
- Page 107 and 108:
How do I change the line strength o
- Page 109 and 110:
How do I add a text block to my cha
- Page 111 and 112:
7. Click OK to close the Edit Text
- Page 113 and 114:
How do I change the font properties
- Page 115 and 116:
Chapter 2: Handling Chart Items Tid
- Page 117 and 118:
Call made by FARMER Target in Opera
- Page 119 and 120:
Adding Cards and Attributes 3 This
- Page 121 and 122:
Chapter 3: Adding Cards and Attribu
- Page 123 and 124:
4. Select Cards to display the Card
- Page 125 and 126:
Chapter 3: Adding Cards and Attribu
- Page 127 and 128:
Adding more cards Chapter 3: Adding
- Page 129 and 130:
How do I copy a card? Chapter 3: Ad
- Page 131 and 132:
How do I move a card to another ite
- Page 133 and 134:
8. Click the Save toolbar button to
- Page 135 and 136:
Chapter 3: Adding Cards and Attribu
- Page 137 and 138:
Chapter 3: Adding Cards and Attribu
- Page 139 and 140:
Chapter 3: Adding Cards and Attribu
- Page 141 and 142:
Chapter 3: Adding Cards and Attribu
- Page 143 and 144:
Chapter 3: Adding Cards and Attribu
- Page 145 and 146:
t How do I change the value of an a
- Page 147 and 148:
Call made by FARMER Target in Opera
- Page 149 and 150:
4 Combining Charts and OLE Objects
- Page 151 and 152:
Chapter 4: Combining Charts and OLE
- Page 153 and 154:
Meeting arranged Leave for meeting
- Page 155 and 156:
Meeting arranged Leave for meeting
- Page 157 and 158:
How do I change the fill color of a
- Page 159 and 160:
Chapter 4: Combining Charts and OLE
- Page 161 and 162:
Embedded object Chapter 4: Combinin
- Page 163 and 164:
Chapter 4: Combining Charts and OLE
- Page 165 and 166:
Click the Save toolbar button to sa
- Page 167 and 168:
Example 4 Transcript.doc Document 1
- Page 169 and 170:
Chapter 4: Combining Charts and OLE
- Page 171 and 172:
Chapter 4: Combining Charts and OLE
- Page 173 and 174:
Chapter 4: Combining Charts and OLE
- Page 175 and 176:
The report is pasted into Microsoft
- Page 177 and 178:
5 Merging and Navigating Charts Thi
- Page 179 and 180:
Chapter 5: Merging and Navigating C
- Page 181 and 182:
Meeting arranged Leave for meeting
- Page 183 and 184:
How do I work with two charts at th
- Page 185 and 186:
Meeting arranged Leave for meeting
- Page 187 and 188:
Chapter 5: Merging and Navigating C
- Page 189 and 190:
Chapter 5: Merging and Navigating C
- Page 191 and 192:
Chapter 5: Merging and Navigating C
- Page 193 and 194:
Chapter 5: Merging and Navigating C
- Page 195 and 196:
Chapter 5: Merging and Navigating C
- Page 197 and 198:
Chapter 5: Merging and Navigating C
- Page 199 and 200:
Meeting arranged How do I remove a
- Page 201 and 202:
Introducing Theme Lines 6 This chap
- Page 203 and 204:
Chapter 6: Introducing Theme Lines
- Page 205 and 206:
How do I add a theme line to a char
- Page 207 and 208:
Chapter 6: Introducing Theme Lines
- Page 209 and 210:
7. Add the following information to
- Page 211 and 212:
Chapter 6: Introducing Theme Lines
- Page 213 and 214:
Chapter 6: Introducing Theme Lines
- Page 215 and 216:
MOONSHADOW Sam STEELE Chapter 6: In
- Page 217 and 218:
Chapter 6: Introducing Theme Lines
- Page 219 and 220:
Chapter 6: Introducing Theme Lines
- Page 221 and 222:
Chapter 6: Introducing Theme Lines
- Page 223 and 224:
Chapter 6: Introducing Theme Lines
- Page 225 and 226:
MOONSHADOW Sam STEELE Paul SHARP Yo
- Page 227 and 228:
Chapter 6: Introducing Theme Lines
- Page 229 and 230:
Chapter 6: Introducing Theme Lines
- Page 231 and 232:
Chapter 6: Introducing Theme Lines
- Page 233 and 234:
Chapter 6: Introducing Theme Lines
- Page 235 and 236:
Chapter 6: Introducing Theme Lines
- Page 237 and 238:
Chapter 6: Introducing Theme Lines
- Page 239 and 240:
Chapter 6: Introducing Theme Lines
- Page 241 and 242:
Working with Theme Lines 7 This cha
- Page 243 and 244:
Scenario Chapter 7: Working with Th
- Page 245 and 246:
MOONSHADOW Sam STEELE Paul SHARP Ch
- Page 247 and 248:
Chapter 7: Working with Theme Lines
- Page 249 and 250:
Chapter 7: Working with Theme Lines
- Page 251 and 252:
Chapter 7: Working with Theme Lines
- Page 253 and 254:
Danny KENT MOONSHADOW Sam STEELE Pa
- Page 255 and 256:
Chapter 7: Working with Theme Lines
- Page 257 and 258:
Chapter 7: Working with Theme Lines
- Page 259 and 260:
Chapter 7: Working with Theme Lines
- Page 261 and 262:
MOONSHADOW Sam STEELE Paul SHARP Da
- Page 263 and 264:
8 Ordered and Controlling Items Thi
- Page 265 and 266:
Scenario Chapter 8: Ordered and Con
- Page 267 and 268:
• Tick band Chapter 8: Ordered an
- Page 269 and 270:
Chapter 8: Ordered and Controlling
- Page 271 and 272:
Chapter 8: Ordered and Controlling
- Page 273 and 274:
How do I add a description of the t
- Page 275 and 276:
Your chart should now look similar
- Page 277 and 278:
Chapter 8: Ordered and Controlling
- Page 279 and 280:
6. Select Style\Display to display
- Page 281 and 282:
Chapter 8: Ordered and Controlling
- Page 283 and 284:
Chapter 8: Ordered and Controlling
- Page 285 and 286:
• It can have both date and time
- Page 287 and 288:
How do I order items on a chart? Ch
- Page 289 and 290:
STEELE SHARP KENT Attendee Seen in
- Page 291 and 292:
Chapter 8: Ordered and Controlling
- Page 293 and 294:
6. Select Style\Type to display the
- Page 295 and 296:
How do I display the pin on timed l
- Page 297 and 298:
STEELE SHARP KENT Attendee Seen in
- Page 299 and 300:
9 Changing the Emphasis of a Chart
- Page 301 and 302:
Chapter 9: Changing the Emphasis of
- Page 303 and 304:
STEELE SHARP KENT Attendee Seen in
- Page 305 and 306:
STEELE Telephone Telephone Call Cal
- Page 307 and 308:
Chapter 9: Changing the Emphasis of
- Page 309 and 310:
Attendee Meeting in coffee shop Cha
- Page 311 and 312:
Chapter 9: Changing the Emphasis of
- Page 313 and 314:
Chapter 9: Changing the Emphasis of
- Page 315 and 316:
Working with Time Zones 10 This cha
- Page 317 and 318:
Chapter 10: Working with Time Zones
- Page 319 and 320:
How do I find the time zone of a ch
- Page 321 and 322:
Chapter 10: Working with Time Zones
- Page 323 and 324:
MOONSHADOW Sam STEELE Paul SHARP Da
- Page 325 and 326:
Kevin DUPLEASE Chapter 10: Working
- Page 327 and 328:
956 457 0293 USA 759 837 2349 St Lu
- Page 329 and 330:
Chapter 10: Working with Time Zones
- Page 331 and 332:
A Features used in the Examples Thi
- Page 333 and 334:
Features used in the Examples Featu
- Page 335 and 336:
Features used in the Examples Featu
- Page 337 and 338:
Glossary Abstract Semantic Type A n
- Page 339 and 340:
Attribute Glossary A piece of infor
- Page 341 and 342:
Child Glossary An item that derives
- Page 343 and 344:
Custom Properties Glossary User-def
- Page 345 and 346:
Descendent Glossary An item at a lo
- Page 347 and 348:
External Data Information that has
- Page 349 and 350:
Import Manager The tool used to run
- Page 351 and 352:
Multiple Undo The ability to revers
- Page 353 and 354:
Parent Glossary Something that is t
- Page 355 and 356:
Report Glossary A textual descripti
- Page 357 and 358:
Semantics Glossary The way in which
- Page 359 and 360:
Text File Glossary Any file contain
- Page 361 and 362:
Wiring Segment Glossary The length
- Page 363 and 364:
Index A Activating hyperlinks 170 A
- Page 365 and 366:
opening windows 189 printing 65, 66
- Page 367 and 368:
F Fill color event frames 157 Findi
- Page 369 and 370:
Opening OLE objects 168, 169, 170 w
- Page 371 and 372:
T Templates empty templates 20 Stan
- Page 373:
www.i2group.com Part Number: 1310