

MOnitoring en MOdellering van het cohesieve sedimenttrans- port ...
MOnitoring en MOdellering van het cohesieve sedimenttrans- port ...
MOnitoring en MOdellering van het cohesieve sedimenttrans- port ...

You also want an ePaper? Increase the reach of your titles
YUMPU automatically turns print PDFs into web optimized ePapers that Google loves.
BEHEERSEENHEID VAN HET<br />
MATHEMATISCH MODEL VAN DE NOORDZEE<br />
SUMO GROEP<br />
<strong>MOnitoring</strong> <strong>en</strong> <strong>MOdellering</strong> <strong>van</strong> <strong>het</strong> <strong>cohesieve</strong> sedim<strong>en</strong>ttrans<strong>port</strong><br />
<strong>en</strong> evaluatie <strong>van</strong> de effect<strong>en</strong> op <strong>het</strong> mari<strong>en</strong>e ecosysteem<br />
t<strong>en</strong> gevolge <strong>van</strong> bagger- <strong>en</strong> stortoperatie (MOMO)<br />
Activiteitsrap<strong>port</strong> 1 (1 april 2006 - 30 september 2006)<br />
Michael Fettweis, Virginie Pison & Dries Van d<strong>en</strong> Eynde<br />
MOMO/3/MF/200612/NL/AR/1<br />
Voorbereid voor Afdeling Maritieme Toegang, Departem<strong>en</strong>t Mobiliteit <strong>en</strong> Op<strong>en</strong>bare Werk<strong>en</strong>, Ministerie <strong>van</strong> de<br />
Vlaamse Geme<strong>en</strong>schap, contract MOMO<br />
BMM<br />
100 Gulledelle<br />
B–1200 Brussel<br />
België
Inhoudstafel<br />
1. Inleiding 3<br />
1.1. Voorwerp <strong>van</strong> deze opdracht 3<br />
1.2. Algem<strong>en</strong>e Doelstelling<strong>en</strong> (2006-2011-2016) 3<br />
1.2.1. Verminder<strong>en</strong> <strong>van</strong> de sedim<strong>en</strong>tatie 4<br />
1.2.2. Efficiënter stort<strong>en</strong> 4<br />
1.3. Doel <strong>van</strong> <strong>het</strong> MOMO project (april 2006 - maart 2008) 4<br />
1.4. Publicaties binn<strong>en</strong> <strong>het</strong> MOMO project (april 2006 – maart 2008) 6<br />
2. Verfijning 3D hydrodynamisch model 7<br />
2.1. Inleiding 7<br />
2.2. Ontwikkeling wetting-drying 7<br />
2.3. Ontwikkeling nieuw rooster 7<br />
3. 100 jaar m<strong>en</strong>selijke invloed op de slibverdeling 11<br />
4. Conclusies 12<br />
5. Refer<strong>en</strong>ties 13<br />
App<strong>en</strong>dix 1: Fettweis, Houziaux, J.-S., Franck<strong>en</strong>, F. Van d<strong>en</strong> Eynde, D. 2006.<br />
100 years of anthropog<strong>en</strong>ic influ<strong>en</strong>ce on the cohesive sedim<strong>en</strong>t distribution<br />
in the Belgian North Sea coastal zone as determined by numerical modelling<br />
and comparison of historical and rec<strong>en</strong>t field data. 17th Int. Sedim<strong>en</strong>tological<br />
Congress, 27 August – 1 September 2006, Fukuoka (Japan).<br />
App<strong>en</strong>dix 2: Fettweis M. & Van d<strong>en</strong> Eynde, D. 2006. Dumping of dredged material<br />
in sea: towards operational use of sedim<strong>en</strong>t trans<strong>port</strong> models. International<br />
Hydrographic Confer<strong>en</strong>ce 2006, Evolutions in Hydrography, 6-9 November<br />
2006, Antwerp, Belgium<br />
App<strong>en</strong>dix 3: Fettweis, Houziaux, J.-S., Du Four, I., Baeteman, C., Wartel, S.,<br />
Mathys, M., Van Lancker, V., Franck<strong>en</strong>, F. 100 years of anthropog<strong>en</strong>ic influ<strong>en</strong>ce<br />
on the cohesive sedim<strong>en</strong>t distribution in the Belgian coastal zone.<br />
Marine Geology. (submitted).<br />
2
1. Inleiding<br />
1.1. Voorwerp <strong>van</strong> deze opdracht<br />
MOMO staat voor ‘monitoring <strong>en</strong> modellering <strong>van</strong> <strong>het</strong> <strong>cohesieve</strong> sedim<strong>en</strong>ttrans<strong>port</strong><br />
<strong>en</strong> de evaluatie <strong>van</strong> de effect<strong>en</strong> op <strong>het</strong> mari<strong>en</strong>e ecosysteem t<strong>en</strong> gevolge<br />
<strong>van</strong> bagger- <strong>en</strong> stortoperatie’. Het MOMO-project maakt deel uit <strong>van</strong> de algem<strong>en</strong>e<br />
<strong>en</strong> perman<strong>en</strong>te verplichting<strong>en</strong> <strong>van</strong> monitoring <strong>en</strong> evaluatie <strong>van</strong> de effect<strong>en</strong><br />
<strong>van</strong> alle m<strong>en</strong>selijke activiteit<strong>en</strong> op <strong>het</strong> mari<strong>en</strong>e ecosysteem waaraan België<br />
gebond<strong>en</strong> is overe<strong>en</strong>komstig <strong>het</strong> Verdrag inzake de bescherming <strong>van</strong> <strong>het</strong><br />
mari<strong>en</strong>e milieu <strong>van</strong> de noordoostelijke Atlantische Oceaan (1992, OSPAR-<br />
Verdrag). De OSPAR Commissie heeft de objectiev<strong>en</strong> <strong>van</strong> haar huidig “Joint Assessm<strong>en</strong>t<br />
and Monitoring Programme” (JAMP) gedefinieerd tot 2010 met de<br />
publicatie <strong>van</strong> e<strong>en</strong> holistisch “quality status re<strong>port</strong>” Noordzee <strong>en</strong> waarvoor de<br />
federale overheid <strong>en</strong> de gewest<strong>en</strong> technische <strong>en</strong> wet<strong>en</strong>schappelijke bijdrag<strong>en</strong><br />
moet<strong>en</strong> aflever<strong>en</strong> t<strong>en</strong> laste <strong>van</strong> hun eig<strong>en</strong> middel<strong>en</strong>.<br />
De m<strong>en</strong>selijke activiteit die hier in <strong>het</strong> bijzonder wordt beoogd, is <strong>het</strong> stort<strong>en</strong><br />
in zee <strong>van</strong> baggerspecie waarvoor OSPAR e<strong>en</strong> uitzondering heeft gemaakt op de<br />
algem<strong>en</strong>e regel “alle storting<strong>en</strong> in zee zijn verbod<strong>en</strong>” (zie OSPAR-Verdrag, Bijlage<br />
II over de voorkoming <strong>en</strong> uitschakeling <strong>van</strong> verontreiniging door storting of<br />
verbranding). Het algem<strong>en</strong>e doel <strong>van</strong> de opdracht is <strong>het</strong> bestuder<strong>en</strong> <strong>van</strong> de <strong>cohesieve</strong><br />
sedim<strong>en</strong>t<strong>en</strong> op <strong>het</strong> Belgisch Contin<strong>en</strong>taal Plat (BCP) <strong>en</strong> dit met behulp<br />
<strong>van</strong> zowel numerieke modell<strong>en</strong> als <strong>het</strong> uitvoer<strong>en</strong> <strong>van</strong> meting<strong>en</strong>. De combinatie<br />
<strong>van</strong> monitoring <strong>en</strong> modellering zal gegev<strong>en</strong>s kunn<strong>en</strong> aanlever<strong>en</strong> over de trans<strong>port</strong>process<strong>en</strong><br />
<strong>van</strong> deze fijne fractie <strong>en</strong> is daarom fundam<strong>en</strong>teel bij <strong>het</strong> beantwoord<strong>en</strong><br />
<strong>van</strong> vrag<strong>en</strong> over de sam<strong>en</strong>stelling, de oorsprong <strong>en</strong> <strong>het</strong> verblijf er<strong>van</strong><br />
op <strong>het</strong> BCP, de verandering<strong>en</strong> in de karakteristiek<strong>en</strong> <strong>van</strong> dit sedim<strong>en</strong>t t<strong>en</strong> gevolge<br />
<strong>van</strong> de bagger- <strong>en</strong> stortoperaties, de effect<strong>en</strong> <strong>van</strong> de natuurlijke variabiliteit,<br />
de impact op <strong>het</strong> mari<strong>en</strong>e ecosysteem in <strong>het</strong> bijzonder door de wijziging<br />
<strong>van</strong> habitats, de schatting <strong>van</strong> de netto input <strong>van</strong> gevaarlijke stoff<strong>en</strong> op <strong>het</strong><br />
mari<strong>en</strong>e milieu <strong>en</strong> de mogelijkhed<strong>en</strong> om deze laatste twee te beperk<strong>en</strong>.<br />
E<strong>en</strong> sam<strong>en</strong>vatting <strong>van</strong> de resultat<strong>en</strong> uit de voorbije period<strong>en</strong> (2002-2004 <strong>en</strong><br />
2004-2006) kan gevond<strong>en</strong> in <strong>het</strong> “Syntheserap<strong>port</strong> over de effect<strong>en</strong> op <strong>het</strong> mari<strong>en</strong>e<br />
milieu <strong>van</strong> baggerspeciestorting<strong>en</strong>” (Lauwaert et al., 2004; 2006) dat uitgevoerd<br />
werd conform art. 10 <strong>van</strong> <strong>het</strong> K.B. <strong>van</strong> 12 maart 2000 ter definiëring<br />
<strong>van</strong> de procedure voor machtiging <strong>van</strong> <strong>het</strong> stort<strong>en</strong> in de Noordzee <strong>van</strong> bepaalde<br />
stoff<strong>en</strong> <strong>en</strong> material<strong>en</strong>. Voor e<strong>en</strong> uitgebreide beschrijving wordt verwez<strong>en</strong> naar<br />
de halfjaarlijkse rap<strong>port</strong><strong>en</strong>.<br />
1.2. Algem<strong>en</strong>e Doelstelling<strong>en</strong> (2006-2011-2016)<br />
Het onderzoek uitgevoerd in <strong>het</strong> MOMO project kadert in de algem<strong>en</strong>e doelstelling<br />
om de baggerwerk<strong>en</strong> op <strong>het</strong> BCP <strong>en</strong> in de kusthav<strong>en</strong>s te verminder<strong>en</strong>, door<br />
<strong>en</strong>erzijds de sedim<strong>en</strong>tatie te verminder<strong>en</strong> in de baggerplaats<strong>en</strong> <strong>en</strong> anderzijds efficiënter<br />
te stort<strong>en</strong>. E<strong>en</strong> nauwe sam<strong>en</strong>werking tuss<strong>en</strong> de BMM <strong>en</strong> <strong>het</strong> WLH is<br />
3
één <strong>van</strong> de vereist<strong>en</strong> om de doelstelling te kunn<strong>en</strong> realiser<strong>en</strong>.<br />
1.2.1. Verminder<strong>en</strong> <strong>van</strong> de sedim<strong>en</strong>tatie<br />
Vermindering <strong>van</strong> de sedim<strong>en</strong>tatie zal kunn<strong>en</strong> bereikt word<strong>en</strong> door:<br />
• e<strong>en</strong> optimalisering <strong>van</strong> de vorm <strong>van</strong> de buit<strong>en</strong>muur of e<strong>en</strong> Curr<strong>en</strong>t Deflecting<br />
Wall, zodat de wateruitwisseling tuss<strong>en</strong> hav<strong>en</strong> <strong>en</strong> zee vermindert.<br />
• e<strong>en</strong> aanpassing <strong>van</strong> de vorm <strong>van</strong> de toegangsgeul (bv verbreding, zachtere<br />
helling…).<br />
1.2.2. Efficiënter stort<strong>en</strong><br />
De efficiëntie <strong>van</strong> e<strong>en</strong> stortplaats wordt bepaald door fysische (sedim<strong>en</strong>ttrans<strong>port</strong><br />
i.f.v. getij, doodtij-springtij, wind, golv<strong>en</strong>), economische <strong>en</strong> ecologische aspect<strong>en</strong>.<br />
Bij e<strong>en</strong> efficiënte stortplaats is de recirculatie <strong>van</strong> <strong>het</strong> gestorte materiaal<br />
naar de baggerplaats<strong>en</strong> zo klein mogelijk, is de afstand tuss<strong>en</strong> bagger- <strong>en</strong><br />
stortplaats minimaal <strong>en</strong> is de verstoring <strong>van</strong> <strong>het</strong> milieu verwaarloosbaar. Hieruit<br />
volgt dat er ge<strong>en</strong> stortplaats kan bestaan die onder alle omstandighed<strong>en</strong> efficiënt<br />
is. Efficiënt stort<strong>en</strong> zal kunn<strong>en</strong> betek<strong>en</strong><strong>en</strong> dat in functie <strong>van</strong> de voorspelde<br />
fysische (wind, stroming, golv<strong>en</strong>, sedim<strong>en</strong>ttrans<strong>port</strong>, recirculatie), economische<br />
(afstand, grootte baggerschip) <strong>en</strong> ecologische aspect<strong>en</strong> op korte termijn<br />
e<strong>en</strong> stortlocatie zal word<strong>en</strong> gekoz<strong>en</strong>. Om dit te bereik<strong>en</strong> is <strong>het</strong> volg<strong>en</strong>de nodig:<br />
• definiër<strong>en</strong> <strong>van</strong> e<strong>en</strong> ‘goede’ stortzones i.f.v. sedim<strong>en</strong>ttrans<strong>port</strong>, recirculatie<br />
baggerspecie, ecologie, economie, bathymetrie <strong>van</strong> de baggerplaats<strong>en</strong><br />
• operationele voorspelling <strong>van</strong> de recirculatie <strong>van</strong> <strong>het</strong> gestorte materiaal<br />
door de operationele data uit hydrodynamische <strong>en</strong> sedim<strong>en</strong>ttrans<strong>port</strong>modell<strong>en</strong>,<br />
real time meetstations, satellietbeeld<strong>en</strong>, bathymetrie <strong>van</strong> de<br />
baggerplaats<strong>en</strong> te integrer<strong>en</strong> zodat e<strong>en</strong> efficiënte stortlocatie kan bepaald<br />
word<strong>en</strong>.<br />
1.3. Doel <strong>van</strong> <strong>het</strong> MOMO project (april 2006 - maart 2008)<br />
Taak 1: Monitoring<br />
Taak 1.1: Slibconc<strong>en</strong>tratie meting<strong>en</strong>: getijcyclus <strong>en</strong> langdurig<br />
Er word<strong>en</strong> 4 meetcampagnes per jaar met de R/V Belgica voorzi<strong>en</strong> om 13uursmeting<strong>en</strong><br />
uit te voer<strong>en</strong>. De meting<strong>en</strong> vind<strong>en</strong> plaats in <strong>het</strong> kustgebied <strong>van</strong><br />
<strong>het</strong> BCP. Tijd<strong>en</strong>s de meting<strong>en</strong> zull<strong>en</strong> tijdsreeks<strong>en</strong> word<strong>en</strong> verzameld <strong>van</strong> de<br />
stroming<strong>en</strong>, de conc<strong>en</strong>tratie aan <strong>en</strong> de korrelgrootteverdeling <strong>van</strong> <strong>het</strong> susp<strong>en</strong>siemateriaal,<br />
de temperatuur <strong>en</strong> de saliniteit.<br />
E<strong>en</strong> tripode zal ingezet word<strong>en</strong> om stroming<strong>en</strong>, slibconc<strong>en</strong>tratie, korrelgrootteverdeling<br />
<strong>van</strong> <strong>het</strong> susp<strong>en</strong>siemateriaal, saliniteit <strong>en</strong> temperatuur te met<strong>en</strong><br />
gedur<strong>en</strong>de e<strong>en</strong> langere periode (>10 dag<strong>en</strong>). Langdurige meting<strong>en</strong> lat<strong>en</strong> toe om<br />
de slibconc<strong>en</strong>tratievariaties te kwantificer<strong>en</strong> die zich voordo<strong>en</strong> tijd<strong>en</strong>s e<strong>en</strong> doodtij-springtij<br />
cyclus <strong>en</strong> gedur<strong>en</strong>de ev<strong>en</strong>tuele storm<strong>en</strong>. Tijd<strong>en</strong>s de onderzoeksperiode<br />
zull<strong>en</strong> langdurige meting<strong>en</strong> word<strong>en</strong> uitgevoerd <strong>van</strong> minimum 1 maand.<br />
Hierdoor zal de gevoeligheid <strong>van</strong> de instrum<strong>en</strong>tatie bij langdurige meting<strong>en</strong><br />
kunn<strong>en</strong> word<strong>en</strong> gekwantificeerd. Dit kadert in de algem<strong>en</strong>e doelstelling om te<br />
kom<strong>en</strong> tot real time meetstations.<br />
4
Taak 1.2: Slibverdeling op de bodem<br />
Per jaar zull<strong>en</strong> e<strong>en</strong> vijftigtal bodemstal<strong>en</strong> geanalyseerd word<strong>en</strong> om de korrelgrootte,<br />
<strong>het</strong> kalkgehalte <strong>en</strong> de organische fractie te bepal<strong>en</strong>. Bij de box cores zal<br />
ook de d<strong>en</strong>siteit bepaald word<strong>en</strong>. Met deze data kan de slibverdeling in de kustzone<br />
verfijnd word<strong>en</strong> <strong>en</strong> zal onderscheid gemaakt kunn<strong>en</strong> word<strong>en</strong> tuss<strong>en</strong> ‘actief’<br />
slib (i.e. slib dat in de cyclus <strong>van</strong> afzetting <strong>en</strong> resusp<strong>en</strong>sie is betrokk<strong>en</strong>) <strong>en</strong><br />
‘inactieve’ slib (oude lag<strong>en</strong> die dagzom<strong>en</strong> <strong>en</strong> <strong>en</strong>kel eroder<strong>en</strong> tijd<strong>en</strong>s extreme situaties).<br />
E<strong>en</strong> gedetailleerde k<strong>en</strong>nis <strong>van</strong> de sam<strong>en</strong>stelling <strong>van</strong> de zeebodem is belangrijk<br />
voor e<strong>en</strong> nauwkeurige kwantificering <strong>van</strong> de erosieflux<strong>en</strong> in sedim<strong>en</strong>ttrans<strong>port</strong>modell<strong>en</strong>.<br />
Taak 1.3: Analyse <strong>en</strong> interpretatie <strong>van</strong> de meting<strong>en</strong><br />
Sinds er in <strong>het</strong> MOMO project begonn<strong>en</strong> werd met <strong>het</strong> uitvoer<strong>en</strong> <strong>van</strong> langdurige<br />
meting<strong>en</strong> met e<strong>en</strong> tripode (zomer 2003) werd<strong>en</strong> meer dan 70 dag<strong>en</strong> aan data<br />
verzameld. Sam<strong>en</strong> met de 13 uursmeting<strong>en</strong> (4-6 per jaar) <strong>en</strong> de satellietbeeld<strong>en</strong><br />
(>370) is er e<strong>en</strong> hele reeks aan data beschikbaar die nog maar deels geanalyseerd<br />
<strong>en</strong> geïnterpreteerd werd. Meting<strong>en</strong> op <strong>het</strong> BCP werd<strong>en</strong> ook uitgevoerd<br />
door <strong>het</strong> WLH (Nieuwpoort, Zeebrugge) <strong>en</strong> de KUL – Labo voor Hydraulica<br />
(Nieuwpoort). E<strong>en</strong> globale interpretatie <strong>van</strong> deze data zal word<strong>en</strong> uitgevoerd<br />
met als voornaamste doelstelling <strong>het</strong> analyser<strong>en</strong> <strong>van</strong> doodtij/springtij variaties,<br />
storminvloed<strong>en</strong>, seizo<strong>en</strong>s effect<strong>en</strong> <strong>en</strong> locale verschill<strong>en</strong> tuss<strong>en</strong> meetstations.<br />
Taak 2: Modellering<br />
Sub-taak 2.1: Verfijn<strong>en</strong> slibtrans<strong>port</strong>model<br />
Het gebruik <strong>van</strong> e<strong>en</strong> numeriek sedim<strong>en</strong>ttrans<strong>port</strong>model vereist e<strong>en</strong> regelmatige<br />
validatie <strong>van</strong> de modelresultat<strong>en</strong> met meetgegev<strong>en</strong>s <strong>en</strong> ev<strong>en</strong>tueel aanpassing<br />
<strong>van</strong> parameterwaard<strong>en</strong>. Het gevalideerde model zal gebruikt word<strong>en</strong> om de<br />
verspreiding <strong>van</strong> <strong>het</strong> gestorte slib te Nieuwpoort <strong>en</strong> Blank<strong>en</strong>berge te bestuder<strong>en</strong>.<br />
Sub-taak 2.2: Sedim<strong>en</strong>tbalans<br />
E<strong>en</strong> numeriek slibtrans<strong>port</strong>model zal word<strong>en</strong> gebruikt om de hoeveelheid slib<br />
in susp<strong>en</strong>sie op <strong>het</strong> BCP te bepal<strong>en</strong> <strong>en</strong> dit voor de verschill<strong>en</strong>de faz<strong>en</strong> <strong>van</strong> <strong>het</strong><br />
getij, gedur<strong>en</strong>de e<strong>en</strong> springtij/doodtij <strong>en</strong> voor de verschill<strong>en</strong>de seizo<strong>en</strong><strong>en</strong>. Door<br />
deze waard<strong>en</strong> te vergelijk<strong>en</strong> met de totale flux aan SPM die per jaar <strong>het</strong> BCP<br />
binn<strong>en</strong>stroomt kan de gemiddelde verblijfstijd <strong>van</strong> <strong>het</strong> slib op <strong>het</strong> BCP bepaald<br />
word<strong>en</strong>. Deze berek<strong>en</strong>ing<strong>en</strong> zull<strong>en</strong> in sam<strong>en</strong>spraak met <strong>het</strong> WLH word<strong>en</strong> uitgevoerd.<br />
De zo bekom<strong>en</strong> informatie is ook belangrijk bij <strong>het</strong> bepal<strong>en</strong> <strong>van</strong> de efficiëntie<br />
<strong>van</strong> stortplaats<strong>en</strong>.<br />
In <strong>het</strong> kader <strong>van</strong> <strong>het</strong> project Mocha (Wet<strong>en</strong>schapsbeleid) werd de herkomst<br />
<strong>van</strong> <strong>het</strong> slib op <strong>het</strong> BCP bestudeerd. De resultat<strong>en</strong> <strong>van</strong> dit onderzoek zull<strong>en</strong> gebruikt<br />
word<strong>en</strong> om de invloed <strong>van</strong> <strong>het</strong> fijnkorrelige sedim<strong>en</strong>trans<strong>port</strong> in de Westerschelde<br />
op de slibverdeling in de kustzone te bestuder<strong>en</strong>. Tot op hed<strong>en</strong> is dit<br />
niet duidelijk gekwantificeerd.<br />
Sub-taak 2.3: Alternatieve stortschema’s i.f.v. omgevingsfactor<strong>en</strong><br />
Onderzoek naar alternatieve stortschema’s (getijgebond<strong>en</strong>, <strong>en</strong>kel bij bepaalde<br />
windrichting,…) zal uitgebreid word<strong>en</strong> naar alle stortplaats<strong>en</strong>. Het doel is om<br />
<strong>het</strong> effect <strong>van</strong> <strong>het</strong> getij (meteo) op de retourstroom naar de baggerplaats<strong>en</strong> te<br />
5
epal<strong>en</strong>. Er zal onderzocht word<strong>en</strong> of er e<strong>en</strong> ‘best dumping time’ bestaat. De<br />
taak kan als volgt word<strong>en</strong> onderverdeeld:<br />
• 2D langdurige simulaties. Deze simulaties gebeur<strong>en</strong> met <strong>het</strong> 2D hydrodynamisch<br />
<strong>en</strong> sedim<strong>en</strong>ttrans<strong>port</strong>model <strong>van</strong> <strong>het</strong> BCP <strong>en</strong> kunn<strong>en</strong> toelat<strong>en</strong><br />
om ev<strong>en</strong>tuele effect<strong>en</strong> op de slibhuishouding ter hoogte <strong>van</strong> de Belgische<br />
kust t<strong>en</strong>gevolge <strong>van</strong> e<strong>en</strong> consequ<strong>en</strong>t getijgebond<strong>en</strong> stort<strong>en</strong> gedur<strong>en</strong>de<br />
e<strong>en</strong> langere periode (1 jaar) te analyser<strong>en</strong>.<br />
• 3D korte termijn simulaties. Simulaties <strong>van</strong> getijgebond<strong>en</strong> stort<strong>en</strong> met<br />
behulp <strong>van</strong> e<strong>en</strong> gedetailleerd 3D sedim<strong>en</strong>ttrans<strong>port</strong>model. De simulaties<br />
zull<strong>en</strong> uitgevoerd word<strong>en</strong> voor e<strong>en</strong> normaal <strong>en</strong> extreem getij <strong>en</strong> tijd<strong>en</strong>s<br />
verschill<strong>en</strong>de meteorologische situaties.<br />
1.4. Publicaties binn<strong>en</strong> <strong>het</strong> MOMO project (april 2006 – maart 2008)<br />
Er werd<strong>en</strong> volg<strong>en</strong>de rap<strong>port</strong><strong>en</strong> <strong>en</strong> publicaties opgesteld:<br />
Halfjaarlijkse rap<strong>port</strong><strong>en</strong><br />
Fettweis, M., Pison, V. & Van d<strong>en</strong> Eynde, D. 2006. MOMO activiteitsrap<strong>port</strong><br />
(april 2006 – september 2006). BMM-rap<strong>port</strong> MOMO/3/MF/200612/NL<br />
/AR/1, 14pp + app.<br />
Confer<strong>en</strong>ties/Workshops:<br />
Fettweis, M., Van d<strong>en</strong> Eynde, D. & Franck<strong>en</strong>, F. 2006. Susp<strong>en</strong>ded particulate<br />
matter dynamics and aggregate sizes in a coastal turbidity maximum<br />
(southern North Sea, B-Nl coastal zone). Workshop on Physical Processes in<br />
Estuaries: Observations and Model Approaches, 4 April 2006, Waterbouwkundig<br />
Laboratorium Borgerhout.<br />
Fettweis, Houziaux, J.-S., Franck<strong>en</strong>, F. & Van d<strong>en</strong> Eynde, D. 2006. 100 years of<br />
anthropog<strong>en</strong>ic influ<strong>en</strong>ce on the cohesive sedim<strong>en</strong>t distribution in the Belgian<br />
North Sea coastal zone as determined by numerical modelling and comparison<br />
of historical and rec<strong>en</strong>t field data. 17th Int. Sedim<strong>en</strong>tological Congress,<br />
27 August – 1 September 2006, Fukuoka. (zie app<strong>en</strong>dix 1)<br />
Van d<strong>en</strong> Eynde, D. & Fettweis, M. 2006. Dumping of dredged material in sea:<br />
towards operational use of sedim<strong>en</strong>t trans<strong>port</strong> models. International Hydrographic<br />
Confer<strong>en</strong>ce 2006, Evolutions in Hydrography, 6-9 November<br />
2006, Antwerp, Belgium. (zie app<strong>en</strong>dix 2)<br />
Publicaties (tijdschrift<strong>en</strong>, boek<strong>en</strong>)<br />
Fettweis, Houziaux, J.-S., Du Four, I., Baeteman, C., Wartel, S., Van Lancker,<br />
V., Franck<strong>en</strong>, F., Thiry, Y. 100 years of anthropog<strong>en</strong>ic influ<strong>en</strong>ce on the cohesive<br />
sedim<strong>en</strong>t distribution in the Belgian coastal zone. Submitted to Marine<br />
Geology (zie app<strong>en</strong>dix 3).<br />
6
2. Verfijning 3D hydrodynamisch model<br />
2.1. Inleiding<br />
Voor de berek<strong>en</strong>ing <strong>van</strong> <strong>het</strong> fijnkorrelig sedim<strong>en</strong>ttrans<strong>port</strong> in <strong>het</strong> kustgebied <strong>en</strong><br />
ter hoogte <strong>van</strong> de hav<strong>en</strong> <strong>van</strong> Zeebrugge is e<strong>en</strong> fijnmazig model nodig dat ook<br />
rek<strong>en</strong>ing kan houd<strong>en</strong> met zones die tijd<strong>en</strong>s laagwater droog kom<strong>en</strong> te ligg<strong>en</strong>.<br />
Toepassing<strong>en</strong> <strong>van</strong> <strong>het</strong> model, dat gebaseerd is op MU-BCS, zijn bijvoorbeeld <strong>het</strong><br />
onderzoek naar e<strong>en</strong> optimale storttijd of –plaats. Voor deze toepassing zijn verschill<strong>en</strong>de<br />
aanpassing<strong>en</strong> nodig.<br />
T<strong>en</strong> eerste was e<strong>en</strong> implem<strong>en</strong>tatie <strong>van</strong> e<strong>en</strong> wetting-drying schema in <strong>het</strong><br />
hydrodynamische model nodig. Verder was e<strong>en</strong> verfijning <strong>van</strong> <strong>het</strong> modelrooster<br />
nodig, om <strong>en</strong>igszins nauwkeurige berek<strong>en</strong>ing te kunn<strong>en</strong> do<strong>en</strong> <strong>van</strong> de stroming<strong>en</strong><br />
rond <strong>en</strong> in de hav<strong>en</strong> <strong>van</strong> Zeebrugge. Er werd daarom e<strong>en</strong> nieuw model<br />
geïmplem<strong>en</strong>teerd dat gekoppeld werd aan <strong>het</strong> bestaande MU-BCSFIN model.<br />
Dit laatste heeft e<strong>en</strong> maaswijdte <strong>van</strong> ongeveer 250 m × 250 m. Deze aanpassing<strong>en</strong><br />
word<strong>en</strong> hieronder kort besprok<strong>en</strong>.<br />
2.2. Ontwikkeling wetting-drying<br />
Het driedim<strong>en</strong>sionale hydrodynamische COHERENS model (Luyt<strong>en</strong> et al., 1999)<br />
werd aangepast zodat de totale diepte nooit onder e<strong>en</strong> bepaalde waarde gaat<br />
gedur<strong>en</strong>de de simulatie. Deze aanpassing laat e<strong>en</strong> nauwkeurige simulatie toe<br />
<strong>van</strong> de stroming<strong>en</strong> in ondiepe gebied<strong>en</strong> <strong>en</strong> verhindert dat e<strong>en</strong> minimum diepte<br />
moet word<strong>en</strong> opgelegd om numerieke red<strong>en</strong><strong>en</strong>.<br />
Het schema dat werd geïmplem<strong>en</strong>teerd, is gebaseerd op datg<strong>en</strong>e dat in <strong>het</strong><br />
GETM model (Burchard et al., 2002) werd toegepast. Het princiep is als volgt:<br />
indi<strong>en</strong> de waterstand e<strong>en</strong> kritische waarde onderschrijdt, word<strong>en</strong> de term<strong>en</strong> uit<br />
de mom<strong>en</strong>tumvergelijking<strong>en</strong> verm<strong>en</strong>igvuldigd met e<strong>en</strong> factor alfa, die 0 bereikt,<br />
indi<strong>en</strong> de totale diepte de minimale waarde b<strong>en</strong>adert; <strong>en</strong>kel de drukgradi<strong>en</strong>t<br />
<strong>en</strong> de bodemschuifspanning behoud<strong>en</strong> hun oorspronkelijke waarde. De kritische<br />
<strong>en</strong> minimale waarde moet<strong>en</strong> in functie <strong>van</strong> <strong>het</strong> bestudeerde gebied word<strong>en</strong><br />
vastgelegd. E<strong>en</strong> aanpassing <strong>van</strong> de berek<strong>en</strong>ing <strong>van</strong> de drukgradiënt <strong>en</strong> <strong>van</strong><br />
de evaluatie <strong>van</strong> de totale waterdiepte aan de gr<strong>en</strong>z<strong>en</strong> <strong>van</strong> twee cell<strong>en</strong> (d.i. op<br />
de plaats<strong>en</strong> waar de snelheidvector<strong>en</strong> word<strong>en</strong> berek<strong>en</strong>d) is ev<strong>en</strong>e<strong>en</strong>s nodig.<br />
Het schema is geïmplem<strong>en</strong>teerd in <strong>het</strong> COHERENS model <strong>en</strong> werd in verschill<strong>en</strong>de<br />
situaties uitgetest. Zowel de 2D toepassing als de 3D toepassing werk<strong>en</strong><br />
op <strong>het</strong> og<strong>en</strong>blik naar behor<strong>en</strong>. Het schema werd onder andere uitgetest <strong>en</strong><br />
gecontroleerd in <strong>het</strong> Schelde-estuarium tuss<strong>en</strong> Vlissing<strong>en</strong> <strong>en</strong> Antwerp<strong>en</strong>, waar<br />
zich veel “intergetijde” zones bevind<strong>en</strong>.<br />
2.3. Ontwikkeling nieuw rooster<br />
Voor de ontwikkeling <strong>van</strong> <strong>het</strong> nieuwe rooster werd<strong>en</strong> contact<strong>en</strong> gelegd met de<br />
Ministerie <strong>van</strong> de Vlaamse Geme<strong>en</strong>schap, Afdeling Waterweg<strong>en</strong> Kust (AWK).<br />
De loding<strong>en</strong> die in de loop <strong>van</strong> 2005 werd<strong>en</strong> uitgevoerd, werd<strong>en</strong> reeds gebruikt<br />
door Ministerie <strong>van</strong> de Vlaamse Geme<strong>en</strong>schap, Afdeling Waterbouwkundig Laboratorium<br />
<strong>en</strong> Hydrologisch Onderzoek (WLH), die de gegev<strong>en</strong>s gebruikt<strong>en</strong><br />
7
voor <strong>het</strong> opstell<strong>en</strong> <strong>van</strong> e<strong>en</strong> rooster voor de hav<strong>en</strong> <strong>van</strong> Zeebrugge. De implem<strong>en</strong>tatie<br />
<strong>van</strong> dit model wordt uitgebreid beschrev<strong>en</strong> in De Mulder (2006) <strong>en</strong> kon<br />
door ons word<strong>en</strong> gebruikt om <strong>het</strong> nieuwe rooster te ontwikkel<strong>en</strong>. De bathymetrie<br />
heeft e<strong>en</strong> resolutie <strong>van</strong> ongeveer 50 m × 50 m <strong>en</strong> is gebaseerd op <strong>het</strong> curvilineair<br />
rooster <strong>van</strong> <strong>het</strong> WLH, zie figuur 2.1.<br />
Uitgaande <strong>van</strong> deze bathymetrie werd e<strong>en</strong> nieuwe modelrooster opgesteld<br />
voor <strong>het</strong> COHERENS model. Het nieuwe MU-HEIST model heeft e<strong>en</strong> geografisch<br />
rooster <strong>en</strong> heeft e<strong>en</strong> resolutie <strong>van</strong> 1.667” x 2.8571”, wat ongeveer overe<strong>en</strong>komt<br />
met e<strong>en</strong> resolutie <strong>van</strong> 50 m x 50 m. Dit nieuwe model heeft dus e<strong>en</strong> resolutie<br />
die 5 maal kleiner is dan de resolutie <strong>van</strong> <strong>het</strong> MU-BCZFIN model, waarmee <strong>het</strong><br />
gekoppeld is. Het model heeft in <strong>het</strong> totaal 246 x 151 roostercell<strong>en</strong>. De tijdstap<br />
<strong>van</strong> <strong>het</strong> model is 2 second<strong>en</strong>.<br />
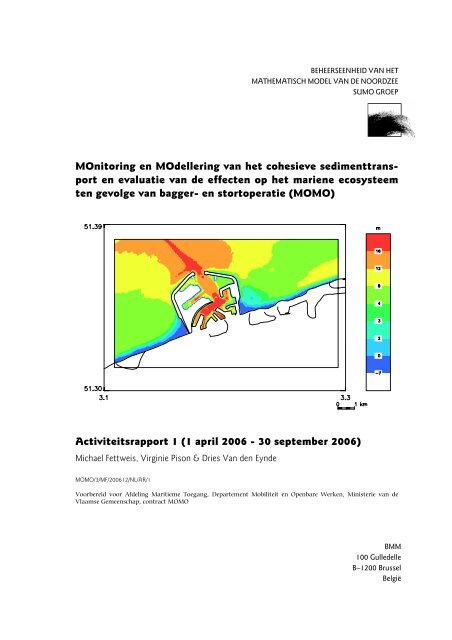
De bathymetrie wordt voorgesteld in Figuur 2.2. Er kan word<strong>en</strong> opgemerkt<br />
dat e<strong>en</strong> deel <strong>van</strong> de bathymetrie e<strong>en</strong> waterdiepte heeft <strong>van</strong> minder dan 4 m, de<br />
minimumdiepte die gebruikt wordt in modell<strong>en</strong> die niet zijn uitgerust met e<strong>en</strong><br />
“wetting-drying” module.<br />
Figuur 2.1: De curvilineaire roosterpunt<strong>en</strong> uit <strong>het</strong> WLH model ter hoogte <strong>van</strong> Zeebrugge, de waterdiepte<br />
is t.o.v <strong>het</strong> gemiddeld ze<strong>en</strong>iveau (MSL) weergegev<strong>en</strong>.<br />
8
Figuur 2.2: Bathymetrie <strong>van</strong> <strong>het</strong> nieuwe 3D hydrodynamische model ter hoogte <strong>van</strong> Zeebrugge<br />
(MU-HEIST).<br />
Enkele eerste resultat<strong>en</strong> word<strong>en</strong> voorgesteld in Figuur 2.3 tot Figuur 2.5. In<br />
de twee laatste figur<strong>en</strong> kan duidelijk word<strong>en</strong> vastgesteld dat <strong>het</strong> model in staat<br />
is <strong>het</strong> droog kom<strong>en</strong> te staan <strong>van</strong> gebied<strong>en</strong> bij laagwaterstand<strong>en</strong> goed te simuler<strong>en</strong>.<br />
Figuur 2.3: Totale waterhoogte berek<strong>en</strong>d met <strong>het</strong> MU-HEIST model <strong>en</strong> weergegev<strong>en</strong> voor 1 september<br />
2003 12h00.<br />
9
Figuur 2.4: Totale waterhoogte berek<strong>en</strong>d met <strong>het</strong> MU-HEIST model <strong>en</strong> weergegev<strong>en</strong> voor 1 september<br />
2003 22h00.<br />
Figuur 2.5: Totale waterhoogte berek<strong>en</strong>d met <strong>het</strong> MU-HEIST model <strong>en</strong> weergegev<strong>en</strong> voor 2 september<br />
2003 23h00.<br />
10
3. 100 jaar m<strong>en</strong>selijke invloed op de slibverdeling<br />
In de Belgische kustzone word<strong>en</strong> verschill<strong>en</strong>de types <strong>cohesieve</strong> sedim<strong>en</strong>t<strong>en</strong> aangetroff<strong>en</strong>,<br />
zij verschill<strong>en</strong> in ouderdom gaande <strong>van</strong> rec<strong>en</strong>te afzetting<strong>en</strong> tot tertiaire<br />
klei. De invloed <strong>van</strong> m<strong>en</strong>selijke ingrep<strong>en</strong> <strong>en</strong> natuurlijke process<strong>en</strong> op de<br />
verdeling of erosie <strong>van</strong> de <strong>cohesieve</strong> sedim<strong>en</strong>t<strong>en</strong> werd bestudeerd in <strong>het</strong> Mocha<br />
project (PODO II, Federaal Wet<strong>en</strong>schapsbeleid). Dit project kon succesvol word<strong>en</strong><br />
beëindigd dankzij data die tijd<strong>en</strong>s <strong>het</strong> MOMO project werd<strong>en</strong> verzameld.<br />
E<strong>en</strong> korte sam<strong>en</strong>vatting <strong>van</strong> de resultat<strong>en</strong> over de m<strong>en</strong>selijke ingrep<strong>en</strong> <strong>en</strong> hun<br />
effect op de slibverdeling wordt hieronder gegev<strong>en</strong>, e<strong>en</strong> uitgebreid verslag is te<br />
vind<strong>en</strong> in Fettweis et al (submitted), zie ook app<strong>en</strong>dix 2, <strong>en</strong> <strong>het</strong> Mocha eindrap<strong>port</strong><br />
(Fettweis et al., 2007).<br />
De effect<strong>en</strong> <strong>van</strong> grote werk<strong>en</strong> <strong>en</strong> natuurlijke process<strong>en</strong> op erosie/depositie<br />
<strong>van</strong> <strong>cohesieve</strong> sedim<strong>en</strong>t<strong>en</strong> werd<strong>en</strong> bestudeerd met behulp <strong>van</strong> rec<strong>en</strong>te <strong>en</strong> historische<br />
(100 jaar oud) data. De kwaliteit <strong>van</strong> de historische data is hoog <strong>en</strong> kon<br />
daarom gebruikt word<strong>en</strong> als de belangrijkste .databron om de evolutie <strong>van</strong> de<br />
verdeling <strong>van</strong> <strong>cohesieve</strong> sedim<strong>en</strong>t<strong>en</strong> tijd<strong>en</strong>s de laatste eeuw te reconstruer<strong>en</strong>. De<br />
verwerking <strong>van</strong> de historische <strong>en</strong> rec<strong>en</strong>te data werd vooral gebaseerd op ‘velddata’<br />
(beschrijving<strong>en</strong> <strong>van</strong> de consolidatie, dikte <strong>van</strong> de lag<strong>en</strong>), op morfologische<br />
evolutie <strong>en</strong> – voor wat betreft de rec<strong>en</strong>te stal<strong>en</strong> – ook op radioactieviteitsmeting<strong>en</strong><br />
<strong>en</strong> gamma d<strong>en</strong>sitometrie. Nadruk werd gelegd op <strong>het</strong> voorkom<strong>en</strong> <strong>van</strong> dikke<br />
lag<strong>en</strong> (>30 cm) <strong>van</strong> vers afgezet tot zeer zacht geconsolideerd slib. Dit soort<br />
sliblag<strong>en</strong> werd aan <strong>het</strong> begin <strong>van</strong> de twintigste eeuw vooral afgezet in e<strong>en</strong><br />
smalle band langshe<strong>en</strong> de kust tuss<strong>en</strong> ongeveer Nieuwpoort <strong>en</strong> de monding <strong>van</strong><br />
de Westerschelde. Deze afzetting<strong>en</strong> war<strong>en</strong> vooral <strong>het</strong> gevolg <strong>van</strong> natuurlijke<br />
process<strong>en</strong>. Teg<strong>en</strong>woordig zijn de afzetting<strong>en</strong> <strong>van</strong> de meeste dikke sliblag<strong>en</strong> <strong>het</strong><br />
gevolg <strong>van</strong> m<strong>en</strong>selijke ingrep<strong>en</strong> in <strong>het</strong> systeem, zoals <strong>het</strong> stort<strong>en</strong> <strong>van</strong> baggerspecie,<br />
<strong>het</strong> verdiep<strong>en</strong> <strong>van</strong> vaargeul<strong>en</strong> <strong>en</strong> de bouw <strong>en</strong> uitbreiding <strong>van</strong> (vooral) de<br />
hav<strong>en</strong> <strong>van</strong> Zeebrugge. Uit e<strong>en</strong> vergelijking tuss<strong>en</strong> de huidige <strong>en</strong> de situatie <strong>van</strong><br />
100 jaar geled<strong>en</strong> blijkt dat teg<strong>en</strong>woordig – met uitzondering <strong>van</strong> de slibafzetting<strong>en</strong><br />
op de baggerplaats<strong>en</strong> – dikke lag<strong>en</strong> <strong>van</strong> vers tot zeer zacht geconsolideerd<br />
slib verder in zee word<strong>en</strong> afgezet.<br />
Zowel de historische als de rec<strong>en</strong>te data ton<strong>en</strong> aan dat <strong>het</strong> gebied t<strong>en</strong> oost<strong>en</strong><br />
<strong>van</strong> Oost<strong>en</strong>de <strong>van</strong> nature uit gek<strong>en</strong>merkt wordt door hoge slibafzetting<strong>en</strong>.<br />
Hieronder vall<strong>en</strong> ook de tijdelijke afzetting<strong>en</strong> <strong>van</strong> <strong>en</strong>kele cm dikte (de zog<strong>en</strong>oemde<br />
‘fluffy layers’), die in <strong>het</strong> gebied dat overe<strong>en</strong>komt met <strong>het</strong> turbiditeitsmaximum<br />
word<strong>en</strong> teruggevond<strong>en</strong>. De effect<strong>en</strong> <strong>van</strong> verandering<strong>en</strong> in susp<strong>en</strong>sieconc<strong>en</strong>tratie<br />
<strong>en</strong> in de verdeling <strong>van</strong> de <strong>cohesieve</strong> sedim<strong>en</strong>t<strong>en</strong> gedur<strong>en</strong>de de<br />
laatste 100 jaar op <strong>het</strong> habitat <strong>van</strong> de b<strong>en</strong>thische invertebrat<strong>en</strong> is waarschijnlijk<br />
<strong>van</strong> minder belang <strong>en</strong> ge<strong>en</strong> sleutelelem<strong>en</strong>t om de tijdelijke verandering<strong>en</strong> in<br />
b<strong>en</strong>thische geme<strong>en</strong>schapp<strong>en</strong> te verklar<strong>en</strong> sinds <strong>het</strong> begin <strong>van</strong> de twintigste<br />
eeuw.<br />
11
4. Conclusies<br />
In dit rap<strong>port</strong> word<strong>en</strong> twee onderwerp<strong>en</strong> voorgesteld, deze zijn:<br />
(1) eerste stapp<strong>en</strong> om <strong>het</strong> numerieke hydrodynamisch model ter hoogte <strong>van</strong><br />
Zeebrugge te verfijn<strong>en</strong> door e<strong>en</strong> fijner rooster <strong>en</strong> e<strong>en</strong> ‘wetting-drying’<br />
schema te implem<strong>en</strong>ter<strong>en</strong>.<br />
(2) e<strong>en</strong> studie - die in <strong>het</strong> kader <strong>van</strong> <strong>het</strong> Mocha project werd uitgevoerd met<br />
behulp <strong>van</strong> data uit <strong>het</strong> Momo project – over de invloed <strong>van</strong> m<strong>en</strong>selijke ingrep<strong>en</strong><br />
op de slibverdeling in de kustzone.<br />
12
5. Refer<strong>en</strong>ties<br />
Burchard, H. & Bolding, K. 2002. GETM, a g<strong>en</strong>eral estuarine model. Sci<strong>en</strong>tific<br />
docum<strong>en</strong>tation, European Commission, Re<strong>port</strong> EUR 20253, 157pp.<br />
De Mulder, T., 2006. Numeriek model voor de hav<strong>en</strong> <strong>van</strong> Zeebrugge, Deelrap<strong>port</strong><br />
1: Opmaak <strong>en</strong> eerste afregeling <strong>van</strong> e<strong>en</strong> tweedim<strong>en</strong>sionaal model zonder<br />
zout. Waterbouwkundig Laboratorium Borgerhout, Model 643/7,<br />
32+14pp.<br />
Fettweis, M., Houziaux, J.-S., Du Four, I., Baeteman, C., Wartel, S., Van<br />
Lancker, V., Mathys, M., Franck<strong>en</strong>, F., Thiry, Y. 100 years of anthropog<strong>en</strong>ic<br />
influ<strong>en</strong>ce on the cohesive sedim<strong>en</strong>t distribution in the Belgian coastal zone.<br />
Submitted to Marine Geology (zie app<strong>en</strong>dix 2).<br />
Fettweis, M., Houziaux, J.-S., Du Four, I., Van Lancker, V., Vand<strong>en</strong>bergh N.,<br />
Zeelmaeker, E., Nechad, B., Franck<strong>en</strong>, F., Wartel, S., Pison, V., Van d<strong>en</strong><br />
Eynde, D., Baeteman, C., Mathys, M. 2007. Mud Origin, Characterisation<br />
and Human Activities (MOCHA). Final Sci<strong>en</strong>tific Re<strong>port</strong>. Belgian Sci<strong>en</strong>ce Policy<br />
Office.<br />
Lauwaert, B., Fettweis, M., Cooreman, K., Hillewaert, H., Moulaert, I., Raemaekers,<br />
M., Mergaert, K. & De Brauwer, D. 2004. Syntheserap<strong>port</strong> over de<br />
effect<strong>en</strong> op <strong>het</strong> mari<strong>en</strong>e milieu <strong>van</strong> baggerspeciestorting<strong>en</strong>. BMM, DVZ &<br />
AMT rap<strong>port</strong>, BL/2004/01, 52pp.<br />
Lauwaert, B., De Brauwer, D., Fettweis, M., Hillewaert, H., Host<strong>en</strong>s, K., Mergaert,<br />
K., Moulaert, I., Parm<strong>en</strong>tier, K. & Verstraet<strong>en</strong>, J. 2006. Syntheserap<strong>port</strong><br />
over de effect<strong>en</strong> op <strong>het</strong> mari<strong>en</strong>e milieu <strong>van</strong> baggerspeciestorting<strong>en</strong> (vergunningsperiode<br />
2004-'06). BMM, ILVO & AMT rap<strong>port</strong>, BL/2006/01,<br />
87pp+ app.<br />
Luyt<strong>en</strong>, P.J., J.E. Jones, R. Proctor, A. Tabor, P. Tett and K. Wild-All<strong>en</strong>, 1999.<br />
COHERENS – A Coupled Hydrodynamical-Ecological Model for Regional and<br />
Shelf Seas: User Docum<strong>en</strong>tation. MUMM Re<strong>port</strong>, Managem<strong>en</strong>t Unit of the<br />
Mathematical Models of the North Sea, 914 pp.<br />
13
BEHEERSEENHEID VAN HET<br />
MATHEMATISCH MODEL VAN DE NOORDZEE<br />
SUMO GROEP<br />
COLOPHON<br />
Dit rap<strong>port</strong> werd voorbereid door de BMM in december 2006<br />
Zijn refer<strong>en</strong>tiecode is MOMO/3/MF/200612/NL/AR/1.<br />
Status draft<br />
finale versie<br />
herzi<strong>en</strong>e versie<br />
vertrouwelijk<br />
Beschikbaar in <strong>het</strong> Engels<br />
Nederlands<br />
Frans<br />
Indi<strong>en</strong> u vrag<strong>en</strong> hebt of bijkom<strong>en</strong>de copies <strong>van</strong> dit docum<strong>en</strong>t w<strong>en</strong>st te verkrijg<strong>en</strong>,<br />
gelieve e<strong>en</strong> e-mail te z<strong>en</strong>d<strong>en</strong> naar M.Fettweis@mumm.ac.be, met vermelding<br />
<strong>van</strong> de refer<strong>en</strong>tie, of te schrijv<strong>en</strong> naar:<br />
BMM<br />
100 Gulledelle<br />
B–1200 Brussel<br />
België<br />
Tel: +32 2 773 2111<br />
Fax: +32 2 770 6972<br />
http://www.mumm.ac.be/<br />
De lettertypes gebruikt in dit zijn Gudrun Zapf-von Hesse’s Carmina Medium<br />
10/14 voor de tekst <strong>en</strong> Frederic Goudy’s Goudy Sans Medium voor titels <strong>en</strong> onderschrift<strong>en</strong>.<br />
14
APPENDIX 1<br />
17th International Sedim<strong>en</strong>tological Congress,<br />
27 August – 1 September 2006, Fukuoka (Japan)<br />
Abstract
100 years of anthropog<strong>en</strong>ic influ<strong>en</strong>ce on the cohesive sedim<strong>en</strong>t distribution in the<br />
Belgian North Sea coastal zone as determined by numerical modelling and<br />
comparison of historical and rec<strong>en</strong>t field data<br />
M. FETTWEIS 1 , J.-S. HOUZIAUX 2 , F. FRANCKEN 1 , D. VAN DEN EYNDE 1<br />
1 Royal Belgian Institute of Natural Sci<strong>en</strong>ce (RBINS), Managem<strong>en</strong>t Unit of the North Sea Mathematical Models<br />
(MUMM), Gulledelle 100, 1200 Brussels, Belgium (m.fettweis@mumm.ac.be)<br />
2 RBINS, Invertebrates Departm<strong>en</strong>t, rue Vautier 29, 1000 Brussels, Belgium<br />
In the Belgian coastal area of the southern North Sea<br />
differ<strong>en</strong>t cohesive sedim<strong>en</strong>t facies can be id<strong>en</strong>tified. These<br />
sedim<strong>en</strong>ts consist of a mixture of water, clay minerals, silt,<br />
carbonates, organic matter and sand and may be classified<br />
following their bulk d<strong>en</strong>sity (ρ) as stiff to very stiff consolidated<br />
(Paleog<strong>en</strong>e clay, ρ>1800 kg m -3 ), soft to medium<br />
consolidated (Holoc<strong>en</strong>e mud, ρ = 1500-1800 kg m -3 ),<br />
freshly deposited mud (ρ = 1300-1500 kg m -3 ) and fluid<br />
mud. Variation in bulk d<strong>en</strong>sity of the consolidated mud<br />
may point to differ<strong>en</strong>t sand cont<strong>en</strong>t but is also typical for<br />
soft<strong>en</strong>ing of the surface layer by rewetting. The freshly<br />
deposited mud may occur as thin ( 0.5 m); the Holoc<strong>en</strong>e mud as<br />
layered sedim<strong>en</strong>ts with intercalation of sandy horizons;<br />
erosion remains of the clay occur locally as pebbles.<br />
The occurr<strong>en</strong>ce of a coastal turbidity maximum<br />
makes the area one of the most turbid in the North Sea<br />
(values >500 mg/l are common) and is responsible for the<br />
continuous dredging works carried out to maintain the accessibility<br />
of the <strong>port</strong>s. The <strong>port</strong> of Zeebrugge and its connection<br />
to the op<strong>en</strong> sea (‘Pas <strong>van</strong> <strong>het</strong> Zand’) as well as the<br />
navigation channels towards the Westerschelde estuary are<br />
effici<strong>en</strong>t sinks. Dredging and dumping amounts up to 11<br />
millions tons of dry matter yearly, from which more than<br />
70% is mud. 10% of the total dredged matter is extracted<br />
in the ‘Pas <strong>van</strong> <strong>het</strong> Zand’ and 62% in the <strong>port</strong> of Zeebrugge.<br />
The dredged matter is dumped in the coastal area.<br />
Comparison betwe<strong>en</strong> the natural input of fine grained<br />
sedim<strong>en</strong>ts into the coastal zone through (mainly) the Strait<br />
of Dover and the quantities dredged and dumped at sea<br />
shows that an im<strong>port</strong>ant part of the susp<strong>en</strong>ded sedim<strong>en</strong>ts is<br />
involved in the dredging/dumping cycle [1].<br />
The construction of the <strong>port</strong> of Zeebrugge started at<br />
the <strong>en</strong>d of the ninete<strong>en</strong>th c<strong>en</strong>tury wh<strong>en</strong> the Belgian<br />
governm<strong>en</strong>t decided to build a new outer <strong>port</strong> on a<br />
location where there was little more than a beach and a<br />
row of dunes; the works were completed in 1905.<br />
Interesting is the fact that Van Mierlo [3] has predicted a<br />
fast siltation of the harbour and changes in local sand<br />
trans<strong>port</strong> patterns before its construction, which led him to<br />
fight against this project. This first <strong>port</strong> was modest in<br />
size, but since th<strong>en</strong> many adjustm<strong>en</strong>ts have be<strong>en</strong> carried<br />
out in order to deep<strong>en</strong> and wid<strong>en</strong> the access channels and<br />
finally to ext<strong>en</strong>d the outer <strong>port</strong>.<br />
We question wether the distrubtion of surficial cohesive<br />
sedim<strong>en</strong>ts has changed in the coastal area as a result of human<br />
pressure, e.g. locally increased erosion or mud deposition due<br />
to hydrodynamic changes. This is to be expected, because the<br />
changes (<strong>port</strong> ext<strong>en</strong>sion and deep navigation channels) have<br />
resulted in hydrodynamic conditions, which are not in<br />
equilibrium with the pres<strong>en</strong>t bathymetrical situation. During<br />
the pres<strong>en</strong>tation evid<strong>en</strong>ce of the influ<strong>en</strong>ce of the major<br />
<strong>en</strong>gineering works that were carried out during the last c<strong>en</strong>tury<br />
on the cohesive sedim<strong>en</strong>t distribution will be provided using a<br />
qualitative and quantitative comparison of the rec<strong>en</strong>t and the<br />
historical situation.<br />
The qualitative comparison is based on description and<br />
analysis of rec<strong>en</strong>t and historical bed samples and maps of cohesive<br />
sedim<strong>en</strong>t distribution. The historical samples (mainly<br />
from 1899-1911) originate from the collection of G. Gilson<br />
kept until nowadays in the RBINS repositories [2]. Gilson, a<br />
pioneer in marine ecology aimed at understanding how<br />
<strong>en</strong>vironm<strong>en</strong>tal parameters influ<strong>en</strong>ce the distribution of marine<br />
species in front of the Belgian coast, which led him to<br />
thoroughly sample bed sedim<strong>en</strong>ts. Sampling information was<br />
g<strong>en</strong>erally well docum<strong>en</strong>ted, which allows drawing a refer<strong>en</strong>ce<br />
situation at small scale. The rec<strong>en</strong>t bulk d<strong>en</strong>sity measurem<strong>en</strong>ts<br />
give an indication of the consolidation and thus of the<br />
geological age of the cohesive sedim<strong>en</strong>ts.<br />
The quantitative comparison betwe<strong>en</strong> historic and<br />
modern situations is carried out using numerical models<br />
(hydrodynamic and sedim<strong>en</strong>t trans<strong>port</strong>), which take into<br />
account physical changes of the <strong>en</strong>vironm<strong>en</strong>t (such as<br />
bathymetric changes associated with emerg<strong>en</strong>ce of <strong>port</strong>s and<br />
navigation channels). The models allow to simulate mud<br />
deposition and erosion today and as they were before the<br />
major anthropog<strong>en</strong>ic changes and allow to quantify<br />
differ<strong>en</strong>ces.<br />
REFERENCES<br />
[1] Fettweis, M., Van d<strong>en</strong> Eynde, D. 2003. The mud deposits and the<br />
high turbidity in the Belgian-Dutch coastal zone, Southern bight of<br />
the North Sea. Contin<strong>en</strong>tal Shelf Research, 23, 669-691.<br />
[2] <strong>van</strong> Lo<strong>en</strong>, H., Houziaux, J-S., Van Goethem, J. 2002. The<br />
collection Gilson as a refer<strong>en</strong>ce framework for the Belgian marine<br />
fauna: a feasibility study. Belgian Sci<strong>en</strong>ce Policy Final Re<strong>port</strong><br />
MN/36/94, 41pp.<br />
[3] Van Mierlo, C-J., 1897. Quelques mots sur le régime de la côte<br />
de<strong>van</strong>t Heyst. Annales de l’association des ingénieurs sortis des<br />
écoles spéciales de Gand, tome XX, 4 e livraison.
APPENDIX 2<br />
Pres<strong>en</strong>tatie op de<br />
International Hydrographic Confer<strong>en</strong>ce, Evolutions<br />
in Hydrography, 6-9 November 2006, Antwerp<br />
Abstract
Dumping of dredged matter in sea : towards operational sedim<strong>en</strong>t<br />
trans<strong>port</strong> models<br />
Michael Fettweis, Dries Van d<strong>en</strong> Eynde<br />
Managem<strong>en</strong>t Unit of the North Sea Mathematical Models (MUMM), Royal Belgian<br />
Institute of Natural Sci<strong>en</strong>ces, Gulledelle 100, 1200 Brussels, Belgium<br />
The Belgian-Dutch coastal area is shallow (depth betwe<strong>en</strong> 5-35 m) and major navigation<br />
channels connect the op<strong>en</strong> sea to the harbour of Zeebrugge and the Westerschelde. The<br />
coastal turbidity maximum, which is situated betwe<strong>en</strong> about Oost<strong>en</strong>de and the<br />
Westerschelde estuary, makes the Belgian coastal waters one of the most turbid in the<br />
North Sea (values of a few hundreds mg/l are common) and is responsible for the<br />
continuous dredging works carried out to maintain the accessibility to the harbours. The<br />
Zeebrugge harbour and its connection to the op<strong>en</strong> sea as well as the navigation channels<br />
towards the Westerschelde estuary are effici<strong>en</strong>t sinks. Dredging and dumping amounts to<br />
about 11 millions tons of dry matter yearly, from which more than 70% is silt and clay.<br />
10% of the total dredged quantity is dredged in the ‘Pas <strong>van</strong> <strong>het</strong> Zand’, the navigation<br />
channel connecting the <strong>port</strong> of Zeebrugge with the op<strong>en</strong> sea and 62% in the <strong>port</strong> of<br />
Zeebrugge. The rest is extracted from the navigation channel towards the Westerschelde<br />
(22%) and the harbour of Oost<strong>en</strong>de (5%). Comparison betwe<strong>en</strong> the natural input of SPM<br />
in the coastal zone through (mainly) the Strait of Dover and the quantities dredged and<br />
dumped at sea shows that an im<strong>port</strong>ant part of the SPM is involved in the<br />
dredging/dumping cycle (Fettweis and Van d<strong>en</strong> Eynde, 2003).<br />
Dredging works may be limited by reducing the sedim<strong>en</strong>tation in harbours<br />
(transformation of the harbour <strong>en</strong>trance or curr<strong>en</strong>t deflecting wall) or by applying a<br />
more effici<strong>en</strong>t dumping scheme.<br />
The effici<strong>en</strong>cy of a dumping place is determined by physical (sedim<strong>en</strong>t trans<strong>port</strong>,<br />
hydrodynamics), economical and ecological aspects. An effici<strong>en</strong>t dumping place has a<br />
minimal recirculation of dumped matter back to the dredging places, has a minimal<br />
distance betwe<strong>en</strong> dumping place and dredging area and has a minimal influ<strong>en</strong>ce on the<br />
<strong>en</strong>vironm<strong>en</strong>t. A dumping place, which is always effici<strong>en</strong>t, does thus not exist. Effici<strong>en</strong>t<br />
dumping could mean that the predicted physical, economical and ecological aspects of a<br />
dumping place will determine on short term where the matter is dumped. In order to<br />
achieve this following is necessary:<br />
• Definition of ‘good’ dumping places as a function of sedim<strong>en</strong>t trans<strong>port</strong>, recirculation<br />
of dumped matter, ecology, economy and bathymetry of dumping places.<br />
• Operational forecast of the recirculation of dumped matter based on operational data<br />
from hydrodynamic and sedim<strong>en</strong>t trans<strong>port</strong> models.<br />
In the pres<strong>en</strong>tation results from the MOMO project (financed by the Ministry of the<br />
Flemish Community) are pres<strong>en</strong>ted. As example differ<strong>en</strong>t dumping schemes (east, west or<br />
as a function of tide) for the dumping place Zeebrugge will be pres<strong>en</strong>ted.<br />
Refer<strong>en</strong>ces<br />
Fettweis, M., Van d<strong>en</strong> Eynde, D. 2003. The mud deposits and the high turbidity in the<br />
Belgian-Dutch coastal zone, Southern bight of the North Sea. Contin<strong>en</strong>tal Shelf Res.<br />
23, 669-691.
APPENDIX 3<br />
Fettweis, Houziaux, J.-S., Du Four, I., Baeteman, C.,<br />
Wartel, S., Mathys, M., Van Lancker, V., Franck<strong>en</strong>,<br />
F. 100 years of anthropog<strong>en</strong>ic influ<strong>en</strong>ce on the<br />
cohesive sedim<strong>en</strong>t distribution in the Belgian<br />
coastal zone.<br />
Marine Geology. (submitted).
1<br />
2<br />
3<br />
4<br />
5<br />
6<br />
7<br />
8<br />
9<br />
10<br />
11<br />
12<br />
13<br />
14<br />
15<br />
16<br />
17<br />
18<br />
19<br />
20<br />
21<br />
22<br />
23<br />
24<br />
25<br />
26<br />
27<br />
28<br />
29<br />
30<br />
31<br />
32<br />
33<br />
34<br />
100 years of anthropog<strong>en</strong>ic influ<strong>en</strong>ce on the cohesive sedim<strong>en</strong>t<br />
distribution in the Belgian coastal zone<br />
Michael Fettweis 1 (*), Jean-Sébasti<strong>en</strong> Houziaux 2 , Isabelle Du Four 3 , Cecile Baeteman 4 ,<br />
Stanislas Wartel 1 , Mieke Mathys 3 , Vera Van Lancker 3 , Frederic Franck<strong>en</strong> 1<br />
1<br />
Royal Belgian Institute of Natural Sci<strong>en</strong>ce (RBINS), Managem<strong>en</strong>t Unit of the North Sea<br />
Mathematical Models (MUMM), Gulledelle 100, 1200 Brussels, Belgium<br />
2<br />
RBINS, Invertebrates Departm<strong>en</strong>t, rue Vautier 29, 1000 Brussels, Belgium<br />
3<br />
Gh<strong>en</strong>t University, R<strong>en</strong>ard C<strong>en</strong>tre of Marine Geology (RCMG), Krijgslaan 281, S8, 9000 G<strong>en</strong>t,<br />
Belgium<br />
( )<br />
* corresponding author<br />
tel. +32 2 7732132, fax. + 32 2 7706972, email: m.fettweis@mumm.ac.be<br />
Abstract<br />
The cohesive sedim<strong>en</strong>ts, which are frequ<strong>en</strong>tly found in the Belgian nearshore zone (southern<br />
North Sea), are of differ<strong>en</strong>t age such as tertiary clays, Holoc<strong>en</strong>e muds and rec<strong>en</strong>tly deposited<br />
muds. The area is characterised by the occurr<strong>en</strong>ce of a turbidity maximum. The effect of<br />
human impact vs. natural processes on the distribution or erosion of these sedim<strong>en</strong>ts has<br />
be<strong>en</strong> investigated using historic and rec<strong>en</strong>t field data. The historic data have be<strong>en</strong> collected in<br />
the beginning of the 20th c<strong>en</strong>tury, the quality of these samples and the meta-information is<br />
very high and they have prov<strong>en</strong> to be a major refer<strong>en</strong>ce to understand the evolution of the<br />
cohesive sedim<strong>en</strong>t distribution. The processing of the historic and rec<strong>en</strong>t data on cohesive<br />
sedim<strong>en</strong>ts was mainly based on field descriptions of the samples (consolidation, thickness),<br />
on morphological evolution and on radioactive measurem<strong>en</strong>ts and gamma d<strong>en</strong>sitometry of<br />
some of the rec<strong>en</strong>t samples. During the processing the emphasis was put on the occurr<strong>en</strong>ce<br />
of thick layers (>30cm) of freshly deposited to very soft consolidated mud and of clay and<br />
mud pebbles, because these sedim<strong>en</strong>ts are witnesses of changes.<br />
Thick layers of fresh mud were deposited in the beginning of the 20 th c<strong>en</strong>tury mainly in a<br />
narrow band along the coast from about Nieuwpoort up to the mouth of the Westerschelde.<br />
These deposits were mainly the result of natural morphological changes. Today, most of the<br />
depositions of thick layers of fresh mud have be<strong>en</strong> induced by anthropog<strong>en</strong>ic operations,<br />
such as dumping, deep<strong>en</strong>ing of the navigation channels and construction and ext<strong>en</strong>sion of<br />
the <strong>port</strong> of Zeebrugge. Comparing the actual situation with the situation 100 years ago<br />
1
35<br />
36<br />
37<br />
38<br />
39<br />
40<br />
41<br />
42<br />
43<br />
44<br />
45<br />
46<br />
47<br />
48<br />
49<br />
50<br />
51<br />
52<br />
53<br />
54<br />
55<br />
56<br />
57<br />
58<br />
59<br />
60<br />
61<br />
62<br />
63<br />
64<br />
65<br />
66<br />
67<br />
68<br />
reveals that the area around Zeebrugge where fresh mud is deposited ext<strong>en</strong>ds more offshore<br />
today.<br />
The Belgian coastal waters east of Oost<strong>en</strong>de are naturally subject to high siltation rates,<br />
resulting in the deposition of tidal driv<strong>en</strong> ephemeral fluffy layers of a few cm over the area<br />
covered by the turbidity maximum. The effects of variation in SPM conc<strong>en</strong>tration and<br />
cohesive sedim<strong>en</strong>t distribution through time on the habitat of b<strong>en</strong>thic invertebrates are<br />
therefore probably minor and not a key to explain temporal changes in the composition of<br />
the b<strong>en</strong>thic communities since the early 20th c<strong>en</strong>tury.<br />
Keywords<br />
Cohesive sedim<strong>en</strong>ts, anthropog<strong>en</strong>ic impact, historic data, habitat, radioactive isotopes<br />
1. Introduction<br />
The Belgian-Dutch nearshore zone is naturally a very dynamic area as can be se<strong>en</strong> e.g. from<br />
bathymetrical differ<strong>en</strong>ces in nautical charts from 1866 on. The construction of the <strong>port</strong> of<br />
Zeebrugge in the 20 th c<strong>en</strong>tury and the dredging or deep<strong>en</strong>ing of navigation channels<br />
repres<strong>en</strong>t the most conspicuous anthropog<strong>en</strong>ic impact in the Belgian coastal zone. The<br />
construction of the <strong>port</strong> started at the <strong>en</strong>d of the ninete<strong>en</strong>th c<strong>en</strong>tury wh<strong>en</strong> the Belgian<br />
governm<strong>en</strong>t decided to build a new outer <strong>port</strong> on a location where there was little more than<br />
a beach and a row of dunes. Van Mierlo (1897) predicted already from the beginnings a fast<br />
siltation of the <strong>port</strong>. The first <strong>port</strong> was constructed betwe<strong>en</strong> 1899 and 1903 and was modest<br />
in size; the embankm<strong>en</strong>t had a l<strong>en</strong>gth of 1.7 km and a maximum distance from the coast of<br />
1.1 km (Fig. 1). The navigation channel ‘Pas <strong>van</strong> <strong>het</strong> Zand’ was dredged in 1903 through a<br />
rec<strong>en</strong>tly and naturally formed sand bank (Van Mierlo, 1897); the channel had a l<strong>en</strong>gth of<br />
2.8 km, a width of 0.3 km and a depth of 9 m below Mean Low Low Water Spring<br />
(MLLWS). Since th<strong>en</strong> many adjustm<strong>en</strong>ts were carried out in order to deep<strong>en</strong> the access<br />
channels and finally to ext<strong>en</strong>d the outer <strong>port</strong> (photos of the <strong>port</strong> of Zeebrugge:<br />
www.<strong>port</strong>ofzeebrugge.be). Significant expansion works were carried out betwe<strong>en</strong> 1980 and<br />
1985 with the construction of two longitudinal breakwaters with a l<strong>en</strong>gth of 4 km and<br />
ext<strong>en</strong>sion of about 3 km in sea. The outer <strong>port</strong> has a depth up to 16 m below MLLWS and its<br />
connection towards the op<strong>en</strong> sea (‘Pas <strong>van</strong> <strong>het</strong> Zand’) of 14 m below MLLWS; they are<br />
significantly deeper than the foreshore/offshore area, which has a water depth of less than<br />
10 m below MLLWS. Harbour ext<strong>en</strong>sions, deep<strong>en</strong>ing of navigation channels and construction<br />
of other large scale projects (e.g. windmill farms) will continue in the future and knowledge<br />
2
69<br />
70<br />
71<br />
72<br />
73<br />
74<br />
75<br />
76<br />
77<br />
78<br />
79<br />
80<br />
81<br />
82<br />
83<br />
84<br />
85<br />
86<br />
87<br />
88<br />
89<br />
90<br />
91<br />
92<br />
93<br />
94<br />
95<br />
96<br />
97<br />
98<br />
99<br />
100<br />
101<br />
102<br />
103<br />
of the impact of such activities on the fine-grained sedim<strong>en</strong>t dynamics and on the dredging<br />
and dumping activities is necessary for a sustainable developm<strong>en</strong>t of the area.<br />
Despite the natural morphological evolution occurring in the nearshore and shoreface<br />
area, the major human impact poses the question how the distribution of cohesive sedim<strong>en</strong>ts<br />
has changed due to this human impact, e.g. more int<strong>en</strong>se erosion or higher deposition rates<br />
and thus also if the sedim<strong>en</strong>ts have become more or less muddy?<br />
Alterations in the cohesive sedim<strong>en</strong>t distribution are to be expected, since the <strong>en</strong>gineering<br />
together with the dredging and dumping works have resulted in hydrodynamic conditions,<br />
which are not everywhere in equilibrium with the pres<strong>en</strong>t bathymetrical situation. Therefore<br />
the aim of this paper is to pres<strong>en</strong>t and obtain more evid<strong>en</strong>ce on the influ<strong>en</strong>ce of the major<br />
<strong>en</strong>gineering works that were carried out during the last 100 years on the cohesive sedim<strong>en</strong>t<br />
distribution. This will be achieved by comparing the pres<strong>en</strong>t and a historical distribution of<br />
cohesive sedim<strong>en</strong>ts. The comparison is based on a description and analysis of rec<strong>en</strong>t and<br />
historical (1900s) seabed samples and on the results of numerical model simulations<br />
(hydrodynamic and sedim<strong>en</strong>t trans<strong>port</strong>), which take into account the bathymetric changes<br />
associated with the ext<strong>en</strong>sion of the <strong>port</strong> and the navigation channels since the 1950ties.<br />
The paper is structured as follows. In section 2 the study area is situated. The treatm<strong>en</strong>t<br />
and interpretation of the historical and rec<strong>en</strong>t field data is described in section 3. Gamma<br />
d<strong>en</strong>sitometry and radiometric analysis methods, which have be<strong>en</strong> applied to some of the<br />
rec<strong>en</strong>t field samples, are pres<strong>en</strong>ted followed by a description of the numerical models and the<br />
GIS methods. In section 4 results of historic and rec<strong>en</strong>t sedim<strong>en</strong>t distribution are pres<strong>en</strong>ted.<br />
The comparison betwe<strong>en</strong> the rec<strong>en</strong>t and the historic situation is pres<strong>en</strong>ted and discussed in<br />
section 5. Some g<strong>en</strong>eral conclusions are offered in section 6.<br />
2. Regional settings<br />
The study area is situated in the southern North Sea, more specifically in the Belgian<br />
nearshore zone, where the depth is g<strong>en</strong>erally betwe<strong>en</strong> 0-15 m (MLLWS); except in the mouth<br />
of the Westerschelde estuary where the depth can reach more than 20 m below MLLWS (Fig.<br />
1). The mean tidal range at Zeebrugge is 4.3 m and 2.8 m at spring and neap tide,<br />
respectively and the maximum curr<strong>en</strong>t velocities are more than 1 m s-1 . The winds are<br />
dominantly from the southwest and the highest waves occur during north-western winds.<br />
2.1. Geological setting<br />
The Belgian coast is characterised by a straight and closed coastline with a g<strong>en</strong>eral SW-NE<br />
direction. The geological setting shows a striking differ<strong>en</strong>ce betwe<strong>en</strong> the western and eastern<br />
part, a differ<strong>en</strong>ce which is already expressed in the Tertiary subsoil. The western part is<br />
characterised by compact stiff clay. In the eastern part, a vertical and lateral succession of<br />
3
104<br />
105<br />
106<br />
107<br />
108<br />
109<br />
110<br />
111<br />
112<br />
113<br />
114<br />
115<br />
116<br />
117<br />
118<br />
119<br />
120<br />
121<br />
122<br />
123<br />
124<br />
125<br />
126<br />
127<br />
128<br />
129<br />
130<br />
131<br />
132<br />
133<br />
134<br />
135<br />
136<br />
137<br />
138<br />
fine sand and silt, sand and sandy clay, and clay, belonging to the Lower Eoc<strong>en</strong>e, is forming<br />
the Tertiary subsoil (Marechal, 1993). The top of these deposits is located at depth increasing<br />
in an offshore direction and reaches about -30 m TAW (national refer<strong>en</strong>ce level, 0 m TAW =<br />
0.19 m below MLLWS at Zeebrugge) in the surroundings of Zeebrugge and about –20 m to -<br />
25 m TAW in the coastal plain.<br />
Also in the Pleistoc<strong>en</strong>e, the western and eastern coastal area experi<strong>en</strong>ced a differ<strong>en</strong>t<br />
evolution. Because of the pres<strong>en</strong>ce of the IJzer, a major palaeovalley which morphology is<br />
already expressed in the top of the Tertiary subsoil (Baeteman, 2004), the western part of<br />
the plain shows a succession of fluvial and estuarine sedim<strong>en</strong>ts formed during glacial and<br />
interglacial periods, respectively (Bogemans and Baeteman, 1993), while in the eastern part,<br />
cover sands from the Last Glacial overly coastal and op<strong>en</strong> marine sedim<strong>en</strong>ts from the Last<br />
Interglacial. In the offshore area, most of the Pleistoc<strong>en</strong>e deposits have be<strong>en</strong> eroded during<br />
the Holoc<strong>en</strong>e.<br />
The situation in the offshore zone is very much in relation with the developm<strong>en</strong>t of the<br />
coastal plain during the Holoc<strong>en</strong>e. The coastal plain reaches its greatest width of about 20<br />
km in the west, while in the east it is limited to about 10 km. Also the thickness of the<br />
Holoc<strong>en</strong>e deposits (exclusive the eolian deposits) at the pres<strong>en</strong>t coastline varies in thickness<br />
betwe<strong>en</strong> ±25 m in the west and not more than 10 m in the east, except for the young<br />
Holoc<strong>en</strong>e sand-filled tidal channels. The thickness and width are defined by the morphology<br />
of the pre-transgressive surface, i.e. the top of the Pleistoc<strong>en</strong>e deposits, and the occurr<strong>en</strong>ce of<br />
palaeovalleys (Baeteman, 1999; Beets and <strong>van</strong> der Spek, 2000). The western part is<br />
characterised by a major palaeovalley which was inundated by the tidal <strong>en</strong>vironm<strong>en</strong>t as<br />
from the beginning of the Holoc<strong>en</strong>e (Baeteman, 1999; Baeteman and Declercq, 2002).<br />
Although the Holoc<strong>en</strong>e deposits have not be<strong>en</strong> mapped systematically in the eastern part, it<br />
is known from punctual data in literature and unpublished borehole data that the top of the<br />
Pleistoc<strong>en</strong>e is at an elevation of about -2 m TAW in the plain near Zeebrugge. Because of this<br />
high elevation of the Pleistoc<strong>en</strong>e deposits, the inundation started much later in the eastern<br />
part (at least in what is now the coastal plain).<br />
The Holoc<strong>en</strong>e sequ<strong>en</strong>ce in the plain consists mainly of alternations of intertidal mud and<br />
peat beds. The uppermost intercalated peat bed (also called surface peat) developed at about<br />
6300-5500 cal BP in the landward part of the plain, and ca. 4700 cal BP in the more seaward<br />
areas. It accumulated almost uninterruptedly for a period of 2-3 ka years while the coast<br />
was prograding. The surface peat is g<strong>en</strong>erally 1 to 2 m thick and occurs betwe<strong>en</strong> –1 and +1<br />
m TAW. The upper peat bed is covered by a 1 to 2 m thick deposit formed by a r<strong>en</strong>ewed<br />
expansion of the tidal <strong>en</strong>vironm<strong>en</strong>t in the late Holoc<strong>en</strong>e. The expansion was associated with<br />
4
139<br />
140<br />
141<br />
142<br />
143<br />
144<br />
145<br />
146<br />
147<br />
148<br />
149<br />
150<br />
151<br />
152<br />
153<br />
154<br />
155<br />
156<br />
157<br />
158<br />
159<br />
160<br />
161<br />
162<br />
163<br />
164<br />
165<br />
166<br />
167<br />
168<br />
169<br />
170<br />
171<br />
172<br />
173<br />
the formation of tidal channels which eroded deeply into the early and mid Holoc<strong>en</strong>e<br />
sedim<strong>en</strong>ts, and sometimes into the underlying Pleistoc<strong>en</strong>e deposits. The r<strong>en</strong>ewed expansion<br />
of the tidal flat was also associated with shoreface erosion and a landward shift of the<br />
coastline in particular in the c<strong>en</strong>tral and eastern part. Here, the Holoc<strong>en</strong>e sequ<strong>en</strong>ce at the<br />
pres<strong>en</strong>t shoreline consists of mud and peat beds (unpublished borehole data), which continue<br />
towards offshore. Holoc<strong>en</strong>e muds have oft<strong>en</strong> be<strong>en</strong> found in the eastern nearshore area, see<br />
Fig.2. This is in contrast with the west where in a wide area in the seaward region, the<br />
Holoc<strong>en</strong>e sequ<strong>en</strong>ce consists of a ca. 25 m thick sand body deposited in a coastal barrier and<br />
tidal inlet (Fig. 2). Such a situation with a transition from barrier to back-barrier deposits<br />
(peat and mud) is the typical situation. The abs<strong>en</strong>ce of barrier deposits in the c<strong>en</strong>tral and<br />
eastern part of the plain indicates severe shoreface erosion and a significant landward shift of<br />
the coastline. The timing of the onset of this erosion still remains questionable, but it appears<br />
that it coincides with the period of Roman occupation (Baeteman, 2007).<br />
2.2 Cohesive sedim<strong>en</strong>ts<br />
In the area differ<strong>en</strong>t cohesive sedim<strong>en</strong>t types occur. These sedim<strong>en</strong>ts are characterised by a<br />
particular rheological and/or consolidation state. The cohesive sedim<strong>en</strong>ts have be<strong>en</strong> classified<br />
as Eoc<strong>en</strong>e clay, consolidated mud from Holoc<strong>en</strong>e age, consolidated mud of modern age,<br />
freshly deposited mud and susp<strong>en</strong>ded particulate matter (SPM). The freshly deposited mud<br />
occurs g<strong>en</strong>erally as thin (
174<br />
175<br />
176<br />
177<br />
178<br />
179<br />
180<br />
181<br />
182<br />
183<br />
184<br />
185<br />
186<br />
187<br />
188<br />
189<br />
190<br />
191<br />
192<br />
193<br />
194<br />
195<br />
196<br />
197<br />
198<br />
199<br />
200<br />
201<br />
202<br />
203<br />
204<br />
205<br />
206<br />
207<br />
208<br />
3. Materials and Methods<br />
3.1 Mapping of historic and rec<strong>en</strong>t cohesive sedim<strong>en</strong>ts<br />
The coastal ‘mud fields’ have be<strong>en</strong> mapped by Van Mierlo (1899), Bastin (1974), Missia<strong>en</strong> et<br />
al. (2002) and Van Lancker et al. (2004). The techniques used are based on remote<br />
geophysical methods or on in situ sampling. Indications of muddy areas are also found on<br />
old hydrographical maps such as Stessels (1866). Bottom hardness as estimated by a handoperated<br />
sounding weight is sometimes indicated on these maps and could constitute a hint<br />
to areas with freshly deposited mud. Bastin (1974) made a detailed sedim<strong>en</strong>tological map<br />
using the natural radioactivity of sedim<strong>en</strong>ts, but could not differ<strong>en</strong>tiate betwe<strong>en</strong> the differ<strong>en</strong>t<br />
cohesive sedim<strong>en</strong>t facies. Missia<strong>en</strong> et al. (2002) used seismic techniques and described an area<br />
marked by poor seismic p<strong>en</strong>etration due to gas formation in shallow peat layers, which<br />
corresponds with the ext<strong>en</strong>sion of the Holoc<strong>en</strong>e mud. Geo-acoustical methods (multibeam,<br />
side scan sonar) have be<strong>en</strong> applied by Van Lancker et al. (2004). They concluded that an<br />
acoustic seabed classification can be setup especially for very fine sand, mud and very coarse<br />
(shells) sedim<strong>en</strong>ts, but holds many uncertainties because not only the grain size plays a role<br />
but also compactness, topography, the b<strong>en</strong>thic fauna, shell cover, volume scattering and<br />
instrum<strong>en</strong>t settings influ<strong>en</strong>ce the backscatter int<strong>en</strong>sity.<br />
Giv<strong>en</strong> the uncertainties of geophysical methods and the need of having a method <strong>en</strong>abling<br />
the comparison betwe<strong>en</strong> historical and rec<strong>en</strong>t sedim<strong>en</strong>t samples, we decided to mainly base<br />
the mapping and the comparison on the detailed field description of the samples. Four items<br />
related to cohesive sedim<strong>en</strong>t consolidation and/or erosion/deposition processes have a priori<br />
be<strong>en</strong> selected as they could be found in the historic and rec<strong>en</strong>t dataset: clay pebbles, hard<br />
mud, soft mud and liquid mud. This approach has the ad<strong>van</strong>tage that the historical and the<br />
rec<strong>en</strong>t data are treated similarly.<br />
The historical sedim<strong>en</strong>tary situation was drawn based on sedim<strong>en</strong>t samples collected by<br />
G. Gilson in the early 20 th c<strong>en</strong>tury. Gilson established an ambitious sampling programme<br />
aiming to understand how <strong>en</strong>vironm<strong>en</strong>tal parameters influ<strong>en</strong>ce the distribution of marine<br />
invertebrates (Gilson, 1900). He therefore included an exhaustive sedim<strong>en</strong>t sampling scheme<br />
to complem<strong>en</strong>t b<strong>en</strong>thos sampling, but these data were never analyzed as a whole. The<br />
archived inv<strong>en</strong>tory of Gilson’s sedim<strong>en</strong>t samples contains a list of 2979 sampling ev<strong>en</strong>ts<br />
betwe<strong>en</strong> 1899 and 1939, from which 90% occurred before 1911. Gilson’s cup-shaped<br />
instrum<strong>en</strong>t (‘ground collector’) was able to sample the first 10-20 cm of soft bottoms and<br />
allowed for good conservation of sedim<strong>en</strong>t layers in the sample, see Gilson (1901) and Van<br />
Lo<strong>en</strong> et al. (2002). Gilson performed only several grain-size analyses and only 700 subsamples<br />
are still preserved today. However, detailed field descriptions of the sedim<strong>en</strong>t<br />
6
209<br />
210<br />
211<br />
212<br />
213<br />
214<br />
215<br />
216<br />
217<br />
218<br />
219<br />
220<br />
221<br />
222<br />
223<br />
224<br />
225<br />
226<br />
227<br />
228<br />
229<br />
230<br />
231<br />
232<br />
233<br />
234<br />
235<br />
236<br />
237<br />
238<br />
239<br />
240<br />
241<br />
242<br />
samples were writt<strong>en</strong> onboard, which <strong>en</strong>able a standardized approach to investigate<br />
sedim<strong>en</strong>t parameters such as mud cont<strong>en</strong>t, sand grain-size, shell cont<strong>en</strong>t, gravel cont<strong>en</strong>t and<br />
others (Houziaux et al, in prep). For part of the dataset, the original field description could<br />
not be recovered, but a summarized or truncated version still exists. Where both versions are<br />
available, the summarized one is clearly less detailed, but it provides elem<strong>en</strong>tary information<br />
on mud cont<strong>en</strong>t or sand grain size. In the nearshore area 1956 sedim<strong>en</strong>t samples are<br />
considered valid in terms of sedim<strong>en</strong>tological information cont<strong>en</strong>t and geo-refer<strong>en</strong>cing<br />
accuracy.<br />
The level of detail of these sample descriptions is high and allowed a standardized<br />
aggregation of specific information to rank the samples within a mud to sand ratio scale.<br />
Other constitu<strong>en</strong>ts like gravel or shell debris were not considered because semi-quantitative<br />
information is not always available. In a first step, mud and sand cont<strong>en</strong>t were ranked<br />
accordingly to four basic categories: sand; muddy sand; sandy mud and mud. This basic<br />
mud/sand pro<strong>port</strong>ion scale was manually adjusted where possible using the additional semiquantitative<br />
indications provided by Gilson (e.g. “mud, sand, approximately same quantity”<br />
is considered as 50% mud and sand). This adjustm<strong>en</strong>t is subjective and induces a bias in the<br />
ranking wh<strong>en</strong> semi-quantitative information is not available. Processing the data this way<br />
does not give any indication on the cohesive sedim<strong>en</strong>t facies, but it provides an op<strong>port</strong>unity<br />
to map relative mud cont<strong>en</strong>t of these samples in a high resolution grid. Gilson indicated only<br />
on several occasions the vertical order of the observed layers, however, oft<strong>en</strong> additional<br />
information on mud appearance were oft<strong>en</strong> provided, such as “in pieces” or “in lumps”,<br />
“hard”, “liquid”, “grey”, “black” or “superficial”, which provides clues on its age,<br />
consolidation or origin. Occasionally, additional indications on bottom hardness as recorded<br />
with a depth sounding weight are giv<strong>en</strong> at the sampling locations; a work commonly carried<br />
out by hydrographers by th<strong>en</strong>. This information has be<strong>en</strong> tak<strong>en</strong> into account to id<strong>en</strong>tify<br />
areas with soft to medium consolidated cohesive sedim<strong>en</strong>ts and to perform comparisons<br />
with contemporary mud samples. As aforem<strong>en</strong>tioned, only positive indications are<br />
considered as data, because it is not certain that such features were always appropriately<br />
recorded and their abs<strong>en</strong>ce could thus also be due to misre<strong>port</strong>ing.<br />
3.2 Radioactivity and d<strong>en</strong>sity measurem<strong>en</strong>ts<br />
As supplem<strong>en</strong>t to the rec<strong>en</strong>t sedim<strong>en</strong>t sample descriptions radiometric and bulk d<strong>en</strong>sity<br />
measurem<strong>en</strong>ts have be<strong>en</strong> carried out on box core samples tak<strong>en</strong> in the nearshore zone. The<br />
box core samples have a maximum l<strong>en</strong>gth of 50 cm and have be<strong>en</strong> kept in PVC tubes of 8 cm<br />
diameter and closed by rubber stoppers.<br />
7
243<br />
244<br />
245<br />
246<br />
247<br />
248<br />
249<br />
250<br />
251<br />
252<br />
253<br />
254<br />
255<br />
256<br />
257<br />
258<br />
259<br />
260<br />
261<br />
262<br />
263<br />
264<br />
265<br />
266<br />
267<br />
268<br />
269<br />
270<br />
271<br />
272<br />
273<br />
274<br />
275<br />
276<br />
The radiometric measurem<strong>en</strong>ts have be<strong>en</strong> carried out with a Ge gamma detector<br />
connected to a multi-channel analyser (Canberra Series 35 Plus). Radiometric dating of<br />
210 226 137 241<br />
sedim<strong>en</strong>t cores using Pb, Ra, Cs and Am activity is a widely used technique to<br />
estimate accumulation rates and age on a time scale of 10-100 years; see e.g.<br />
The method used to infer the d<strong>en</strong>sity of the non-disturbed core sedim<strong>en</strong>ts is based on the<br />
transmission of gamma-ray photons through the core (Preiss, 1968). The source of gamma<br />
rays used is 241 Am, with a principal <strong>en</strong>ergy level at 60 KeV. Photons emitted at this <strong>en</strong>ergy<br />
level are absorbed by the sedim<strong>en</strong>t rather than scattered. It is also very s<strong>en</strong>sitive to small<br />
contrasts in d<strong>en</strong>sities, though also to chemical composition (called the soil-type effect) as can<br />
be forese<strong>en</strong> from its very low <strong>en</strong>ergy level (Caillot and Courtois, 1969; Bouron-Bougé, 1972).<br />
To reduce the soil-type effect calibration standards were made of sedim<strong>en</strong>t from the Belgian<br />
contin<strong>en</strong>tal shelf. Two types of sedim<strong>en</strong>t were used: a mud and a well-sorted medium-fine<br />
sand sample. The water of the mud was slowly evaporated while stirring the mud in order<br />
to obtain a homog<strong>en</strong>ous mass that was transferred to a 12 cm long PVC tube of the same<br />
composition as used for the cores to be analysed. The radiation passing the tube was<br />
measured over the whole l<strong>en</strong>gth in steps of 2 mm to <strong>en</strong>sure the homog<strong>en</strong>eity of the sample.<br />
After measuring the d<strong>en</strong>sity small aliquots of mud were sampled and transferred to preweighed<br />
aluminium moisture cans and the water cont<strong>en</strong>t was determined from the loss<br />
weight after evaporation at 105°C for 12 hours. The bulk d<strong>en</strong>sity, ρb, was th<strong>en</strong> calculated<br />
using 2600 kg/m 3 for sand and 2000 kg/m 3 for mud particle d<strong>en</strong>sity (B<strong>en</strong>nett and Lambert,<br />
1971).<br />
3.3 Numerical model descriptions<br />
3.3.1 Hydrodynamic model<br />
The hydrodynamics has be<strong>en</strong> modelled using the public domain 3D hydrodynamic<br />
COHERENS model (Luyt<strong>en</strong> et al., 1999). This model has be<strong>en</strong> developed betwe<strong>en</strong> 1990 and<br />
1998 in the framework of the EU-MAST projects PROFILE, NOMADS and COHERENS. The<br />
hydrodynamic model solves the mom<strong>en</strong>tum equation, the continuity equation and the<br />
equations of temperature and salinity. The equations of mom<strong>en</strong>tum and continuity are<br />
solved using the ‘mode-splitting’ technique. COHERENS disposes of differ<strong>en</strong>t turbul<strong>en</strong>ce<br />
schemes, including the two equations k-ε turbul<strong>en</strong>ce model.<br />
For this application 2D curr<strong>en</strong>ts from a 3D implem<strong>en</strong>tation of the COHERENS model to<br />
the Belgian Contin<strong>en</strong>tal Shelf (BCS) were used. The OPTOS-BCS model covers an area<br />
betwe<strong>en</strong> 51°N and 51.92° N in latitude and betwe<strong>en</strong> 2.08° E and 4.2° E in longitude. The<br />
horizontal resolution is 0.01183° (longitude) and 0.007° (latitude), corresponding both to<br />
8
277<br />
278<br />
279<br />
280<br />
281<br />
282<br />
283<br />
284<br />
285<br />
286<br />
287<br />
288<br />
289<br />
290<br />
291<br />
292<br />
293<br />
294<br />
295<br />
296<br />
297<br />
298<br />
299<br />
300<br />
301<br />
302<br />
303<br />
304<br />
305<br />
306<br />
307<br />
308<br />
309<br />
310<br />
about 800 m. Boundary conditions are water elevation and depth-averaged curr<strong>en</strong>ts, these<br />
are provided by OPTOS-NOS, which is also based on the COHERENS code, but covering the<br />
whole of the North Sea and part of the English Channel. The OPTOS-NOS model is receiving<br />
boundary conditions from the OPTOS-CSM model, which covers the North-West European<br />
Contin<strong>en</strong>tal Shelf. Four semi-diurnal tidal compon<strong>en</strong>ts (M2,<br />
S2, N2, K2) and four diurnal tidal<br />
compon<strong>en</strong>ts (O1, K1, P1, Q1) are used to force the tidal elevation on the op<strong>en</strong> boundaries of the<br />
Contin<strong>en</strong>tal Shelf Model. The curr<strong>en</strong>t velocities of OPTOS-BCS have be<strong>en</strong> validated using<br />
ADCP measurem<strong>en</strong>ts (Pison and Ozer, 2003).<br />
3.3.2 Cohesive sedim<strong>en</strong>t trans<strong>port</strong> model<br />
Trans<strong>port</strong> of mud is determined by the settling of mud particles under the influ<strong>en</strong>ce of<br />
gravity and by erosion and sedim<strong>en</strong>tation due to the local curr<strong>en</strong>t velocity. The model solves<br />
the 2D depth-averaged advection-diffusion equation for cohesive sedim<strong>en</strong>t trans<strong>port</strong> on the<br />
same grid as the OPTOS-BCS model. Erosion and deposition rates are calculated using the<br />
formulations of Ariathurai-Parth<strong>en</strong>iades (Ariathurai, 1974) and Krone (1962), respectively.<br />
The model uses the semi-Lagrangian Second Mom<strong>en</strong>t Method (Egan and Mahoney, 1972; de<br />
Kok, 1994) for the advection of the material in susp<strong>en</strong>sion. In this method all material in<br />
each grid cell is repres<strong>en</strong>ted by one rectangular mass, with sides parallel to the model grid,<br />
characterized by its zero order mom<strong>en</strong>t (total mass), first order mom<strong>en</strong>ts (mass c<strong>en</strong>tre) and<br />
second order mom<strong>en</strong>ts (ext<strong>en</strong>t). The diffusion of susp<strong>en</strong>ded matter is based on the work of<br />
Johnson et al. (1988) and calculates the <strong>en</strong>largem<strong>en</strong>t of the rectangular mass assuming a<br />
Fickian diffusion.<br />
The values used in the model for the critical shear stress for erosion τ ce have be<strong>en</strong> set to<br />
0.5 Pa for freshly deposited mud and 2.0 Pa for the soft to medium consolidated mud of the<br />
par<strong>en</strong>t bed (Fettweis and Van d<strong>en</strong> Eynde, 2003). The erosion constant for 100% mud cont<strong>en</strong>t<br />
was set to 0.12×10 -3 kg/m 2 s. In sedim<strong>en</strong>ts with lower mud cont<strong>en</strong>t, which can only occur in<br />
the par<strong>en</strong>t bed, the erosion rate is multiplied by the mud fraction. In the model a constant<br />
fall velocity of 0.001 m/s has be<strong>en</strong> used. The critical shear stress for deposition τ cd has be<strong>en</strong><br />
set to 0.5 Pa. The SPM conc<strong>en</strong>tration condition along the op<strong>en</strong> boundaries of the mud<br />
trans<strong>port</strong> model has be<strong>en</strong> constructed using in situ measurem<strong>en</strong>ts and satellite images<br />
(Fettweis et al., 2007).<br />
4. Results<br />
4.1 Actual cohesive sedim<strong>en</strong>t distribution<br />
The map in Fig. 3a is based on sedim<strong>en</strong>t samples, which have be<strong>en</strong> collected betwe<strong>en</strong> 2000<br />
and 2004, and shows the mud cont<strong>en</strong>t and the distribution of four major cohesive sedim<strong>en</strong>t<br />
9
311<br />
312<br />
313<br />
314<br />
315<br />
316<br />
317<br />
318<br />
319<br />
320<br />
321<br />
322<br />
323<br />
324<br />
325<br />
326<br />
327<br />
328<br />
329<br />
330<br />
331<br />
332<br />
333<br />
334<br />
335<br />
336<br />
337<br />
338<br />
339<br />
340<br />
341<br />
342<br />
343<br />
344<br />
facies as they emerge from the sample descriptions and the wet bulk d<strong>en</strong>sity measurem<strong>en</strong>ts;<br />
the consolidation terminology is from the Coastal Engineering Manual (2002) classification.<br />
This classification is based on bulk d<strong>en</strong>sities for pure cohesive sedim<strong>en</strong>ts and should be used<br />
therefore as an indication; small amounts of sand, which oft<strong>en</strong> occur in the mud, may<br />
increase the bulk d<strong>en</strong>sity. The four main facies are:<br />
1. Clay or mud pebbles, which occur in a sand matrix or on top of mud layers and may<br />
indicate eroded (naturally or due to deep<strong>en</strong>ing dredging works) and trans<strong>port</strong>ed tertiary<br />
clays or consolidated mud layers (Fig 4a).<br />
2. Soft to medium consolidated cohesive sedim<strong>en</strong>ts, which have a wet bulk d<strong>en</strong>sity (ρb) of<br />
1500-1800 kg/m³) and indicate Holoc<strong>en</strong>e (Fig. 4b) or possibly younger sedim<strong>en</strong>ts (Fig.<br />
4e). Based on the consolidation of the sedim<strong>en</strong>t sample it is not always possible to clearly<br />
id<strong>en</strong>tify the age of the sedim<strong>en</strong>t. Holoc<strong>en</strong>e mud has typically a layered structure with<br />
intercalation of thin sandy layers. Other types of consolidated mud, such as the lower<br />
layer in Fig. 4e, are sticky and no clear layering can be visually id<strong>en</strong>tified; it corresponds<br />
not with the Holoc<strong>en</strong>e mud and it is assumed therefore to be of more rec<strong>en</strong>t age (up to a<br />
few c<strong>en</strong>turies), it is called ‘modern mud’. In Fig. 3 no differ<strong>en</strong>ce betwe<strong>en</strong> the differ<strong>en</strong>t<br />
types of soft to medium consolidated cohesive sedim<strong>en</strong>ts is made.<br />
3. Freshly deposited to very soft consolidated cohesive sedim<strong>en</strong>ts (ρb = 1300-1500 kg/m³),<br />
which may indicate rec<strong>en</strong>t deposits of thick mud layers (Fig. 4c, 4e) or rewetted older and<br />
more consolidated mud. Freshly deposited mud occurs typically in the <strong>port</strong>s below fluid<br />
mud layers (Fig. 4f).<br />
3<br />
4. Fluid mud (ρb = ±1100-1200 kg/m ), which flows through fingers and occurs as thin<br />
surface layers of a few cm (fluffy layers, see Fig. 4d) or thick layers in navigation<br />
channels and <strong>port</strong>s (Fig. 4f).<br />
The wet bulk d<strong>en</strong>sity of box core samples from the nearshore area near Oost<strong>en</strong>de and<br />
Zeebrugge ranges betwe<strong>en</strong> 1088 kg/m 3 and 2300 kg/m 3 , two examples are shown in Fig. 5.<br />
A clear distinction can be made in ZB6 core betwe<strong>en</strong> the very soft layer (
345<br />
346<br />
347<br />
348<br />
349<br />
350<br />
351<br />
352<br />
353<br />
354<br />
355<br />
356<br />
357<br />
358<br />
359<br />
360<br />
361<br />
362<br />
363<br />
364<br />
365<br />
366<br />
367<br />
368<br />
369<br />
370<br />
371<br />
372<br />
373<br />
374<br />
375<br />
376<br />
377<br />
378<br />
379<br />
inspection of the sample. Two radiographies of Reineck core samples tak<strong>en</strong> very close to the<br />
ZB6 and ZB2 box core samples show clearly these tidalites (Fig. 6).<br />
The wet bulk d<strong>en</strong>sity of the upper 30 cm of the OE14 core (Fig. 5b), which has be<strong>en</strong><br />
sampled near the old dumping site of Oost<strong>en</strong>de (B&W-O in Fig. 1b) is very low (1200-1400<br />
kg/m³). The fact that a thick layer of freshly deposited mud can be deposited points to a<br />
protected hydrodynamic <strong>en</strong>vironm<strong>en</strong>t.<br />
4.2 Age and accumulation rates based on radio-isotopes of rec<strong>en</strong>t samples<br />
The radioactivity of 210 Pb, 226 Ra and 137 Cs has be<strong>en</strong> measured to determine the age and the<br />
accumulation rate of the sedim<strong>en</strong>ts in two box-core samples. The OE11 core has be<strong>en</strong> tak<strong>en</strong><br />
in March 2004 near the old dumping place of Oost<strong>en</strong>de and consists (B&W-O in Fig. 1b) of<br />
43 cm of freshly deposited to soft consolidated mud (similar as Fig 4c). In the ZB6 core,<br />
which has be<strong>en</strong> sampled in November 2002 northeast of the <strong>port</strong> of Zeebrugge (see Fig. 1b),<br />
two clearly differ<strong>en</strong>t parts have be<strong>en</strong> distinguished: the upper 19 cm consist of freshly<br />
deposited to soft consolidated mud (1400-1500 kg/m³) intercalated with thin more sandy<br />
layers and the lower 29 cm of medium consolidated mud (similar as Fig. 4e and 5a). On top<br />
is a thin layer of freshly deposited mud (±1300 kg/m³). The radio-isotope profiles in both<br />
box cores are irregular as can be se<strong>en</strong> from Fig. 7 and 8.<br />
The major source of 226 Ra is probably mostly associated with the discharges of phosphate<br />
gypsum at BASF-Antwerp<strong>en</strong> betwe<strong>en</strong> 1968 and 2002 and the 226 Ra discharges from 1920 on<br />
by Tess<strong>en</strong>derlo Chemie in the Grote Nete (Schelde basin), see on this subject Parida<strong>en</strong>s and<br />
Vanmarcke (2000). Pb-210, which is a daughter isotope of 226 Ra, is formed by the decay of<br />
the industrial 226 Ra and thus cannot be used for dating with excess 210 Pb models. The<br />
sedim<strong>en</strong>ts of the upper ZB6 and of whole the OE11 core can therefore be supposed to have<br />
be<strong>en</strong> deposited rec<strong>en</strong>tly (1920 – today). The study of the morphological evolution allowed to<br />
refine the age of deposition of the OE11 sedim<strong>en</strong>ts as after 1960 (see § 5.1). In the beginning<br />
of the eighties large <strong>en</strong>gineering works occurred in the area (ext<strong>en</strong>sion of the <strong>port</strong> of<br />
Zeebrugge, deep<strong>en</strong>ing of navigation channels). The (surface) mud northeast of Zeebrugge has<br />
probably be<strong>en</strong> deposited after (during) and due to these works and is thus younger than<br />
±1980. The appar<strong>en</strong>t accumulation rate of the upper 19 cm of ZB6 has be<strong>en</strong> estimated as<br />
about 0.86 cm/yr. The lower part of the ZB6 core can be clearly distinguished from the<br />
upper part. It has be<strong>en</strong> interpreted - based on field description – as modern mud; deposition<br />
has probably occurred after 1920 and significantly before 1980.<br />
• The peak in 137 Cs activity betwe<strong>en</strong> 17 cm and 33 cm below the surface in the<br />
OE11 core has be<strong>en</strong> ascribed to the peak in fall out of atmospheric nuclear bomb tests<br />
during the sixties. The appar<strong>en</strong>t accumulation rate for the upper part of the core is<br />
11
380<br />
381<br />
382<br />
383<br />
384<br />
385<br />
386<br />
387<br />
388<br />
389<br />
390<br />
391<br />
392<br />
393<br />
394<br />
395<br />
396<br />
397<br />
398<br />
399<br />
400<br />
401<br />
402<br />
403<br />
404<br />
405<br />
406<br />
407<br />
408<br />
409<br />
410<br />
411<br />
412<br />
413<br />
414<br />
th<strong>en</strong> about 0.6 cm yr -1 . The lower 137 Cs peak in this core (37-41 cm) indicates that<br />
these sedim<strong>en</strong>ts are at least younger than 1950 wh<strong>en</strong> the significant releases of 137 Cs<br />
into the <strong>en</strong>vironm<strong>en</strong>t started.<br />
It is clear that two samples cannot describe the complex accumulation pattern in whole<br />
the area. The measurem<strong>en</strong>ts have however shown differ<strong>en</strong>t isotope activity and distribution<br />
betwe<strong>en</strong> the Oost<strong>en</strong>de and Zeebrugge core, which can be explained by the rec<strong>en</strong>t<br />
morphological evolutions and anthropog<strong>en</strong>ic influ<strong>en</strong>ces at both sites and the age of the<br />
layers. The higher influ<strong>en</strong>ce of the Westerschelde at Zeebrugge and thus a partially differ<strong>en</strong>t<br />
origin of the mud could perhaps also explain the differ<strong>en</strong>ces betwe<strong>en</strong> the samples. The<br />
influ<strong>en</strong>ce of the Westerschelde on the SPM conc<strong>en</strong>tration is for example visible in the two<br />
statistically differ<strong>en</strong>t high turbidity zones in the nearshore area (i.c. Oost<strong>en</strong>de and<br />
Zeebrugge), as is explained by Van d<strong>en</strong> Eynde et al. (2006).<br />
4.3 Historical cohesive sedim<strong>en</strong>t distribution<br />
Despite initial doubts on the accuracy of the method used to reconstruct historical mud<br />
cont<strong>en</strong>t, the developed approach provides a coher<strong>en</strong>t historic map of mud cont<strong>en</strong>t along the<br />
Belgian coast and the Westerschelde estuary (Fig. 3b). It was not possible to unambiguously<br />
link the descriptions of Gilson’s samples to one of the four mud facies used in § 4.1, because<br />
only positive indications are considered as “data”. A morphological analysis has therefore<br />
be<strong>en</strong> carried out comparing the bathymetrical maps of Stessels (1866) and Urbain (1909) in<br />
order to link the occurr<strong>en</strong>ce of cohesive sedim<strong>en</strong>ts with an increase (erosion) or a decrease<br />
(accumulation) in bathymetry. If Gilson’s sample is situated in an area where the depth has<br />
decreased, th<strong>en</strong> the mud has be<strong>en</strong> deposited rec<strong>en</strong>tly (maximum 35 years before sampling). If<br />
the sample is situated in an eroded or stable area th<strong>en</strong> the surface mud is most probably old<br />
(Holoc<strong>en</strong>e of modern). Fresh mud may however occur in all areas (usually thin surface<br />
layers) through tidal and spring-neap tidal driv<strong>en</strong> deposition such as described in the<br />
metadata.<br />
Areas where an accumulation of sedim<strong>en</strong>t is observed are found in a parallel band of 5<br />
km width along the coast line (Fig. 9). The highest accumulation (±3 m) occurs betwe<strong>en</strong><br />
Oost<strong>en</strong>de and Zeebrugge, an area which corresponds with high mud cont<strong>en</strong>ts at the <strong>en</strong>d of<br />
the 19th and the beginning of the 20 th c<strong>en</strong>tury (see Fig. 3b) just before and during the<br />
construction works. The hydrographic chart of Stessels (1866) shows the occurr<strong>en</strong>ce of pure<br />
mud at the same location. East of the <strong>port</strong> near-field accretion of mainly sand occurred (not<br />
shown in Fig. 3); im<strong>port</strong>ant morphological changes in the area continue until today.<br />
Comparison betwe<strong>en</strong> the hydrographical maps of 1866 and 1911 (Fig. 9) indicates that these<br />
changes have started before the construction of the <strong>port</strong> of Zeebrugge and could thus be the<br />
12
415<br />
416<br />
417<br />
418<br />
419<br />
420<br />
421<br />
422<br />
423<br />
424<br />
425<br />
426<br />
427<br />
428<br />
429<br />
430<br />
431<br />
432<br />
433<br />
434<br />
435<br />
436<br />
437<br />
438<br />
439<br />
440<br />
441<br />
442<br />
443<br />
444<br />
445<br />
446<br />
447<br />
448<br />
result of a natural morphological evolution. However, human influ<strong>en</strong>ces such as the<br />
th<br />
construction of coastal def<strong>en</strong>ce structures in the 19 c<strong>en</strong>tury along the eastern Belgian coast<br />
cannot totally be excluded to explain at least partly these morphological changes. These<br />
changes resulted in the formation of a sand bank (called “Het Zand”) at the place where the<br />
<strong>port</strong> is situated nowadays (Van Mierlo, 1899). The most direct impact of the first<br />
infrastructure has possibly be<strong>en</strong> to locally reinforce natural morphological tr<strong>en</strong>ds in<br />
decreasing depth, as predicted by Van Mierlo (1897).<br />
Areas where the seafloor has deep<strong>en</strong>ed (>1m) are partly artificial, such is the case in the<br />
‘Pas <strong>van</strong> <strong>het</strong> Zand’ and the navigation channel towards the Westerschelde (‘Scheur’). In these<br />
areas freshly deposited mud is expected to be found, as these <strong>en</strong>vironm<strong>en</strong>ts are artificial<br />
sinks for fine-grained sedim<strong>en</strong>ts. Further offshore, deep<strong>en</strong>ing is probably natural and must<br />
correspond with erosion processes. It is thus most likely that the mud observed in these<br />
areas coincide with outcropping of anci<strong>en</strong>t mud (Holoc<strong>en</strong>e). The cohesive sedim<strong>en</strong>ts in the<br />
offshore zone (> 10 m MLLWS) where the bathymetry has not changed are most probably<br />
also of anci<strong>en</strong>t age (Holoc<strong>en</strong>e).<br />
4.4 Numerical model results<br />
The aim of the model simulations was to simulate the trans<strong>port</strong> and deposition of fine<br />
grained sedim<strong>en</strong>ts using a bathymetry before (i.c. bathymetry of 1959, without <strong>port</strong> of<br />
Zeebrugge) and after the major <strong>en</strong>gineering works have be<strong>en</strong> carried out (bathymetry of<br />
2003, with <strong>port</strong> of Zeebrugge). The bathymetries used to simulate the hydrodynamics and<br />
the sedim<strong>en</strong>t trans<strong>port</strong> are shown in Fig. 10. The simulations have be<strong>en</strong> carried out during<br />
calm weather and lasted one spring-neap tidal cycle. It is assumed that the SPM<br />
conc<strong>en</strong>tration along the op<strong>en</strong> boundaries of the OPTOS-BCS model is the same for the rec<strong>en</strong>t<br />
and historic situation. The results are pres<strong>en</strong>ted in Fig. 11 (2003 situation) and Fig. 12 (1959<br />
situation, without Zeebrugge). The figures show that the Belgian and southern Dutch<br />
coastal waters are an effective trap for susp<strong>en</strong>ded sedim<strong>en</strong>ts, resulting in the formation of an<br />
area of high SPM conc<strong>en</strong>tration. During spring tide the SPM conc<strong>en</strong>tration reaches a<br />
maximum, whereas during neap tide the mud deposition is highest.<br />
Perman<strong>en</strong>t mud deposits are those, which are not eroded during spring tide; they are<br />
situated in the navigation channels and – for the rec<strong>en</strong>t situation – around Zeebrugge.<br />
Nevertheless the limitations of the model, the results indicate that despite the occurr<strong>en</strong>ce of a<br />
turbidity maximum in the nearshore zone only few perman<strong>en</strong>t deposits of cohesive<br />
sedim<strong>en</strong>ts exist and that most of them are situated in areas with a high anthropog<strong>en</strong>ic<br />
impact.<br />
13
449<br />
450<br />
451<br />
452<br />
453<br />
454<br />
455<br />
456<br />
457<br />
458<br />
459<br />
460<br />
461<br />
462<br />
463<br />
464<br />
465<br />
466<br />
467<br />
468<br />
469<br />
470<br />
471<br />
472<br />
473<br />
474<br />
475<br />
476<br />
477<br />
478<br />
479<br />
480<br />
481<br />
482<br />
The model results show further – as a consequ<strong>en</strong>ce of mass conservation in the model and<br />
without taking into account dredging and dumping – that SPM conc<strong>en</strong>tration is on average<br />
lower and mud deposition higher today than in 1959.<br />
5. Discussion<br />
The construction and ext<strong>en</strong>sion of the <strong>port</strong> of Zeebrugge and its connections to the op<strong>en</strong> sea,<br />
the dumping of dredged matter and the morphological evolutions induced by these<br />
operations have had and still have an influ<strong>en</strong>ce on the fine grained sedim<strong>en</strong>t system. The<br />
comparison betwe<strong>en</strong> the rec<strong>en</strong>t data and the Gilson field data (Fig. 3, Fig. 9) shows that the<br />
distribution of freshly deposited to very soft consolidated mud and the clay pebbles has<br />
changed. The possible explanations such as natural or human induced morphological<br />
changes, dredging and dumping, increased erosion of clayey sedim<strong>en</strong>ts and changes in<br />
storminess are discussed below.<br />
5.1 Deposition of fine grained sedim<strong>en</strong>ts<br />
The coastal turbidity maximum is responsible for the availability of fine grained sedim<strong>en</strong>ts<br />
and thus also for the deposition of fresh mud. On most places in the nearshore zone the<br />
occurr<strong>en</strong>ce of fresh mud is limited to thin layers of maximum a few cm on top of the<br />
sedim<strong>en</strong>t bed (liquid layer or fluffy layer). The erosion resistance is small and they are<br />
resusp<strong>en</strong>ded during high curr<strong>en</strong>ts. The occurr<strong>en</strong>ce of fluffy layers cannot be used as<br />
indication of variation in cohesive sedim<strong>en</strong>t distribution betwe<strong>en</strong> the past (100 years ago)<br />
and today. Thick layers (±0.5 m) of freshly deposited to very soft consolidated mud (Fig. 4c)<br />
however are a good indicator of changes. They occur today in <strong>en</strong>vironm<strong>en</strong>ts which are or<br />
have be<strong>en</strong> strongly influ<strong>en</strong>ced by human activities such as near dumping places (B&W-O in<br />
Fig.1), navigation channels, inside harbours, and in the area around the <strong>port</strong> of Zeebrugge,<br />
see Fig. 3a. These mud layers can easily be distinguished from the older more consolidated<br />
cohesive sedim<strong>en</strong>ts (Fig. 4b and 4e) or the fluffy layers (Fig. 4d). The fact that Gilson did not<br />
m<strong>en</strong>tioned the occurr<strong>en</strong>ce of thick freshly deposited to very soft mud layers could indicate<br />
that they did not occur 100 years ago and that they are a result of human impact into the<br />
system. This reasoning is however unbalanced. First, the functioning of Gilson’s ground<br />
sampler could lead to a washing out of the fresh mud. The sampler is able to p<strong>en</strong>etrate the<br />
substratum to about 20 cm wh<strong>en</strong> it lies on its side, but its vertical height is limited to about<br />
10 cm so that wh<strong>en</strong> hauled back, the heavy closing lid may have expelled a more or less<br />
large part of the soft to fluid matter; this has be<strong>en</strong> re<strong>port</strong>ed once. Second, field description of<br />
the samples does oft<strong>en</strong> not <strong>en</strong>compass details on compaction of the sample. Occurr<strong>en</strong>ce of<br />
thick layers of freshly deposited to very soft consolidated mud have probably occurred in the<br />
14
483<br />
484<br />
485<br />
486<br />
487<br />
488<br />
489<br />
490<br />
491<br />
492<br />
493<br />
494<br />
495<br />
496<br />
497<br />
498<br />
499<br />
500<br />
501<br />
502<br />
503<br />
504<br />
505<br />
506<br />
507<br />
508<br />
509<br />
510<br />
511<br />
512<br />
513<br />
514<br />
515<br />
516<br />
517<br />
eastern nearshore area where the sedim<strong>en</strong>ts consist of mud and the depth soundings indicate<br />
“soft” and/or “sticky” bottoms.<br />
From a combination of the mud cont<strong>en</strong>t derived from Gilson’s meta-information (Fig. 3b)<br />
and the morphological changes betwe<strong>en</strong> 1866 and 1911 (Fig. 9) it can be se<strong>en</strong> that the<br />
surface layer consists of mainly mud, which is found in a narrow band along the coastline<br />
and corresponds most probably with the freshly deposited to very soft consolidated mud of §<br />
4.1. No information is available on the thickness of these layers, but the fact that Gilson<br />
sampled the area on several occasions and that he found most of the time muddy sedim<strong>en</strong>ts<br />
leads to the conclusions that the deposits were perman<strong>en</strong>t during the considered interval and<br />
could resist the strong curr<strong>en</strong>ts during spring-tide. Furthermore the metadata of several<br />
sampling occasions clearly m<strong>en</strong>tions ‘very soft’ bottom in the area, possibly indicating<br />
freshly deposited mud on top; it is however not possible to give a thickness to these deposits,<br />
thus it could also indicate a fluffy layer of a few cm or more. Van Mierlo (1908) wrote that<br />
after the construction of the first <strong>port</strong> of Zeebrugge the water depth west of the harbour<br />
mole decreased by 2 m due to the deposition of cohesive sedim<strong>en</strong>ts. The same author wrote<br />
that before the <strong>port</strong> construction, a layer of 60 cm of mud was deposited in the same area<br />
over a period of 10 years, this corresponds with a accumulation rate of 6 cm/yr. If these<br />
sedim<strong>en</strong>ts still exist today, th<strong>en</strong> it is expected that they fit the class ‘soft to medium<br />
consolidated’ and correspond thus with modern mud. Although the rec<strong>en</strong>t sampling<br />
resolution is g<strong>en</strong>erally lower than Gilson’s one, freshly deposited to very soft consolidated<br />
thick mud layers (>30 cm) in this narrow coastal band have only be<strong>en</strong> found today near the<br />
old dumping place of Oost<strong>en</strong>de (B&W-O). In some samples this mud is deposited on soft to<br />
medium consolidated mud (see box core OE14 in Fig. 5), the latter corresponds possibly with<br />
the freshly deposited mud layers of the beginning of the 20th c<strong>en</strong>tury. The deposition of the<br />
freshly to very soft consolidated mud near B&W-O started after the 1950ties as was detected<br />
from the radiometric measurem<strong>en</strong>ts of the OE11 box core (see § 4.2) and was only possible<br />
because the modification of the bathymetry created a hydrodynamic protected area. Van<br />
Lancker et al. (2004) have studied using differ<strong>en</strong>t bathymetrical maps from 1955 up to 1997<br />
the morphological evolution of the area around B&W-O. They conclude that the water depth<br />
decreased on the dumping place and that north and south of the dumping place two<br />
channels were formed. The decrease in water depth was initiated by the dumping activities<br />
and was followed by morphological changes.<br />
Other areas today with im<strong>port</strong>ant depositions of fresh mud are the navigation channels,<br />
the harbours and – more interesting - the area situated a few km north of the <strong>port</strong> of<br />
Zeebrugge (see Fig. 3a), such as the rec<strong>en</strong>t mud found at ZB6. This deposition is probably<br />
15
518<br />
519<br />
520<br />
521<br />
522<br />
523<br />
524<br />
525<br />
526<br />
527<br />
528<br />
529<br />
530<br />
531<br />
532<br />
533<br />
534<br />
535<br />
536<br />
537<br />
538<br />
539<br />
540<br />
541<br />
542<br />
543<br />
544<br />
545<br />
546<br />
547<br />
548<br />
549<br />
550<br />
551<br />
552<br />
related to the ext<strong>en</strong>sion of <strong>port</strong> of Zeebrugge in the 1980ties, as was deduced from the<br />
radiometric measurem<strong>en</strong>ts (§ 4.2). The results of the numerical model simulations suggest<br />
that solely the deep<strong>en</strong>ing of the bathymetry and the ext<strong>en</strong>sion of the outer <strong>port</strong> of Zeebrugge<br />
are responsible for a decrease in SPM conc<strong>en</strong>tration and an increase in mud deposition<br />
betwe<strong>en</strong> the 1959 and the 2003 situation in the area around Zeebrugge. Keeping in mind the<br />
limitation of the model (resolution, 2D simulation) they also show that the ext<strong>en</strong>sion of the<br />
<strong>port</strong> of Zeebrugge results in mud deposition near the <strong>port</strong>; a feature not occurring in the<br />
1959 model.<br />
The results suggest that in the beginning of the 20 th c<strong>en</strong>tury perman<strong>en</strong>t deposition of<br />
cohesive sedim<strong>en</strong>ts occurred mainly in a narrow band along the coast from about<br />
Nieuwpoort up to the mouth of the Westerschelde. These depositions were mainly the result<br />
of natural occurring morphological changes. Today, perman<strong>en</strong>t fresh mud deposits are<br />
found in the same area only near the dumping place B&W-O and in the outer <strong>port</strong> of<br />
Zeebrugge and the navigation channel ‘Pas <strong>van</strong> <strong>het</strong> Zand’. Deposition of fresh mud seems to<br />
have shifted towards more offshore and occur today in the navigation channels ‘Scheur’ and<br />
‘Pas <strong>van</strong> <strong>het</strong> Zand’ and in the area north of the <strong>port</strong> of Zeebrugge.<br />
5.2 Increased erosion of Holoc<strong>en</strong>e or tertiary mud<br />
Clay and mud pebbles of a few cm up to 10 cm in size and of differ<strong>en</strong>t rounded shapes have<br />
be<strong>en</strong> found regularly in sandy sedim<strong>en</strong>ts 100 years ago and today. The rounded shape is an<br />
indication that these pebbles have be<strong>en</strong> trans<strong>port</strong>ed; the flatt<strong>en</strong>ed shape may indicate that<br />
they originate from erosion of the layered Holoc<strong>en</strong>e mud. Fig. 3 shows that they are more<br />
frequ<strong>en</strong>tly recorded today, despite the lower sampling resolution.<br />
The higher frequ<strong>en</strong>cy today of clay and mud pebbles in the vicinity of the dumping places<br />
B&W-S1 and B&W-O is probably a result of the dumping of dredged sedim<strong>en</strong>ts from mainly<br />
deep<strong>en</strong>ing dredging works. Tertiary clay and Holoc<strong>en</strong>e mud are, e.g. outcropping in the<br />
navigation channel towards the Westerschelde and in the ‘Pas <strong>van</strong> <strong>het</strong> Zand’ (see Fig. 3a).<br />
On other places the occurr<strong>en</strong>ce of mud or clay pebbles may indicate erosion of old mud<br />
(Holoc<strong>en</strong>e or modern) or tertiary clay. Near the sampling site MOW1 (Fig 1) Holoc<strong>en</strong>e mud is<br />
outcropping; it is covered by an ephemeral fine sand layer of 1 to 10 cm. Mud l<strong>en</strong>ses have<br />
be<strong>en</strong> observed in the sand indicating probably erosion of the underlying Holoc<strong>en</strong>e mud.<br />
Interesting in the OE11 core is the lower 210 Pb activity in the surface layer (Fig. 8) than<br />
betwe<strong>en</strong> 23 cm and 27 cm below the surface where a maximum is found. The observed<br />
profile could be explained by assuming a supply and deposition of mud with a low 210 Pb<br />
cont<strong>en</strong>t. Possible sources are from the erosion of the Holoc<strong>en</strong>e mud and from capital<br />
dredging works, which may bring Holoc<strong>en</strong>e and Tertiary fine grained sedim<strong>en</strong>ts in<br />
16
553<br />
554<br />
555<br />
556<br />
557<br />
558<br />
559<br />
560<br />
561<br />
562<br />
563<br />
564<br />
565<br />
566<br />
567<br />
568<br />
569<br />
570<br />
571<br />
572<br />
573<br />
574<br />
575<br />
576<br />
577<br />
578<br />
579<br />
580<br />
581<br />
582<br />
583<br />
584<br />
585<br />
586<br />
587<br />
susp<strong>en</strong>sion. Similar observations from elsewhere have be<strong>en</strong> re<strong>port</strong>ed by T<strong>en</strong> Brinke et al.<br />
226<br />
(1995) and Anders<strong>en</strong> et al. (2000). Variation in industrial Ra discharges and the closing<br />
down of the BASF-Antwerp<strong>en</strong> discharges in 2002 could also give an explanation for the<br />
decreasing 210 Pb activity. Quantitative information on trans<strong>port</strong> and diffusion of 226 Ra from<br />
the Schelde estuary towards the southern North Sea is however not known to confirm this<br />
explanation.<br />
5.3 Dredging and dumping effects<br />
The <strong>port</strong> of Zeebrugge and its connection to the op<strong>en</strong> sea as well as the navigation channels<br />
towards the Westerschelde estuary are effici<strong>en</strong>t sinks for cohesive sedim<strong>en</strong>ts. Maint<strong>en</strong>ance<br />
dredging and dumping amount today to about 12 millions tons of dry matter yearly<br />
(average over the period 1999-2004), from which more than 70% is silt and clay. 48% of the<br />
total quantity is dredged in the navigation channels towards the Westerschelde and the <strong>port</strong><br />
of Zeebrugge, 45% in the <strong>port</strong> itself and 7% in the smaller harbours (Oost<strong>en</strong>de, Blank<strong>en</strong>berge<br />
and Nieuwpoort). 52% of the dredged matter is dumped on dumping place B&W-S1, 33% on<br />
B&W-ZO and 5% on B&W-O. Comparison betwe<strong>en</strong> the SPM trans<strong>port</strong> <strong>en</strong>tering and leaving<br />
the BCS and the quantities dredged and dumped at sea shows that an im<strong>port</strong>ant part of the<br />
SPM is involved in the dredging/dumping cycle (Fettweis and Van d<strong>en</strong> Eynde, 2003).<br />
The deposition of mud in the dredging areas should be se<strong>en</strong> as a temporarily storage and<br />
it does not affect the global sedim<strong>en</strong>t balance on a scale of the BCS. In these areas the human<br />
impact is however massive and the deposition is the results of the <strong>en</strong>gineering works, which<br />
have be<strong>en</strong> carried out (deep<strong>en</strong>ing, <strong>port</strong> construction). The fact that high amount of fine<br />
grained sedim<strong>en</strong>ts are deposited and dredged shows that the nearshore zone has become<br />
more muddy since the beginning of the 20th c<strong>en</strong>tury wh<strong>en</strong> dredging was significantly<br />
smaller.<br />
The dumping of fine grained sedim<strong>en</strong>t increases temporarily the SPM conc<strong>en</strong>tration by<br />
50-100 mg/l in a diameter of 20-40 km around dumping place B&W-S1 and increase the<br />
deposition of mud north of the dumping place (Van d<strong>en</strong> Eynde and Fettweis, 2004). The<br />
seasonal averaged SPM conc<strong>en</strong>tration in this area as derived from satellite images and in situ<br />
measurem<strong>en</strong>ts amounts to 25 mg/l ± 100% in summer up to 100 mg/l ± 70% in winter<br />
(Fettweis et al., 2007). If the assumption that the SPM trans<strong>port</strong> has not changed globally in<br />
the southern North Sea in the last 100 years is valid, th<strong>en</strong> it can be concluded from these<br />
results and from the model results of § 4.4 that the turbidity maximum area has shifted in<br />
the last 100 years more offshore, because SPM conc<strong>en</strong>tration near the dredging areas has<br />
slightly decreased due to deposition, while around the dumping places it has increased.<br />
5.4 Changes in storminess<br />
17
588<br />
589<br />
590<br />
591<br />
592<br />
593<br />
594<br />
595<br />
596<br />
597<br />
598<br />
599<br />
600<br />
601<br />
602<br />
603<br />
604<br />
605<br />
606<br />
607<br />
608<br />
609<br />
610<br />
611<br />
612<br />
613<br />
614<br />
615<br />
616<br />
617<br />
618<br />
619<br />
620<br />
621<br />
622<br />
The occurr<strong>en</strong>ce and frequ<strong>en</strong>cy of storms are im<strong>port</strong>ant for the distribution of cohesive<br />
sedim<strong>en</strong>ts. Indications of changing storminess in the North Sea have be<strong>en</strong> frequ<strong>en</strong>tly<br />
re<strong>port</strong>ed, see e.g. Wasa Group (1998) and Weisse et al. (2005). The Wasa Group (1998)<br />
m<strong>en</strong>tions that the storm- and wave climate in most of the North Sea has undergone<br />
variations on time scales of decades; these variations are related to variations in the North<br />
Atlantic Oscillation index.. Interesting to note is that the int<strong>en</strong>sity of the storm- and waveclimate<br />
in the 1990ties seems to compare with the int<strong>en</strong>sity at the beginning of the<br />
tw<strong>en</strong>tieth c<strong>en</strong>tury (WASA Group, 1998; Dawson et al., 2002). Nevertheless the decadal<br />
variation in storminess no statistical significant long-term tr<strong>en</strong>ds (>100 years) could have<br />
be<strong>en</strong> found, see the findings of De Jong et al. (1999) for the German Bight and of Verwaest<br />
(pers comm.) for the Belgian part of the North Sea. It is therefore concluded that variations<br />
in meteorological conditions cannot explain at least partly the differ<strong>en</strong>ces in cohesive<br />
sedim<strong>en</strong>t distribution today and 100 years ago.<br />
6. Conclusion<br />
In the study area cohesive sedim<strong>en</strong>ts of differ<strong>en</strong>t age occur, ranging from tertiary clays up to<br />
freshly deposited mud. Based on rec<strong>en</strong>t field data the distribution of these sedim<strong>en</strong>ts has be<strong>en</strong><br />
determined. The effects of <strong>en</strong>gineering works or natural processes have be<strong>en</strong> investigated by<br />
comparing the distribution of freshly deposited to very soft consolidated mud and mud and<br />
clay pebbles 100 years ago and today. The historic data of Gilson have be<strong>en</strong> used to describe<br />
the cohesive sedim<strong>en</strong>t distribution as it occurred in the beginning of the 20th c<strong>en</strong>tury in the<br />
Belgian nearshore area. The quality of these samples is very high regarding the available<br />
metadata and the data have prov<strong>en</strong> to be a major refer<strong>en</strong>ce to understand the evolution of<br />
the local cohesive sedim<strong>en</strong>t distributions. The processing of the historic and rec<strong>en</strong>t data was<br />
mainly based on field descriptions of the samples (consolidation, thickness) and on<br />
morphological evolution; emphasis was put on the occurr<strong>en</strong>ce of thick layers (>30cm) of<br />
freshly deposited to very soft consolidated mud and on the distribution of clay and mud<br />
pebbles. The major conclusions of the study are:<br />
1. Thick layers of fresh mud (>30 cm) were deposited in the beginning of the 20 th c<strong>en</strong>tury<br />
mainly in a narrow band along the coast from about Nieuwpoort up to the mouth of the<br />
Westerschelde. These deposits were mainly the result of natural morphological changes.<br />
Today, perman<strong>en</strong>t layers of fresh mud are conc<strong>en</strong>trated around the old dumping site of<br />
Oost<strong>en</strong>de, in the outer <strong>port</strong> of Zeebrugge, in the navigation channels ‘Scheur’ and ‘Pas<br />
<strong>van</strong> <strong>het</strong> Zand’ and in the area north to northeast of the <strong>port</strong> of Zeebrugge. Comparing<br />
the actual situation with the situation 100 years ago it seems that around Zeebrugge the<br />
area with fresh mud ext<strong>en</strong>ds more towards offshore.<br />
18
623<br />
624<br />
625<br />
626<br />
627<br />
628<br />
629<br />
630<br />
631<br />
632<br />
633<br />
634<br />
635<br />
636<br />
637<br />
638<br />
639<br />
640<br />
641<br />
642<br />
643<br />
644<br />
645<br />
646<br />
647<br />
648<br />
649<br />
650<br />
651<br />
652<br />
653<br />
654<br />
655<br />
2. Most of the actual depositions of thick layers of fresh mud (>30 cm) have be<strong>en</strong> induced<br />
by anthropog<strong>en</strong>ic operations, such as dumping, deep<strong>en</strong>ing of the navigation channels<br />
and construction and ext<strong>en</strong>sion of the <strong>port</strong> of Zeebrugge.<br />
3. If the assumption that the SPM trans<strong>port</strong> has not changed globally in the southern<br />
North Sea in the last 100 years is valid, th<strong>en</strong> it can be concluded that the c<strong>en</strong>tre of the<br />
turbidity maximum area has probably shifted in the last 100 years more towards<br />
offshore. This is explained by the slight decrease in SPM conc<strong>en</strong>tration near the dredging<br />
areas due to high siltation rates and the increase in SPM conc<strong>en</strong>tration on the offshore<br />
dumping places (such as B&W-S1).<br />
4. The higher frequ<strong>en</strong>cy of clay and mud pebbles today compared with 100 years ago is<br />
probably mainly related to deep<strong>en</strong>ing dredging works. Indications (radiometric<br />
measurem<strong>en</strong>ts) have however be<strong>en</strong> found that a higher erosion of the Holoc<strong>en</strong>e mud<br />
may occur today. Erosion of the Holoc<strong>en</strong>e mud may occur in flakes or pebbles due to its<br />
consist<strong>en</strong>cy.<br />
5. Both, the historical and the rec<strong>en</strong>t dataset, show that the Belgian coastal waters east of<br />
Oost<strong>en</strong>de are naturally subject to high siltation rates, resulting in the deposition of fresh<br />
to very soft consolidated mud layers of more than 30 cm, but also in the deposition of<br />
tidal driv<strong>en</strong> ephemeral fluffy layers of a few cm over the area covered by the turbidity<br />
maximum. The effects of variation in SPM conc<strong>en</strong>tration and cohesive sedim<strong>en</strong>t<br />
distribution through time on the habitat of b<strong>en</strong>thic invertebrates are therefore probably<br />
minor and not a key to explain temporal changes in the composition of the b<strong>en</strong>thic<br />
communities since the early 20th c<strong>en</strong>tury.<br />
7. Acknowledgem<strong>en</strong>ts<br />
This study was partly funded by the Belgian Sci<strong>en</strong>ce Policy within the framework of the<br />
MOCHA and HINDERS projects and partly by the Maritime Access Division of the Ministry of<br />
the Flemish Community in the framework of the MOMO project. The measurem<strong>en</strong>ts have<br />
be<strong>en</strong> collected onboard of the R/V Belgica. We wish to acknowledge Virginie Pison (MUMM),<br />
Johan Parida<strong>en</strong>s (SCK-CEN) and Paul Fettweis who have greatly improved the paper during<br />
the many discussions and helpful suggestions. The radioactive measurem<strong>en</strong>ts have be<strong>en</strong><br />
carried out at the cyclotron of the VUB, P. Van Winckel is greatly acknowledged.<br />
6. Refer<strong>en</strong>ces<br />
Ariathurai, C.R., 1974. A finite elem<strong>en</strong>t model for sedim<strong>en</strong>t trans<strong>port</strong> in estuaries. Ph.D.<br />
Thesis, Univ. California, Davis, USA.<br />
19
656<br />
657<br />
658<br />
659<br />
660<br />
661<br />
662<br />
663<br />
664<br />
665<br />
666<br />
667<br />
668<br />
669<br />
670<br />
671<br />
672<br />
673<br />
674<br />
675<br />
676<br />
677<br />
678<br />
679<br />
680<br />
681<br />
682<br />
683<br />
684<br />
685<br />
686<br />
687<br />
688<br />
689<br />
690<br />
Anders<strong>en</strong>, T. J., Mikkels<strong>en</strong>, O. A., Moller, A. L., Pejrup, M. 2000. Deposition and mixing<br />
depths on some European intertidal mudflats based on Pb210 and Cs137 activities.<br />
Contin<strong>en</strong>tal Shelf Res., 20, 1569-1591.<br />
Baeteman, C. 1999. The Holoc<strong>en</strong>e depositional history of the IJzer palaeovalley (Western<br />
Belgian coastal plain) with refer<strong>en</strong>ce to the factors controlling the formation of<br />
intercalated peat beds. In: Quaternary of Belgium: new perspectives (Baeteman, C., ed.),<br />
Geologica Belgica, 2(1-2), 39-72.<br />
Baeteman, C. 2004. The Holoc<strong>en</strong>e developm<strong>en</strong>t of a tide-dominated coastal lowland. Western<br />
coastal plain of Belgium. Field Guide. The QRA Third Int. Postgraduate Symp. Fieldtrip,<br />
September 17 th 2004. Belgian Geological Survey, Brussels. 76pp.<br />
Baeteman, C. 2005. Geological map of Belgium. G<strong>en</strong>eral Sequ<strong>en</strong>ce map of the Holoc<strong>en</strong>e<br />
coastal deposits (1/25.000). Map Nieuwpoort-Leke, Oostduinkerke-De Panne,<br />
Middelkerke-Oost<strong>en</strong>de. Belgian Geological Survey, Brussels.<br />
Baeteman, C. 2007. Roman peat-extraction pits as possible evid<strong>en</strong>ce for the timing of coastal<br />
changes: An example from the Belgian coastal plain. Liber Amicorum Prof. Dr. G.J.<br />
Borger, Uitgeverij Aksant, Amsterdam, in press.<br />
Baeteman, C., Declercq, P-Y. 2002. A synthesis of early and middle Holoc<strong>en</strong>e coastal changes<br />
in the Belgian lowlands. Belgeo, 2, 77-107.<br />
Bastin, A. 1974. Regionale sedim<strong>en</strong>tologie <strong>en</strong> morfologie <strong>van</strong> de zuidelijke Noordzee <strong>en</strong> <strong>het</strong><br />
Schelde estuarium. PhD thesis, Geography-Geology departm<strong>en</strong>t, Katholieke Univ. Leuv<strong>en</strong>,<br />
Belgium, 91pp.<br />
Beets, J.D., <strong>van</strong> der Spek, A.J.F. 2000. The Holoc<strong>en</strong>e evolution of the barrier and the backbarrier<br />
basins of Belgium and the Netherlands as a function of late Weichselian<br />
morphology, relative sea-level rise and sedim<strong>en</strong>t supply. Geologie <strong>en</strong> Mijnbouw /<br />
Netherlands J. of Geosc., 79, 3-16.<br />
Bogemans, F., Baeteman, C. 2003. Kaart <strong>en</strong> Toelichting bij de Quartairgeologische Kaart<br />
Veurne-Roeselare 19-20 (1/50.000). Ministerie <strong>van</strong> de Vlaamse Geme<strong>en</strong>schap, Afdeling<br />
Natuurlijke Rijkdomm<strong>en</strong> <strong>en</strong> Energie, Brussel. 38pp.<br />
B<strong>en</strong>net, R.H., Lambert, D.N. 1971. Rapid and reliable technique for determining unit weight<br />
and porosity of deep-sea sedim<strong>en</strong>ts. Mar. Geol. 11, 201-207.<br />
Bouron-Bougé, A. 1972. Applications de la radiographie et de la gammad<strong>en</strong>simétrie à l'étude<br />
des carottes de sédim<strong>en</strong>ts meubles, PhD Thesis, Univ. Nantes, France. 159pp.<br />
Caillot, A., Courtois, G. 1969. Mesure de la d<strong>en</strong>sité d'échantillons de vase <strong>en</strong> cours de<br />
tassem<strong>en</strong>t par absorption de rayons gamma. Choix d'un isotope. DR/SAR.S/69-2/AC-MB,<br />
C<strong>en</strong>tre d'Etudes Nucléaires de Saclay, France.<br />
20
691<br />
692<br />
693<br />
694<br />
695<br />
696<br />
697<br />
698<br />
699<br />
700<br />
701<br />
702<br />
703<br />
704<br />
705<br />
706<br />
707<br />
708<br />
709<br />
710<br />
711<br />
712<br />
713<br />
714<br />
715<br />
716<br />
717<br />
718<br />
719<br />
720<br />
721<br />
722<br />
723<br />
Coastal Engineering Manual. 2002. Erosion, trans<strong>port</strong> and deposition of cohesive sedim<strong>en</strong>ts.<br />
EM 1110-2-1100 (part III-chapter5).<br />
Dawson, A.G., Hickey, K., Holt, T., Elliott, L., Dawson, S., Foster, I.D.L., Wadhams, P.,<br />
Jonsdottir, I., Wilkinson, J., McK<strong>en</strong>na, J., Davis, N.R., Smith, D.E. 2002. Complex North<br />
Atlantic Oscillation (NAO) index signal of historic North Atlantic storm-track changes.<br />
The Holoc<strong>en</strong>e. 12, 363-369.<br />
De Jong, F., Bakker, J.F., <strong>van</strong> Berkel, C.J.M., Dankers, N.M.J.A., Dahl, K., Gätje, C.,<br />
Mar<strong>en</strong>cic, H., Potel, P. 1999. Wadd<strong>en</strong> Sea Quality Status Re<strong>port</strong>. Wadd<strong>en</strong> Sea Ecosystem<br />
No. 9. Common Wadd<strong>en</strong> Sea secretariat, Trilateral Monitoring and Assessm<strong>en</strong>t Group,<br />
Quality Status Re<strong>port</strong> Group. Wilhelmshav<strong>en</strong>, Germany.<br />
de Kok, J.M., 1994. Numerical modelling of trans<strong>port</strong> processes in coastal waters. Ph.D.<br />
Thesis, Univ Utrecht, The Netherlands.<br />
Egan, B.A., Mahoney, J.R., 1972. Numerical modeling of advection and diffusion of urban<br />
area source pollutants. J. Appl. Meteorology, 11, 312-322.<br />
Fettweis, M., Van d<strong>en</strong> Eynde, D. 2003. The mud deposits and the high turbidity in the<br />
Belgian-Dutch coastal zone, Southern bight of the North Sea. Contin<strong>en</strong>tal Shelf Res., 23,<br />
669-691.<br />
Fettweis, M., Franck<strong>en</strong>, F., Pison, V., Van d<strong>en</strong> Eynde, D. 2006. Susp<strong>en</strong>ded particulate matter<br />
dynamics and aggregate sizes in a high turbidity area. Mar. Geol., 235, 63-74.<br />
Fettweis, M., Nechad, B., Van d<strong>en</strong> Eynde, D. 2007. An estimate of the susp<strong>en</strong>ded particulate<br />
matter (SPM) trans<strong>port</strong> in the southern North Sea using SeaWiFS images, in-situ<br />
measurem<strong>en</strong>ts and numerical model results. Contin<strong>en</strong>tal Shelf Res. (in revision)<br />
Gilson, G. 1900. Exploration de la mer sur les côtes de la Belgique <strong>en</strong> 1899. Mémoires du<br />
Musées Royal d’Histoire Naturelle de Belgique, I, 81pp.<br />
Gilson, G. 1901. A new sounding and ground collecting apparatus. Re<strong>port</strong> of the Britisch<br />
Association for the Ad<strong>van</strong>cem<strong>en</strong>t of Sci<strong>en</strong>ce, 71, 696-697.<br />
Houziaux, J.-S. 2007. The Hinder banks: yet an im<strong>port</strong>ant region for the Belgian marine<br />
biodiversity? Final re<strong>port</strong>, Belgian Sci<strong>en</strong>ce Policy Office, PADD II program. 80 pp.<br />
Johnson, B., Trawle, M.J., Adamec, S., 1988. Dredged material disposal modelling in Puget<br />
Sound. J. Waterway Port Coastal Ocean Eng., 114, 700-713.<br />
Krone, R.B., 1962. Flume studies of the trans<strong>port</strong> of sedim<strong>en</strong>t in estuarial shoaling processes,<br />
Hydraulic and Sanitary Engineering Research Laboratory, Univ. California, Berkeley,<br />
USA.<br />
21
724<br />
725<br />
726<br />
727<br />
728<br />
729<br />
730<br />
731<br />
732<br />
733<br />
734<br />
735<br />
736<br />
737<br />
738<br />
739<br />
740<br />
741<br />
742<br />
743<br />
744<br />
745<br />
746<br />
747<br />
748<br />
749<br />
750<br />
751<br />
752<br />
753<br />
754<br />
755<br />
756<br />
757<br />
758<br />
Le Bot, S., Van Lancker, V., Deleu S., De Batist M., H<strong>en</strong>riet J.P. 2003. Tertiary and<br />
Quaternary geology of the Belgian Contin<strong>en</strong>tal Shelf. Belgian Sci<strong>en</strong>ce Policy, Final re<strong>port</strong><br />
D/2003/1191/12, 75pp.<br />
Luyt<strong>en</strong>, P. J., Jones, J. E., Proctor, R., Tabor, A., Tett, P., Wild-All<strong>en</strong>, K. 1999. COHERENS A<br />
Coupled Hydrodynamical-Ecological Model for Regional and Shelf Seas: User<br />
Docum<strong>en</strong>tation. MUMM re<strong>port</strong>, Brussels. 911pp. [Available on CD-ROM at<br />
http://www.mumm.ac.be/coher<strong>en</strong>s ].<br />
Maréchal, R. 1993. A new lithostratigraphic scale for the Palaeog<strong>en</strong>e of Belgium. Bulletin <strong>van</strong><br />
de Belgische Ver<strong>en</strong>iging voor Geologie, 102, 215-229.<br />
Missia<strong>en</strong>, T., Murphy, S., Loncke, L., H<strong>en</strong>riet, J.-P. 2002. Very high-resolution seismic<br />
mapping of shallow gas in the Belgian coastal zone. Contin<strong>en</strong>tal Shelf Res., 22, 2291-<br />
2301.<br />
Parida<strong>en</strong>s, J., Vanmarcke, H. 2000. Inv<strong>en</strong>tarisatie <strong>en</strong> karakterisatie <strong>van</strong> verhoogde<br />
conc<strong>en</strong>traties aan natuurlijke radionuclid<strong>en</strong> <strong>van</strong> industriële oorsprong in Vlaander<strong>en</strong>.<br />
SCK-CEN Departem<strong>en</strong>t Stralingsbeschermingsonderzoek, Mol. BLG 884, 44pp.<br />
Pison, V., Ozer, J. 2003. Operational products and services for the Belgian coastal waters. In:<br />
Building the European capacity in operational modeling, Proc. 3 rd Int. Conf. on EuroGOOS<br />
(Dahlin, H., Flemming, N.C., Nittis, K., Petersson, S.E., eds.). Elsevier Oceanography Series<br />
69, 503-509.<br />
Preiss, K. 1968. Non-destructive laboratory measurem<strong>en</strong>t of marine sedim<strong>en</strong>t d<strong>en</strong>sity in a<br />
core barrel using gamma radiation. Deep-Sea Res., 15, 401-407.<br />
Stessels, 1866. Carte générale des bancs de Flandre compris <strong>en</strong>tre Gravelines et l'embouchure<br />
de l'Escaut. Ministre des affaires étrangères, Anvers, Belgium.<br />
Strubbe, J. 1987. De Belgische Zeehav<strong>en</strong>s: erfgoed voor morg<strong>en</strong>. Lannoo, Belgium. 181 pp.<br />
T<strong>en</strong> Brinke, W. B. M., Augustinus, P. G. E. F., Berger, G. W. 1995. Fine-grained sedim<strong>en</strong>t<br />
deposition on mussel beds in the Oosterschelde (The Netherlands), determined from<br />
echosoundings, radio-isotopes and biodeposition field experim<strong>en</strong>ts. Estuarine Coastal Shelf<br />
Sc., 40 (2), 195-217.<br />
Urbain, 1909. Carte "Mer du Nord, Dunkerke - Flessingue". Royaume de Belgique, Service des<br />
Ponts et Chaussées, re<strong>port</strong> n 687. (including updates from 11/05/1911).<br />
Van d<strong>en</strong> Eynde, D. & Fettweis, M. 2004. Modelling of fine-grained sedim<strong>en</strong>t trans<strong>port</strong> and<br />
dredged material on the Belgian Contin<strong>en</strong>tal Shelf. J Coastal Res., SI 39, (ICS 2004<br />
Proceedings).<br />
Van d<strong>en</strong> Eynde, D., Nechad, B., Fettweis, M. & Franck<strong>en</strong>, F. 2006. SPM dynamics in the<br />
southern North Sea derived from SeaWifs imagery, in situ measurem<strong>en</strong>ts and numerical<br />
22
759<br />
760<br />
761<br />
762<br />
763<br />
764<br />
765<br />
766<br />
767<br />
768<br />
769<br />
770<br />
771<br />
772<br />
773<br />
774<br />
775<br />
776<br />
777<br />
778<br />
779<br />
modelling. In: Estuarine and Coastal Fine Sedim<strong>en</strong>t Dynamics (Maa, J. P.-Y., Sanford, L.<br />
P., Schoelhammer, D. H., eds.). Proc. Marine Sc., Vol. 8, Elsevier.<br />
Van Lancker, V., Deleu, S., Bellec, V., Le Bot, S., Verfaillie, E., Fettweis, M., Van d<strong>en</strong> Eynde,<br />
D., Franck<strong>en</strong>, F., Pison, V., Wartel, S., Monbaliu, J., Portilla, J., Lanckneus, J., Moerkerke,<br />
G., Degraer, S. 2004. Managem<strong>en</strong>t, research and budgeting of aggregates in shelf seas<br />
related to <strong>en</strong>d-users (Marebasse). Belgian Sci<strong>en</strong>ce Policy, Sci<strong>en</strong>tific re<strong>port</strong> 2, 144pp.<br />
<strong>van</strong> Lo<strong>en</strong>, H., Houziaux, J-S., Van Goethem, J. 2002. The collection Gilson as a refer<strong>en</strong>ce<br />
framework for the Belgian marine fauna: a feasibility study. Belgian Sci<strong>en</strong>ce Policy, Final<br />
Re<strong>port</strong> MN/36/94, 41pp.<br />
Van Mierlo, C-J., 1897. Quelques mots sur le régime de la côte de<strong>van</strong>t Heyst. Annales de<br />
l’association des ingénieurs sortis des écoles spéciales de Gand, tome XX, 4 e livraison.<br />
Van Mierlo, C.-J., 1899. La carte lithologique de la partie méridionale de la mer du Nord.<br />
Bulletin de la Société Belge de Géologie, Paléontologie et Hydrologie, XII, 2nde série (III),<br />
219–265.<br />
Van Mierlo, C-J, 1908. Le <strong>port</strong> de Heyst. Annales de l’association des ingénieurs sortis des<br />
écoles spéciales de Gand, 4e série (I, 3).<br />
WASA Group, 1998. Changing waves and storms in the Northeast Atlantic? Bull. American<br />
Meteorological Soc., 79, 741-760<br />
Weisse, R., <strong>van</strong> Storch, H., Feser, F. 2005. Northeast Atlantic Storminess as simulated by a<br />
regional climate model during 1958-2001 and compared with observations. J. Climate,<br />
18, 465-479.<br />
23
Figure 1: The Belgian-Dutch nearshore area betwe<strong>en</strong> about Oost<strong>en</strong>de and the mouth of the<br />
Westerschelde. The map shows the major dumping sites (B&W-S1; B&W-ZO, B&W-O). The<br />
dots on the map indicate the position of box core and Van Ve<strong>en</strong> grab samples, which are<br />
discussed in the text.
Figure 2: Holoc<strong>en</strong>e deposits of the Belgian nearshore zone and the coastal plain. The<br />
ext<strong>en</strong>sion of the Holoc<strong>en</strong>e deposits in the coastal plain corresponds with the limits of the<br />
Polder. Only the Holoc<strong>en</strong>e deposits of the western coastal plain are shown in detail (from<br />
Baeteman, 2005).
Figure 3: Cohesive sedim<strong>en</strong>t facies and mud cont<strong>en</strong>t in the Belgian-Dutch coastal zone<br />
derived from rec<strong>en</strong>t (above) and historic (middle) sedim<strong>en</strong>t samples. The rec<strong>en</strong>t mud cont<strong>en</strong>t<br />
is derived from grain size analysis, whereas the historic mud cont<strong>en</strong>t distribution is based on<br />
metadata, see §3.1. Below is indicated the ext<strong>en</strong>sion of Holoc<strong>en</strong>e mud on the Belgian<br />
contin<strong>en</strong>tal shelf based on vibrocores and the areas where the Quaternary cover is less than<br />
2.5 m thick.
a)<br />
(<br />
(b)<br />
(c) (d)<br />
(e) (f)
Figure 4: Photos of Van Ve<strong>en</strong> (VV) grab (size of grab is 0.3 m × 0.2 m) and box core (BC)<br />
samples (height of core is 0.5 m), see Fig. 1 for geographical location.<br />
(a) BC sample showing mud pebbles on the surface (SV24, 19/02/2003), the core has be<strong>en</strong><br />
tak<strong>en</strong> not far from the dumping place B&W-S1; the pebbles could have their origin in<br />
deep<strong>en</strong>ing dredging works.<br />
(b) VV sample of layered Holoc<strong>en</strong>e mud covered by a thin ephemeral sand layer (MOW1,<br />
04/04/2005).<br />
(c) VV of fluid mud on top of freshly deposited mud (<strong>port</strong> of Zeebrugge, 9/11/2006).<br />
(d) VV of fine sand covered with a thin fluffy layer, (OE13, 21/02/2003).<br />
(e) BC of freshly deposited mud above medium consolidated mud, (ZB2, 19/02/2003).<br />
(f) BC (height ±45 cm) of freshly deposited to very soft mud, (OE14, 21/02/2003).<br />
Depth in Core (cm)<br />
0<br />
-2<br />
-4<br />
-6<br />
-8<br />
-10<br />
-12<br />
-14<br />
-16<br />
-18<br />
-20<br />
-22<br />
-24<br />
-26<br />
-28<br />
-30<br />
-32<br />
-34<br />
-36<br />
-38<br />
-40<br />
1.0 1.2 1.4 1.6 1.8 2.0 2.2 2.4 2.6 2.8 3.0<br />
Bulk D<strong>en</strong>sity<br />
ZB06<br />
Depth in Core (cm)<br />
0<br />
-2<br />
-4<br />
-6<br />
-8<br />
-10<br />
-12<br />
-14<br />
-16<br />
-18<br />
-20<br />
-22<br />
-24<br />
-26<br />
-28<br />
-30<br />
-32<br />
-34<br />
-36<br />
-38<br />
1.0 1.2 1.4 1.6 1.8 2.0 2.2 2.4 2.6 2.8 3.0<br />
Bulk D<strong>en</strong>sity<br />
(a) (b)<br />
Figure 5: Wet bulk d<strong>en</strong>sity profiles (kg l -1 ) of selected box cores. (a) The ZB6 sample<br />
(27/11/2002) consist of 24 cm very soft consolidated mud (1.4-1.5 kg l -1 ), which becomes<br />
more sandy in the lower part, above 29 cm of medium consolidated mud (>1.6 kg l -1 ). On<br />
top is a thin layer of freshly deposited mud (±1.3 kg l -1 ). (b) The OE14 sample (21/02/2003)<br />
consist of 1 cm fluffy layer on top of 29 cm of freshly deposited mud (1.2-1.4 kg l -1 ); below<br />
is a layer of 5 cm muddy fine sand on top of medium consolidated mud. On top is a<br />
OE14
(a) (b)<br />
Figure 6: Radiography of selected box core (Reineck corer) near the harbour of Zeebrugge<br />
(width of the core is 5 cm). Both contain freshly deposited to soft consolidated mud with<br />
typical tidal deposition structure. (a) RK0026-04 (24/10/2000) sample has a l<strong>en</strong>gth of 14 cm<br />
and be<strong>en</strong> tak<strong>en</strong> very close to ZB6 sample. (b) RK0124-14 (24/10/2000) sample has a l<strong>en</strong>gth<br />
of 13.5 cm and has be<strong>en</strong> tak<strong>en</strong> in the navigation channel towards Zeebrugge near ZB2<br />
sample.
210 Pb activity (Bq/g silt + clay)<br />
226 Ra activity (Bq/g silt + clay)<br />
137 Cs activity (Dpm/g silt + clay)<br />
0.25<br />
0.20<br />
0.15<br />
0.10<br />
0.05<br />
0.00<br />
-0.05<br />
-0.10<br />
0.40<br />
0.30<br />
0.20<br />
0.10<br />
0.00<br />
-0.10<br />
-0.20<br />
-0.30<br />
-0.40<br />
-0.005<br />
-0.010<br />
ZB06<br />
0 5 10 15 20 25 30 35 40 45<br />
Depth below the bottom (cm)<br />
ZB06<br />
0 5 10 15 20 25 30 35 40 45<br />
Depth below the bottom (cm)<br />
0.020<br />
0.015<br />
0.010<br />
0.005<br />
0.000<br />
ZB06<br />
0 5 10 15 20 25 30 35 40 45<br />
Depth below the bottom (cm)<br />
Figure 7: Total 210 Pb (above), 226 Ra (middle) and 137 Cs (below) activities in ZB6 core<br />
(27/11/2002). The bars indicate 2σ statistical error limits.
137 Cs activity (Dpm/g silt + clay)<br />
210 Pb activity (Bq/g silt + clay)<br />
226 Ra activity (Bq/g silt + clay)<br />
0.30<br />
0.25<br />
0.20<br />
0.15<br />
0.10<br />
0.05<br />
0.00<br />
-0.05<br />
OE11<br />
-0.10<br />
0 5 10 15 20 25 30 35 40 45<br />
Depth below the bottom (cm)<br />
0.5<br />
0.4<br />
0.3<br />
0.2<br />
0.1<br />
0.0<br />
-0.1<br />
-0.2<br />
-0.3<br />
-0.4<br />
0.015<br />
0.010<br />
0.005<br />
0.000<br />
-0.005<br />
-0.010<br />
-0.015<br />
OE11<br />
0 5 10 15 20 25 30 35 40 45<br />
Depth below the bottom (cm)<br />
OE11<br />
0 5 10 15 20 25 30 35 40 45<br />
Depth below the bottom (cm)<br />
Figure 8: Total 210 Pb (above), 226 Ra (middle) and 137 Cs activities in OE11 core (08/03/2004).<br />
The bars indicate 2σ statistical error limits.
Figure 9: Aggregated tr<strong>en</strong>ds in mud deposition and seafloor morphology inferred from<br />
detailed visual inspection of bathymetric changes (period 1866-1911) and mud cont<strong>en</strong>t<br />
information derived from the historic sedim<strong>en</strong>t samples (see Fig. 3).
Figure 10: Bathymetry derived respectively from 2003 surveys (above) and from surveys<br />
before 1959 (below). Significant differ<strong>en</strong>ces occur in the coastal zone and navigation<br />
channels.
Figure 11: Tidal averaged SPM conc<strong>en</strong>tration (above) and mud deposition (below) during a spring<br />
tide (left) and a neap tide (right) for the pres<strong>en</strong>t situation (2003).
Figure 12: Tidal averaged SPM conc<strong>en</strong>tration (above) and mud deposition (below) during a<br />
spring tide (left) and a neap tide (right) for the pre-1959 situation.


