Cartography Development - Technische Universiteit Eindhoven
Cartography Development - Technische Universiteit Eindhoven
Cartography Development - Technische Universiteit Eindhoven

Create successful ePaper yourself
Turn your PDF publications into a flip-book with our unique Google optimized e-Paper software.
Urban Analysis<br />
code 7W565<br />
<strong>Cartography</strong><br />
<strong>Development</strong><br />
Copyright <strong>Technische</strong> <strong>Universiteit</strong> <strong>Eindhoven</strong><br />
This material is intended for students of the <strong>Technische</strong> <strong>Universiteit</strong><br />
<strong>Eindhoven</strong> only. No part of it may be copied or distributed in any form.<br />
Lecturer: Reinder Rutgers<br />
1<br />
1
Content<br />
Using historical examples:<br />
• Functions of maps<br />
• Types of maps<br />
• Use of maps<br />
Urban Analysis<br />
code 7W565<br />
Content of the lecture<br />
The idea is that many aspects of mapping can be shown by looking at the<br />
history of mapping. This is not out of nostalgia. Our forefathers often had<br />
to cope with the same questions somebody venturing in the field of<br />
cartography faces today. Many themes are still to be found in modern<br />
maps.<br />
2<br />
2
Babylon<br />
600 B.C.<br />
Oldest known map of the world.<br />
Babylonian clay tablet ca. 600 B.C..<br />
Earth depicted as a circle with the city of Babylon in the middle (horizontal<br />
rectangle)<br />
The River Euphrate streams through the city (two lines in the middle).<br />
Other cities depicted as circles<br />
Triangle of seven islands on the edge of the world where fable animals are<br />
thought to live.<br />
The map maker was more interested in a mythical view of the world than in a<br />
geo-political representation. Babylon is linked to 'fabulous' places in the<br />
literal en figurative meaning of the world.<br />
3<br />
3
Rotterdam 1982<br />
Rotterdam as center of the world<br />
Map means:<br />
• Establishing your own position in the world. A map is a window to the world.<br />
• Power. This is reflected for instance in the fact that the new grandiose town hall of<br />
Amsterdam built in the 17th century (now a Royal Palace) has a map of the world<br />
on the floor in the great hall, showing the power of the low countries.<br />
• Knowledge<br />
• Proudness<br />
4<br />
4
Tuba City<br />
400 B.C.<br />
Fragment of the city plan of ‘Tuba’, 4th century B.C. (clay tablet)<br />
The oldest known town plan of an inhabited place dates from ca. 2000 B.C.<br />
(It has been carved in a rock face in the north of Italy)<br />
The town plan of Tuba includes directions for the defense of the town: the<br />
positions of the guards, opening times of the gates, etc.<br />
5<br />
5
<strong>Eindhoven</strong><br />
2001<br />
Map of the police districts and stations in <strong>Eindhoven</strong> (2001)<br />
A modern equivalent of the Tuba map<br />
6<br />
6
Polynesia<br />
Polynesian sea map<br />
• shells depict islands<br />
• palm twigs indicate wind directions and sea currents<br />
This knowledge is essential for survival in the Pacific. Islands can only been<br />
found with thorough knowledge of the way nature behaves.<br />
The map is used to transfer knowledge from one generation to the other.<br />
7<br />
7
Australia<br />
Holy map of Australian Aboriginals<br />
Australian aboriginals believe that the spirits of their forefathers have formed<br />
caves, lakes and water holes. The time of the forefathers is called the<br />
'dream time'. This means that for the aboriginals the landscape is sacred.<br />
The path that where followed by the forefathers are called 'dream tracks',<br />
some of them are hundreds of kilometers long. Holy maps are used to<br />
teach children about the dream time. The maps are painted on birch bark.<br />
8<br />
8
Egypt<br />
Egyptian map of the underworld<br />
Routes for the underworld painted on the inside of a coffin to help the<br />
deceased on his last journey. There is one map for the daytime (light<br />
colors) and one for the nighttime (dark colors).<br />
9<br />
9
Peutinger map 4 th century<br />
Part of a Roman roadmap 4th century<br />
11th or 12th century copy of a Roman map. The so called Peutinger map,<br />
after a German scientist.<br />
Intention of the map: a guide for traveling. The map depicts travel stages<br />
between cities, fortifications and outpostst. A traveler can estimate the<br />
distances and knows where there are possibilities for save stay overs.<br />
Topographical correctness is not of importance so the information is<br />
stretched to form ‘routes’. Other information on the map: harbours,<br />
springs and rivers are depicted with symbols.<br />
The circle on the right side of the illustration symbolizes Rome. At the bottom<br />
of it its port Ostia is shown.<br />
10<br />
10
Mabada<br />
6 th century<br />
6th century mozaik map<br />
In a church in Mabada, Jordania (east roman empire)<br />
Original size 6 x 24 m.<br />
Part that still exists: Palestina form the valley of Jordan to the valley of the<br />
Nile. In the middle Jerusalem. Central street with columns. 36 buildings,<br />
some of them are identifiable.<br />
-Upper right: the church of Theotokos. Built by the emperor Justinianus, 542<br />
-Middle Church of the holy grave (facing down in the illustration with the<br />
golden cupola).<br />
11<br />
11
Stone map China 1136<br />
Stone map from China 1136<br />
Shows China during the Nan Song dynasty and also covers a part of Korea.<br />
The big rivers are shown and the map contains 400 names of cities<br />
12<br />
12
Portolan 13<br />
13 th century<br />
‘Portolan’, sea map 13th century<br />
The word ‘Portolan’ points to a list with names of ports (Portolani) that for a<br />
long period if time was used by sailors.<br />
-North is on the upper side of the map (this was not at all a convention on<br />
earlier maps).<br />
-The map contains Loxodromes (directions on the compas) and an indication<br />
of scale. This indicates that the map was intended for practical use.<br />
-Remarkable: Sardinia has been depicted very accurate (trade, pirates,<br />
hiding place during storms?). Engeland is only shown as a rough<br />
rectangle (upper left).<br />
13<br />
13
Mappa mundi<br />
Hereford<br />
14 th century<br />
The Mappamundi of Hereford, 13th century (east is upper)<br />
A ‘mappamundi’ is schematic world map<br />
The function is symbolic and didactic 'to learn and entertain'.<br />
The Latin word 'Mappa' means cloth. The factual meaning of 'Mappamundi' is<br />
thus ‘tapestry of the world’. The English word 'map' has been abbreviated<br />
from 'mappa'. The map in Hereford Cathedral is the larges medieval map<br />
that has been preserved.<br />
14<br />
14
T-O O map<br />
14 th century<br />
So called ‘T-O’ world map,14th century<br />
-The world as a diagram with Jerusalem in its centre<br />
-Theocentrical map<br />
-The map is about its content, it says something of the world view<br />
15<br />
15
Concept from Generalsiedlungsplan Köln ln 1923<br />
Schematical representatin of Köln (Cologne) by Fritz Schumacher,<br />
Generalsiedlungsplan, 1923<br />
-A modern equivalent of the diagramatic map of the middle ages.<br />
16<br />
16
Constantinopel<br />
15 th century<br />
Map of Constantinopel, 1482<br />
Made to promote the city.<br />
The map reflects the importance and influence of the city.<br />
-The map and the buildings that are shown have the intention to convey a<br />
positive image and to inspire awe.<br />
17<br />
17
Manhattan<br />
1995<br />
Manhattan, 1995<br />
-In modern days maps are still made that have the intention to<br />
reflect the importance of a city and to promote its image.<br />
-And they also are deformed to emphasize the message, as were<br />
the old maps.<br />
18<br />
18
World map Juan de la Costa 1500<br />
World map Juan de la Costa 1500<br />
The world gets bigger (and round). Maps are used to make sense of it. To<br />
support this functions all kinds of ‘marginalia’ are depicted that explain<br />
‘strange things’ for outsiders. This map is also an indication of the power<br />
of Spain, emphasizing its claims on parts of the world.<br />
19<br />
19
Amsterdam<br />
by Cornelis<br />
Anthoniszoon<br />
1544<br />
Amsterdam 1544<br />
‘The famous merchant city of Amsterdam’. Cornelis Anthoniszoon.<br />
-The map is an expression of the pride of the city.<br />
-It is a means to promote the involvement with and attachment of the citizens with<br />
their city. The printed map was hanging in many Amsterdam homes at the time.<br />
20<br />
20
Rotterdam<br />
2001<br />
Rotterdam 2001<br />
-The modern equivalent: Rotterdam the famous merchant city, Biggest<br />
harbor in Europe and one of the biggest harbors in the world.<br />
21<br />
21
Abraham Ortelius 1570<br />
Abraham Ortelius, map of America 1570<br />
-This map was part of the very first atlas ‘Theatrum Orbis Terrarum’, made in<br />
1570 and published by Abraham Ortelius in Antwerpen. The first version<br />
had 70 maps. The word 'Atlas' was devised by the famous Antwerp map<br />
maker Mercator.<br />
- All maps have the same dimensions, have a comparable cartographic lay<br />
out and are bound in a book. Before maps where rolled up.<br />
- The atlas was thé bestseller of the 16th century and the idea was copied<br />
many times.<br />
22<br />
22
Frankfurt, Braun en Hogenberg 1599<br />
Frankfurt, Braun en Hogenberg 1575<br />
Six books with city plans ‘Civitates Orbis Terrarum’ published between 1572<br />
and 1618. Bran and Hogenberg worked in Köln.<br />
-Compromise between a diagrammatic and a picturesque city plan.<br />
-In reality many parts of Frankfurt had a much higher density of buildings<br />
and much narrower streets.<br />
23<br />
23
City panorama as marketing image<br />
Köln ln 1474<br />
'Side show': the city panorma as a way to market the city<br />
Panorama Köln 1474<br />
From Werner Rolevinck, Fasciculus Temporum. Published 1474, Wood<br />
carving. As far is known the first printed book with town views.<br />
24<br />
24
Köln ln by Braun en Hogenberg 1599 copper engraving<br />
Panorama Köln Braun en Hogenberg 1599, Copper engraving.<br />
Throgh the centuries Köln exploited its riverside panorama to promote the<br />
city.<br />
25<br />
25
Los Angels 1894<br />
Panorama, Los Angeles 1894<br />
Panoramas were very popular in America in the 19th century. They represent<br />
the same pride as the map of Amsterdam by Anthoniszoon of 1544.<br />
26<br />
26
Rotterdam 1955 Frits<br />
Frits Rotgans, Rotgans,<br />
Maashaven<br />
Panorama, Maashaven Rotterdam, Frits Rotgans, 1955<br />
In the second world war Rotterdam was devastated by a heavy<br />
bombardment. After the war the city worked hard to reestablish itself as a<br />
major harbor and succeeded in doing so. The pride of the citizens was<br />
expressed in the series of panoramic photographs of the city and its<br />
harbor made by the Rotterdam photographer Frits Rotgans.<br />
On the sideline it can be remarked that Rotgans later was criticized because<br />
his photos were clean, accentuating the gigantic works of humans rather<br />
than showing the humans themselves. In twist of fate at the end of the<br />
twentieth century this style of photography became highly popular.<br />
Especially the work of the German couple Becher has become famous.<br />
27<br />
27
<strong>Eindhoven</strong> 2007<br />
Skyline, <strong>Eindhoven</strong> 2007<br />
Every provincial city in Europe seems to think high rise building defines a real<br />
city and makes it stand out. So the profile of every provincial city is<br />
starting to look like cliché American provincial cities that all have the<br />
same type of skyline and do not stand out at all.<br />
28<br />
28
Accurate maps<br />
Imola 1502 Leonardo da Vinci Polar co<br />
Accurate maps<br />
Polar coördinates rdinates<br />
29<br />
Immola 1502 by Leonardo da Vinci Polar coordinates<br />
Da Vinci based his way of mapping on the techniques of Leon Battista Alberti<br />
(1404 - 1472) who performed measurements of Rome using polar<br />
coordinates.<br />
29
Alkmaar<br />
Jacob van<br />
Deventer<br />
ca. 1565 Triangulation<br />
Alkmaar, map by Jacob van Deventer (ca 1570) Triangulation<br />
-At the end of the sixteenth century maps are becoming more accurate,<br />
especially maps of smaller areas. Dutch and Flemish cartographers like<br />
van Deventer and Snellius play a key role in this.<br />
-Function of the van Deventer maps: military data. He was working for the<br />
King of Spain, who at that time was souvereign of the Netherlands and<br />
faced a growing opposition, leading to the Dutch freedom war that lasted<br />
from 1568 to 1648. Van Deventer made maps of all 400 cities of the low<br />
countries.<br />
-If you project his maps on the present topographical map it turns out that<br />
they are remarkably accurate thanks to his method of triangulation. The<br />
van Deventer maps where unique in this respect and where not surpassed<br />
until the middle of the eighteenth century. When comparing: keep in mind<br />
that the later defeces of Alkmaar shown on the present map where not yet<br />
constructed in 1565.<br />
30<br />
30
transition<br />
1997<br />
31<br />
31
transition<br />
1997<br />
32<br />
32
topographical map 1997 scale 1:25.000<br />
1997<br />
33<br />
33
Culemborg by<br />
Johannes Blaeu<br />
1648<br />
Culemborg by Johannes Blaeu 1648<br />
Detaild depiction of the characteristic of the town. The maps of van Deventer<br />
are geometric correct diagrams. Blaeus maps on the contrary try to<br />
convey the image of the city.<br />
34<br />
34
Idem besides the modern topographic map<br />
35<br />
35
Comparison of the map of Bleau with the modern geometric correct<br />
map.<br />
In the Blaeu map the streets have been depicted to represent the way they<br />
are percieved if you walk the streets of Culemborg (you can check this by<br />
going there). Sometimes they feel much more curved then they are,<br />
sometimes straighter. Bleaus map thus is 'cognitive' to a certain extend.<br />
36<br />
36
Westfriese omringdijk 17<br />
17 th century<br />
part of the Westfriese omringdijk.<br />
-A dike to protect the area of West Friesland in the North of Holland.<br />
-To protect the dikes had to be managed carefully. Correct maps where an<br />
important tool for this (North is left on this map). This partly explains the<br />
flourishing of cartography in the low countries.<br />
37<br />
37
1633<br />
Maps for polders<br />
By Henricus Hondius, Amsterdam 1633<br />
The polders depicted (Zijper, Beemster, Purmer, Wormer, Buikslotermeer,<br />
Broekermeer and Bijlmermeer). Where all completely new land recovered<br />
from former lakes and made dry by extensive civil works including<br />
hundreds of windmills.<br />
Maps were used to design the new land. This can be considered to be the<br />
first example of design on a regional level.<br />
38<br />
38
A different view of the world<br />
North polel Gerardus Mercator 1595<br />
A different view of the world<br />
Gerardus Mercator: Map of the north pole 1595<br />
The first map devoted to the north pole. It shows the north pole as a group<br />
of rock islands.<br />
The map can be seen as a design for the new world that yet has te be<br />
discovered. In this sense it is a kind of 'research by design', as in modern<br />
urban design. The design represents a hypothesis based on the<br />
knowledge available. This hypothesis can be adapted as knowledge<br />
increases.<br />
39<br />
39
Mollweide projection Mercator projection<br />
Cilindrical projection<br />
Equal area surfaces<br />
Mercator projection<br />
The Mercator projection has become dominant in cartography. It makes it<br />
easy for sea farers to plot a course, however, like all projections, it<br />
distorts the view of the world. Other forms of projection have been used<br />
to overcome the shortcomings of the Mercator projection. They also<br />
convey a different view of the world. In the Mercator projection the<br />
western countries in the northern hemisphere look disproportional big and<br />
Africa to small. It has been argued that this feeds the predjudice that the<br />
world is all about the developed countries and that the rest is of no<br />
particular importance. The cylindrical projection for instance depicts the<br />
dimensions of the landsurfaces but the top and bottom look very<br />
unnatural flattened.<br />
40<br />
40
Left: map 1960, right: map 1971<br />
Up until the seventies of the twentieth century the ocean floor was<br />
considered to be a kind of fairly flat and gently undulating 'desert'.<br />
The map based on research of the late sixties and published in National<br />
Geographic magazine of 1971 completely transformed our view of the<br />
ocean floor, leading to a new view of the world.<br />
41<br />
41
Map as propaganda<br />
Leo Belgicus<br />
1585 and later<br />
Map as propaganda<br />
‘Leo Belgicus’<br />
-The map depicted as the 'Belgian lion' (In that time 'Belgica' was the Latin<br />
expression used for all of the low countries, present Belgium, The<br />
Netherlands and Luxemburg)<br />
-It is an expression of the freedom struggle of the low counties against Spain<br />
-It has been printed in many alternative forms and was distributed on a large<br />
scale as propaganda for the freedom fighters that wanted to make the<br />
low countries independent. They eventually succeeded after 80 years.<br />
42<br />
42
1611<br />
Leo Belgicus turnes around<br />
-This is the expression of an internal struggle in the low countries concerning<br />
the question if a peace treaty should be negotiated with Spain. -The<br />
turned around lion symbolizes aggression and continuing the battle.<br />
43<br />
43
1780<br />
Later Leo Belgicus: only the north of the Netherlands<br />
Eventually the north and the south of the low countries where divided. The<br />
south remaining under Spanish rule, the North independent. Moreover the<br />
part of The Netherlands that is called ‘Holland’ became totally dominant.<br />
This is reflected in the new Leo Belgicus. It only covers Holland, Utrecht<br />
and Zeeland (that gave its name to New Zealand), the rest of the country<br />
is left out.<br />
44<br />
44
1940 Nazi propaganda map<br />
Nazi propaganda map<br />
1940 publicized in the propaganda magazine 'Facts in review'. This was<br />
published in America with the purpose to influence public opinion to keep<br />
America out of the war. The map suggests that the territorial claims of<br />
Germany are nothing compared to the imperialism of England.<br />
45<br />
45
1950 American map of Korea<br />
American map 1950<br />
Invasion of South Korea by North Korea. Threatening pitch black. White<br />
arrows to symbolize heroic defence (refering to the ‘white knight’ of fairy<br />
tales). The map has the intention to rally support among the American<br />
people for the American intervention.<br />
46<br />
46
Australia up above! Cilindrical map projection<br />
Australia up above!<br />
The expression 'land down under' is only based on the fact that in present<br />
maps and globes north is standard on the upper side of the map. In fact<br />
the universe has no up or down. Like the Mercator projection, the idea of<br />
'down under' looks innocent but it has in implicit connotation of 'less<br />
important'. As a reaction this map was published with the south pole on<br />
top and also in the cylindrical projection, depicting the size of the<br />
landmasses correctly.<br />
47<br />
47
Map as argument<br />
Translation: The Netherlands have the most poluted air in Europe<br />
Map as argument<br />
‘The Netherlands have the most poluted air of Europe’<br />
This map published in a Dutch newspaper is drawn in such a way - with<br />
alarming colors - that the situation looks most severe. An example of<br />
processing facts in a specific way, just like the propaganda maps of slides<br />
45 and 46.<br />
48<br />
48
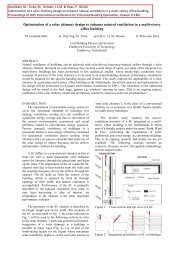
Proliferation of settlements in occupied territory<br />
Maps have always been a battleground for controvercies. This sublimates in<br />
what is portrayed and what not and how elements on the map are<br />
named.<br />
The Israelian architect Eyal Weizman uses cartography to show that official<br />
Israeli maps do not accurately show the real progress of new settlements<br />
and Israeli interventions in the West Bank and the Gaze Strip. In fact<br />
much more space has been taken up by this. He uses his own<br />
observations from airplanes and satellite photographs for this.<br />
Left: consolidated map of the West Bank. This is part of the official<br />
agreement between Isreal and the Palestinans about autonomous areas<br />
for the Palastine people.<br />
Right: Map by Weizman showing the factual settlements and safety walls<br />
build by the Israelians. It makes clear that this totally fragments the<br />
Palestinian area and that the situation differs significantly from the official<br />
agreement. Every difference in itself looks small, but the totality of these<br />
small differences is substantial. Moreover some Israeli settlements block<br />
connections between Palestine areas.<br />
49<br />
49
Map as advertisement<br />
Map as advertisement<br />
Map of Oberstdorf and the Kleinwalzertal<br />
Conveying the message: 'look what a phantastic ski resort we have'. Thus<br />
trying to influence peoples choice of destination.<br />
50<br />
50
How do I get to Ikea? Real situation<br />
How do I get to Ikea<br />
And how is the map distorted....?<br />
Right: the topographical correct dimensions.<br />
By distorting the map Ikea is conveying the massage that their <strong>Eindhoven</strong><br />
store is easy to reach and the distances are short. In fact many routes<br />
are often choked with traffic.<br />
51<br />
51
Texaco Gas<br />
Road map of<br />
Florida<br />
1927<br />
Texaco Gas Map of Florida 1927<br />
From 1923 maps where to be had free at gas stations (UK english: petrol<br />
stations). This was done to promote car travel. This tradition led to a type<br />
of road map that is simple and 'empty' up to the present day.<br />
In Europe the artistic tradition prevailed leading to elaborate maps with often<br />
beautifull graphics.<br />
52<br />
52
American map (advertisement-tradition) European map (artistic tradition)<br />
Comparison of an Amercian and European road map<br />
Left: part of Maryland Right: an area near Kassel (Germany)<br />
53<br />
53
American map (advertisement-tradition) European map (artistic tradition)<br />
Comparison of an Amerikan and European city plan<br />
Left: Queens New York, right: Frankfurt am Main<br />
54<br />
54
Map as advertisement / as depiction of an imaginary world<br />
'Outdooria'<br />
Advertisment map that suggests that a world is a limiteless, almost empty<br />
and perfect 'playground', inviting to buy products to enjoy it. Equivalents<br />
can be found in car advertisments showing cars on empty endless roads<br />
in empty countries, whereas in reality most people drive on clogged<br />
roads.<br />
55<br />
55
Imaginary world<br />
Map to facilitate phantasy<br />
Part of Middle Earth<br />
Map to facilitate phantasy<br />
A non existing world that is still well known to many people<br />
The map portrays Middle Earth form the famous book 'Lord of the rings'.<br />
56<br />
56
Map as emblem<br />
Map as an emblem<br />
Plan for Kopenhagen 1954<br />
-metaphores often play a role in urban design and planning, they make it<br />
easier to convey an idea (but can also be misleading ofcourse).<br />
57<br />
57
Map as news<br />
London 1666<br />
Map as news<br />
Londen after the great fire of 1666<br />
The map serves two purposes<br />
-Accurate survey in preparation of rebuilding the city<br />
-News for the rest of the world. It satisfies curiosity for disasters, just like TV<br />
programs do now a days. This could be called disaster cartography.<br />
58<br />
58
Enschede<br />
2000 Map of the area destoyed in the great disaster of 2000<br />
Disaster area, Enschede 2000<br />
Modern equivalent of the London map of 1666. Map showing the area of the<br />
city of Enschede (The Netherlands) destroyed when a factory of fireworks<br />
exploded in the year 2000. A complete living quarter was destroyed and<br />
there were many wounded and deaths. The hastely made map tries to<br />
convey the seriousness of the situation to the authorities and to the<br />
public in general.<br />
59<br />
59
Map as knowledge<br />
Map as knowledge<br />
Accurate cartography of France 1693<br />
By the French academy of sciences.<br />
Blue line: the outline of France as shown on maps up until that moment,<br />
Black line: the accurate contour of France as established by accurate<br />
measurement.<br />
France 'loses' the largest piece of land in its history!<br />
60<br />
60
1832 1:2500 / 1: 1250<br />
Kadaster map of <strong>Eindhoven</strong> 1832<br />
-From the end of the 18th century accurate cartography really takes on. In<br />
particular France plays a great role in this development.<br />
-Maps mean power and the French kings were fully aware of this, they<br />
promoted cartography, unintentionally paving the way for Napoleon. His<br />
success is attributed by military historians to the fact that he possessed<br />
excellent maps allowing him to take full advantage of a situation in the<br />
filed and thus able to outsmart his opponents.<br />
-One of the legacies of the Napoleontic area is the public Kadaster. This was<br />
founded with the intention to register land ownerschip for the purpose of<br />
leveying taxes by the gouvernment. The Kadaster made accurate maps of<br />
the whole country.<br />
61<br />
61
ca. 1830 1:25.000<br />
Hand drawn map of the southern part of The Netherlands on a scale<br />
of 1:25.000. 1830<br />
These accurate topographic maps were made by military officers in a short<br />
period of time when there was a state of war between The Netherlands<br />
and Belgium who had declared itself independent. The maps formed the<br />
basis of:…. (see next slide)<br />
62<br />
62
ca.1850 published since 1860 1:50.000<br />
…Militaire Topografische kaart 1:50.000 (Military and topographic map of the<br />
Netherlands on a scale of 1:50.000) 1865<br />
-A second heritage of the Napoleontic area was the topographic service, producing<br />
accurate maps for military and general use.<br />
-The first printed accurate detailed topographic map of the Netherlands was published<br />
from 1865 onwards. It is based on the hand drawn maps of 1830 and field work<br />
between 1845 and 1855.<br />
-This is still a very important map, and thus it is still reissued in facsimile. The<br />
importance lays in the fact that it is invaluable in studying landscape structures,<br />
geology, soil structures and historic developments.<br />
63<br />
63
Since 1894 1:25.000<br />
First colored topographic map of The Netherlands 1894 1:25.0000<br />
This was made possible by the invention of lithography by Senefelder.<br />
However the size of the printing stones was limited, making it necessary<br />
to order the maps in a new system that deviated from the numbering of<br />
1865. The 1894 maps are in Dutch also known as 'Bonnebladen'. After<br />
1940 the topographic service returned to the original numbering because<br />
at that time Lithographic presses using aluminium plates where able to<br />
print large formats.<br />
64<br />
64
1996<br />
Topografical map 1:25.000 1996<br />
65<br />
65
Mount Everest 1988 drawn by Swiss cartographs<br />
Swiss cartographs elevated the topographical maps mountain areas to works<br />
of art. Eventually their style also influenced Dutch topographic maps, not<br />
in so much in the 'Dutch mountains' (that do not exist), but in the cleaner<br />
look of the maps since the late eighties of the twentieth century.<br />
66<br />
66
First geological map<br />
William Smith<br />
1815<br />
First geological map William Smith 1815<br />
15 copper engravings. Total size 2,60 x 1,80 meter.<br />
This map gave a revolutionary view of Britain, it raised many questions and<br />
eventually thoroughly shook the believe that the earth had been created<br />
in seven days and had been the same ever since.<br />
67<br />
67
Geological map Soil map<br />
Example of the geological maps and soil maps of The Netherlands<br />
The fact that The Netherlands are flat does not say that geology is of no<br />
importance. On the contrary: in the river delta that the country in<br />
essence is, the geology changes much faster than in mountainous areas.<br />
68<br />
68
Map as knowledge = power<br />
Map as knowledge / map equals power<br />
German map of the area around Duinkerken (Dunkirk) 1940<br />
Why did the German panzers halt just before Duinkerken allowing much of<br />
the British expeditionary army to escape? This is a question that always<br />
has puzzled historians. Many sought the answer in the sphere of politics<br />
or psychology. There is however a plausible physical explanation. The<br />
German high command used this soil map of Belgium in planning their<br />
campaign. The blue area on the map depicts clay (so called 'Ieper clay').<br />
This is bad terrain for tanks because it is water logged and tanks tend to<br />
sink in it, especially with some types of weather. Possible this made the<br />
high command hesitate to send tanks in it. Commanders in the field did<br />
not have this information and could not understand the decision of the<br />
high command.<br />
69<br />
69
Map as a tool for research<br />
John Snow<br />
1855<br />
Map as a tool for reseach<br />
Proliferation of cases of Cholera near the Broad Street Pump<br />
A map made by doctor John Snow<br />
- In Engeland accurate mapping of cities was driven by considerations of<br />
hygiene<br />
- The commission that was established in 1834 to fight the proliferation of<br />
contagious diseases soon discovered that improvements could only be<br />
achieved if accurate maps were available.<br />
- Generally it was believed that diseases where spread by smell. John Snow<br />
had the suspicion it was probably water. He mapped all the death cases in<br />
an area of London and discovered they where far more numerous around<br />
Broad Street pump. His conclusion was that the disease was carried by<br />
the water of that pump. This was later confirmed when it turned out that<br />
also at the source of the water of the pump many had died of cholera.<br />
- This map is an early example of socio-geographical research an as thus a<br />
precursor of later research in planning and design.<br />
In the Netherlands in 1862 doctor M.F.Onnen performed a comparable<br />
research in the city of Dordrecht. His map showed that the cases of<br />
Cholera where related to polluted water in the canals of the city<br />
70<br />
70
Fire insurance map<br />
Leeds<br />
1886<br />
Fire insurance map of Leeds 1886<br />
-The data on the map are of importance in establishing the height of the<br />
premiums that have to be paid for fire insurances. Shown are for instance<br />
the vicinity of pumps and water and on the one hand buildings with fire<br />
resistant walls and roofs on the other hand combustable buildings.<br />
-This knowledge gives insurance companies an advantage.<br />
- This is still the case today: insurances can flourish because they do know<br />
more of the real risks then their customers who just perceive risk.<br />
- Better cartographic base maps made these type of maps possible<br />
71<br />
71
Map of London Poverty 1891<br />
Map of London poverty 1891<br />
-The map as a tool for policy and a way of evoking action. Maps made the<br />
extend of the poverty of the industrial age visible.<br />
72<br />
72
Examples of so called Choropleth maps<br />
A well known form of depicting spatial data but also a very dangerous form.<br />
See Monmonier, 'How to lie with maps' for an explanation.<br />
These type of maps are also refered to as 'cartograms'<br />
73<br />
73
Example of a cartogram: shops and services in a street<br />
Köln Venloer strasse. The map is augmented by photographs to convey the<br />
message that the atmosphere of the street is not just about ‘dry data’.<br />
74<br />
74
Schipping<br />
North sea<br />
24 hours<br />
Shipping in the North Sea during a 24 hour period<br />
Established by tracking signals that ships use for satellite navigation.<br />
Mobile phones have been used to establish the flow of traffic. The map shows<br />
a world that is not visible on normal maps, where the see looks empty.<br />
75<br />
75
Distance Travel time<br />
Distance to the town of Lille<br />
Left: absolute distance as the crow flies.<br />
Right: equal travel times distort the absolute distances. (red circles<br />
represent equal absolute distances)<br />
76<br />
76
Descicion support tool<br />
Mapping as a decision support instrument<br />
Source: De Volkskrant 24-11-2007<br />
As has been shown in the previous slides maps can have many functions,<br />
meanings and connotations. This is an important notion, but leaving this<br />
aside for a moment, in essence a map can be seen as a way to visualize<br />
relating data. This can be spatial data but also not-spatial data. Thus<br />
ideas, organizations or processes can be mapped out. This can be a<br />
powerful tool. This example maps out the arguments pro and contra<br />
making discharge of employees easier for employers. The map shows that<br />
some decisions are related and cannot be made independently of each<br />
other. The power of visualizations is based in the fact that over 50% of<br />
our brains is devoted to processing visual information.<br />
77<br />
77
Maps in Urban Design and Planning<br />
Maps play an important role in urban design and planning. In many ways it is<br />
all the designer has (that is to say: if one includes all types of visual<br />
representations in the word 'map') as the urban environment is not an<br />
object that can be manipulated as a work of art or can be perceived as a<br />
building. For the researcher it is a primary means to obtain overview and<br />
structure the data. This makes it of utmost importance that professional<br />
master mapping to an extend that is adequate for their specific purposes.<br />
It is no wonder that throughout the history of planning and urban design<br />
much attention has been given to maps and illustrations.<br />
78<br />
78
Extension plan Haarlem1644<br />
Plan for the extension of Haarlem 1644<br />
Already in the seventeenth century maps were invaluable in urban design in<br />
The Netherlands. The building boom of that period perhaps is the root of<br />
the tradition of urban design and planning in the Netherlands<br />
79<br />
79
Leonard Springer<br />
Design for a<br />
cemetery<br />
Hilversum<br />
1889<br />
Leonard Springer design for a cemetery in Hilversum 1889<br />
Naturalistic drawing. A very clear way to show the design, no legend<br />
nescessary.<br />
80<br />
80
H.P. Berlage<br />
Amsterdam Zuid<br />
1915<br />
Map of the design of Amsterdam Zuid, 1915, H.P. Berlage<br />
-Highlight of urban design according to artistic principles in The Netherlands.<br />
Getting international acclaim, but dissapproval by Dutch modernistic<br />
architects. Now a days it is a highly valued district of Amsterdam. The<br />
map is in the tradition of urban design drawings in the 19th century.<br />
81<br />
81
H.P. Berlage<br />
Amsterdam Zuid<br />
1915<br />
Birds eye perspective of Berlages plan<br />
The plan for Amsterdam Zuid was complemented with birds eye perspectives.<br />
These convey the intention of the designer.<br />
The perspectives can be seen as a far echo of the 1544 plan of Amsterdam<br />
by Anthonisszoon.<br />
82<br />
82
Köln ln<br />
Design for a<br />
green structure<br />
F. Schumacher<br />
1923<br />
1923, Köln (Cologne), Design for a green structure, Fritz Schumacher<br />
One of the earliest thematic designs in urban planning. Also a beautiful<br />
example of mapping in black and white. Many students of planning and<br />
urban design tend to make too much use of color on their maps.<br />
83<br />
83
1923 Köln K ln design for part of the city F. . Schumacher<br />
1923, Köln, Design for part of the city, Fritz Schumacher<br />
The use of perspective and detailed drawings convey the intention of the<br />
designer. Although Schumacher also made designs on what could be<br />
called the 'abstract planning level' he did not forget that eventually the<br />
environment was no abstraction had to look right. This is expressed in the<br />
maps and drawings.<br />
84<br />
84
1930 Amsterdam<br />
Preliminary design for the Algemeen Uitbreidings Plan (AUP)<br />
1930 , Amsterdam, preliminary design for the A.U.P.<br />
The famous General Extension Plan of Amsterdam (Algemeen<br />
Uitbreidingsplan Amsterdam A.U.P.), icon of the international modern<br />
movement in Architecture, was preceded by extensive research and<br />
preliminary plans.<br />
-The plan consists of districts for which the surface area, number of<br />
inhabitants and number of dwellings are given. It reflects the abstractness of<br />
the modern approach. It marks the start of modern spatial planning. The<br />
problem with this approach that the urban design of the living quarters could<br />
go any way, numbers hardly give any clue of the quality of the spaces that<br />
are designed within their confines.<br />
85<br />
85
1934 AUP<br />
A.U.P., 1934<br />
The well known map reflects the abstractness of the approach. Sometimes<br />
also referred to as a 'rational' approach. In that case 'rational' stands for<br />
a specific type of rationality in which the way space is experienced plays<br />
no role. However the picturesque medieval city image could also be called<br />
'rational', be it in a different meaning, because it is based on the<br />
rationality of everyday interaction with the environment and adapting it to<br />
human needs.<br />
86<br />
86
1936 v.d. v.d.<br />
Broek, Broek,<br />
competition design ‘goedkope goedkope arbeiderswoningen’<br />
arbeiderswoningen<br />
Isometric drawing of a design for a living quarter<br />
Submission by the architect v.d.Broek for a competition to design cheap<br />
housing for workers, 1936 (prijsvraag goedkoope arbeiderswoningen<br />
gemeente Amsterdam). A design according to modernistisc principles.<br />
The abstractness of the drawing reflects the abstractness of thinking.<br />
Modernist deliberately rejected perspective drawing in favour of<br />
planimetric mathematic projections. In their view this reflected better the<br />
universal and abstract values architecture should stand for and the<br />
multidimensionallity of architecture.<br />
87<br />
87
1937 Aerial photograph Amsterdamse bos<br />
Aerial photograph<br />
The mega park Amsterdamse Bos (Amsterdam forest), part of the AUP.<br />
Photograph 1937. Aerial photography had a profound influence on the<br />
way we percieve the earth. Being novel and modern, the modernist<br />
embraced this new technique. Le Corbusier went as far as writing a<br />
special booklet about it, pronouncing that finally aerial photography would<br />
make urban design 'scientific' and 'rational'.<br />
88<br />
88
ca. 1990 Orthogonal areal photograph in color<br />
Orthogonal aerial photograph in color<br />
Of special interrest for mapping, planning and urban design are orthogonal<br />
aerial photographs. This technique was extensively used for military<br />
reconnaissance in the second world war and has been invaluable since.<br />
Because of the costs photographs where taken in black and white but<br />
from the end of the eighties of the twentieth century it became normal<br />
practice to take colored photographs. Professional aerial photographs are<br />
taken in late autumn or early spring to reveal the structures beneath<br />
trees. In recent years detailed satelite photographs have become<br />
available. Google Earth and Windows Life satellite photo's are taken in<br />
summer. It looks nice for the layman but is a disadvantage for<br />
professional use. Als their resolution is low compared to professional<br />
photographs. On the other had the availability revolutionizes the use of<br />
maps.<br />
Besides photographs depicting the visible spectrum there are photographs in<br />
other frequency bands making it able to analyze all sorts of data. For<br />
instance infrared aerial photographs are used to analyze the health of<br />
trees in cities. However these type of data are often very expensive.<br />
89<br />
89
Areal photograph Irrigation Tuscarora, Nevada<br />
Irrigation fields, Tuscarora, Nevada<br />
Aerial photographs have numerous technical applications, but they can also<br />
make us aware of the way we interact with the earth. American<br />
photographer Alex MacLean has devoted many years of aerial<br />
photography to showing how the American landscape is transformed by<br />
human interaction, always fascinating but often also alarming.<br />
90<br />
90
Renaturalisation of the river Beerze near <strong>Eindhoven</strong><br />
Renaturalisarion of the river Beerze<br />
The photographs of <strong>Eindhoven</strong> aerial photographer Karel Tomei document the<br />
way the Dutch people have interacted and still interact with the<br />
landscape. Perhaps more than any other country The Netherlands are<br />
made by man. This photograph shows a river near <strong>Eindhoven</strong> that in the<br />
middle of the twentieth century was made from a meandering stream into<br />
a canal to facilitate quick discharge of rainwater for agricultural purposes.<br />
Recently the ideas on irrigation as well on landscape have changed and<br />
now the river has been given an 'natural' form again.<br />
91<br />
91
C. van Eesteren<br />
Design<br />
Lelystad newtown<br />
1964<br />
1964 Design for the Lelystad newtown by C. van Eesteren<br />
The city as an abstract schema. The best possibilities to realize an abstract<br />
schema are of course if a completely new town has to be built, especially<br />
when it is on completely new and empty land reclaimed from the sea as<br />
in this case.<br />
Eventualy the city was not built exactly to van Eesterens plans, although the<br />
definitive plans where just as abstract. Nowadays it is a problematic city,<br />
epitome of the failure of an abstract approach.<br />
92<br />
92
2e nota<br />
Ruimtelijke<br />
Ordening<br />
1966<br />
Tweede Nota over de Ruimtelijke Ordening 1966<br />
(Translation: second bill on spatial ordening, 1966)<br />
The modern approach to planning lead to a number of government bills<br />
outlining the way the country should be spatially zoned and managed.<br />
These where internationally regarded as being at the forefront of spatial<br />
planning.<br />
The second bill on spatial planning in the Netherlands 1966 contained a plan<br />
for a network of motorways. The map reflects the abstract 'scientific'<br />
approach advocated by planners.<br />
93<br />
93
Projektburo<br />
Almere<br />
Design for<br />
Almere newtown<br />
1976<br />
1976 Design of the general structure of Almere New Town<br />
The lines on the map have become a bit more sinuous under the influence of<br />
changing times ('the seventies') but the design is still an abstract<br />
schema. The map reflects this with harsh colors and abstract textures.<br />
The individual urban designer has made way for an anonymous design team<br />
and 'management' - although that word was not yet used in that time.<br />
94<br />
94
Strcutuurschets<br />
verstedelijking<br />
1977<br />
Structuurschets voor de verstedelijking 1977<br />
Translation: structure sketch for the urbanization of the Netherlands, 1977.<br />
Map reflecting a more cautious approach than the Tweede Nota Ruimtelijke<br />
Ordening of 1966. 'Blobs' in stead of bold lines and zones on the map<br />
showing that not everything in real life is ‘exact’.<br />
95<br />
95
Globale<br />
structuur-<br />
schets<br />
Benelux<br />
1986<br />
Benelux* Global Structure Sketch 1986<br />
These type of maps, that also can be found in many international reports,<br />
have a remarkable resemblance with the schematic medieval maps. One<br />
could also say that they do not so much depict real geopgraphical space<br />
as symbolic space.<br />
* Cooperation of Belgium, The Netherlands and Luxemburg<br />
96<br />
96
1988 Conceptual design ‘Kattenbroek<br />
Kattenbroek’ Amersfoort Ashok Bhalotra<br />
Conceptual design of the new city quarter Kattenbroek, Ashok<br />
Bhalotra, 1988<br />
In the eighties of the twentieth century the expressive sketch appears as a<br />
way to design a ‘living environment’ and 'atmosphere' in stead of just<br />
'housing'. It is an attempt to move away from rational planning that leads<br />
to uniform living environments. It also is an attempt to make the<br />
profession more 'artistic', but not in the sense urban designers of the<br />
start of the twentieth century where artistic. This 'design' gives no clue at<br />
all about the way real space will be percieved by the inhabitants. In that<br />
sense it is just as abstract as earlier modernistic designs. The way it is<br />
executed is highly dependent of the way the process of realization is<br />
organized and the persons involved. The expression of the drawings is<br />
meant to set the tone for this process.<br />
97<br />
97
Tilburg<br />
Dongewijk<br />
1993<br />
1993 design for Dongewijk Tilburg<br />
This still has an artistic feel about it, but it also is clear about the concrete<br />
design of buildings and public space.<br />
98<br />
98
<strong>Eindhoven</strong><br />
Flight Forum<br />
1996<br />
1999 <strong>Eindhoven</strong>, Flight Forum, design by the bureau MVRDV<br />
The Flight Forum is an industrial estate near <strong>Eindhoven</strong> Airport.<br />
At the very end of the twentieth century computers are becoming powerful<br />
and at the same time affordable enough to come within the reach of all<br />
architects and urban designers.<br />
On the one hand this leads to photo realistic visualizations on the other hand<br />
to something that could be called 'Photoshop design'. Things that look<br />
great on the computer screen, but what will they be in reality?<br />
99<br />
99
Utrecht, Vondelpark<br />
Mecanoo 1998<br />
Utrecht Vondelpark, design by Mecanoo Architects 1998<br />
Computer drawings can be very adequate if the right expression is chosen. A<br />
very common mistake is to use drop shadows for buildings in stead of<br />
realistic shadows. Drop shadows makes them look like pieces of paper<br />
hovering over the map.<br />
100<br />
100
‘Netwerkstad Noordholland’<br />
Arcadis 2000<br />
Study Network City Noord Holland, Arcadis 2000<br />
Dark colors used to make specific roads and areas stand out. This has<br />
become very much a fashion since computers have made it easy to draw<br />
that way. It is however known from literature that using a black<br />
background leads to misinterpretations by the users of the map. If<br />
printed it uses a lot of ink, which is questionable from the environmental<br />
point of view. A common mistake is to leave the white edges of printed<br />
dark maps en stead of trimming them the result is ugly.<br />
101<br />
101
Deventer, Regionaal landschapsplan, H+N+S 2000<br />
Deventer: regional landscape plan, H+N+S 2000<br />
A map with a hand drawn expression emphasizing the 'natural' aspects of the<br />
plan.<br />
The map can either have been hand drawn completely, or a base drawing has<br />
been made that has been photographed or scanned which has<br />
subsequently been processed by computer or it has been drawn directly<br />
on a computer tablet. The method is in principle of no importance, the<br />
result counts.<br />
102<br />
102
5e nota R.O. Networks<br />
5e Nota Ruimtelijke Ordening 2000. Networks<br />
The 5th bill on spatial ordering has a so called 'layered approach'. The spatial<br />
environment is seen as a stack of layers, the main ones being networks,<br />
occupation and ground.<br />
The map of the layer 'Network' has beside it maps of the sub layers 'Primary<br />
artificial water defenses', 'railways', 'waterways'. Emphasizing their<br />
importance.<br />
After a period of 'vague' maps, the whole map again has the 'scientific'<br />
expression of earlier Dutch planning maps.<br />
103<br />
103
Role of the map in<br />
modern stedebouw<br />
(urban design and<br />
planning)<br />
stedebouw: from prescription to description<br />
Role of the map in modern stedebouw (urban design and<br />
planning)<br />
'Constellation'<br />
Stedebouw is more and more becoming an explenatory discipline, or to put it<br />
in other words: it is becoming more descriptive in stead of prescriptive.<br />
Research and design are combined to make sense out of the chaos that is<br />
our modern environment. The question is not if the patterns that are<br />
identified are real in the physical sense of the world, they must be<br />
instrumental in communication about our environment and in determining<br />
the strategic actions to be undertaken. The difference between physical<br />
world and the sense we try to make of it forces us to be very cautious,<br />
this approach should not lead to castles en thin air.<br />
A metaphor for this can be the way sense is made of the night sky by<br />
identifying figures that can be easily remembered. It also is a metaphore<br />
for the fact that different readings can be given of the same constellation<br />
(different cultures have different readings of the sky).<br />
This illustration is from a report for the city of Tilburg in 1994.<br />
104<br />
104
City form Tilburg 1996<br />
Stadsvorm Tilburg 1996 (City Form Tilburg)<br />
Concepts<br />
Cartograms<br />
A way to compare the spatial implications many different viewpoints on the<br />
actual and desired development of a city is to represent them in a similar<br />
way and at the same scale on a base map. In this case the ideas have a<br />
general character and are not very specific. This is why an abstract<br />
background has been chosen. The figures represent consequences from<br />
bills at several levels of government, traffic research, plans for the green<br />
structure, plans for intermediate areas in the city, etc.<br />
From the book 'Stadsvorm Tilburg' By Kees Doevendans, Reinder Rutgers and<br />
Jan Luiten, 1996.<br />
105<br />
105
Köln Historisch-topographische Atlas 2001<br />
Köln Historisch-topographische Atlas 2001<br />
Historic-topgraphical atlas of Cologne. Besides this spatial atlas there is also<br />
an historic atlas.<br />
In recent years many cities have commited atlases to boost knowledge of the<br />
city and attachment to the city. This can partially be seen as a reaction to<br />
globalization that tends to de-identify place but is also an expression of<br />
the trend towards more descriptive stedebouw (urban design and<br />
planning). Atlases can provide input for urban designs that are more<br />
geared to the specific context.<br />
This slide: Roman period of Köln<br />
106<br />
106
Köln Historisch-topographische Atlas 2001<br />
Defenses in the 19th century<br />
107<br />
107
Köln Historisch-topographische Atlas 2001<br />
Broadcast organizations and facilities in Köln<br />
Modern city atlases in many instance not only cover artefacts but also<br />
'invisible' aspects. This is an example from the Köln atlas:<br />
Köln is an important media city with several broadcast organizations and<br />
production companies.<br />
108<br />
108
Köln Historisch-topographische Atlas 2001<br />
Köln marathon 1998<br />
Big events can partially define a cities image and identity. Marathons are<br />
seen by many big cities to be a means to promote the city. But the image<br />
of Köln is more closely linked to the big Carnival that takes place yearly.<br />
The Köln atlas comprizes also maps about the well known spatial aspects like<br />
green structure, industry, etc, And besides that maps and descriptions of<br />
the main districts of the city.<br />
109<br />
109
Xaveer de Geyter ‘After-Sprawl’ 2002<br />
Flanders<br />
Xavier de Geyter:'After Sprawl' 2002<br />
City triangle Brussel-Antwerpen-Gent<br />
De Geyter used <strong>Cartography</strong> as an means to explore the differences in spatial<br />
structures in several European countries. These differences are an<br />
expression of different attitudes towards use of space and spatial policy.<br />
The difference between The Netherlands become very clear. In Belgium<br />
private landownership and the freedom to build everywhere one likes<br />
prevails. In The Netherlands the distribution of space has always been a<br />
matter of planning and Governmental policy.<br />
This leads to a pattern of ribbon settlements in Belgium and to clearly<br />
defined boundaries between open space and built up areas in The<br />
Netherlands. Both approaches have their pros and contras. In The<br />
Netherlands ground prices are very high due to the shortage of building<br />
ground created by the restrictions on building in open space, Also<br />
government has always interfered with the architectural style of building.<br />
Leading to architectural design that has found much international acclaim<br />
under architects, but their taste differs considerably from the taste of the<br />
average citizen. On the other hand the zoning of the land is fairly<br />
functional and attractive open landscapes have been preserved to be<br />
enjoyed by all. In Belgium it has always been fairly easy and cheap to<br />
build your own home in the place you like. Also the freedom to build in<br />
the style you like is much greater. On the other hand the countryside has<br />
become clogged with sprawl and roads, there is not much open space and<br />
there are not many places that are serene and quiet.<br />
110<br />
110
Xaveer de Geyter ‘After-Sprawl’ 2002<br />
The Netherlands<br />
Western part of The Netherlands at the same scale<br />
The ring of cities in the western part of the Netherlands is also refered to as<br />
'Randstad', which literally translates as Edge City, however this<br />
expression has acquired a specific meaning in English so 'Ring City' would<br />
perhaps be a better translation.<br />
111<br />
111
Xaveer de Geyter ‘After-Sprawl’ 2002<br />
Overview of the regions that where explored<br />
From left to right: London, Randstad, Flemisch city triangle, Triangle Basel-<br />
Zürich-Bern, Veneto.<br />
From top to bottom:<br />
-Built Space<br />
-Infrastructure<br />
-Negative space<br />
-Nature<br />
-Agriculture<br />
-Water<br />
112<br />
112
Atlas Zuidelijk-West-Vlaanderen 2002<br />
Atlas Zuidelijk-west Vlaanderen 2002<br />
Atlas of the region South West Flanders<br />
Analysis of the post-industrial landscape around Kortrijk<br />
This is a so called 'Eclectic atlas', after the ideas of Stephano Boeri. This type<br />
of atlas is a collection of studies that do not strive to provide one spatial<br />
image of an area. In stead the multiplicity of the environment is the<br />
starting point. It is expressed in the multiplicity of the contributions.<br />
Besides maps the Atlas Zuidelijk-west Vlaanderen contains photographic<br />
studies, partial studies and 'samples' out of the study area.<br />
113<br />
113
Atlas Zuidelijk-West-Vlaanderen 2002<br />
Analysis of the routes between Roeselare and Tielt<br />
114<br />
114
Atlas Zuidelijk-West-Vlaanderen 2002<br />
Example of a 'Sample' taken from the area<br />
A characteristic strech of road between Roeselare and Torhout.<br />
115<br />
115
Netzstadt 2003<br />
Netzstadt 2003<br />
Network City<br />
Oswald en Baccini, Schweiz (Switserland)<br />
An attempt to gain insight into the territorium via graphical techniques. In<br />
this case the region of Luzern.<br />
As usual with Swiss books it looks very smart on paper, however many of the<br />
maps represent data that have been calculated using algorithms based<br />
ratios been certain numbers. It is questionable if this provides a clear and<br />
dependable insight, especially if the outcomes calculations cannot be<br />
linked to interventions or designs. Some maps just seem to be<br />
complicated ways to represent aspects - like density - that would also be<br />
clear on well made more conventional maps that would have the added<br />
advantage of linking the insight to the real topography.<br />
116<br />
116
Netzstadt 2003<br />
Examples from ‘Netzstadt’<br />
Showing maps based on mathematically transformed data.<br />
117<br />
117
Euroscapes 2003<br />
Urban Areas<br />
Interregional cooperation<br />
Euroscapes 2003<br />
Sources of finance within the EU<br />
Trans European Networks<br />
Common Agriculture Policy<br />
This publication explores the spatial characteristics of modern Europe,<br />
homing in on questions like: what is the state of coöperation between<br />
nations, how do trans European networks develop.<br />
118<br />
118
Euroscapes 2003<br />
Bounderies<br />
divide natural<br />
landscapes<br />
Borders devide natural landscapes<br />
Landscapes have no borders, but political history has devided them.On the<br />
other hand borders also have led to the preservation of landscapes<br />
because they were ‘on the edge’ of countries.<br />
119<br />
119
Euroscapes 2003<br />
Economic accessebility versus geography<br />
Geography deforms the costst of travel. It is cheaper to travel from London<br />
to Barcelona then to Edingurgh.<br />
This is a variation on the map that shows the distortion of geography by<br />
travel time.<br />
120<br />
120
KAN atlas 2003<br />
‘position in the world’<br />
De Grote KAN Atlas 2003<br />
The big KAN Atlas. KAN: Knooppunt (=Node) Arnhem Nijmegen.<br />
The Atlas claims to be a 'Mental atlas of the urban network Arnhem -<br />
Nijmegen'. The title is more a declaration of intention then a correct<br />
description of the content.<br />
Intention 1: 'Mental' only refers to the minds of the researchers, there is no<br />
underlining research concerning the mental maps of the inhabitants of the<br />
region. There is also no indication of the relation between the maps and<br />
reality.<br />
Intemtion 2: 'Urban network'. This is a fashionable statement imposed upon<br />
the two cities - a common occurrence with many cities as 'network' is a<br />
fashionable word. In fact the region is not a network, but the atlas tries to<br />
depict it as a network. Something could be said in favor of this: maps can<br />
serve to express intentions. However it is not acceptable when this is not<br />
clearly expressed.<br />
The atlas is in interesting attempt to grasp the complexity of a region. It also<br />
devotes considerable attention to culture and heritage.<br />
This slide:<br />
A classic style figure<br />
Showing a city as the centre of the world is the oldest style figure in<br />
mapping. It is still widely used as in the KAN atlas.<br />
121<br />
121
KAN atlas<br />
Much attention for cultural history<br />
The word cultural history is a translation of the Dutch word 'cultuurhistory',<br />
this is not only about art ore folk customs but also about the occupation<br />
of the land. A logical extension given the fact that most of the country is<br />
artificial.<br />
In this example old riverbeds of the river Rhine are shown. Even in the<br />
distant past the riverbed this big river was changed by human<br />
intervention to tame the water.<br />
122<br />
122
KAN atlas<br />
Things that cannot be seen but linger in the mind<br />
The 'Genius Loci'*, or 'spirit of the place' represents the aspects that make a<br />
place unique, they make a place stand out from anonymity and make it<br />
possible to experience a bond with it. During the second wold war the<br />
region around Arnhem was the theatre of war of the notorious Operation<br />
Market Garden. This is linked to features in the natural and urban<br />
landscape. It represents a long lasting 'heritage in the mind'.<br />
*This is a well known expression form professional architecture and urban<br />
design. Those following this course are expected to know what it means.<br />
123<br />
123
KAN atlas<br />
Different cultural groups<br />
An attempt to a different approach of the spatial environment<br />
124<br />
124
KAN atlas<br />
A typical sign of our time: ranking, naming 'highlights', or 'top locations'<br />
125<br />
125
KAN atlas<br />
....logo's<br />
It is indisputable that modern visual commerce invades our unconsciousness.<br />
Research has shown that even very young children recognize a significant<br />
number of logo's. So logo's are definitely a part of our mental image. One<br />
can ask oneself what is the relation between logo's, real buildings and our<br />
mental image. Do we really link logo's to a mental spatial image or do<br />
they 'hang in abstract space'.<br />
126<br />
126
KAN atlas<br />
Aspects are linked to neigborhoods (example)<br />
In the atlas many aspects are linked to neigborhoods. These are in fact<br />
choropleth maps. This leads to nice looking pictures. -The cartography<br />
however is completely unclear.<br />
-The use of color is bad in many aspects. See the theory of MacEachren to<br />
identify the errors.<br />
-The criteria are unclear. Did they use the mathematical average, the median<br />
or a weighed avarage to establish the 'color' of an area on the map?<br />
-It is also unclear what it means if an neigbourhood is stamped with a certain<br />
type of sport. If it is 'Tennis' does that mean that all public space is<br />
covered in gravel? If it is 'Shooting' does that mean that all visitors of an<br />
area are considered to be targets?<br />
Modern techniques make it easy to produce a lot of maps in a relatively short<br />
time, but making meaningfull and usefull maps is a different story.<br />
127<br />
127
KAN atlas<br />
'Secret map' (geheime kaart)<br />
Last map in the atlas. Without any explanation or legend. It is supposed to<br />
describe legends and myths of the area. Bad minds could call it a cheap<br />
attempt to suggest profoundness.<br />
128<br />
128
Limes atlas 2005<br />
Limes Atlas 2005<br />
Editor: Bernard Colenbrander<br />
Between 0 and 400 A.C. the Rhine formed the border or 'Limes' of the Roman<br />
empire. It is an important archeological heritage of The Netherlands,<br />
however it is almost totally unvisible in the present landscape. The Limes<br />
Atlas is a detailed record of everything that is presently known about the<br />
Limes and its fortifications. The idea is to make it better known and to be<br />
a incentive to use this heritage to enrich planning and design. It could<br />
contribute to more 'Genius Loci'.<br />
This slide:<br />
Military fortifications along the Limes<br />
129<br />
129
Limes atlas 2005<br />
Buildings, Settelments (examples)<br />
Left: the principia (headquarters of a military camp) situated on the site of<br />
the Medieval Dome Church of Utrecht.<br />
Right: The civil city of Nijmegen in 170 A.C. (top) and Voorburg 125 A.C<br />
(bottom).<br />
130<br />
130
Limes atlas 2005<br />
Nijmegen 200 A.C. and 400 A.C<br />
Two maps from a series showing the development of the Roman military<br />
settlement and the civil city at Nijmegen.<br />
131<br />
131
Limes atlas 2005<br />
Leiden Region. Comparison between the years 200, 1200, 1650,<br />
1900 and 2000<br />
132<br />
132
Den Haag 1908-2030 2006<br />
Den Haag 1908-2030 2006<br />
An atlas providing an overview of all major plans for Den Haag. A multitude<br />
of plans and ideas has been translated to the same scale and the same<br />
graphic representation.<br />
Shown in this slide: The plan made by Berlage in 1908 for the extension of<br />
Den Haag. Planm shown in red. Den Haag of that time in black. Present day<br />
Den Haag in gray.<br />
133<br />
133
Den Haag 1908-2030 2006<br />
Consequences of the regional plan Zuid-Holland West for the infrastructure<br />
134<br />
134
Den Haag 1908-2030 2006<br />
Zones that are designated to become build up areas within present open<br />
space.<br />
135<br />
135
Den Haag 1908-2030 2006<br />
Vision for the future structure of green areas and waterways of Den Haag<br />
136<br />
136
James Corner 1996<br />
American modern cartography<br />
In recent American cartography related to planning there is a tendency to<br />
make maps that graphically integrate may aspects. The intention is to 'tell<br />
a complete story in one map' and to make unexpected connections. It<br />
leads to intriguing maps.<br />
From: James Corner ‘Taking measures across the American Landscape’, 1996<br />
137<br />
137
Alan Berger ‘Drosscape’ 2006<br />
Alan Berger 'Drosscape 2006<br />
Dispersal graph Dallas/Fort Worth Texas.<br />
Berger records the waste of land in America as a result of the prevailing<br />
political-economic system. In this example the population density sharply<br />
falls within a radius of 10 miles in all directions from the center of Dallas.<br />
Colored graphs describe the change of density in the sections shown with<br />
a line of the same color on the map.<br />
138<br />
138
Asia Link Karachi Matara 2007<br />
reconstructie historisch nederzettingspatroon<br />
Asia Link Karachi / Matara 2007<br />
Cartographic analysis is a very adequate tool in areas of urban sprawl and<br />
spontaneous settlements. As the fact is that these type of areas form an<br />
ever expanding part of the world the importance of cartography is<br />
growing proportional with it.<br />
The Asia Link project was initiated by the TU <strong>Eindhoven</strong>, Leuven University<br />
and three asian universities. Its aim was to develop tools to be able to<br />
contribute to the improvement of the urban situation in developed<br />
countries. The tools are aimed at realistic small scale interventions.<br />
Shown in thios slide:<br />
Karachi<br />
Reconstruction of the historic settlement pattern.<br />
139<br />
139
Asia Link Karachi Matara 2007<br />
Voorstel consolidatie gemeenschappen langs rivier de Nalla<br />
Karachi<br />
Proposal to consolidate existing communities in a strip along side the river<br />
Nalla<br />
140<br />
140
Asia Link Karachi Matara 2007<br />
Matara<br />
Streetscapes and sites<br />
Left: composition map. Right: the several seperate layers of the composition<br />
map.<br />
141<br />
141
The evolution of cartography<br />
142<br />
142
Technical revolutions that had a big impact on cartography<br />
143<br />
143