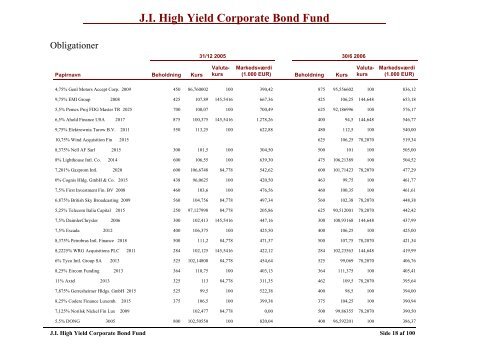
Obligationer J.I. High Yield Corporate <strong>Bond</strong> <strong>Fund</strong> 31/12 2005 30/6 2006 Valuta- Markedsværdi Papirnavn Beholdning Kurs kurs (1.000 EUR) Beholdning Kurs Valutakurs 4,75% Genl Motors Accept Corp. 2009 450 86,760002 100 390,42 875 95,556602 100 9,75% EMI Group 2008 425 107,89 145,5416 667,36 425 106,25 144,648 5,5% Pemex Proj FDG Master TR 2025 700 100,07 100 700,49 625 92,186996 100 6,5% Ahold Finance USA 2017 875 100,375 145,5416 1.278,26 400 94,5 144,648 9,75% Elektrownia Turow B.V. 2011 550 113,25 100 622,88 480 112,5 100 10,75% Wind Acquisition Fin 2015 625 106,25 78,2070 8,375% Nell AF Sarl 2015 300 101,5 100 304,50 500 101 100 8% Lighthouse Intl. Co. 2014 600 106,55 100 639,30 475 106,21389 100 7,201% Gazprom Intl. 2020 600 106,6748 84,778 542,62 600 101,71423 78,2070 0% Cognis Hldg. GmbH & Co. 2015 438 96,0625 100 420,50 463 99,75 100 7,5% First <strong>Invest</strong>ment Fin. BV 2008 460 103,6 100 476,56 460 100,35 100 6,875% British Sky Broadcasting 2009 560 104,756 84,778 497,34 560 102,38 78,2070 5,25% Telecom Italia Capital 2015 250 97,127998 84,778 205,86 625 90,512001 78,2070 7,5% DaimlerChrysler 2006 300 102,413 145,5416 447,16 300 100,93168 144,648 7,5% Escada 2012 400 106,375 100 425,50 400 106,25 100 8,375% Petrobras Intl. Finance 2018 500 111,2 84,778 471,37 500 107,75 78,2070 8,2225% WRG Acquisitions PLC 2011 284 102,125 145,5416 422,12 284 102,23563 144,648 6% Tyco Intl. Group SA 2013 525 102,14800 84,778 454,64 525 99,069 78,2070 8,25% Eircom <strong>Fund</strong>ing 2013 364 110,75 100 403,13 364 111,375 100 11% Axtel 2013 325 113 84,778 311,35 462 109,5 78,2070 7,875% Gerresheimer Hldgs. GmbH 2015 525 99,5 100 522,38 400 98,5 100 8,25% Codere Finance Luxemb. 2015 375 106,5 100 399,38 375 104,25 100 7,125% Norilsk Nickel Fin Lux 2009 102,477 84,778 0,00 500 99,86355 78,2070 5,5% DONG 3005 800 102,50550 100 820,04 400 96,592201 100 J.I. High Yield Corporate <strong>Bond</strong> <strong>Fund</strong> Markedsværdi (1.000 EUR) 836,12 653,18 576,17 546,77 540,00 519,34 505,00 504,52 477,29 461,77 461,61 448,38 442,42 437,99 425,00 421,34 419,99 406,76 405,41 395,64 394,00 390,94 390,50 386,37 Side 18 af 100
9,5% Mediacom LLC/Cap. Corp. 2013 496 97,625 84,778 410,51 496 99,5 78,2070 8% Mobile Telesystems Fin 2012 1.550 102,3819 84,778 1.345,36 498 97,788113 78,2070 7,5% Williams Cos. Inc. 2031 500 103,5 84,778 438,73 500 96,5 78,2070 5% NVR Inc. 2010 500 97,625 84,778 413,82 500 95,625 78,2070 6,375% Mylan Laboratories 2015 500 95,5 78,2070 11,5% Nyco Holdings 2 2013 575 116 100 667,00 325 114 100 8% Koninklijke KPN NV 2010 445 106,06700 78,2070 8,75% British Airways 2016 295 110,5 145,5416 474,43 245 104 144,648 6,5% Ericsson LM Telefon 2009 466 103,5 84,778 408,89 466 100,64600 78,2070 5,625% ITV Plc 2009 250 99,936798 144,648 7,375% Sazka 2014 580 109,57 100 635,76 338 107 100 5,125% Kazkommertsbank Internat. 2011 375 96,330002 100 6,125% Hornbach Baumarkt AG 2014 975 100,0806 100 975,79 350 101,40833 100 8,5% Royal & Sun Alliance Ins. 2049 435 119,22000 145,5416 754,79 215 113,27 144,648 10,625% Kabel Deutschland 2014 125 105,25 84,778 111,54 425 105,5 78,2070 8,875% Qwest Corp. 2012 425 112,75 84,778 406,25 425 105,5 78,2070 6,625% Echostar DBS Corp. 2014 475 95,875 84,778 386,08 475 94 78,2070 9,125% Sino Forest Corp. 2011 425 103 78,2070 7% Stena 2016 475 91,5 84,778 368,47 475 92 78,2070 6,625% Noble Group Ltd. 2015 750 92,087997 84,778 585,53 500 86,684998 78,2070 9,25% Tenet Healthcare Corp. 2015 425 99,25 84,778 357,60 425 98,25 78,2070 5,5% Telefonos de Mexico S.A. 2015 900 98,650002 84,778 752,70 450 91,536003 78,2070 4,625% ABB Intl. Finance Ltd. 2013 327 98,210297 100 8,375% Abitibi-Consolidated Inc. 2015 450 95,75 84,778 365,29 450 91,25 78,2070 6,5% Istar Financial Inc 2013 400 101,552 84,778 344,38 400 101,269 78,2070 10,75% Carmeuse Lime 2012 285 115 100 327,75 285 111 100 5,2% Bae Systems Holdings 2015 425 93,112 78,2070 6,375% America Movil SA de CV 2035 450 98,629997 84,778 376,27 450 86,921997 78,2070 6,25% Vale Overseas 2016 400 97 78,2070 8,375% Aker Kvaerner ASA 2011 275 113 100 310,75 275 109,75 100 6,75% Ford Motor Credit 2008 300 99,327797 100 J.I. High Yield Corporate <strong>Bond</strong> <strong>Fund</strong> 385,97 380,86 377,35 373,93 373,44 370,50 369,14 368,56 366,80 361,39 361,39 361,24 354,93 352,26 350,66 350,66 349,19 342,35 341,76 338,97 326,56 322,14 321,15 321,14 316,80 316,35 309,49 305,91 303,44 301,81 297,98 Side 19 af 100
- Page 1 and 2: Obligationer J.I. Danish Bond Fund
- Page 3 and 4: Obligationer J.I. Swedish Bond Fund
- Page 5 and 6: Obligationer J.I. Dollar Bond Fund
- Page 7 and 8: Likviditet 1.015,17 388,90 Øvrige
- Page 9 and 10: 0,01% Republic of Argentina 2012 70
- Page 11 and 12: Likviditet 504,33 2.724,55 Øvrige
- Page 13 and 14: 9% Republic of Philippines 2013 5.3
- Page 15 and 16: 7% Republic of Venezuela 2015 2.240
- Page 17: 0% Barclays Bank 2006 1.000 93,95 8
- Page 21 and 22: 7,875% Biovail Corp 2010 317 103,62
- Page 23 and 24: 8,625% Shanghai Real Estate 2013 20
- Page 25 and 26: 7,375% Heidelbergcement 2010 30 109
- Page 27 and 28: Aktier J.I. Danish Equity Fund 31/1
- Page 29 and 30: FLS Industri A 6.000 174 100 1.044,
- Page 31 and 32: Lindex 3.000 448,5 100 1.345,50 20.
- Page 33 and 34: Aktier J.I. German Equity Fund 31/1
- Page 35 and 36: Aktier J.I. British Equity Fund 31/
- Page 37 and 38: Likviditet 60,60 23,70 Øvrige akti
- Page 39 and 40: Hitachi High-Technologies Corp 15.7
- Page 41 and 42: Chiba Bank 34.000 989 100 33.626,00
- Page 43 and 44: Nucor Corp. 1.000 66,72 100 66,72 2
- Page 45 and 46: Cleveland Cliffs 900 88,57 100 79,7
- Page 47 and 48: Aktier J.I. Chinese Equity Fund 31/
- Page 49 and 50: Likviditet 491,13 3.052,13 Øvrige
- Page 51 and 52: India Cement 165.000 156,8 2,17202
- Page 53 and 54: Dogan Yayin Holding 50.000 5,35 62,
- Page 55 and 56: Credit Agricole 9.300 29,75 127,866
- Page 57 and 58: Ensco International 4.700 46,02 100
- Page 59 and 60: Aktier J.I. Emerging Markets Equity
- Page 61 and 62: Turkiye is Bankasi C 40.400 11,7 74
- Page 63 and 64: Aktier J.I. European Equity Fund 31
- Page 65 and 66: Anglo American 19,79 145,5416 0,00
- Page 67 and 68: Dexia 23.500 19,49 100 458,02 0 18,
- Page 69 and 70:
Aluminum Corp. of China 5,9 12,8973
- Page 71 and 72:
Aktier J.I. Latin American Equity F
- Page 73 and 74:
Anonima Telef.(CANTV) ADR 1.000 14,
- Page 75 and 76:
Efes Breweries Int. Amsterdam 17.20
- Page 77 and 78:
Computer Sciences Corp. 3.300 50,64
- Page 79 and 80:
Aktier J.I. Biotech/HealthCare Equi
- Page 81 and 82:
Panacos Pharmaceuticals Inc 4.500 6
- Page 83 and 84:
Aktier J.I. Telecom Equity Fund 31/
- Page 85 and 86:
Obligationer J.I. Income Strategy F
- Page 87 and 88:
Obligationer J.I. Stable Strategy F
- Page 89 and 90:
Yamaha Motor Co. 5.700 3080 0,71827
- Page 91 and 92:
Aktier 31/12 2005 30/6 2006 Valuta-
- Page 93 and 94:
Obligationer J.I. Dynamic Strategy
- Page 95 and 96:
Canon 800 6900 0,718274 39,65 1.800
- Page 97 and 98:
Petroleo Brasileiro ADR 4.300 71,27
- Page 99 and 100:
Aktier J.I. Aggressive Strategy Fun