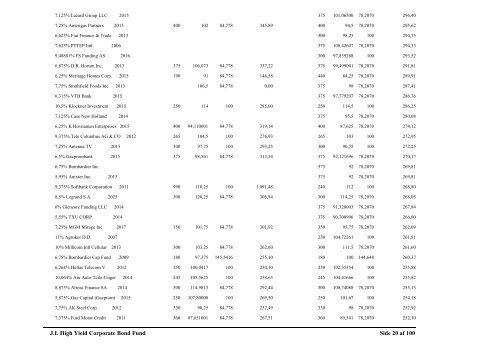
7,125% Lazard Group LLC 2015 375 101,06500 78,2070 7,25% Amerigas Partners 2015 400 102 84,778 345,89 400 94,5 78,2070 6,625% Fiat Finance & Trade 2013 300 98,25 100 7,625% PTTEP Intl. 2006 375 100,42607 78,2070 9,48881% FS <strong>Fund</strong>ing AS 2016 300 97,839288 100 6,875% D.R. Horton Inc. 2013 375 106,073 84,778 337,22 375 99,499001 78,2070 6,25% Meritage Homes Corp. 2015 190 91 84,778 146,58 440 84,25 78,2070 7,75% Smithfield Foods Inc 2013 106,5 84,778 0,00 375 98 78,2070 6,315% VTB Bank 2015 375 97,779297 78,2070 10,5% Klockner <strong>Invest</strong>ment 2015 250 114 100 285,00 250 114,5 100 7,125% Case New Holland 2014 375 95,5 78,2070 6,25% K Hovnanian Enterprises 2015 400 94,110001 84,778 319,14 400 87,625 78,2070 9,375% Tele Columbus AG & CO 2012 265 104,5 100 276,93 265 103 100 7,25% Antenna TV 2015 300 97,75 100 293,25 300 90,75 100 6,5% Gazprombank 2015 375 98,561 84,778 313,34 375 92,121696 78,2070 6,75% Bombardier Inc. 375 92 78,2070 5,95% Anixter Inc 2015 375 92 78,2070 9,375% Softbank Corporation 2011 990 110,25 100 1.091,48 240 112 100 8,5% Legrand S.A. 2025 300 120,25 84,778 305,84 300 114,25 78,2070 6% Glencore <strong>Fund</strong>ing LLC 2014 375 91,328003 78,2070 5,55% TXU CORP 2014 375 90,700996 78,2070 7,25% MGM Mirage Inc. 2017 350 101,75 84,778 301,92 350 95,75 78,2070 11% Agrokor D.D 2007 250 104,72261 100 10% Millicom Intl Cellular 2013 300 103,25 84,778 262,60 300 111,5 78,2070 6,75% Bombardier Cap <strong>Fund</strong> 2009 180 97,375 145,5416 255,10 180 100 144,648 6,264% Hellas Telecom V 2012 250 100,0417 100 250,10 250 102,35354 100 10,064% Atu Auto-Teile-Unger 2014 245 105,5625 100 258,63 245 104,41666 100 8,875% Alrosa Finance SA 2014 300 114,9813 84,778 292,44 300 108,74088 78,2070 5,875% Gaz Capital (Gazprom) 2015 250 107,80000 100 269,50 250 101,67 100 7,75% AK Steel Corp. 2012 330 90,25 84,778 252,49 330 98 78,2070 7,375% Ford Motor Credit 2011 360 87,651001 84,778 267,51 360 89,541 78,2070 J.I. High Yield Corporate <strong>Bond</strong> <strong>Fund</strong> 296,40 295,62 294,75 294,53 293,52 291,81 289,91 287,41 286,76 286,25 280,08 274,12 272,95 272,25 270,17 269,81 269,81 268,80 268,05 267,84 266,00 262,09 261,81 261,60 260,37 255,88 255,82 255,13 254,18 252,92 252,10 Side 20 af 100
7,875% Biovail Corp 2010 317 103,625 84,778 278,49 317 101,25 78,2070 10,5% Hertz Corp. 2016 300 106 78,2070 5,625% SC Parex Banka 2011 250 98,25 100 8% Georgia-Pacific Corp. 2024 330 95,5 84,778 267,18 330 94,5 78,2070 10,375% Gerdau Ameristeel Corp. 2011 287 110,25 84,778 268,25 287 107,25 78,2070 8,75% Cirsa Finance Luxembourg 2014 230 104,5 100 240,35 230 104,5 100 8,625% Intelsat Sub. Hld. Co. 2015 300 101 84,778 256,88 300 100,25 78,2070 4,75% ISS Global 2010 550 91,75 100 504,63 250 93,5 100 7,5% Corus Group Plc 2011 220 105,992 100 233,18 220 105,31115 100 8,608% American Airline 2011 285 99,361 84,778 240,07 285 103,93 78,2070 10,625% Polyone Corp. 2010 275 107,25 84,778 250,04 275 107,5 78,2070 7,73% Edison Mission Energy 2009 287 103,25 84,778 251,22 287 101 78,2070 10% Piaggio Finance SA 2012 200 115,5 100 231,00 200 113,25 100 7,375% Fresenius Med Cap 2011 208 111 100 230,88 208 108 100 7,25% Allied Waste North Amer 2015 300 101 84,778 256,88 300 95,5 78,2070 8% Service Corp. Intl. 2017 305 93,5 78,2070 7,875% Qwest Corporation 2011 280 107,75 84,778 255,78 280 101,25 78,2070 8,25% Central Euro Media Enter. 2012 200 110,25 100 220,50 200 109,5 100 7,875% Cirsa Capital Luxembourg 2012 220 98 100 215,60 220 99,5 100 9% Aleris Intl. Inc. 2014 275 103 84,778 240,13 275 101,75 78,2070 5,375% Fortune Brands 2016 300 92,501999 78,2070 8,75% Cable & Wireless Plc 2012 150 106 145,5416 231,41 150 100 144,648 5,75% FCE Bank 2006 150 96,6237 145,5416 210,94 150 99,520831 144,648 7,5% Aes Gener 2014 275 101,53600 84,778 236,72 275 100,336 78,2070 9% Carrols Corp. 2013 275 97 84,778 226,15 275 100,25 78,2070 7,75% KB Home 2010 275 104,473 84,778 243,57 275 100 78,2070 6,375% Rogers Wireless Inc 2014 288 100,25 84,778 244,77 288 95,25 78,2070 9% Sequa Corp. 2009 260 106,25 84,778 234,20 260 105,5 78,2070 8,75% City Telecom HK Ltd. 2015 350 79 84,778 234,41 350 78 78,2070 8,375% Cincinnati Bell Inc. 2014 277 98,375 84,778 231,02 277 98,5 78,2070 7% XCEL Energy 2010 260 107,62300 84,778 237,23 260 104,16300 78,2070 J.I. High Yield Corporate <strong>Bond</strong> <strong>Fund</strong> 251,02 248,70 245,63 243,89 240,73 240,35 235,21 233,75 231,68 231,65 231,20 226,70 226,50 224,64 224,06 223,03 221,72 219,00 218,90 218,83 217,03 216,97 215,93 215,79 215,61 215,07 214,54 214,52 213,51 213,38 211,80 Side 21 af 100
- Page 1 and 2: Obligationer J.I. Danish Bond Fund
- Page 3 and 4: Obligationer J.I. Swedish Bond Fund
- Page 5 and 6: Obligationer J.I. Dollar Bond Fund
- Page 7 and 8: Likviditet 1.015,17 388,90 Øvrige
- Page 9 and 10: 0,01% Republic of Argentina 2012 70
- Page 11 and 12: Likviditet 504,33 2.724,55 Øvrige
- Page 13 and 14: 9% Republic of Philippines 2013 5.3
- Page 15 and 16: 7% Republic of Venezuela 2015 2.240
- Page 17 and 18: 0% Barclays Bank 2006 1.000 93,95 8
- Page 19: 9,5% Mediacom LLC/Cap. Corp. 2013 4
- Page 23 and 24: 8,625% Shanghai Real Estate 2013 20
- Page 25 and 26: 7,375% Heidelbergcement 2010 30 109
- Page 27 and 28: Aktier J.I. Danish Equity Fund 31/1
- Page 29 and 30: FLS Industri A 6.000 174 100 1.044,
- Page 31 and 32: Lindex 3.000 448,5 100 1.345,50 20.
- Page 33 and 34: Aktier J.I. German Equity Fund 31/1
- Page 35 and 36: Aktier J.I. British Equity Fund 31/
- Page 37 and 38: Likviditet 60,60 23,70 Øvrige akti
- Page 39 and 40: Hitachi High-Technologies Corp 15.7
- Page 41 and 42: Chiba Bank 34.000 989 100 33.626,00
- Page 43 and 44: Nucor Corp. 1.000 66,72 100 66,72 2
- Page 45 and 46: Cleveland Cliffs 900 88,57 100 79,7
- Page 47 and 48: Aktier J.I. Chinese Equity Fund 31/
- Page 49 and 50: Likviditet 491,13 3.052,13 Øvrige
- Page 51 and 52: India Cement 165.000 156,8 2,17202
- Page 53 and 54: Dogan Yayin Holding 50.000 5,35 62,
- Page 55 and 56: Credit Agricole 9.300 29,75 127,866
- Page 57 and 58: Ensco International 4.700 46,02 100
- Page 59 and 60: Aktier J.I. Emerging Markets Equity
- Page 61 and 62: Turkiye is Bankasi C 40.400 11,7 74
- Page 63 and 64: Aktier J.I. European Equity Fund 31
- Page 65 and 66: Anglo American 19,79 145,5416 0,00
- Page 67 and 68: Dexia 23.500 19,49 100 458,02 0 18,
- Page 69 and 70: Aluminum Corp. of China 5,9 12,8973
- Page 71 and 72:
Aktier J.I. Latin American Equity F
- Page 73 and 74:
Anonima Telef.(CANTV) ADR 1.000 14,
- Page 75 and 76:
Efes Breweries Int. Amsterdam 17.20
- Page 77 and 78:
Computer Sciences Corp. 3.300 50,64
- Page 79 and 80:
Aktier J.I. Biotech/HealthCare Equi
- Page 81 and 82:
Panacos Pharmaceuticals Inc 4.500 6
- Page 83 and 84:
Aktier J.I. Telecom Equity Fund 31/
- Page 85 and 86:
Obligationer J.I. Income Strategy F
- Page 87 and 88:
Obligationer J.I. Stable Strategy F
- Page 89 and 90:
Yamaha Motor Co. 5.700 3080 0,71827
- Page 91 and 92:
Aktier 31/12 2005 30/6 2006 Valuta-
- Page 93 and 94:
Obligationer J.I. Dynamic Strategy
- Page 95 and 96:
Canon 800 6900 0,718274 39,65 1.800
- Page 97 and 98:
Petroleo Brasileiro ADR 4.300 71,27
- Page 99 and 100:
Aktier J.I. Aggressive Strategy Fun