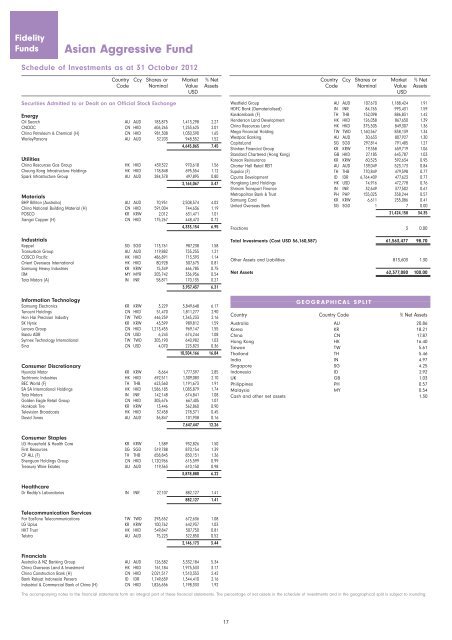
Fidelity Funds Asian Aggressive Fund Schedule of Investments as at 31 October 2012 Country Ccy Shares or Market % Net Code Nominal Value Assets USD Securities Admitted to or Dealt on an Official Stock Exchange Energy Oil Search AU AUD 183,875 1,413,298 2.27 CNOOC CN HKD 606,265 1,253,625 2.01 China Petroleum & Chemical (H) CN HKD 981,308 1,030,390 1.65 WorleyParsons AU AUD 37,203 948,552 1.52 4,645,865 7.45 Utilities China Resources Gas Group HK HKD 439,322 970,618 1.56 Cheung Kong Infrastructure Holdings HK HKD 118,848 695,554 1.12 Spark Infrastructure Group AU AUD 284,378 497,895 0.80 2,164,067 3.47 Materials BHP Billiton (Australia) AU AUD 70,951 2,508,574 4.02 China National Building Material (H) CN HKD 591,004 744,636 1.19 POSCO KR KRW 2,012 631,471 1.01 Jiangxi Copper (H) CN HKD 175,267 448,473 0.72 4,333,154 6.95 Industrials Keppel SG SGD 113,761 987,238 1.58 Transurban Group AU AUD 119,882 755,255 1.21 COSCO Pacific HK HKD 486,891 713,393 1.14 Orient Overseas International HK HKD 80,928 507,675 0.81 Samsung Heavy Industries KR KRW 15,349 466,785 0.75 IJM MY MYR 205,742 336,956 0.54 Tata Motors (A) IN INR 58,871 170,135 0.27 3,937,437 6.31 Information Technology Samsung Electronics KR KRW 3,229 3,849,648 6.17 Tencent Holdings CN HKD 51,470 1,811,277 2.90 Hon Hai Precision Industry TW TWD 446,259 1,345,233 2.16 SK Hynix KR KRW 43,599 989,812 1.59 Lenovo Group CN HKD 1,213,455 969,147 1.55 Baidu ADR CN USD 6,243 674,244 1.08 Synnex Technology International TW TWD 305,190 640,982 1.03 Sina CN USD 4,070 223,823 0.36 10,504,166 16.84 Consumer Discretionary Hyundai Motor KR KRW 8,664 1,777,397 2.85 Techtronic Industries HK HKD 692,511 1,309,083 2.10 BEC World (F) TH THB 623,560 1,191,673 1.91 SA SA International Holdings HK HKD 1,586,185 1,083,879 1.74 Tata Motors IN INR 142,148 674,841 1.08 Golden Eagle Retail Group CN HKD 305,676 667,405 1.07 Hankook Tire KR KRW 13,446 562,860 0.90 Television Broadcasts HK HKD 37,458 278,371 0.45 David Jones AU AUD 36,847 101,938 0.16 7,647,447 12.26 Consumer Staples LG Household & Health Care KR KRW 1,589 932,826 1.50 First Resources SG SGD 519,788 870,154 1.39 CP ALL (F) TH THB 658,845 850,151 1.36 Shenguan Holdings Group CN HKD 1,120,966 615,599 0.99 Treasury Wine Estates AU AUD 119,363 610,150 0.98 3,878,880 6.22 Healthcare Dr Reddy’s Laboratories IN INR 27,107 882,127 1.41 882,127 1.41 Tele<strong>com</strong>munication Services Far EasTone Tele<strong>com</strong>munications TW TWD 293,652 672,636 1.08 LG Uplus KR KRW 100,762 642,937 1.03 HKT Trust HK HKD 549,847 507,750 0.81 Telstra AU AUD 75,223 322,850 0.52 2,146,173 3.44 Financials Australia & NZ Banking Group AU AUD 126,582 3,332,184 5.34 China Overseas L<strong>and</strong> & Investment HK HKD 761,184 1,975,533 3.17 China Construction Bank (H) CN HKD 2,021,517 1,510,353 2.42 Bank Rakyat Indonesia Persero ID IDR 1,749,659 1,344,410 2.16 Industrial & Commercial Bank of China (H) CN HKD 1,826,656 1,198,333 1.92 17 Country Ccy Shares or Market % Net Code Nominal Value Assets USD Westfield Group AU AUD 107,670 1,188,424 1.91 HDFC Bank (Dematerialised) IN INR 84,765 993,431 1.59 Kasikornbank (F) TH THB 152,098 886,831 1.42 Henderson L<strong>and</strong> Development HK HKD 126,058 867,650 1.39 China Resources L<strong>and</strong> HK HKD 375,505 849,307 1.36 Mega Financial Holding TW TWD 1,160,567 838,139 1.34 Westpac Banking AU AUD 30,633 807,927 1.30 CapitaL<strong>and</strong> SG SGD 297,814 791,485 1.27 Shinhan Financial Group KR KRW 19,358 659,719 1.06 St<strong>and</strong>ard Chartered (Hong Kong) GB HKD 27,185 643,787 1.03 Korean Reinsurance KR KRW 60,525 592,634 0.95 Charter Hall Retail REIT AU AUD 139,049 523,173 0.84 Supalai (F) TH THB 770,849 479,598 0.77 Ciputra Development ID IDR 6,764,409 477,623 0.77 Hongkong L<strong>and</strong> Holdings HK USD 74,916 472,778 0.76 Shriram Transport Finance IN INR 32,649 377,502 0.61 Metropolitan Bank & Trust PH PHP 155,025 358,244 0.57 Samsung Card KR KRW 6,611 255,086 0.41 United Overseas Bank SG SGD 1 7 0.00 21,424,158 34.35 Fractions 3 0.00 Total Investments (Cost USD 56,160,587) 61,563,477 98.70 Other Assets <strong>and</strong> Liabilities 813,603 1.30 Net Assets 62,377,080 100.00 GEOGRAPHICAL SPLIT Country Country Code % Net Assets Australia AU 20.86 Korea KR 18.21 China CN 17.87 Hong Kong HK 16.40 Taiwan TW 5.61 Thail<strong>and</strong> TH 5.46 India IN 4.97 Singapore SG 4.25 Indonesia ID 2.92 UK GB 1.03 Philippines PH 0.57 Malaysia MY 0.54 Cash <strong>and</strong> other net assets 1.30 The ac<strong>com</strong>panying notes to the financial statements form an integral part of these financial statements. The percentage of net assets in the schedule of investments <strong>and</strong> in the geographical split is subject to rounding.
Fidelity Funds Asian Equity Fund 1,4,5 Schedule of Investments as at 31 October 2012 Country Ccy Shares or Market % Net Code Nominal Value Assets USD Securities Admitted to or Dealt on an Official Stock Exchange Energy CNOOC CN HKD 6,550,000 13,543,984 2.31 PTT (F) TH THB 635,800 6,554,548 1.12 20,098,532 3.43 Utilities Korea Electric Power KR KRW 160,510 4,157,115 0.71 ENN Energy Holdings CN HKD 792,000 3,286,707 0.56 China Resources Gas Group HK HKD 1,426,000 3,150,537 0.54 10,594,359 1.81 Materials LG Chem KR KRW 27,763 7,767,530 1.33 POSCO KR KRW 22,859 7,174,009 1.23 Lafarge Malayan Cement MY MYR 1,561,000 4,975,318 0.85 Formosa Plastics TW TWD 1,813,000 4,904,534 0.84 Nan Ya Plastics TW TWD 2,382,000 4,169,038 0.71 Siam Cement (F) (Reg’d) TH THB 278,800 3,756,513 0.64 Petronas Chemicals Group MY MYR 1,729,700 3,675,340 0.63 Korea Zinc KR KRW 7,574 3,089,975 0.53 China Shanshui Cement Group CN HKD 3,555,000 2,618,994 0.45 42,131,251 7.20 Industrials Hutchison Whampoa HK HKD 996,000 9,726,856 1.66 Keppel SG SGD 847,000 7,350,388 1.26 IJM MY MYR 3,110,100 5,093,607 0.87 Jardine Matheson Holdings HK USD 79,200 4,858,706 0.83 Fraser <strong>and</strong> Neave SG SGD 555,000 4,148,866 0.71 Hyundai Engineering & Construction KR KRW 57,270 3,436,162 0.59 Hutchison Port Holdings Trust SG USD 4,183,000 3,250,902 0.56 Orion (South Korea) KR KRW 3,369 3,165,074 0.54 SembCorp Marine SG SGD 768,000 2,942,011 0.50 Orient Overseas International HK HKD 456,000 2,860,570 0.49 46,833,142 8.00 Information Technology Samsung Electronics KR KRW 32,207 38,394,545 6.56 Taiwan <strong>Semi</strong>conductor Manufacturing TW TWD 9,079,000 27,368,343 4.67 Tencent Holdings CN HKD 512,800 18,045,871 3.08 Hon Hai Precision Industry TW TWD 4,766,240 14,367,672 2.45 NHN KR KRW 46,641 10,776,301 1.84 Baidu ADR CN USD 85,300 9,212,400 1.57 Lenovo Group CN HKD 7,370,000 5,886,182 1.01 AAC Technologies Holdings CN HKD 1,285,000 4,565,184 0.78 NCSoft KR KRW 23,215 4,449,351 0.76 Samsung Electronics (Pref’d) KR KRW 5,504 3,990,749 0.68 Delta Electronics TW TWD 1,074,000 3,642,686 0.62 Novatek Microelectronics TW TWD 782,000 2,923,387 0.50 Advantech TW TWD 716,000 2,457,657 0.42 ASM Pacific Technology HK HKD 217,000 2,411,373 0.41 Powertech Technology TW TWD 1,284,000 1,981,106 0.34 Chroma ATE TW TWD 948,000 1,791,307 0.31 SouFun Holdings ADR CN USD 63,578 1,146,311 0.20 153,410,425 26.20 Consumer Discretionary Hyundai Motor KR KRW 56,998 11,693,127 2.00 Hyundai Motor (Pref’d) KR KRW 93,173 6,087,380 1.04 Great Wall Motor (H) CN HKD 1,987,000 5,435,716 0.93 Techtronic Industries HK HKD 2,716,000 5,134,172 0.88 Giant Manufacturing TW TWD 968,000 4,967,515 0.85 S<strong>and</strong>s China CN HKD 1,218,400 4,561,500 0.78 Galaxy Entertainment Group HK HKD 1,098,000 3,732,841 0.64 Golden Eagle Retail Group CN HKD 1,222,000 2,668,083 0.46 Gr<strong>and</strong> Korea Leisure KR KRW 89,580 2,518,530 0.43 Stella International Holdings HK HKD 919,000 2,411,584 0.41 Prada IT HKD 293,600 2,374,822 0.41 New Oriental Education & Technology Group ADR CN USD 96,900 1,625,982 0.28 Hyundai Department Store KR KRW 11,916 1,477,161 0.25 54,688,413 9.34 Consumer Staples LG Household & Health Care KR KRW 18,129 10,639,838 1.82 KT&G KR KRW 113,886 8,612,303 1.47 China Mengniu Dairy HK HKD 2,697,000 8,140,069 1.39 Want Want China Holdings CN HKD 5,128,000 6,981,249 1.19 Yantai Changyu Pioneer Wine (B) CN HKD 1,148,449 5,822,213 0.99 Hengan International Group CN HKD 632,500 5,728,823 0.98 18 Gudang Garam ID IDR 967,000 4,935,107 0.84 Amorepacific KR KRW 2,851 3,239,080 0.55 Dairy Farm International Holdings HK USD 206,100 2,291,731 0.39 56,390,413 9.63 Healthcare Raffles Medical Group SG SGD 1,234,000 2,468,884 0.42 2,468,884 0.42 Tele<strong>com</strong>munication Services China Mobile HK HKD 814,000 8,985,651 1.53 Far EasTone Tele<strong>com</strong>munications TW TWD 3,239,000 7,419,211 1.27 HKT Trust HK HKD 4,992,000 4,609,807 0.79 Axiata Group MY MYR 1,698,500 3,625,702 0.62 Philippine Long Distance Telephone PH PHP 46,550 3,000,669 0.51 KT KR KRW 81,130 2,750,184 0.47 Asia Satellite Tele<strong>com</strong>munications Holdings HK HKD 785,500 2,491,853 0.43 32,883,077 5.62 Financials AIA Group HK HKD 4,787,000 18,874,744 3.22 United Overseas Bank SG SGD 893,000 13,290,028 2.27 Industrial & Commercial Bank of China (H) CN HKD 19,417,850 12,738,603 2.18 Bank Rakyat Indonesia Persero ID IDR 14,440,000 11,095,464 1.90 Ping An Insurance Group (H) CN HKD 978,500 7,665,807 1.31 CIMB Group Holdings MY MYR 3,017,800 7,527,111 1.29 BOC Hong Kong Holdings HK HKD 2,384,000 7,302,539 1.25 China Merchants Bank (H) CN HKD 3,400,000 6,323,052 1.08 Henderson L<strong>and</strong> Development HK HKD 883,000 6,077,624 1.04 Shinhan Financial Group KR KRW 171,140 5,832,454 1.00 China Overseas L<strong>and</strong> & Investment HK HKD 1,904,000 4,941,532 0.84 Bank Central Asia ID IDR 5,742,500 4,889,466 0.84 Korean Reinsurance KR KRW 458,530 4,489,741 0.77 Samsung Fire & Marine Insurance KR KRW 19,769 4,308,378 0.74 Bangkok Bank (Honk Kong) (F) TH THB 731,600 4,289,590 0.73 Chinatrust Financial Holding TW TWD 6,659,966 3,644,054 0.62 Global Logistic Properties SG SGD 1,588,000 3,326,626 0.57 Wing Hang Bank HK HKD 276,862 2,925,509 0.50 Supalai (F) TH THB 2,810,800 1,748,791 0.30 China Vanke (B) CN HKD 280,300 365,653 0.06 131,656,766 22.49 Equity Linked Notes UBS (Kweichow Moutai (A)) ELN 09/07/2015 CN USD 118,500 4,697,006 0.80 UBS (China Vanke (A)) ELN 15/07/2013 CN USD 1,758,400 2,344,496 0.40 UBS (Wuliangye Yibin (A)) ELN 22/04/2013 CN USD 427,300 2,300,809 0.39 BNP (Kweichow Moutai (A)) ELN 20/08/2013 CN USD 44,800 1,775,746 0.30 GSI (Ping An Insurance Group (A)) ELN 20/04/2015 CN USD 7,758 48,238 0.01 11,166,295 1.91 Securities Admitted to or Dealt on Other Regulated Markets Open Ended Fund Fidelity Institutional Liquidity Fund - A-ACC-USD IE USD 781 13,273,057 2.27 13,273,057 2.27 Unlisted Country Ccy Shares or Market % Net Code Nominal Value Assets USD Tele<strong>com</strong>munication Services Total Access Communication NVDR TH THB 856,300 2,412,880 0.41 2,412,880 0.41 Financials Bangkok Bank NVDR TH THB 342,800 1,966,042 0.34 Supalai NVDR TH THB 1,024,500 637,412 0.11 2,603,454 0.44 Total Investments (Cost USD 542,846,184) 580,610,948 99.17 Other Assets <strong>and</strong> Liabilities 4,869,454 0.83 Net Assets 585,480,402 100.00 A full list of footnotes is given on page 6. The ac<strong>com</strong>panying notes to the financial statements form an integral part of these financial statements. The percentage of net assets in the schedule of investments <strong>and</strong> in the geographical split is subject to rounding.
- Page 1 and 2: Fidelity Funds Société d’invest
- Page 3 and 4: Fidelity Funds Introduction Fidelit
- Page 5 and 6: Fidelity Funds Investment Manager
- Page 7 and 8: Fidelity Funds Footnotes 1 These su
- Page 9 and 10: Fidelity Funds American Diversified
- Page 11 and 12: Fidelity Funds American Diversified
- Page 13 and 14: Fidelity Funds ASEAN Fund Schedule
- Page 15 and 16: Fidelity Funds Asia Pacific Dividen
- Page 17: Fidelity Funds Asia Pacific Propert
- Page 21 and 22: Fidelity Funds Asian Smaller Compan
- Page 23 and 24: Fidelity Funds Asian Special Situat
- Page 25 and 26: Fidelity Funds Australia Fund Sched
- Page 27 and 28: Fidelity Funds China Focus Fund Sch
- Page 29 and 30: Fidelity Funds China Opportunities
- Page 31 and 32: Fidelity Funds Emerging Asia Fund S
- Page 33 and 34: Fidelity Funds Emerging Europe, Mid
- Page 35 and 36: Fidelity Funds Emerging Markets Fun
- Page 37 and 38: Fidelity Funds Euro Blue Chip Fund
- Page 39 and 40: Fidelity Funds European Aggressive
- Page 41 and 42: Fidelity Funds European Dynamic Gro
- Page 43 and 44: Fidelity Funds European Fund 1,4 Sc
- Page 45 and 46: Fidelity Funds European Fund 1,4 -
- Page 47 and 48: Fidelity Funds European Larger Comp
- Page 49 and 50: Fidelity Funds European Smaller Com
- Page 51 and 52: Fidelity Funds European Special Sit
- Page 53 and 54: Fidelity Funds Germany Fund Schedul
- Page 55 and 56: Fidelity Funds Global Demographics
- Page 57 and 58: Fidelity Funds Global Dividend Fund
- Page 59 and 60: Fidelity Funds Global Focus Fund Sc
- Page 61 and 62: Fidelity Funds Global Health Care F
- Page 63 and 64: Fidelity Funds Global Industrials F
- Page 65 and 66: Fidelity Funds Global Opportunities
- Page 67 and 68: Fidelity Funds Global Real Asset Se
- Page 69 and 70:
Fidelity Funds Global Technology Fu
- Page 71 and 72:
Fidelity Funds Greater China Fund S
- Page 73 and 74:
Fidelity Funds Greater China Fund I
- Page 75 and 76:
Fidelity Funds Iberia Fund Schedule
- Page 77 and 78:
Fidelity Funds Indonesia Fund Sched
- Page 79 and 80:
Fidelity Funds International Fund -
- Page 81 and 82:
Fidelity Funds International Fund -
- Page 83 and 84:
Fidelity Funds International Fund -
- Page 85 and 86:
Fidelity Funds Marwyn Value Investo
- Page 87 and 88:
Fidelity Funds Italy Fund Schedule
- Page 89 and 90:
Fidelity Funds Japan Fund Schedule
- Page 91 and 92:
Fidelity Funds Japan Smaller Compan
- Page 93 and 94:
Fidelity Funds Latin America Fund S
- Page 95 and 96:
Fidelity Funds Nordic Fund Schedule
- Page 97 and 98:
Fidelity Funds Pacific Fund - conti
- Page 99 and 100:
Fidelity Funds South East Asia Fund
- Page 101 and 102:
Fidelity Funds Switzerland Fund Sch
- Page 103 and 104:
Fidelity Funds Thailand Fund Schedu
- Page 105 and 106:
Fidelity Funds World Fund Schedule
- Page 107 and 108:
Fidelity Funds World Fund - continu
- Page 109 and 110:
Fidelity Funds World Fund - continu
- Page 111 and 112:
Fidelity Funds World Fund - continu
- Page 113 and 114:
Fidelity Funds Futures World Fund -
- Page 115 and 116:
Fidelity Funds Fidelity Patrimoine
- Page 117 and 118:
Fidelity Funds Fidelity Patrimoine
- Page 119 and 120:
Fidelity Funds Fidelity Patrimoine
- Page 121 and 122:
Fidelity Funds Fidelity Patrimoine
- Page 123 and 124:
Fidelity Funds Bangkok Bank NVDR TH
- Page 125 and 126:
Fidelity Funds Fidelity Sélection
- Page 127 and 128:
Fidelity Funds Fidelity Sélection
- Page 129 and 130:
Fidelity Funds Fidelity Sélection
- Page 131 and 132:
Fidelity Funds Fidelity Sélection
- Page 133 and 134:
Fidelity Funds Fidelity Sélection
- Page 135 and 136:
Fidelity Funds Fidelity Sélection
- Page 137 and 138:
Fidelity Funds Contracts For Differ
- Page 139 and 140:
Fidelity Funds FPS Global Growth Fu
- Page 141 and 142:
Fidelity Funds FPS Global Growth Fu
- Page 143 and 144:
Fidelity Funds FPS Global Growth Fu
- Page 145 and 146:
Fidelity Funds Industrials Glencore
- Page 147 and 148:
Fidelity Funds FPS Growth Fund 4 Sc
- Page 149 and 150:
Fidelity Funds FPS Growth Fund 4 -
- Page 151 and 152:
Fidelity Funds FPS Growth Fund 4 -
- Page 153 and 154:
Fidelity Funds FPS Growth Fund 4 -
- Page 155 and 156:
Fidelity Funds FPS Moderate Growth
- Page 157 and 158:
Fidelity Funds FPS Moderate Growth
- Page 159 and 160:
Fidelity Funds FPS Moderate Growth
- Page 161 and 162:
Fidelity Funds FPS Moderate Growth
- Page 163 and 164:
Fidelity Funds Euro Balanced Fund -
- Page 165 and 166:
Fidelity Funds Euro Bund Future 06/
- Page 167 and 168:
Fidelity Funds Growth & Income Fund
- Page 169 and 170:
Fidelity Funds Growth & Income Fund
- Page 171 and 172:
Fidelity Funds Growth & Income Fund
- Page 173 and 174:
Fidelity Funds Growth & Income Fund
- Page 175 and 176:
Fidelity Funds Growth & Income Fund
- Page 177 and 178:
Fidelity Funds USI Holdings 4.310%
- Page 179 and 180:
Fidelity Funds Pay fixed 2.435% rec
- Page 181 and 182:
Fidelity Funds Multi Asset Navigato
- Page 183 and 184:
Fidelity Funds Multi Asset Navigato
- Page 185 and 186:
Fidelity Funds Multi Asset Navigato
- Page 187 and 188:
Fidelity Funds Multi Asset Navigato
- Page 189 and 190:
Fidelity Funds Bought CAD Sold USD
- Page 191 and 192:
Fidelity Funds Multi Asset Strategi
- Page 193 and 194:
Fidelity Funds Multi Asset Strategi
- Page 195 and 196:
Fidelity Funds Multi Asset Strategi
- Page 197 and 198:
Fidelity Funds Information Technolo
- Page 199 and 200:
Fidelity Funds Multi Asset Strategi
- Page 201 and 202:
Fidelity Funds Multi Asset Strategi
- Page 203 and 204:
Fidelity Funds Multi Asset Strategi
- Page 205 and 206:
Fidelity Funds Multi Asset Strategi
- Page 207 and 208:
Fidelity Funds Credit Default Swaps
- Page 209 and 210:
Fidelity Funds Asian Bond Fund Sche
- Page 211 and 212:
Fidelity Funds Asian High Yield Fun
- Page 213 and 214:
Fidelity Funds Cemex Finance 9.50%
- Page 215 and 216:
Fidelity Funds China RMB Bond Fund
- Page 217 and 218:
Fidelity Funds Core Euro Bond Fund
- Page 219 and 220:
Fidelity Funds Emerging Market Debt
- Page 221 and 222:
Fidelity Funds Emerging Market Debt
- Page 223 and 224:
Fidelity Funds Euro Bond Fund Sched
- Page 225 and 226:
Fidelity Funds Euro Corporate Bond
- Page 227 and 228:
Fidelity Funds Euro Short Term Bond
- Page 229 and 230:
Fidelity Funds European High Yield
- Page 231 and 232:
Fidelity Funds European High Yield
- Page 233 and 234:
Fidelity Funds Bought EUR Sold USD
- Page 235 and 236:
Fidelity Funds Global Corporate Bon
- Page 237 and 238:
Fidelity Funds Global High Grade In
- Page 239 and 240:
Fidelity Funds Global High Yield Bo
- Page 241 and 242:
Fidelity Funds Global High Yield Bo
- Page 243 and 244:
Fidelity Funds Global High Yield Bo
- Page 245 and 246:
Fidelity Funds Global High Yield Bo
- Page 247 and 248:
Fidelity Funds Global High Yield Fo
- Page 249 and 250:
Fidelity Funds Global Inflation-lin
- Page 251 and 252:
Fidelity Funds Bought SEK Sold USD
- Page 253 and 254:
Fidelity Funds Global Strategic Bon
- Page 255 and 256:
Fidelity Funds Global Strategic Bon
- Page 257 and 258:
Fidelity Funds Global Strategic Bon
- Page 259 and 260:
Fidelity Funds Global Strategic Bon
- Page 261 and 262:
Fidelity Funds Global Strategic Bon
- Page 263 and 264:
Fidelity Funds Futures Long Gilt Fu
- Page 265 and 266:
Fidelity Funds International Bond F
- Page 267 and 268:
Fidelity Funds International Bond F
- Page 269 and 270:
Fidelity Funds Bought USD Sold EUR
- Page 271 and 272:
Fidelity Funds Sterling Bond Fund -
- Page 273 and 274:
Fidelity Funds US Dollar Bond Fund
- Page 275 and 276:
Fidelity Funds Unlisted Financials
- Page 277 and 278:
Fidelity Funds US High Yield Fund -
- Page 279 and 280:
Fidelity Funds US High Yield Fund -
- Page 281 and 282:
Fidelity Funds Euro Cash Fund 1 Sch
- Page 283 and 284:
Fidelity Funds MoneyBuilder Europe
- Page 285 and 286:
Fidelity Funds Rockwell Petroleum P
- Page 287 and 288:
Fidelity Funds MoneyBuilder Europea
- Page 289 and 290:
Fidelity Funds Proud 1 A 0.569% FRN
- Page 291 and 292:
Fidelity Funds MoneyBuilder Global
- Page 293 and 294:
Fidelity Funds MoneyBuilder Global
- Page 295 and 296:
Fidelity Funds MoneyBuilder Global
- Page 297 and 298:
Fidelity Funds MoneyBuilder Global
- Page 299 and 300:
Fidelity Funds Open Ended Fund Fide
- Page 301 and 302:
Fidelity Funds Diversified Income F
- Page 303 and 304:
Fidelity Funds Diversified Income F
- Page 305 and 306:
Fidelity Funds Diversified Income F
- Page 307 and 308:
Fidelity Funds Diversified Income F
- Page 309 and 310:
Fidelity Funds Diversified Income F
- Page 311 and 312:
Fidelity Funds Diversified Income F
- Page 313 and 314:
Fidelity Funds Diversified Income F
- Page 315 and 316:
Fidelity Funds Diversified Income F
- Page 317 and 318:
Fidelity Funds Bought USD Sold JPY
- Page 319 and 320:
Fidelity Funds Fidelity Target 2020
- Page 321 and 322:
Fidelity Funds Fidelity Target 2020
- Page 323 and 324:
Fidelity Funds Fidelity Target 2020
- Page 325 and 326:
Fidelity Funds Fidelity Target 2020
- Page 327 and 328:
Fidelity Funds Fidelity Target 2020
- Page 329 and 330:
Fidelity Funds Fidelity Target 2020
- Page 331 and 332:
Fidelity Funds Japan 10 Year Bond F
- Page 333 and 334:
Fidelity Funds Fidelity Target 2015
- Page 335 and 336:
Fidelity Funds Fidelity Target 2015
- Page 337 and 338:
Fidelity Funds Fidelity Target 2015
- Page 339 and 340:
Fidelity Funds Fidelity Target 2015
- Page 341 and 342:
Fidelity Funds Ip Access (C)* GB GB
- Page 343 and 344:
Fidelity Funds Fidelity Target 2020
- Page 345 and 346:
Fidelity Funds Fidelity Target 2020
- Page 347 and 348:
Fidelity Funds Fidelity Target 2020
- Page 349 and 350:
Fidelity Funds Fidelity Target 2020
- Page 351 and 352:
Fidelity Funds Fidelity Target 2020
- Page 353 and 354:
Fidelity Funds Futures Fidelity Tar
- Page 355 and 356:
Fidelity Funds Fidelity Target 2025
- Page 357 and 358:
Fidelity Funds Fidelity Target 2025
- Page 359 and 360:
Fidelity Funds Fidelity Target 2025
- Page 361 and 362:
Fidelity Funds Fidelity Target 2025
- Page 363 and 364:
Fidelity Funds Ip Access (C)* GB GB
- Page 365 and 366:
Fidelity Funds Fidelity Target 2030
- Page 367 and 368:
Fidelity Funds Fidelity Target 2030
- Page 369 and 370:
Fidelity Funds Fidelity Target 2030
- Page 371 and 372:
Fidelity Funds Fidelity Target 2030
- Page 373 and 374:
Fidelity Funds Fidelity Target 2030
- Page 375 and 376:
Fidelity Funds Fidelity Target 2030
- Page 377 and 378:
Fidelity Funds Fidelity Target 2035
- Page 379 and 380:
Fidelity Funds Fidelity Target 2035
- Page 381 and 382:
Fidelity Funds Fidelity Target 2035
- Page 383 and 384:
Fidelity Funds Fidelity Target 2040
- Page 385 and 386:
Fidelity Funds Fidelity Target 2040
- Page 387 and 388:
Fidelity Funds Fidelity Target 2040
- Page 389 and 390:
Fidelity Funds Fidelity Target 2040
- Page 391 and 392:
Fidelity Funds Live 2020 Fund 1,4,5
- Page 393 and 394:
Fidelity Funds Live 2020 Fund 1,4,5
- Page 395 and 396:
Fidelity Funds Live 2020 Fund 1,4,5
- Page 397 and 398:
Fidelity Funds Live 2020 Fund 1,4,5
- Page 399 and 400:
Fidelity Funds Live 2020 Fund 1,4,5
- Page 401 and 402:
Fidelity Funds Live 2030 Fund 1,4,5
- Page 403 and 404:
Fidelity Funds Live 2030 Fund 1,4,5
- Page 405 and 406:
Fidelity Funds Live 2030 Fund 1,4,5
- Page 407 and 408:
Fidelity Funds Live 2030 Fund 1,4,5
- Page 409 and 410:
Fidelity Funds Live Today Fund 1,4,
- Page 411 and 412:
Fidelity Funds Live Today Fund 1,4,
- Page 413 and 414:
Fidelity Funds Live Today Fund 1,4,
- Page 415 and 416:
Fidelity Funds Telecommunication Se
- Page 417 and 418:
Fidelity Funds FAWF America Fund 1,
- Page 419 and 420:
Fidelity Funds FAWF American Divers
- Page 421 and 422:
Fidelity Funds FAWF American Growth
- Page 423 and 424:
Fidelity Funds FAWF Asian Special S
- Page 425 and 426:
Fidelity Funds FAWF International F
- Page 427 and 428:
Fidelity Funds FAWF International F
- Page 429 and 430:
Fidelity Funds FAWF International F
- Page 431 and 432:
Fidelity Funds FAWF International F
- Page 433 and 434:
Fidelity Funds FAWF Japan Fund 1,4,
- Page 435 and 436:
Fidelity Funds FAWF Pacific Fund 1,
- Page 437 and 438:
Fidelity Funds FAWF US Dollar Bond
- Page 439 and 440:
Fidelity Funds Unlisted Financials
- Page 441 and 442:
Fidelity Funds FAWF US High Income
- Page 443 and 444:
Fidelity Funds FAWF US High Income
- Page 445 and 446:
Fidelity Funds FAWF Global Balanced
- Page 447 and 448:
Fidelity Funds FAWF Global Balanced
- Page 449 and 450:
Fidelity Funds FAWF Global Balanced
- Page 451 and 452:
Fidelity Funds FAWF Global Balanced
- Page 453 and 454:
Fidelity Funds FAWF Global Balanced
- Page 455 and 456:
Fidelity Funds FAWF Global Balanced
- Page 457 and 458:
Fidelity Funds Bought USD Sold EUR
- Page 459 and 460:
Fidelity Funds Institutional Americ
- Page 461 and 462:
Fidelity Funds Institutional Asia P
- Page 463 and 464:
Fidelity Funds Institutional Emergi
- Page 465 and 466:
Fidelity Funds Institutional Euro B
- Page 467 and 468:
Fidelity Funds Institutional Global
- Page 469 and 470:
Fidelity Funds Institutional Hong K
- Page 471 and 472:
Fidelity Funds Institutional Hong K
- Page 473 and 474:
Fidelity Funds Institutional Japan
- Page 475 and 476:
Fidelity Funds Institutional Europe
- Page 477 and 478:
Fidelity Funds Credit Default Swaps
- Page 479 and 480:
Fidelity Funds Institutional Global
- Page 481 and 482:
Fidelity Funds NAME CURRENCY ASSETS
- Page 483 and 484:
Fidelity Funds NAME CURRENCY ASSETS
- Page 485 and 486:
Fidelity Funds NAME CURRENCY ASSETS
- Page 487 and 488:
Fidelity Funds NAME CURRENCY ASSETS
- Page 489 and 490:
Fidelity Funds NAME CURRENCY ASSETS
- Page 491 and 492:
Fidelity Funds NAME CURRENCY ASSETS
- Page 493 and 494:
Fidelity Funds NAME CURRENCY Statem
- Page 495 and 496:
Fidelity Funds NAME CURRENCY Statem
- Page 497 and 498:
Fidelity Funds NAME CURRENCY Statem
- Page 499 and 500:
Fidelity Funds NAME CURRENCY Statem
- Page 501 and 502:
Fidelity Funds NAME CURRENCY Statem
- Page 503 and 504:
Fidelity Funds Statement of Net Ass
- Page 505 and 506:
Fidelity Funds Statement of Net Ass
- Page 507 and 508:
Fidelity Funds Statement of Net Ass
- Page 509 and 510:
Fidelity Funds Statement of Net Ass
- Page 511 and 512:
Fidelity Funds Statement of Net Ass
- Page 513 and 514:
Fidelity Funds Statement of Net Ass
- Page 515 and 516:
Fidelity Funds Statement of Net Ass
- Page 517 and 518:
Fidelity Funds Notes to the Financi
- Page 519 and 520:
Fidelity Funds Notes to the Financi
- Page 521 and 522:
Fidelity Funds Notes to the Financi
- Page 523 and 524:
Fidelity Funds Notes to the Financi
- Page 525 and 526:
Fidelity Funds 10. Credit Facility
- Page 527 and 528:
Fidelity Funds Directory Registered