- Page 1 and 2:
Fidelity Funds Société d’invest
- Page 3 and 4:
Fidelity Funds Introduction Fidelit
- Page 5 and 6:
Fidelity Funds Investment Manager
- Page 7 and 8:
Fidelity Funds Footnotes 1 These su
- Page 9 and 10:
Fidelity Funds American Diversified
- Page 11 and 12:
Fidelity Funds American Diversified
- Page 13 and 14:
Fidelity Funds ASEAN Fund Schedule
- Page 15 and 16:
Fidelity Funds Asia Pacific Dividen
- Page 17 and 18:
Fidelity Funds Asia Pacific Propert
- Page 19 and 20:
Fidelity Funds Asian Equity Fund 1,
- Page 21 and 22:
Fidelity Funds Asian Smaller Compan
- Page 23 and 24:
Fidelity Funds Asian Special Situat
- Page 25 and 26:
Fidelity Funds Australia Fund Sched
- Page 27 and 28:
Fidelity Funds China Focus Fund Sch
- Page 29 and 30:
Fidelity Funds China Opportunities
- Page 31 and 32:
Fidelity Funds Emerging Asia Fund S
- Page 33 and 34:
Fidelity Funds Emerging Europe, Mid
- Page 35 and 36:
Fidelity Funds Emerging Markets Fun
- Page 37 and 38:
Fidelity Funds Euro Blue Chip Fund
- Page 39 and 40:
Fidelity Funds European Aggressive
- Page 41 and 42:
Fidelity Funds European Dynamic Gro
- Page 43 and 44:
Fidelity Funds European Fund 1,4 Sc
- Page 45 and 46:
Fidelity Funds European Fund 1,4 -
- Page 47 and 48:
Fidelity Funds European Larger Comp
- Page 49 and 50:
Fidelity Funds European Smaller Com
- Page 51 and 52:
Fidelity Funds European Special Sit
- Page 53 and 54:
Fidelity Funds Germany Fund Schedul
- Page 55 and 56:
Fidelity Funds Global Demographics
- Page 57 and 58:
Fidelity Funds Global Dividend Fund
- Page 59 and 60:
Fidelity Funds Global Focus Fund Sc
- Page 61 and 62:
Fidelity Funds Global Health Care F
- Page 63 and 64:
Fidelity Funds Global Industrials F
- Page 65 and 66:
Fidelity Funds Global Opportunities
- Page 67 and 68:
Fidelity Funds Global Real Asset Se
- Page 69 and 70:
Fidelity Funds Global Technology Fu
- Page 71 and 72:
Fidelity Funds Greater China Fund S
- Page 73 and 74:
Fidelity Funds Greater China Fund I
- Page 75 and 76:
Fidelity Funds Iberia Fund Schedule
- Page 77 and 78:
Fidelity Funds Indonesia Fund Sched
- Page 79 and 80:
Fidelity Funds International Fund -
- Page 81 and 82:
Fidelity Funds International Fund -
- Page 83 and 84:
Fidelity Funds International Fund -
- Page 85 and 86:
Fidelity Funds Marwyn Value Investo
- Page 87 and 88:
Fidelity Funds Italy Fund Schedule
- Page 89 and 90:
Fidelity Funds Japan Fund Schedule
- Page 91 and 92:
Fidelity Funds Japan Smaller Compan
- Page 93 and 94:
Fidelity Funds Latin America Fund S
- Page 95 and 96:
Fidelity Funds Nordic Fund Schedule
- Page 97 and 98:
Fidelity Funds Pacific Fund - conti
- Page 99 and 100:
Fidelity Funds South East Asia Fund
- Page 101 and 102:
Fidelity Funds Switzerland Fund Sch
- Page 103 and 104:
Fidelity Funds Thailand Fund Schedu
- Page 105 and 106:
Fidelity Funds World Fund Schedule
- Page 107 and 108:
Fidelity Funds World Fund - continu
- Page 109 and 110:
Fidelity Funds World Fund - continu
- Page 111 and 112:
Fidelity Funds World Fund - continu
- Page 113 and 114:
Fidelity Funds Futures World Fund -
- Page 115 and 116:
Fidelity Funds Fidelity Patrimoine
- Page 117 and 118:
Fidelity Funds Fidelity Patrimoine
- Page 119 and 120:
Fidelity Funds Fidelity Patrimoine
- Page 121 and 122:
Fidelity Funds Fidelity Patrimoine
- Page 123 and 124:
Fidelity Funds Bangkok Bank NVDR TH
- Page 125 and 126:
Fidelity Funds Fidelity Sélection
- Page 127 and 128:
Fidelity Funds Fidelity Sélection
- Page 129 and 130:
Fidelity Funds Fidelity Sélection
- Page 131 and 132:
Fidelity Funds Fidelity Sélection
- Page 133 and 134:
Fidelity Funds Fidelity Sélection
- Page 135 and 136:
Fidelity Funds Fidelity Sélection
- Page 137 and 138:
Fidelity Funds Contracts For Differ
- Page 139 and 140:
Fidelity Funds FPS Global Growth Fu
- Page 141 and 142:
Fidelity Funds FPS Global Growth Fu
- Page 143 and 144:
Fidelity Funds FPS Global Growth Fu
- Page 145 and 146:
Fidelity Funds Industrials Glencore
- Page 147 and 148:
Fidelity Funds FPS Growth Fund 4 Sc
- Page 149 and 150:
Fidelity Funds FPS Growth Fund 4 -
- Page 151 and 152:
Fidelity Funds FPS Growth Fund 4 -
- Page 153 and 154:
Fidelity Funds FPS Growth Fund 4 -
- Page 155 and 156:
Fidelity Funds FPS Moderate Growth
- Page 157 and 158:
Fidelity Funds FPS Moderate Growth
- Page 159 and 160:
Fidelity Funds FPS Moderate Growth
- Page 161 and 162:
Fidelity Funds FPS Moderate Growth
- Page 163 and 164:
Fidelity Funds Euro Balanced Fund -
- Page 165 and 166:
Fidelity Funds Euro Bund Future 06/
- Page 167 and 168:
Fidelity Funds Growth & Income Fund
- Page 169 and 170:
Fidelity Funds Growth & Income Fund
- Page 171 and 172:
Fidelity Funds Growth & Income Fund
- Page 173 and 174:
Fidelity Funds Growth & Income Fund
- Page 175 and 176:
Fidelity Funds Growth & Income Fund
- Page 177 and 178:
Fidelity Funds USI Holdings 4.310%
- Page 179 and 180:
Fidelity Funds Pay fixed 2.435% rec
- Page 181 and 182:
Fidelity Funds Multi Asset Navigato
- Page 183 and 184:
Fidelity Funds Multi Asset Navigato
- Page 185 and 186: Fidelity Funds Multi Asset Navigato
- Page 187 and 188: Fidelity Funds Multi Asset Navigato
- Page 189 and 190: Fidelity Funds Bought CAD Sold USD
- Page 191 and 192: Fidelity Funds Multi Asset Strategi
- Page 193 and 194: Fidelity Funds Multi Asset Strategi
- Page 195 and 196: Fidelity Funds Multi Asset Strategi
- Page 197 and 198: Fidelity Funds Information Technolo
- Page 199 and 200: Fidelity Funds Multi Asset Strategi
- Page 201 and 202: Fidelity Funds Multi Asset Strategi
- Page 203 and 204: Fidelity Funds Multi Asset Strategi
- Page 205 and 206: Fidelity Funds Multi Asset Strategi
- Page 207 and 208: Fidelity Funds Credit Default Swaps
- Page 209 and 210: Fidelity Funds Asian Bond Fund Sche
- Page 211 and 212: Fidelity Funds Asian High Yield Fun
- Page 213 and 214: Fidelity Funds Cemex Finance 9.50%
- Page 215 and 216: Fidelity Funds China RMB Bond Fund
- Page 217 and 218: Fidelity Funds Core Euro Bond Fund
- Page 219 and 220: Fidelity Funds Emerging Market Debt
- Page 221 and 222: Fidelity Funds Emerging Market Debt
- Page 223 and 224: Fidelity Funds Euro Bond Fund Sched
- Page 225 and 226: Fidelity Funds Euro Corporate Bond
- Page 227 and 228: Fidelity Funds Euro Short Term Bond
- Page 229 and 230: Fidelity Funds European High Yield
- Page 231 and 232: Fidelity Funds European High Yield
- Page 233 and 234: Fidelity Funds Bought EUR Sold USD
- Page 235: Fidelity Funds Global Corporate Bon
- Page 239 and 240: Fidelity Funds Global High Yield Bo
- Page 241 and 242: Fidelity Funds Global High Yield Bo
- Page 243 and 244: Fidelity Funds Global High Yield Bo
- Page 245 and 246: Fidelity Funds Global High Yield Bo
- Page 247 and 248: Fidelity Funds Global High Yield Fo
- Page 249 and 250: Fidelity Funds Global Inflation-lin
- Page 251 and 252: Fidelity Funds Bought SEK Sold USD
- Page 253 and 254: Fidelity Funds Global Strategic Bon
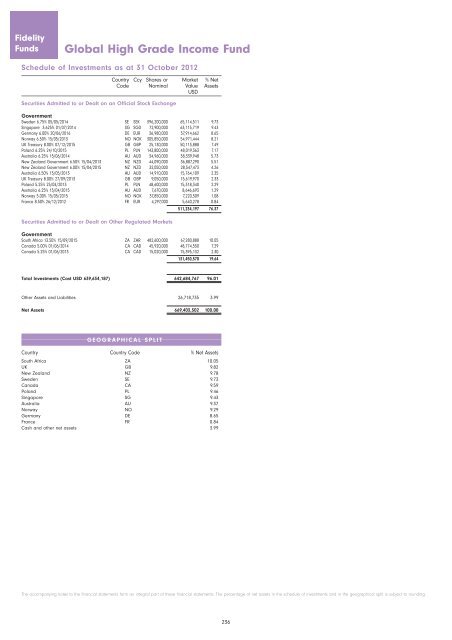
- Page 255 and 256: Fidelity Funds Global Strategic Bon
- Page 257 and 258: Fidelity Funds Global Strategic Bon
- Page 259 and 260: Fidelity Funds Global Strategic Bon
- Page 261 and 262: Fidelity Funds Global Strategic Bon
- Page 263 and 264: Fidelity Funds Futures Long Gilt Fu
- Page 265 and 266: Fidelity Funds International Bond F
- Page 267 and 268: Fidelity Funds International Bond F
- Page 269 and 270: Fidelity Funds Bought USD Sold EUR
- Page 271 and 272: Fidelity Funds Sterling Bond Fund -
- Page 273 and 274: Fidelity Funds US Dollar Bond Fund
- Page 275 and 276: Fidelity Funds Unlisted Financials
- Page 277 and 278: Fidelity Funds US High Yield Fund -
- Page 279 and 280: Fidelity Funds US High Yield Fund -
- Page 281 and 282: Fidelity Funds Euro Cash Fund 1 Sch
- Page 283 and 284: Fidelity Funds MoneyBuilder Europe
- Page 285 and 286: Fidelity Funds Rockwell Petroleum P
- Page 287 and 288:
Fidelity Funds MoneyBuilder Europea
- Page 289 and 290:
Fidelity Funds Proud 1 A 0.569% FRN
- Page 291 and 292:
Fidelity Funds MoneyBuilder Global
- Page 293 and 294:
Fidelity Funds MoneyBuilder Global
- Page 295 and 296:
Fidelity Funds MoneyBuilder Global
- Page 297 and 298:
Fidelity Funds MoneyBuilder Global
- Page 299 and 300:
Fidelity Funds Open Ended Fund Fide
- Page 301 and 302:
Fidelity Funds Diversified Income F
- Page 303 and 304:
Fidelity Funds Diversified Income F
- Page 305 and 306:
Fidelity Funds Diversified Income F
- Page 307 and 308:
Fidelity Funds Diversified Income F
- Page 309 and 310:
Fidelity Funds Diversified Income F
- Page 311 and 312:
Fidelity Funds Diversified Income F
- Page 313 and 314:
Fidelity Funds Diversified Income F
- Page 315 and 316:
Fidelity Funds Diversified Income F
- Page 317 and 318:
Fidelity Funds Bought USD Sold JPY
- Page 319 and 320:
Fidelity Funds Fidelity Target 2020
- Page 321 and 322:
Fidelity Funds Fidelity Target 2020
- Page 323 and 324:
Fidelity Funds Fidelity Target 2020
- Page 325 and 326:
Fidelity Funds Fidelity Target 2020
- Page 327 and 328:
Fidelity Funds Fidelity Target 2020
- Page 329 and 330:
Fidelity Funds Fidelity Target 2020
- Page 331 and 332:
Fidelity Funds Japan 10 Year Bond F
- Page 333 and 334:
Fidelity Funds Fidelity Target 2015
- Page 335 and 336:
Fidelity Funds Fidelity Target 2015
- Page 337 and 338:
Fidelity Funds Fidelity Target 2015
- Page 339 and 340:
Fidelity Funds Fidelity Target 2015
- Page 341 and 342:
Fidelity Funds Ip Access (C)* GB GB
- Page 343 and 344:
Fidelity Funds Fidelity Target 2020
- Page 345 and 346:
Fidelity Funds Fidelity Target 2020
- Page 347 and 348:
Fidelity Funds Fidelity Target 2020
- Page 349 and 350:
Fidelity Funds Fidelity Target 2020
- Page 351 and 352:
Fidelity Funds Fidelity Target 2020
- Page 353 and 354:
Fidelity Funds Futures Fidelity Tar
- Page 355 and 356:
Fidelity Funds Fidelity Target 2025
- Page 357 and 358:
Fidelity Funds Fidelity Target 2025
- Page 359 and 360:
Fidelity Funds Fidelity Target 2025
- Page 361 and 362:
Fidelity Funds Fidelity Target 2025
- Page 363 and 364:
Fidelity Funds Ip Access (C)* GB GB
- Page 365 and 366:
Fidelity Funds Fidelity Target 2030
- Page 367 and 368:
Fidelity Funds Fidelity Target 2030
- Page 369 and 370:
Fidelity Funds Fidelity Target 2030
- Page 371 and 372:
Fidelity Funds Fidelity Target 2030
- Page 373 and 374:
Fidelity Funds Fidelity Target 2030
- Page 375 and 376:
Fidelity Funds Fidelity Target 2030
- Page 377 and 378:
Fidelity Funds Fidelity Target 2035
- Page 379 and 380:
Fidelity Funds Fidelity Target 2035
- Page 381 and 382:
Fidelity Funds Fidelity Target 2035
- Page 383 and 384:
Fidelity Funds Fidelity Target 2040
- Page 385 and 386:
Fidelity Funds Fidelity Target 2040
- Page 387 and 388:
Fidelity Funds Fidelity Target 2040
- Page 389 and 390:
Fidelity Funds Fidelity Target 2040
- Page 391 and 392:
Fidelity Funds Live 2020 Fund 1,4,5
- Page 393 and 394:
Fidelity Funds Live 2020 Fund 1,4,5
- Page 395 and 396:
Fidelity Funds Live 2020 Fund 1,4,5
- Page 397 and 398:
Fidelity Funds Live 2020 Fund 1,4,5
- Page 399 and 400:
Fidelity Funds Live 2020 Fund 1,4,5
- Page 401 and 402:
Fidelity Funds Live 2030 Fund 1,4,5
- Page 403 and 404:
Fidelity Funds Live 2030 Fund 1,4,5
- Page 405 and 406:
Fidelity Funds Live 2030 Fund 1,4,5
- Page 407 and 408:
Fidelity Funds Live 2030 Fund 1,4,5
- Page 409 and 410:
Fidelity Funds Live Today Fund 1,4,
- Page 411 and 412:
Fidelity Funds Live Today Fund 1,4,
- Page 413 and 414:
Fidelity Funds Live Today Fund 1,4,
- Page 415 and 416:
Fidelity Funds Telecommunication Se
- Page 417 and 418:
Fidelity Funds FAWF America Fund 1,
- Page 419 and 420:
Fidelity Funds FAWF American Divers
- Page 421 and 422:
Fidelity Funds FAWF American Growth
- Page 423 and 424:
Fidelity Funds FAWF Asian Special S
- Page 425 and 426:
Fidelity Funds FAWF International F
- Page 427 and 428:
Fidelity Funds FAWF International F
- Page 429 and 430:
Fidelity Funds FAWF International F
- Page 431 and 432:
Fidelity Funds FAWF International F
- Page 433 and 434:
Fidelity Funds FAWF Japan Fund 1,4,
- Page 435 and 436:
Fidelity Funds FAWF Pacific Fund 1,
- Page 437 and 438:
Fidelity Funds FAWF US Dollar Bond
- Page 439 and 440:
Fidelity Funds Unlisted Financials
- Page 441 and 442:
Fidelity Funds FAWF US High Income
- Page 443 and 444:
Fidelity Funds FAWF US High Income
- Page 445 and 446:
Fidelity Funds FAWF Global Balanced
- Page 447 and 448:
Fidelity Funds FAWF Global Balanced
- Page 449 and 450:
Fidelity Funds FAWF Global Balanced
- Page 451 and 452:
Fidelity Funds FAWF Global Balanced
- Page 453 and 454:
Fidelity Funds FAWF Global Balanced
- Page 455 and 456:
Fidelity Funds FAWF Global Balanced
- Page 457 and 458:
Fidelity Funds Bought USD Sold EUR
- Page 459 and 460:
Fidelity Funds Institutional Americ
- Page 461 and 462:
Fidelity Funds Institutional Asia P
- Page 463 and 464:
Fidelity Funds Institutional Emergi
- Page 465 and 466:
Fidelity Funds Institutional Euro B
- Page 467 and 468:
Fidelity Funds Institutional Global
- Page 469 and 470:
Fidelity Funds Institutional Hong K
- Page 471 and 472:
Fidelity Funds Institutional Hong K
- Page 473 and 474:
Fidelity Funds Institutional Japan
- Page 475 and 476:
Fidelity Funds Institutional Europe
- Page 477 and 478:
Fidelity Funds Credit Default Swaps
- Page 479 and 480:
Fidelity Funds Institutional Global
- Page 481 and 482:
Fidelity Funds NAME CURRENCY ASSETS
- Page 483 and 484:
Fidelity Funds NAME CURRENCY ASSETS
- Page 485 and 486:
Fidelity Funds NAME CURRENCY ASSETS
- Page 487 and 488:
Fidelity Funds NAME CURRENCY ASSETS
- Page 489 and 490:
Fidelity Funds NAME CURRENCY ASSETS
- Page 491 and 492:
Fidelity Funds NAME CURRENCY ASSETS
- Page 493 and 494:
Fidelity Funds NAME CURRENCY Statem
- Page 495 and 496:
Fidelity Funds NAME CURRENCY Statem
- Page 497 and 498:
Fidelity Funds NAME CURRENCY Statem
- Page 499 and 500:
Fidelity Funds NAME CURRENCY Statem
- Page 501 and 502:
Fidelity Funds NAME CURRENCY Statem
- Page 503 and 504:
Fidelity Funds Statement of Net Ass
- Page 505 and 506:
Fidelity Funds Statement of Net Ass
- Page 507 and 508:
Fidelity Funds Statement of Net Ass
- Page 509 and 510:
Fidelity Funds Statement of Net Ass
- Page 511 and 512:
Fidelity Funds Statement of Net Ass
- Page 513 and 514:
Fidelity Funds Statement of Net Ass
- Page 515 and 516:
Fidelity Funds Statement of Net Ass
- Page 517 and 518:
Fidelity Funds Notes to the Financi
- Page 519 and 520:
Fidelity Funds Notes to the Financi
- Page 521 and 522:
Fidelity Funds Notes to the Financi
- Page 523 and 524:
Fidelity Funds Notes to the Financi
- Page 525 and 526:
Fidelity Funds 10. Credit Facility
- Page 527 and 528:
Fidelity Funds Directory Registered