Semi-Annual Report and Accounts - chartbook.fid-intl.com
Semi-Annual Report and Accounts - chartbook.fid-intl.com
Semi-Annual Report and Accounts - chartbook.fid-intl.com

You also want an ePaper? Increase the reach of your titles
YUMPU automatically turns print PDFs into web optimized ePapers that Google loves.
Fidelity<br />
Funds<br />
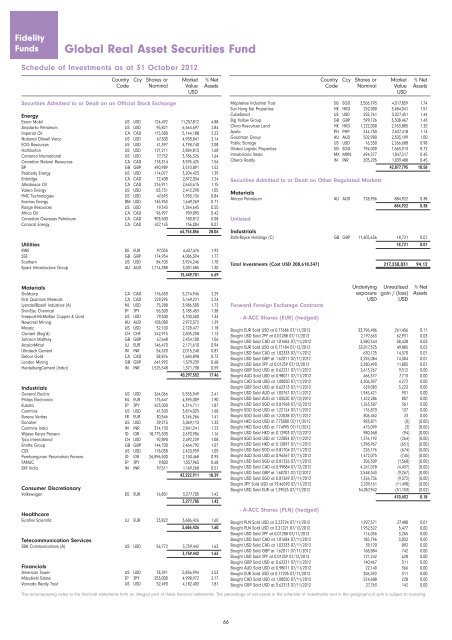
Global Real Asset Securities Fund<br />
Schedule of Investments as at 31 October 2012<br />
Country Ccy Shares or Market % Net<br />
Code Nominal Value Assets<br />
USD<br />
Securities Admitted to or Dealt on an Official Stock Exchange<br />
Energy<br />
Exxon Mobil US USD 124,492 11,257,812 4.88<br />
Anadarko Petroleum US USD 95,821 6,564,697 2.84<br />
Imperial Oil CA CAD 115,580 5,144,188 2.23<br />
National Oilwell Varco US USD 67,305 4,938,841 2.14<br />
EOG Resources US USD 41,397 4,798,740 2.08<br />
Halliburton US USD 121,211 3,884,813 1.68<br />
Cameron International US USD 77,732 3,786,326 1.64<br />
Canadian Natural Resources CA CAD 118,314 3,595,425 1.56<br />
BP GB GBP 490,989 3,510,891 1.52<br />
Peabody Energy US USD 114,077 3,204,423 1.39<br />
Enbridge CA CAD 72,408 2,872,034 1.24<br />
Athabasca Oil CA CAD 216,911 2,643,615 1.15<br />
Valero Energy US USD 83,731 2,412,290 1.05<br />
FMC Technologies US USD 47,693 1,930,136 0.84<br />
Kosmos Energy BM USD 145,953 1,649,269 0.71<br />
Range Resources US USD 19,343 1,264,645 0.55<br />
Africa Oil CA CAD 96,997 959,895 0.42<br />
Canadian Overseas Petroleum CA CAD 903,500 180,812 0.08<br />
Canacol Energy CA CAD 427,143 156,004 0.07<br />
64,754,856 28.06<br />
Utilities<br />
RWE DE EUR 97,035 4,437,476 1.92<br />
SSE GB GBP 174,954 4,086,394 1.77<br />
Southern US USD 84,103 3,924,246 1.70<br />
Spark Infrastructure Group AU AUD 1,714,388 3,001,585 1.30<br />
15,449,701 6.69<br />
Materials<br />
Goldcorp CA CAD 116,630 5,274,946 2.29<br />
First Quantum Minerals CA CAD 229,295 5,169,221 2.24<br />
LyondellBasell Industries (A) NL USD 75,288 3,986,500 1.73<br />
Shin-Etsu Chemical JP JPY 56,500 3,185,453 1.38<br />
Freeport-McMoRan Copper & Gold US USD 79,500 3,100,500 1.34<br />
Newcrest Mining AU AUD 108,080 2,972,372 1.29<br />
Mosaic US USD 52,100 2,728,477 1.18<br />
Clariant (Reg’d) CH CHF 242,915 2,603,258 1.13<br />
Johnson Matthey GB GBP 67,648 2,454,100 1.06<br />
ArcelorMittal LU EUR 146,470 2,171,610 0.94<br />
Ultratech Cement IN INR 54,520 2,015,240 0.87<br />
Detour Gold CA CAD 58,876 1,684,898 0.73<br />
London Mining GB GBP 641,993 1,579,239 0.68<br />
HeidelbergCement (India) IN INR 1,525,548 1,371,738 0.59<br />
40,297,552 17.46<br />
Industrials<br />
General Electric US USD 264,066 5,555,949 2.41<br />
Philips Electronics NL EUR 175,647 4,395,009 1.90<br />
Kubota JP JPY 423,000 4,314,711 1.87<br />
Cummins US USD 41,500 3,874,025 1.68<br />
Bureau Veritas FR EUR 30,546 3,246,266 1.41<br />
Danaher US USD 59,215 3,069,113 1.33<br />
Cummins India IN INR 314,130 2,841,241 1.23<br />
Wijaya Karya Persero ID IDR 18,775,500 2,670,906 1.16<br />
Tyco International CH USD 92,890 2,492,239 1.08<br />
Smiths Group GB GBP 144,700 2,464,792 1.07<br />
CSX US USD 118,038 2,420,959 1.05<br />
Pembangunan Perumahan Persero ID IDR 26,896,500 2,150,468 0.93<br />
FANUC JP JPY 9,800 1,557,965 0.68<br />
SKF India IN INR 97,511 1,169,268 0.51<br />
42,222,911 18.29<br />
Consumer Discretionary<br />
Volkswagen DE EUR 16,801 3,277,705 1.42<br />
3,277,705 1.42<br />
Healthcare<br />
Eurofins Scientific LU EUR 23,822 3,686,426 1.60<br />
3,686,426 1.60<br />
Tele<strong>com</strong>munication Services<br />
SBA Communications (A) US USD 56,772 3,759,442 1.63<br />
3,759,442 1.63<br />
Financials<br />
American Tower US USD 78,391 5,836,994 2.53<br />
Mitsubishi Estate JP JPY 253,000 4,998,972 2.17<br />
Vornado Realty Trust US USD 52,490 4,182,403 1.81<br />
66<br />
Mapletree Industrial Trust SG SGD 3,506,793 4,017,859 1.74<br />
Sun Hung Kai Properties HK HKD 252,000 3,484,341 1.51<br />
CubeSmart US USD 255,761 3,327,451 1.44<br />
Big Yellow Group GB GBP 599,726 3,308,467 1.43<br />
China Resources L<strong>and</strong> HK HKD 1,222,000 2,763,885 1.20<br />
Ayala PH PHP 244,750 2,637,418 1.14<br />
Goodman Group AU AUD 502,980 2,303,199 1.00<br />
Public Storage US USD 16,550 2,266,688 0.98<br />
Global Logistic Properties SG SGD 794,000 1,663,313 0.72<br />
Inmobiliaria Vesta MX MXN 694,577 1,047,317 0.45<br />
Oberoi Realty IN INR 205,205 1,039,488 0.45<br />
42,877,795 18.58<br />
Securities Admitted to or Dealt on Other Regulated Markets<br />
Materials<br />
African Petroleum AU AUD 728,936 884,922 0.38<br />
884,922 0.38<br />
Unlisted<br />
Industrials<br />
Rolls-Royce Holdings (C) GB GBP 11,605,656 18,721 0.01<br />
18,721 0.01<br />
Total Investments (Cost USD 208,618,347) 217,230,031 94.12<br />
Forward Foreign Exchange Contracts<br />
- A-ACC Shares (EUR) (hedged)<br />
Underlying Unrealised % Net<br />
exposure gain / (loss) Assets<br />
USD USD<br />
Bought EUR Sold USD at 0.77686 07/11/2012 33,796,486 261,456 0.11<br />
Bought USD Sold JPY at 0.01288 07/11/2012 2,197,663 62,931 0.03<br />
Bought USD Sold CAD at 1.01684 07/11/2012 3,580,544 58,428 0.03<br />
Bought EUR Sold USD at 0.77184 07/12/2012 33,017,325 49,885 0.02<br />
Bought USD Sold CAD at 1.02333 07/11/2012 630,125 14,370 0.01<br />
Bought USD Sold GBP at 1.62011 07/11/2012 3,255,084 14,304 0.01<br />
Bought USD Sold JPY at 0.01259 07/12/2012 2,280,490 11,805 0.01<br />
Bought GBP Sold USD at 0.62221 07/11/2012 2,613,267 9,512 0.00<br />
Bought AUD Sold USD at 0.98011 07/11/2012 466,377 7,713 0.00<br />
Bought CAD Sold USD at 1.00050 07/11/2012 4,206,397 4,272 0.00<br />
Bought GBP Sold USD at 0.62313 07/11/2012 629,083 3,223 0.00<br />
Bought USD Sold AUD at 1.03767 07/11/2012 1,945,421 931 0.00<br />
Bought USD Sold AUD at 1.03520 07/12/2012 1,422,286 807 0.00<br />
Bought USD Sold SGD at 0.81968 07/12/2012 1,263,587 361 0.00<br />
Bought SGD Sold USD at 1.22124 07/11/2012 176,870 137 0.00<br />
Bought SGD Sold USD at 1.22038 07/11/2012 306,462 23 0.00<br />
Bought HKD Sold USD at 7.75000 07/11/2012 983,871 (0) (0.00)<br />
Bought HKD Sold USD at 7.74995 07/11/2012 415,099 (3) (0.00)<br />
Bought USD Sold HKD at 0.12903 07/12/2012 980,568 (94) (0.00)<br />
Bought SGD Sold USD at 1.22004 07/11/2012 1,276,192 (264) (0.00)<br />
Bought USD Sold HKD at 0.12897 07/11/2012 1,398,967 (651) (0.00)<br />
Bought USD Sold SGD at 0.81704 07/11/2012 226,176 (674) (0.00)<br />
Bought AUD Sold USD at 0.96367 07/11/2012 1,472,075 (745) (0.00)<br />
Bought USD Sold SGD at 0.81326 07/11/2012 206,509 (1,568) (0.00)<br />
Bought USD Sold CAD at 0.99884 07/12/2012 4,261,078 (4,437) (0.00)<br />
Bought USD Sold GBP at 1.60701 07/12/2012 2,548,343 (9,267) (0.00)<br />
Bought USD Sold SGD at 0.81369 07/11/2012 1,326,736 (9,372) (0.00)<br />
Bought JPY Sold USD at 79.46590 07/11/2012 2,209,161 (11,498) (0.00)<br />
Bought USD Sold EUR at 1.29525 07/11/2012 34,057,942 (51,153) (0.02)<br />
410,432 0.18<br />
- A-ACC Shares (PLN) (hedged)<br />
Country Ccy Shares or Market % Net<br />
Code Nominal Value Assets<br />
USD<br />
Bought PLN Sold USD at 3.23724 07/11/2012 1,927,571 27,488 0.01<br />
Bought PLN Sold USD at 3.21221 07/12/2012 1,952,522 5,477 0.00<br />
Bought USD Sold JPY at 0.01288 07/11/2012 114,036 3,265 0.00<br />
Bought USD Sold CAD at 1.01684 07/11/2012 185,796 3,032 0.00<br />
Bought USD Sold CAD at 1.02333 07/11/2012 39,120 892 0.00<br />
Bought USD Sold GBP at 1.62011 07/11/2012 168,884 742 0.00<br />
Bought USD Sold JPY at 0.01259 07/12/2012 121,242 628 0.00<br />
Bought GBP Sold USD at 0.62221 07/11/2012 140,467 511 0.00<br />
Bought AUD Sold USD at 0.98011 07/11/2012 22,140 366 0.00<br />
Bought EUR Sold USD at 0.77205 07/11/2012 206,592 311 0.00<br />
Bought CAD Sold USD at 1.00050 07/11/2012 224,688 228 0.00<br />
Bought GBP Sold USD at 0.62313 07/11/2012 27,763 142 0.00<br />
The ac<strong>com</strong>panying notes to the financial statements form an integral part of these financial statements. The percentage of net assets in the schedule of investments <strong>and</strong> in the geographical split is subject to rounding.