

OECD Handbook on Measuring the Space Economy - OECD Online ...
OECD Handbook on Measuring the Space Economy - OECD Online ...
OECD Handbook on Measuring the Space Economy - OECD Online ...

You also want an ePaper? Increase the reach of your titles
YUMPU automatically turns print PDFs into web optimized ePapers that Google loves.
II.6. INTENSITY INDICATORS: SELECTED ACTIVITIES AND OUTPUTS IN THE SPACE ECONOMY<br />
The manufacturing space industry<br />
74<br />
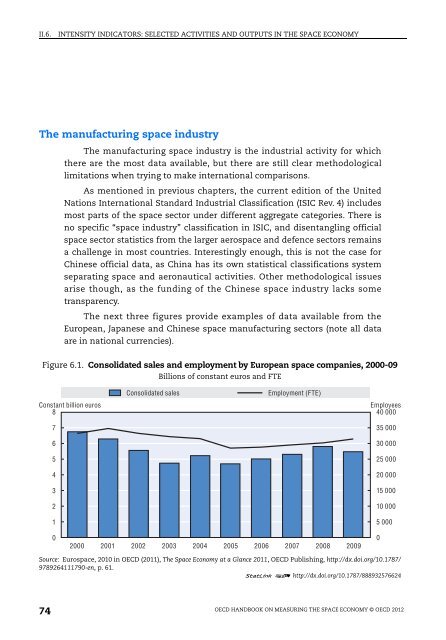
The manufacturing space industry is <strong>the</strong> industrial activity for which<br />
<strong>the</strong>re are <strong>the</strong> most data available, but <strong>the</strong>re are still clear methodological<br />
limitati<strong>on</strong>s when trying to make internati<strong>on</strong>al comparis<strong>on</strong>s.<br />
As menti<strong>on</strong>ed in previous chapters, <strong>the</strong> current editi<strong>on</strong> of <strong>the</strong> United<br />
Nati<strong>on</strong>s Internati<strong>on</strong>al Standard Industrial Classificati<strong>on</strong> (ISIC Rev. 4) includes<br />
most parts of <strong>the</strong> space sector under different aggregate categories. There is<br />
no specific “space industry” classificati<strong>on</strong> in ISIC, and disentangling official<br />
space sector statistics from <strong>the</strong> larger aerospace and defence sectors remains<br />
a challenge in most countries. Interestingly enough, this is not <strong>the</strong> case for<br />
Chinese official data, as China has its own statistical classificati<strong>on</strong>s system<br />
separating space and aer<strong>on</strong>autical activities. O<strong>the</strong>r methodological issues<br />
arise though, as <strong>the</strong> funding of <strong>the</strong> Chinese space industry lacks some<br />
transparency.<br />
The next three figures provide examples of data available from <strong>the</strong><br />
European, Japanese and Chinese space manufacturing sectors (note all data<br />
are in nati<strong>on</strong>al currencies).<br />
Figure 6.1. C<strong>on</strong>solidated sales and employment by European space companies, 2000-09<br />
Billi<strong>on</strong>s of c<strong>on</strong>stant euros and FTE<br />
C<strong>on</strong>solidated sales Employment (FTE)<br />
C<strong>on</strong>stant billi<strong>on</strong> euros Employees<br />
8 40 000<br />
7<br />
6<br />
5<br />
4<br />
3<br />
2<br />
1<br />
0<br />
2000 2001 2002 2003 2004 2005 2006 2007 2008 2009<br />
35 000<br />
30 000<br />
25 000<br />
20 000<br />
15 000<br />
10 000<br />
Source: Eurospace, 2010 in <str<strong>on</strong>g>OECD</str<strong>on</strong>g> (2011), The <strong>Space</strong> Ec<strong>on</strong>omy at a Glance 2011, <str<strong>on</strong>g>OECD</str<strong>on</strong>g> Publishing, http://dx.doi.org/10.1787/<br />
9789264111790-en, p. 61.<br />
1 2 http://dx.doi.org/10.1787/888932576624<br />
5 000<br />
<str<strong>on</strong>g>OECD</str<strong>on</strong>g> HANDBOOK ON MEASURING THE SPACE ECONOMY © <str<strong>on</strong>g>OECD</str<strong>on</strong>g> 2012<br />
0


![CQE=U]^\]Z: KAZAKHSTAN - OECD Online Bookshop](https://img.yumpu.com/3915768/1/190x253/cqeuz-kazakhstan-oecd-online-bookshop.jpg?quality=85)