Capnographic Waveforms in the Mechanically Ventilated Patient
Capnographic Waveforms in the Mechanically Ventilated Patient
Capnographic Waveforms in the Mechanically Ventilated Patient

Create successful ePaper yourself
Turn your PDF publications into a flip-book with our unique Google optimized e-Paper software.
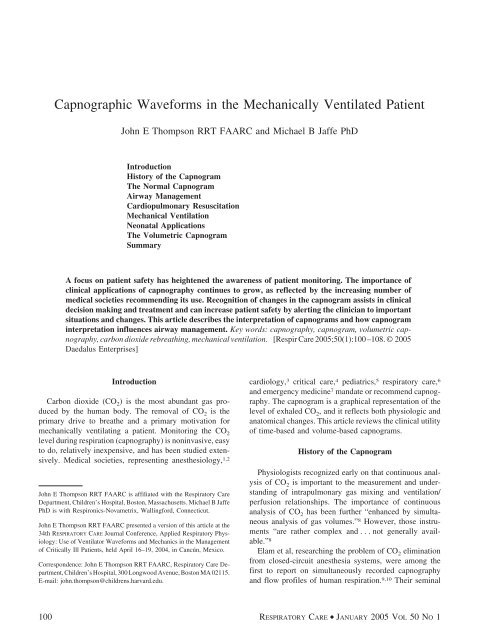
<strong>Capnographic</strong> <strong>Waveforms</strong> <strong>in</strong> <strong>the</strong> <strong>Mechanically</strong> <strong>Ventilated</strong> <strong>Patient</strong><br />
John E Thompson RRT FAARC and Michael B Jaffe PhD<br />
Introduction<br />
History of <strong>the</strong> Capnogram<br />
The Normal Capnogram<br />
Airway Management<br />
Cardiopulmonary Resuscitation<br />
Mechanical Ventilation<br />
Neonatal Applications<br />
The Volumetric Capnogram<br />
Summary<br />
A focus on patient safety has heightened <strong>the</strong> awareness of patient monitor<strong>in</strong>g. The importance of<br />
cl<strong>in</strong>ical applications of capnography cont<strong>in</strong>ues to grow, as reflected by <strong>the</strong> <strong>in</strong>creas<strong>in</strong>g number of<br />
medical societies recommend<strong>in</strong>g its use. Recognition of changes <strong>in</strong> <strong>the</strong> capnogram assists <strong>in</strong> cl<strong>in</strong>ical<br />
decision mak<strong>in</strong>g and treatment and can <strong>in</strong>crease patient safety by alert<strong>in</strong>g <strong>the</strong> cl<strong>in</strong>ician to important<br />
situations and changes. This article describes <strong>the</strong> <strong>in</strong>terpretation of capnograms and how capnogram<br />
<strong>in</strong>terpretation <strong>in</strong>fluences airway management. Key words: capnography, capnogram, volumetric capnography,<br />
carbon dioxide rebreath<strong>in</strong>g, mechanical ventilation. [Respir Care 2005;50(1):100–108. © 2005<br />
Daedalus Enterprises]<br />
Introduction<br />
Carbon dioxide (CO 2) is <strong>the</strong> most abundant gas produced<br />
by <strong>the</strong> human body. The removal of CO 2 is <strong>the</strong><br />
primary drive to brea<strong>the</strong> and a primary motivation for<br />
mechanically ventilat<strong>in</strong>g a patient. Monitor<strong>in</strong>g <strong>the</strong> CO 2<br />
level dur<strong>in</strong>g respiration (capnography) is non<strong>in</strong>vasive, easy<br />
to do, relatively <strong>in</strong>expensive, and has been studied extensively.<br />
Medical societies, represent<strong>in</strong>g anes<strong>the</strong>siology, 1,2<br />
John E Thompson RRT FAARC is affiliated with <strong>the</strong> Respiratory Care<br />
Department, Children’s Hospital, Boston, Massachusetts. Michael B Jaffe<br />
PhD is with Respironics-Novametrix, Wall<strong>in</strong>gford, Connecticut.<br />
John E Thompson RRT FAARC presented a version of this article at <strong>the</strong><br />
34th RESPIRATORY CARE Journal Conference, Applied Respiratory Physiology:<br />
Use of Ventilator <strong>Waveforms</strong> and Mechanics <strong>in</strong> <strong>the</strong> Management<br />
of Critically Ill <strong>Patient</strong>s, held April 16–19, 2004, <strong>in</strong> Cancún, Mexico.<br />
Correspondence: John E Thompson RRT FAARC, Respiratory Care Department,<br />
Children’s Hospital, 300 Longwood Avenue, Boston MA 02115.<br />
E-mail: john.thompson@childrens.harvard.edu.<br />
cardiology, 3 critical care, 4 pediatrics, 5 respiratory care, 6<br />
and emergency medic<strong>in</strong>e 7 mandate or recommend capnography.<br />
The capnogram is a graphical representation of <strong>the</strong><br />
level of exhaled CO 2, and it reflects both physiologic and<br />
anatomical changes. This article reviews <strong>the</strong> cl<strong>in</strong>ical utility<br />
of time-based and volume-based capnograms.<br />
History of <strong>the</strong> Capnogram<br />
Physiologists recognized early on that cont<strong>in</strong>uous analysis<br />
of CO 2 is important to <strong>the</strong> measurement and understand<strong>in</strong>g<br />
of <strong>in</strong>trapulmonary gas mix<strong>in</strong>g and ventilation/<br />
perfusion relationships. The importance of cont<strong>in</strong>uous<br />
analysis of CO 2 has been fur<strong>the</strong>r “enhanced by simultaneous<br />
analysis of gas volumes.” 8 However, those <strong>in</strong>struments<br />
“are ra<strong>the</strong>r complex and ...not generally available.”<br />
8<br />
Elam et al, research<strong>in</strong>g <strong>the</strong> problem of CO 2 elim<strong>in</strong>ation<br />
from closed-circuit anes<strong>the</strong>sia systems, were among <strong>the</strong><br />
first to report on simultaneously recorded capnography<br />
and flow profiles of human respiration. 9,10 Their sem<strong>in</strong>al<br />
100 RESPIRATORY CARE • JANUARY 2005 VOL 50 NO 1
CAPNOGRAPHIC WAVEFORMS IN THE MECHANICALLY VENTILATED PATIENT<br />
work on CO 2 homeostasis was published <strong>in</strong> a series of 4<br />
papers. 11–14 That research <strong>in</strong>cluded both normal and abnormal<br />
characteristics of <strong>the</strong> capnographic profile and measurements<br />
of dead space and alveolar ventilation.<br />
In 1957, Smalhout, who is considered by many <strong>the</strong> fa<strong>the</strong>r<br />
of cl<strong>in</strong>ical capnography, began us<strong>in</strong>g capnographs<br />
while work<strong>in</strong>g <strong>in</strong> <strong>the</strong> Central Military Hospital of Utrecht,<br />
The Ne<strong>the</strong>rlands. 15 Dur<strong>in</strong>g a 7-year period lead<strong>in</strong>g up to<br />
<strong>the</strong> publication of his doctoral <strong>the</strong>sis <strong>in</strong> 1967, 16 Smalhout<br />
collected approximately 6,000 capnograms, which documented<br />
numerous shape variations. 15 Smalhout and<br />
Kalenda 17 later published an atlas of strip-chart capnograms<br />
that illustrated many of <strong>the</strong> applications of capnography.<br />
However <strong>the</strong>y noted that <strong>the</strong>ir research represented<br />
“little more than <strong>the</strong> surface of a deep pool.” 17 That atlas<br />
and Smalhout’s frequent lectures on capnography helped<br />
popularize <strong>the</strong> use of <strong>the</strong> terms “capnography,” “capnograph,”<br />
and “capnogram.” We<strong>in</strong>garten 18 summarized Smalhout<br />
and Kalenda’s contributions:<br />
Under <strong>the</strong>ir direction, capnography survived a stormy<br />
gestation period as it reached maturity <strong>in</strong> The Ne<strong>the</strong>rlands.<br />
It was <strong>in</strong>troduced <strong>in</strong> <strong>the</strong> United States at a<br />
small private meet<strong>in</strong>g sponsored by a major <strong>in</strong>strument<br />
manufacturer, held <strong>in</strong> conjunction with <strong>the</strong> World<br />
Congress on Intensive Care Medic<strong>in</strong>e <strong>in</strong> Wash<strong>in</strong>gton<br />
DC, <strong>in</strong> May 1978. Five anes<strong>the</strong>siologists attended <strong>the</strong><br />
meet<strong>in</strong>g,2ofwhomconcludedthatcapnographywould<br />
prove to be of very little value.<br />
The earliest description <strong>in</strong> <strong>the</strong> literature of <strong>the</strong> volumetric<br />
capnogram and a method to determ<strong>in</strong>e “airway” dead<br />
space was from Aiken and Clark-Kennedy, <strong>in</strong> 1928. 19 In<br />
1948, Fowler, 20 described <strong>the</strong> s<strong>in</strong>gle-breath test for nitrogen<br />
curve, <strong>in</strong> seek<strong>in</strong>g to use uniform term<strong>in</strong>ology to clarify<br />
<strong>the</strong> “mean<strong>in</strong>g of dead space.” He thus divided <strong>the</strong> volumetric<br />
capnogram curve <strong>in</strong>to 4 phases (I, II, III, and IV).<br />
The term “<strong>in</strong>frared CO 2 meter” was used from <strong>the</strong> 1950s<br />
and to <strong>the</strong> early 1970s, when <strong>the</strong> term “capnograph” was<br />
derived from <strong>the</strong> Godart Capnograph.<br />
S<strong>in</strong>gle-breath CO 2 curves appeared <strong>in</strong> <strong>the</strong> literature as<br />
early as 1961. 21 The concepts of dead space and CO 2<br />
elim<strong>in</strong>ation were not presented <strong>in</strong> a unified framework,<br />
however, until Fletcher published his 1980 doctoral <strong>the</strong>sis<br />
22 and later publications. 23 His method became widely<br />
known as <strong>the</strong> s<strong>in</strong>gle-breath test or s<strong>in</strong>gle-breath CO 2 curve.<br />
The Normal Capnogram<br />
The normal capnogram has multiple features that allow<br />
for cl<strong>in</strong>ical <strong>in</strong>terpretation (Fig. 1). There are no widely<br />
accepted standards for label<strong>in</strong>g of <strong>the</strong> normal capnogram.<br />
17,24,25 A capnogram is a time-trac<strong>in</strong>g of CO 2 concentration.<br />
A capnograph has 2 record<strong>in</strong>g speeds. The fast<br />
Fig. 1. Normal features of a capnogram. A: Basel<strong>in</strong>e, represents<br />
<strong>the</strong> beg<strong>in</strong>n<strong>in</strong>g of expiration and should start at zero. B: The transitional<br />
part of <strong>the</strong> curve represents mix<strong>in</strong>g of dead space and<br />
alveolar gas. C: The alpha angle represents <strong>the</strong> change to alveolar<br />
gas. D: The alveolar part of <strong>the</strong> curve represents <strong>the</strong> plateau average<br />
alveolar gas concentration. E: The end-tidal carbon dioxide<br />
value. F: The beta angle represents <strong>the</strong> change to <strong>the</strong> <strong>in</strong>spiratory<br />
part of <strong>the</strong> cycle. G: The <strong>in</strong>spiration part of <strong>the</strong> curve shows a rapid<br />
decrease <strong>in</strong> carbon dioxide concentration.<br />
Fig. 2. Capnogram with a ris<strong>in</strong>g basel<strong>in</strong>e (A).<br />
Fig. 3. Capnogram from a patient with chronic respiratory disease<br />
shows (A) transition phase is longer than normal (shaded area). B:<br />
A large tidal volume with a prolonged expiratory phase reflects<br />
P aO2 .<br />
speed is approximately 12.5 mm/s, which allows <strong>in</strong>terpretation<br />
of short-term changes. The slow speed is approximately<br />
25 mm/m<strong>in</strong>, which allows for identify<strong>in</strong>g longterm<br />
trends. Changes <strong>in</strong> <strong>the</strong> capnogram suggest changes <strong>in</strong><br />
<strong>the</strong> patient’s condition. Proper <strong>in</strong>terpretation of <strong>the</strong> capnogram<br />
can alert a cl<strong>in</strong>ician to important changes and should<br />
<strong>in</strong>clude at least <strong>the</strong> exam<strong>in</strong>ation of 3 key features: basel<strong>in</strong>e<br />
start<strong>in</strong>g at zero; sharp <strong>in</strong>crease <strong>in</strong> CO 2 concentration; and<br />
steady alveolar plateau.<br />
An elevation of <strong>the</strong> basel<strong>in</strong>e (Fig. 2) <strong>in</strong>dicates cl<strong>in</strong>ically<br />
important rebreath<strong>in</strong>g of CO 2, which may be due to mechanical<br />
problems 26–28 or <strong>the</strong>rapeutic use of mechanical<br />
dead space.<br />
Chronic disease of <strong>the</strong> lungs and airways prolongs <strong>the</strong><br />
transitional portion of <strong>the</strong> capnogram (Fig. 3). Slow-timeconstant<br />
alveolar units cont<strong>in</strong>ue to mix alveolar gas with<br />
dead-space gas. Prolong<strong>in</strong>g <strong>the</strong> expiratory phase allows<br />
<strong>the</strong> end-tidal CO 2 (P ETCO2 ) to be more reflective of P aCO2 .<br />
RESPIRATORY CARE • JANUARY 2005 VOL 50 NO 1 101
CAPNOGRAPHIC WAVEFORMS IN THE MECHANICALLY VENTILATED PATIENT<br />
Fig. 4. A capnogram with a loss of <strong>the</strong> alveolar phase dur<strong>in</strong>g expiration<br />
suggests pneumothorax. The shaded area represents a<br />
normal capnogram.<br />
That decrease <strong>in</strong> <strong>the</strong> P ETCO2 -to-P aCO2 difference represents<br />
a decrease <strong>in</strong> dead space, and that decrease <strong>in</strong> dead space<br />
is helpful when contrast<strong>in</strong>g a spontaneous breath to that of<br />
a breath delivered by a ventilator.<br />
Inability to ma<strong>in</strong>ta<strong>in</strong> a plateau phase may be <strong>in</strong>dicative<br />
of a pneumothorax. Figure 4 illustrates <strong>the</strong> “melt<strong>in</strong>g away”<br />
of <strong>the</strong> alveolar plateau (ie, a dramatic change <strong>in</strong> <strong>the</strong> mean<br />
alveolar CO 2 concentration). After observ<strong>in</strong>g a fall<strong>in</strong>g<br />
blood-oxygen saturation, <strong>the</strong> cl<strong>in</strong>ician ordered a chest radiograph<br />
for this patient, who had a chest tube <strong>in</strong> place. On<br />
observation of this “melt<strong>in</strong>g away” of <strong>the</strong> capnogram, <strong>the</strong><br />
chest tube was stripped. The capnogram <strong>the</strong>n returned to<br />
normal and <strong>the</strong> patient’s oxygen saturation was aga<strong>in</strong> stable<br />
by <strong>the</strong> time <strong>the</strong> portable radiograph arrived at <strong>the</strong> bedside,<br />
so <strong>the</strong> radiograph procedure was canceled.<br />
Airway Management<br />
Capnography can help confirm <strong>the</strong> placement of an endotracheal<br />
tube (ETT) <strong>in</strong>to <strong>the</strong> trachea (or misplacement<br />
<strong>in</strong>to <strong>the</strong> esophagus), and can be used <strong>in</strong> various cl<strong>in</strong>ical<br />
environments, <strong>in</strong>clud<strong>in</strong>g <strong>in</strong> <strong>the</strong> field (by emergency medical<br />
services workers), and <strong>in</strong> <strong>the</strong> emergency department,<br />
<strong>in</strong>tensive care unit, neonatal <strong>in</strong>tensive care unit, and delivery<br />
room. 29–33 Dur<strong>in</strong>g ETT placement <strong>the</strong> capnogram<br />
can rapidly alert <strong>the</strong> cl<strong>in</strong>ician to ETT misplacement <strong>in</strong> <strong>the</strong><br />
esophagus. A capnogram from an esophageally-placed ETT<br />
is usually a different shape and size than a normal tracheal<br />
capnogram. Additionally, capnographic waveforms from<br />
<strong>the</strong> esophagus will generally be present only for a few<br />
breaths. The shape difference between tracheal and esophageal<br />
placement is clearly visible <strong>in</strong> adults (Fig. 5) 31 and<br />
neonates (Fig. 6), 34 with rare exceptions. 35 CO 2 <strong>in</strong> <strong>the</strong><br />
esophagus, which is usually present from CO 2 <strong>in</strong> <strong>the</strong> stomach<br />
due to exhaled gas, is removed <strong>in</strong> seconds. In neonates<br />
with low pulmonary perfusion and <strong>in</strong>tracardiac shunt, <strong>the</strong><br />
capnogram waveform may be dim<strong>in</strong>ished <strong>in</strong> amplitude (Fig.<br />
7). After <strong>the</strong> <strong>in</strong>itial placement and secur<strong>in</strong>g of <strong>the</strong> ETT,<br />
Fig. 5. Adult capnograms of tracheal <strong>in</strong>tubation (above) and esophageal<br />
capnogram (below). (Adapted from Reference 31, with permission.)<br />
Fig. 6. Neonatal capnograms of tracheal <strong>in</strong>tubation (left) and esophageal<br />
<strong>in</strong>tubation (right). (Adapted from Reference 34, with permission.)<br />
Fig. 7. Capnogram from a neonate with congenital <strong>in</strong>tracardiac<br />
shunt. (Adapted from Reference 31, with permission.)<br />
changes <strong>in</strong> ETT position can cause abrupt changes <strong>in</strong> <strong>the</strong><br />
capnogram (Fig. 8). For example, <strong>the</strong> procedure of turn<strong>in</strong>g<br />
and flex<strong>in</strong>g a patient to position him for a sp<strong>in</strong>al tap resulted<br />
<strong>in</strong> a right ma<strong>in</strong>-bronchus migration of <strong>the</strong> ETT that<br />
was first <strong>in</strong>dicated by a change <strong>in</strong> <strong>the</strong> capnogram. This<br />
alerted <strong>the</strong> cl<strong>in</strong>ician, who repositioned <strong>the</strong> ETT and com-<br />
102 RESPIRATORY CARE • JANUARY 2005 VOL 50 NO 1
CAPNOGRAPHIC WAVEFORMS IN THE MECHANICALLY VENTILATED PATIENT<br />
Fig. 8. Acute change <strong>in</strong> capnogram from normal (shaded area).<br />
The endotracheal tube was <strong>in</strong> <strong>the</strong> right ma<strong>in</strong> bronchus.<br />
Fig. 9. Capnogram from a patient undergo<strong>in</strong>g chest compressions.<br />
Note that <strong>the</strong> capnogram curve changes at <strong>the</strong> po<strong>in</strong>t at which a<br />
“fresh” (less tired) cl<strong>in</strong>ician (assistant) took over <strong>the</strong> chest compressions.<br />
(Adapted from Reference 42, with permission.)<br />
Fig. 10. Capnogram dur<strong>in</strong>g successive stages of cardiopulmonary<br />
resuscitation, with (A) return of spontaneous circulation. The arrow<br />
labeled NaHCO 3 <strong>in</strong>dicates <strong>the</strong> po<strong>in</strong>t at which sodium bicarbonate<br />
was adm<strong>in</strong>istered. (Adapted from Reference 43, with permission.)<br />
Fig. 11. Capnogram dur<strong>in</strong>g cardiac arrest with rebreath<strong>in</strong>g.<br />
pleted <strong>the</strong> procedure. Rapid recognition of changes <strong>in</strong> ETT<br />
placement can also avoid o<strong>the</strong>r problems, such as desaturation.<br />
However, though <strong>the</strong> presence of CO 2 <strong>in</strong> <strong>the</strong> ETT<br />
<strong>in</strong>creases confidence that <strong>the</strong> ETT is properly placed, it<br />
does not assure that it is properly placed. Endobronchial<br />
<strong>in</strong>tubation can have a normal-appear<strong>in</strong>g capnogram. Proper<br />
Fig. 12. Capnogram <strong>in</strong>dicat<strong>in</strong>g a flutter<strong>in</strong>g expiratory valve with<br />
rebreath<strong>in</strong>g (A). (Adapted from Reference 44, with permission.)<br />
ETT placement should be confirmed with multiple techniques.<br />
36<br />
As <strong>the</strong> lack of CO 2 is used to determ<strong>in</strong>e improper ETT<br />
placement, <strong>the</strong> presence of CO 2 is <strong>in</strong>creas<strong>in</strong>gly be<strong>in</strong>g used<br />
to identify improper nasogastric or oral feed<strong>in</strong>g-tube placement.<br />
37–41<br />
Cardiopulmonary Resuscitation<br />
Capnography has long been used for rapid evaluation of<br />
<strong>the</strong> effectiveness of chest compressions. 42 CO 2 removal is<br />
more effective when a less fatigued person performs <strong>the</strong><br />
cardiopulmonary resuscitation (Fig. 9). Falk et al 43 found<br />
changes <strong>in</strong> CO 2 removal dur<strong>in</strong>g successive stages of cardiopulmonary<br />
resuscitation (Fig. 10). This <strong>in</strong>cluded <strong>the</strong><br />
adm<strong>in</strong>istration of sodium bicarbonate, result<strong>in</strong>g <strong>in</strong> <strong>the</strong> byproduct<br />
of CO 2 and <strong>the</strong> successful return to spontaneous<br />
circulation, shown as a dramatic <strong>in</strong>crease <strong>in</strong> CO 2 removal.<br />
A mechanical problem dur<strong>in</strong>g cardiopulmonary resuscitation<br />
can be quickly recognized with <strong>the</strong> aid of a capnogram.<br />
Figure 11 illustrates a cl<strong>in</strong>ical situation <strong>in</strong> which <strong>the</strong><br />
flow to a non-self-<strong>in</strong>flat<strong>in</strong>g resuscitation bag was set too<br />
low, so <strong>the</strong> CO 2 was not be<strong>in</strong>g adequately washed out of<br />
<strong>the</strong> bag and <strong>the</strong>re was excessive rebreath<strong>in</strong>g of CO 2, which<br />
was identified via <strong>the</strong> capnogram. The flow was <strong>in</strong>creased<br />
and CO 2 returned to basel<strong>in</strong>e.<br />
Mechanical Ventilation<br />
A paper by Carlon et al <strong>in</strong>cluded a wide range of capnographic<br />
waveforms from mechanically ventilated patients,<br />
44 which supported <strong>the</strong> view that capnography assists<br />
<strong>in</strong> quickly identify<strong>in</strong>g and resolv<strong>in</strong>g cl<strong>in</strong>ical and<br />
technical problems. We will discuss several of <strong>the</strong> capnograms<br />
from that paper.<br />
Figure 12 illustrates <strong>the</strong> capnogram pattern from a flutter<strong>in</strong>g<br />
expiratory valve, which can be caused by water<br />
condensation or pressure compensation by <strong>the</strong> ventilator.<br />
Note that some rebreath<strong>in</strong>g is present.<br />
Figure 13 illustrates conflict between mandatory breaths<br />
(ie, delivered by <strong>the</strong> ventilator) and spontaneous breaths<br />
(ie, <strong>the</strong>re was patient-ventilator asynchrony dur<strong>in</strong>g <strong>in</strong>termittent<br />
mandatory ventilation).<br />
RESPIRATORY CARE • JANUARY 2005 VOL 50 NO 1 103
CAPNOGRAPHIC WAVEFORMS IN THE MECHANICALLY VENTILATED PATIENT<br />
Fig. 13. Capnogram <strong>in</strong>dicat<strong>in</strong>g patient-ventilator asynchrony dur<strong>in</strong>g<br />
<strong>in</strong>termittent mandatory ventilation. The arrows <strong>in</strong>dicate spontaneous<br />
breaths. (Adapted from Reference 44, with permission.)<br />
Fig. 14. Capnogram <strong>in</strong> which <strong>the</strong> arrow po<strong>in</strong>ts to a small spontaneous<br />
<strong>in</strong>spiratory effort that did not trigger <strong>the</strong> ventilator. (Adapted<br />
from Reference 44, with permission.)<br />
Fig. 15. Erect-posture breath<strong>in</strong>g patterns with rebreath<strong>in</strong>g. A: Arrows<br />
<strong>in</strong>dicate chang<strong>in</strong>g end-tidal carbon dioxide without pressure<br />
support. B: Normalized capnogram from <strong>the</strong> same patient after<br />
apply<strong>in</strong>g pressure support of 20 cm H 2O. (Adapted from Reference<br />
44, with permission.)<br />
Figure 14 illustrates a situation <strong>in</strong> which a small respiratory<br />
effort was not detected by <strong>the</strong> ventilator dur<strong>in</strong>g <strong>the</strong><br />
expiratory phase. In that situation <strong>the</strong> trigger<strong>in</strong>g sensitivity<br />
may need to be adjusted.<br />
Figure 15A illustrates an erratic pattern and vary<strong>in</strong>g<br />
P ETCO2 . The figure shows no alveolar plateau and some<br />
rebreath<strong>in</strong>g. Figure 15B shows that <strong>the</strong> breath<strong>in</strong>g pattern<br />
and capnogram were normalized with pressure support of<br />
20 cm H 2O.<br />
Figure 16 illustrates a chaotic, rapid respiratory pattern,<br />
with spontaneous breaths dur<strong>in</strong>g mandatory (ventilatordelivered)<br />
breaths, and rebreath<strong>in</strong>g, which can <strong>in</strong>dicate<br />
failure of a wean<strong>in</strong>g trial.<br />
Frequent alteration of a mechanically ventilated patient’s<br />
position is common practice. Figure 17 illustrates how<br />
Fig. 16. Capnogram <strong>in</strong>dicat<strong>in</strong>g wean<strong>in</strong>g failure. There is chaotic,<br />
rapid breath<strong>in</strong>g, with rebreath<strong>in</strong>g (A). Spontaneous breaths (B) dur<strong>in</strong>g<br />
mandatory (ventilator-delivered) breaths. (Adapted from Reference<br />
44, with permission.)<br />
Fig. 17. Changes <strong>in</strong> capnogram with changes <strong>in</strong> patient position.<br />
chang<strong>in</strong>g <strong>the</strong> patient’s position can affect <strong>the</strong> capnogram.<br />
While sup<strong>in</strong>e, <strong>the</strong> patient had a high P aCO2 and an abnormal<br />
capnogram. In <strong>the</strong> right-lateral position <strong>the</strong> capnogram<br />
deteriorated even more. In <strong>the</strong> left-lateral position <strong>the</strong> capnogram<br />
showed a normal waveform, with an alveolar plateau<br />
and a much lower P aCO2 . That change <strong>in</strong> ventilation/<br />
perfusion match<strong>in</strong>g allowed ventilator adjustment.<br />
Neonatal Applications<br />
The use of capnography dur<strong>in</strong>g mechanical ventilation<br />
of neonates is less documented <strong>in</strong> <strong>the</strong> literature. The additional<br />
dead space, weight, mechanical problems, 45 phase<br />
delay, 46 and <strong>the</strong> use of uncuffed ETTs may limit <strong>the</strong> cl<strong>in</strong>ical<br />
value of capnography with neonates.<br />
Arsowa et al 47 presented a series of capnograms that<br />
illustrate that <strong>the</strong> physiologic changes revealed by neonatal<br />
capnograms are consistent with <strong>the</strong> physiologic changes<br />
<strong>in</strong> adults. However, <strong>the</strong> shape of <strong>the</strong> normal neonatal capnogram<br />
is different (Fig. 18). Because of <strong>the</strong> smaller dead<br />
space and higher respiratory rate, <strong>the</strong> normal neonatal capnogram<br />
has a shorter time at basel<strong>in</strong>e, a sharper rise <strong>in</strong><br />
CO 2 concentration, and little if any alveolar plateau.<br />
Adm<strong>in</strong>istration of surfactant alters respiratory mechanics<br />
and changes <strong>the</strong> rate of alveolar empty<strong>in</strong>g, which is<br />
reflected on <strong>the</strong> capnogram (Fig. 19). Before <strong>the</strong> adm<strong>in</strong>istration<br />
of surfactant, <strong>the</strong> capnogram has an elevated basel<strong>in</strong>e,<br />
<strong>the</strong> transitional phase has a prolonged slope, and <strong>the</strong>re<br />
is no alveolar plateau. After <strong>the</strong> adm<strong>in</strong>istration of surfactant<br />
<strong>the</strong> capnogram returns to a normal shape.<br />
104 RESPIRATORY CARE • JANUARY 2005 VOL 50 NO 1
CAPNOGRAPHIC WAVEFORMS IN THE MECHANICALLY VENTILATED PATIENT<br />
Fig. 18. Normal neonatal capnogram. (Adapted from Reference<br />
47, with permission.)<br />
Fig. 19. Capnogram (A) before surfactant (B) after surfactant.<br />
(Adapted from Reference 47, with permission.)<br />
Fig. 20. Capnogram from a neonate with pneumonia. (Adapted<br />
from Reference 47, with permission.)<br />
Fig. 21. Capnogram from a neonate with transposition of <strong>the</strong> great<br />
vessels. (Adapted from Reference 47, with permission.)<br />
The capnogram of a neonate with pneumonia shows<br />
biphasic empty<strong>in</strong>g of <strong>the</strong> lung (Fig. 20). Different time<br />
constants cause a vary<strong>in</strong>g rate of CO 2 removal.<br />
A normal capnogram with a large difference between<br />
P ETCO2 and P aCO2 <strong>in</strong>dicates substantial physiologic dead<br />
space (Fig. 21). Right-to-left cardiac shunt diverts blood<br />
away from <strong>the</strong> lung. Cardiac shunt reflects an <strong>in</strong>crease <strong>in</strong><br />
pulmonary dead space.<br />
Fig. 22. The 3 phases of a volumetric capnogram. Phase I: The<br />
volume of carbon-dioxide-free gas. Phase II: Transition from carbon-dioxide-free<br />
gas with <strong>the</strong> volume of early-empty<strong>in</strong>g alveoli.<br />
Phase III: Alveolar plateau with a positive slope that <strong>in</strong>dicates a<br />
slowly ris<strong>in</strong>g volume of carbon dioxide. (Adapted from Reference<br />
49, with permission.)<br />
Fig. 23. Changes <strong>in</strong> <strong>the</strong> slope of phase II (see Fig. 22) with changes<br />
<strong>in</strong> positive end-expiratory pressure (0, 3, 6, 9, and 12 cm H 2O).<br />
Fig. 24. Changes <strong>in</strong> <strong>the</strong> slope of phase II (see Fig. 22) with changes<br />
<strong>in</strong> pulmonary perfusion. Increas<strong>in</strong>g numbers (by arrows) represent<br />
decreas<strong>in</strong>g pulmonary blood flow.<br />
RESPIRATORY CARE • JANUARY 2005 VOL 50 NO 1 105
CAPNOGRAPHIC WAVEFORMS IN THE MECHANICALLY VENTILATED PATIENT<br />
Fig. 25. Changes <strong>in</strong> <strong>the</strong> volumetric capnogram with acute bronchospasm.<br />
Day 1 capnogram returns to normal by day 5.<br />
Fig. 26. Concave volumetric capnogram associated with obesity.<br />
(Adapted from Reference 49, with permission.)<br />
The Volumetric Capnogram<br />
The normal volumetric capnogram has <strong>the</strong> same general<br />
features as <strong>the</strong> time-based capnogram. The volumetric capnogram,<br />
which traces CO 2 concentration aga<strong>in</strong>st exhaled volume,<br />
is divided <strong>in</strong>to 3 phases (Fig. 22). Us<strong>in</strong>g features of each<br />
phase, physiologic measurements can be calculated.<br />
Changes <strong>in</strong> positive end-expiratory pressure (PEEP) affect<br />
<strong>the</strong> volumetric capnogram (Fig. 23). Increas<strong>in</strong>g PEEP<br />
shifts <strong>the</strong> capnogram and alters <strong>the</strong> slope of phase II.<br />
Changes <strong>in</strong> pulmonary blood flow can also shift <strong>the</strong> volumetric<br />
capnogram (Fig. 24). Currently, <strong>the</strong> shift is not<br />
cl<strong>in</strong>ically quantifiable, but optimal PEEP, perfusion, or<br />
drug <strong>the</strong>rapy may be determ<strong>in</strong>ed by measur<strong>in</strong>g that change<br />
<strong>in</strong> slope.<br />
The volumetric capnogram also reflects changes <strong>in</strong> airway<br />
resistance (Fig. 25). A patient with severe asthma<br />
demonstrates a prolonged transitional phase, which improves<br />
over time. Drug <strong>the</strong>rapy may also be monitored, as<br />
with time-based capnography. 48<br />
Concave phase-III volumetric capnograms have been<br />
seen with obese patients and patients with <strong>in</strong>creased expi-<br />
Fig. 27. Concave volumetric capnogram associated with <strong>in</strong>creased<br />
airway resistance. (Adapted from Reference 49, with permission.)<br />
Fig. 28. Volumetric capnogram associated with pulmonary emboli.<br />
Extrapolated curve (A) to 15% of total lung capacity (TLC) (late<br />
dead space). V T � tidal volume. (Adapted from Reference 50.)<br />
ratory resistance. Obese patients (Fig. 26) can have biphasic<br />
empty<strong>in</strong>g and higher P ETCO2 than P aCO2 . That difference<br />
suggests vary<strong>in</strong>g mechanical and ventilation/perfusion<br />
properties. The <strong>in</strong>crease <strong>in</strong> expiratory resistance (Fig. 27)<br />
may reflect a slow expiratory phase with a slow accumulation<br />
of alveolar CO 2. The alveoli that empty last may<br />
have more time for CO 2 diffusion. 49<br />
The volumetric capnogram has been used to diagnose<br />
pulmonary emboli. Extrapolated CO 2 at 15% of total lung<br />
capacity should be equal to P aCO2 (Fig. 28). When <strong>the</strong> extrapolated<br />
CO 2 is less than <strong>the</strong> P aCO2 by � 12%, it suggests<br />
pulmonary emboli. 50 However, dead space of � 50% and<br />
a negative D-dimer safely rule out pulmonary emboli. 51<br />
Summary<br />
The capnogram is an important tool for <strong>the</strong> cl<strong>in</strong>ician,<br />
<strong>in</strong> that it aids diagnosis and treatment and can <strong>in</strong>crease<br />
patient safety by alert<strong>in</strong>g <strong>the</strong> cl<strong>in</strong>ician to important situations<br />
and changes. The present review touches only<br />
on a few of <strong>the</strong> published works on capnography. Smalhout’s<br />
collection of 6,000 capnograms illustrates a wide<br />
106 RESPIRATORY CARE • JANUARY 2005 VOL 50 NO 1
CAPNOGRAPHIC WAVEFORMS IN THE MECHANICALLY VENTILATED PATIENT<br />
range of capnographic possibilities. Smalhout states that<br />
<strong>the</strong> capnogram is <strong>the</strong> ECG of respiration. Just as <strong>the</strong><br />
electrocardiogram is one <strong>in</strong>dicator of cardiac health, <strong>the</strong><br />
capnogram is an important adjunct to assess<strong>in</strong>g respiratory<br />
function. Hopefully, additional research from cl<strong>in</strong>icians<br />
will fur<strong>the</strong>r <strong>the</strong> field and <strong>in</strong>terpretation of capnograms.<br />
REFERENCES<br />
1. American Society of Anes<strong>the</strong>siologists (ASA). Basic standards for<br />
<strong>in</strong>traoperative monitor<strong>in</strong>g; 1999.<br />
2. Wenzel V, Voelckel WG, Krismer AC, Mayr VD, Strohmenger<br />
HU, Baub<strong>in</strong> MA, et al; American Heart Association; European<br />
Resuscitation Council. [The new <strong>in</strong>ternational guidel<strong>in</strong>es for cardiopulmonary<br />
resuscitation: an analysis and comments on <strong>the</strong><br />
most important changes.] Anaes<strong>the</strong>sist 2001;50(5):342–357. Article<br />
<strong>in</strong> German<br />
3. Guidel<strong>in</strong>es 2000 for Cardiopulmonary Resuscitation and Emergency<br />
Cardiovascular Care. Part 6: advanced cardiovascular life support:<br />
section 3: adjuncts for oxygenation, ventilation and airway control.<br />
The American Heart Association <strong>in</strong> collaboration with <strong>the</strong> International<br />
Liaison Committee on Resuscitation. Circulation 2000;102(8<br />
Suppl):I95–I104.<br />
4. Society of Critical Care Medic<strong>in</strong>e. Task Force on Guidel<strong>in</strong>es. Recommendations<br />
for services and personnel for delivery of care <strong>in</strong> a<br />
critical care sett<strong>in</strong>g. Crit Care Med 1988;16(8):809–811.<br />
5. American Academy of Pediatrics Committee on Drugs: Guidel<strong>in</strong>es<br />
for monitor<strong>in</strong>g and management of pediatric patients dur<strong>in</strong>g and after<br />
sedation for diagnostic and <strong>the</strong>rapeutic procedures. Pediatrics 1992;<br />
89(6 Pt 1):1110–1115.<br />
6. American Association for Respiratory Care. AARC Cl<strong>in</strong>ical Practice<br />
Guidel<strong>in</strong>e: Capnography/capnometry dur<strong>in</strong>g mechanical ventilation—2003<br />
revision & update. Respir Care 2003;48(5):534–539.<br />
7. American College of Emergency Physicians: Expired carbon dioxide<br />
monitor<strong>in</strong>g. Ann Emerg Med 1995;25(3):441.<br />
8. Fowler WS, Comroe JH Jr. Alveolar gas, method <strong>in</strong> medical research.<br />
Chicago: Year Book; 1950;2:219–226.<br />
9. Peppriell JE, Bacon DR, Lema MJ, Ament R, Yearley CK. The<br />
development of academic anes<strong>the</strong>siology at <strong>the</strong> Roswell Park Memorial<br />
Institute: James O. Elam, MD, and Elwyn S. Brown, MD.<br />
Anesth Analg 1991;72(4):538–545.<br />
10. Sands RP Jr, Bacon DR. An <strong>in</strong>ventive m<strong>in</strong>d: <strong>the</strong> career of James O.<br />
Elam, M.D. (1918–1995). Anes<strong>the</strong>siology 1998;88(4):1107–1112.<br />
11. Elam JO, Brown ES. Ten Pas RH Carbon dioxide homeostasis dur<strong>in</strong>g<br />
anes<strong>the</strong>sia. I. Instrumentation. Anes<strong>the</strong>siology 1955;16(11):876–885.<br />
12. Elam JO, Brown ES. Carbon dioxide homeostasis dur<strong>in</strong>g anes<strong>the</strong>sia.<br />
II. Total sampl<strong>in</strong>g for determ<strong>in</strong>ation of dead space, alveolar ventilation,<br />
and carbon dioxide output. Anes<strong>the</strong>siology 1955;16(11):886–902.<br />
13. Elam JO, Brown ES. Carbon dioxide homeostasis dur<strong>in</strong>g anes<strong>the</strong>sia.<br />
III. Ventilation and carbon dioxide elim<strong>in</strong>ation. Anes<strong>the</strong>siology 1956;<br />
17(1):115–127.<br />
14. Elam JO, Brown ES. Carbon dioxide homeostasis dur<strong>in</strong>g anes<strong>the</strong>sia.<br />
IV. An evaluation of <strong>the</strong> partial rebreath<strong>in</strong>g system. Anes<strong>the</strong>siology<br />
1956;17(1):128–134.<br />
15. Gravenste<strong>in</strong> JS, Jaffe MB, Paulus DA. Capnography: cl<strong>in</strong>ical aspects—carbon<br />
dioxide over time and volume. Cambridge UK: Cambridge<br />
University Press; 2004.<br />
16. Smalhout B. Capnografie (<strong>the</strong>sis) University of Utrecht, The Ne<strong>the</strong>rlands,<br />
Utrecht, The Ne<strong>the</strong>rlands: A Oosthoek Publish<strong>in</strong>g Co; 1967.<br />
17. Smalhout B, Kalenda Z. An atlas of capnography, 2nd ed. Kerckebosche<br />
Zeist, The Ne<strong>the</strong>rlands; 1981.<br />
18. We<strong>in</strong>garten M. Respiratory monitor<strong>in</strong>g of carbon dioxide and oxygen:<br />
a ten-year perspective. J Cl<strong>in</strong> Monit 1990;6(3):217–225.<br />
19. Aiken RS, Clark-Kennedy AE. On <strong>the</strong> fluctuation <strong>in</strong> <strong>the</strong> composition<br />
of <strong>the</strong> alveolar air dur<strong>in</strong>g <strong>the</strong> respiratory cycle <strong>in</strong> muscular capacity.<br />
J Physiol 1928;65:389–411.<br />
20. Fowler WS. Lung function studies. II. The respiratory deadspace.<br />
Am J Physiol 1948;154:405–416.<br />
21. Berengo A, Cutillo A. S<strong>in</strong>gle breath analysis of carbon dioxide records.<br />
J Appl Physiol 1961;16(3):522–530.<br />
22. Fletcher R. The s<strong>in</strong>gle breath test for carbon dioxide (Thesis). Lund,<br />
Sweden; 1980.<br />
23. Fletcher R, Jonson B. Deadspace and <strong>the</strong> s<strong>in</strong>gle breath test for carbon<br />
dioxide dur<strong>in</strong>g anaes<strong>the</strong>sia and artificial ventilation: effects of tidal volume<br />
and frequency of respiration. Br J Anaesth 1984;56(2):109–119.<br />
24. Gravenste<strong>in</strong> JS, Paulus DA, Hayes TJ. Gas monitor<strong>in</strong>g <strong>in</strong> cl<strong>in</strong>ical<br />
practice, 2nd ed. New York: Butterworth-He<strong>in</strong>emann; 1995.<br />
25. Bhavani-Shankar K, Philip JH. Def<strong>in</strong><strong>in</strong>g segments and phases of a<br />
time capnogram. Anesth Analg 2000;91(4):973–977.<br />
26. Pyles ST, Berman LS, Modell JH. Expiratory valve dysfunction <strong>in</strong> a<br />
semiclosed circle anes<strong>the</strong>sia circuit: verification by analysis of carbon<br />
dioxide waveform. Anesth Analg 1984;63(5):536–537.<br />
27. Kumar AY, Bhavani-Shankar K, Moseley HS, Delph Y. Inspiratory<br />
valve malfunction <strong>in</strong> a circle system: pitfalls <strong>in</strong> capnography. Can J<br />
Anaesth 1992;39(9):997–999.<br />
28. Podraza AG, Salem MR, Joseph NJ, Brencley JL. Rebreath<strong>in</strong>g due to<br />
<strong>in</strong>competent unidirectional valves <strong>in</strong> <strong>the</strong> circle absorber system (abstract).<br />
Anes<strong>the</strong>siology 1991;75:A422.<br />
29. Holland R, Webb RK, Runciman WB. The Australian Incident Monitor<strong>in</strong>g<br />
Study. Oesophageal <strong>in</strong>tubation: an analysis of 2000 <strong>in</strong>cident<br />
reports. Anaesth Intensive Care 1993;21(5):608–610.<br />
30. Repetto JE, Donohue PA-C PK, Baker SF, Kelly L, Nogee LM. Use<br />
of capnography <strong>in</strong> <strong>the</strong> delivery room for assessment of endotracheal<br />
tube placement. J Per<strong>in</strong>atol 2001;21(5):284–287.<br />
31. Roberts WA, Maniscalco WM, Cohen AR, Litman RS, Chhibber A.<br />
The use of capnography for recognition of esophageal <strong>in</strong>tubation <strong>in</strong> <strong>the</strong><br />
neonatal <strong>in</strong>tensive care unit. Pediatr Pulmonol 1995;19(5):262–268.<br />
32. Grmec S. Comparison of three different methods to confirm tracheal<br />
tube placement <strong>in</strong> emergency <strong>in</strong>tubation. Intensive Care Med 2002;<br />
28(6):701–704.<br />
33. Katz SH, Falk JL. Misplaced endotracheal tubes by paramedics <strong>in</strong> an<br />
urban emergency medical services system. Ann Emerg Med 2001;<br />
37(1):32–37.<br />
34. Sum-P<strong>in</strong>g ST, Methta MP, Anderton JM. A comparative study of<br />
methods of detection of esophageal <strong>in</strong>tubation. Anesth Analg 1989;<br />
69(5):627–632.<br />
35. Asai T, Sh<strong>in</strong>gu K. Case report: a normal capnogram despite esophageal<br />
<strong>in</strong>tubation. Can J Anaesth 2001;48(10):1025–1028.<br />
36. Li J. Capnography alone is imperfect for endotracheal tube placement<br />
confirmation dur<strong>in</strong>g emergency <strong>in</strong>tubation. J Emerg Med 2001;<br />
20(3):223–229.<br />
37. Asai T, Stacey M. Confirmation of feed<strong>in</strong>g tube position: how about<br />
capnography? (letter) Anaes<strong>the</strong>sia 1994;49(5):451.<br />
38. D’Souza CR, Kilam SA, D’Souza U, Janzen EP, Sipos RA. Pulmonary<br />
complications of feed<strong>in</strong>g tubes: a new technique of <strong>in</strong>sertion<br />
and monitor<strong>in</strong>g malposition. Can J Surg 1994;37(5):404–408.<br />
39. K<strong>in</strong>dopp AS, Drover JW, Heyland DK. Capnography confirms correct<br />
feed<strong>in</strong>g tube placement <strong>in</strong> <strong>in</strong>tensive care unit patients. Can J<br />
Anaesth 2001;48(7):705–710.<br />
40. Burns SM, Carpenter R, Truwit JD. Report on <strong>the</strong> development of a<br />
procedure to prevent placement of feed<strong>in</strong>g tubes <strong>in</strong>to <strong>the</strong> lungs us<strong>in</strong>g<br />
end-tidal CO 2 measurements. Crit Care Med 2001;29(5):936–939.<br />
RESPIRATORY CARE • JANUARY 2005 VOL 50 NO 1 107
41. Araujo-Preza CE, Melhado ME, Gutierrez FJ, Maniatis T, Castellano<br />
MA. Use of capnometry to verify feed<strong>in</strong>g tube placement. Crit Care<br />
Med 2002;30(10):2255–2259.<br />
42. Kalenda Z. The capnogram as a guide to <strong>the</strong> efficacy of cardiac<br />
massage. Resuscitation 1978;6(4):259–263.<br />
43. Falk JL, Rackow EC, Weil MH. End-tidal carbon dioxide concentration<br />
dur<strong>in</strong>g cardiopulmonary resuscitation. N Engl J Med 1988;<br />
318(10):607–611.<br />
44. Carlon GC, Ray C Jr, Miodownik S, Kopec I, Groeger JS. Capnography<br />
<strong>in</strong> mechanically ventilated patients. Crit Care Med 1988;16(5):550–556.<br />
45. Badgwell JM, Kle<strong>in</strong>man SE, Heavner JE. Respiratory frequency and<br />
artifact affect <strong>the</strong> capnographic basel<strong>in</strong>e <strong>in</strong> <strong>in</strong>fants. Anesth Analg<br />
1993;77(4):708–712.<br />
46. Pascucci R, Schena J, Thompson JE. Comparison of a sidestream<br />
and ma<strong>in</strong>stream capnometer <strong>in</strong> <strong>in</strong>fants. Crit Care Med 1989;17(6):<br />
560–562.<br />
Discussion<br />
Bigatello: You mentioned that you<br />
put P ETCO2 on-l<strong>in</strong>e when you place<br />
feed<strong>in</strong>g tubes. I’m <strong>in</strong>terested <strong>in</strong> that,<br />
because a feed<strong>in</strong>g tube can go <strong>in</strong>to <strong>the</strong><br />
lungs, and a few of <strong>the</strong>m also cause<br />
damage. We have a very specific protocol<br />
accord<strong>in</strong>g to which, with <strong>in</strong>tubated<br />
patients, we place every feed<strong>in</strong>g<br />
tube under direct laryngoscopy. I do<br />
not have data to know whe<strong>the</strong>r that<br />
has decreased <strong>the</strong> <strong>in</strong>cidence. But certa<strong>in</strong>ly<br />
measur<strong>in</strong>g P ETCO2 will be a possible<br />
adjunct. How do you fit your<br />
particular apparatus? Does it work well<br />
for you? Is it someth<strong>in</strong>g that you suggest<br />
on a regular basis?<br />
Thompson: There are several publications<br />
that describe <strong>the</strong> connections<br />
for adult patients. 1–4 Our protocol calls<br />
for gett<strong>in</strong>g aspirates and measur<strong>in</strong>g <strong>the</strong><br />
pH before we use <strong>the</strong> feed<strong>in</strong>g tube.<br />
REFERENCES<br />
1. K<strong>in</strong>dopp AS, Drover JW, Heyland DK.<br />
Capnography confirms correct feed<strong>in</strong>g tube<br />
placement <strong>in</strong> <strong>in</strong>tensive care unit patients.<br />
Can J Anaesth 2001;48(7):705–710.<br />
2. Burns SM, Carpenter R, Truwit JD. Report<br />
on <strong>the</strong> development of a procedure to prevent<br />
placement of feed<strong>in</strong>g tubes <strong>in</strong>to <strong>the</strong><br />
lungs us<strong>in</strong>g end-tidal CO 2 measurements.<br />
Crit Care Med 2001;29(5):936–939.<br />
3. D’Souza CR, Kilam SA, D’Souza U, Janzen<br />
EP, Sipos RA. Pulmonary complications<br />
of feed<strong>in</strong>g tubes: a new technique of<br />
<strong>in</strong>sertion and monitor<strong>in</strong>g malposition. Can<br />
J Surg 1994;37(5):404–408.<br />
CAPNOGRAPHIC WAVEFORMS IN THE MECHANICALLY VENTILATED PATIENT<br />
4. Araujo-Preza CE, Melhado ME, Gutierrez<br />
FJ, Maniatis T, Castellano MA. Use of capnometry<br />
to verify feed<strong>in</strong>g tube placement.<br />
Crit Care Med 2002;30(10):2255–2259.<br />
Harris: You showed a graph of <strong>the</strong><br />
time to a steady-state CO 2 read<strong>in</strong>g.<br />
How long does it normally take for<br />
CO 2 to equilibrate when you make a<br />
ventilator change? It always seems to<br />
take a very long time. And what does<br />
it depend on?<br />
Thompson: In <strong>the</strong> majority of cases<br />
<strong>the</strong> change takes place with<strong>in</strong> 20 m<strong>in</strong>utes,<br />
but some patients come to full<br />
stabilization <strong>in</strong> 5–7 m<strong>in</strong>utes. 1<br />
REFERENCE<br />
1. Taskar V, John J, Larsson A, Wetterberg<br />
T, Jonson B. Dynamics of carbon dioxide<br />
elim<strong>in</strong>ation follow<strong>in</strong>g ventilator resett<strong>in</strong>g.<br />
Chest 1995;108(1);196–202.<br />
Blanch: I have a question regard<strong>in</strong>g<br />
<strong>the</strong> pediatric population. Assess<strong>in</strong>gphysiologic<br />
dead space <strong>in</strong> ARDS<br />
[acute respiratory distress syndrome]<br />
is useful to predict outcome. Do you<br />
know whe<strong>the</strong>r measur<strong>in</strong>g dead space<br />
could also be useful <strong>in</strong> pediatric patients?<br />
Thompson: Predict<strong>in</strong>g outcome is<br />
very difficult. In pediatrics we have<br />
only about a 10–15% mortality rate<br />
with pediatric ARDS. I’m not sure<br />
that we’re go<strong>in</strong>g to ever show any<br />
impact of <strong>the</strong>se devices on pediatric<br />
47. Arsowa S, Schmalisch G, Wauer R. [Techniques and cl<strong>in</strong>ical application<br />
of capnography <strong>in</strong> newborn <strong>in</strong>fants and <strong>in</strong>fants.] Padiatr Grenzgeb<br />
1993;31(5):295–311. Article <strong>in</strong> German<br />
48. Yaron M, Padyk P, Huts<strong>in</strong>piller M, Cairns CB. Utility of <strong>the</strong> expiratory<br />
capnogram <strong>in</strong> <strong>the</strong> assessment of bronchospasm. Ann Emerg<br />
Med 1996;28(4):403–407.<br />
49. Fletcher R. The s<strong>in</strong>gle breath test for carbon dioxide [dissertation].<br />
Lund, Sweden: University of Lund, 1980. 2 nd edition revised and<br />
repr<strong>in</strong>ted, Solna, Sweden: Siemens Elema, 1986.<br />
50. Anderson JT, Ow<strong>in</strong>gs JT, Goodnight JE. Bedside non<strong>in</strong>vasive detection<br />
of acute pulmonary embolism <strong>in</strong> critically ill surgical patients.<br />
Arch Surg 1999;134(8):869–874; discussion 874–875.<br />
51. Rodger MA, Jones G, Rasuli P, Raymond F, Djunaedi H, Bredeson<br />
CN, Wells PS. Steady-state end-tidal alveolar dead space fraction<br />
and D-dimer: bedside tests to exclude pulmonary embolism. Chest<br />
2001;120(1):115–119.<br />
ARDS. The low <strong>in</strong>cidence, high survival<br />
rate, and <strong>the</strong> use of ECMO [extracorporeal<br />
membrane oxygenation]<br />
limits <strong>the</strong> number of patients<br />
available for study.<br />
Sanborn: Is it fair to say that CO 2<br />
monitor<strong>in</strong>g is ma<strong>in</strong>ly used as a check<br />
on what you’ve done ra<strong>the</strong>r than as a<br />
guide to do<strong>in</strong>g someth<strong>in</strong>g? It seems<br />
that if you make a ventilator change,<br />
CO 2 monitor<strong>in</strong>g tells you whe<strong>the</strong>r your<br />
adjustment was OK, ra<strong>the</strong>r than look<strong>in</strong>g<br />
at <strong>the</strong> CO 2 signal <strong>in</strong> whatever way<br />
and say<strong>in</strong>g, “Oh I need to do this.”<br />
Thompson: I would say that’s true<br />
with a s<strong>in</strong>gle-breath CO 2 measurement,<br />
look<strong>in</strong>g at CO 2 elim<strong>in</strong>ation. I’m<br />
not sure that’s true with P ETCO2 —with<br />
<strong>the</strong> capnograph waveform.<br />
Durb<strong>in</strong>: About 20 years ago it was<br />
suggested that look<strong>in</strong>g at <strong>the</strong> end-tidalto-arterial<br />
CO 2 gradient is a way to optimize<br />
PEEP. The <strong>the</strong>ory is that as you<br />
overdistend normal lung areas, you drive<br />
blood away from <strong>the</strong>m, and <strong>the</strong>refore<br />
worsen V˙ /Q˙ [ventilation/perfusion ratio].<br />
When you start with collapsed areas<br />
that start open<strong>in</strong>g up, V˙ /Q˙ gets better.<br />
The balance between those 2<br />
oppos<strong>in</strong>g effects allow you to optimize<br />
PEEP by simply look<strong>in</strong>g at <strong>the</strong> end-tidal-to-arterial<br />
CO 2 gradient. That approach<br />
has not been widely used, to my<br />
knowledge, but it was reported. 1 Any<br />
thoughts on that approach?<br />
108 RESPIRATORY CARE • JANUARY 2005 VOL 50 NO 1
REFERENCE<br />
1. Murray IP, Modell JH, Gallagher TJ, Banner<br />
MJ. Titration of PEEP by <strong>the</strong> arterial<br />
m<strong>in</strong>us end-tidal CO 2 gradient. Chest 1984;<br />
85(1):100–104.<br />
Thompson: I th<strong>in</strong>k we would be more<br />
apt to use V D/V T [<strong>the</strong> ratio of dead space<br />
to tidal volume] now with more modern<br />
equipment. But, yes, absolutely. I was<br />
brought up on <strong>the</strong> gradient that it’s all<br />
dead space ventilation. Shunt has very<br />
little to do with that gradient, so you are<br />
<strong>in</strong>creas<strong>in</strong>g alveolar dead space when you<br />
widen <strong>the</strong> gradient. I agree.<br />
Hess: On that subject I would refer<br />
to Lluis Blanch’s 1987 paper. 1<br />
REFERENCE<br />
1. Blanch L, Fernandez R, Benito S, Mancebo<br />
J, Net A. Effect of PEEP on <strong>the</strong> arte-<br />
CAPNOGRAPHIC WAVEFORMS IN THE MECHANICALLY VENTILATED PATIENT<br />
rial m<strong>in</strong>us end-tidal carbon dioxide gradient.<br />
Chest 1987;92(3):451–454.<br />
Blanch: Yes. We studied <strong>the</strong> effect<br />
of PEEP on <strong>the</strong> arterial m<strong>in</strong>us endtidal<br />
CO 2 gradient <strong>in</strong> patients with<br />
acute lung <strong>in</strong>jury. At similar cardiac<br />
output, <strong>the</strong> gradient decreased with<br />
PEEP, equal to <strong>the</strong> lower <strong>in</strong>flection<br />
po<strong>in</strong>t of <strong>the</strong> P-V curve, and with patients<br />
who did not have a lower <strong>in</strong>flection<br />
po<strong>in</strong>t we applied a random<br />
PEEP level, and <strong>the</strong> behavior of <strong>the</strong><br />
gradient was unpredictable and not<br />
correlated with changes <strong>in</strong> oxygenation.<br />
The <strong>in</strong>terpretation was that<br />
PEEP <strong>in</strong>duced alveolar recruitment,<br />
decreased alveolar dead space, and <strong>the</strong><br />
gradient narrowed, whereas <strong>the</strong> contrary<br />
occurred when PEEP <strong>in</strong>duced<br />
overdistension and both alveolar dead<br />
space and <strong>the</strong> gradient <strong>in</strong>creased.<br />
Therefore, variations of <strong>the</strong> gradient<br />
at similar hemodynamic status might<br />
help cl<strong>in</strong>icians understand <strong>the</strong> physiologic<br />
effects of PEEP.<br />
Bigatello: I th<strong>in</strong>k this br<strong>in</strong>gs up <strong>the</strong><br />
utility of look<strong>in</strong>g at CO 2 elim<strong>in</strong>ation<br />
as an <strong>in</strong>dex of alveolar recruitment,<br />
which Gatt<strong>in</strong>oni et al reported on. 1 If<br />
we are recruit<strong>in</strong>g <strong>the</strong> lung and not overdistend<strong>in</strong>g,<br />
but truly recruit<strong>in</strong>g new<br />
units, we should ventilate better so <strong>the</strong><br />
P aCO2 will decrease.<br />
REFERENCE<br />
1. Gatt<strong>in</strong>oni L, Vagg<strong>in</strong>elli F, Carlesso E, Taccone<br />
P, Conte V, Chiumello D, et al; Prone-<br />
Sup<strong>in</strong>e Study Group. Decrease <strong>in</strong> P aCO2 with<br />
prone position is predictive of improved<br />
outcome <strong>in</strong> acute respiratory distress syndrome.<br />
Crit Care Med 2003; 31(12):2727–<br />
2733.<br />
RESPIRATORY CARE • JANUARY 2005 VOL 50 NO 1 109