burden of deforestation, desertification, erosion of ... - Social Watch
burden of deforestation, desertification, erosion of ... - Social Watch
burden of deforestation, desertification, erosion of ... - Social Watch
You also want an ePaper? Increase the reach of your titles
YUMPU automatically turns print PDFs into web optimized ePapers that Google loves.
philippines<br />
Clearing the path to sustainability<br />
Philippine Rural Reconstruction Movement (PRRM)<br />
<strong>Social</strong> <strong>Watch</strong> Philippines<br />
Isagani R. Serrano<br />
In 2010, inspired by the Philippines’ second greenhouse<br />
gas (GHG) inventory, then president Gloria<br />
Macapagal-Arroyo pompously announced that the<br />
country was now a net carbon sink. Carbon intensity,<br />
as expressed by CO 2 emissions, may indicate something<br />
about the level and nature <strong>of</strong> development,<br />
but there is much more to consider. Indicators vary<br />
widely, depending on what people value most.<br />
Low CO 2 emissions are a poor indicator <strong>of</strong> sustainable<br />
development. A more sensitive single indicator<br />
<strong>of</strong> a society’s well-being is probably the infant<br />
mortality rate, which reveals the quality <strong>of</strong> nutrition<br />
and healthcare. In addition, it is connected to other<br />
basic indicators such as the quality <strong>of</strong> water resources,<br />
housing, education, and especially women’s<br />
education level. It can also be an indicator <strong>of</strong> State<br />
failure. 1 In the case <strong>of</strong> the Philippines, child mortality<br />
indicators are discouraging: the infant mortality<br />
rate (under 1) stood at 26 per 1,000 in 2009 and<br />
the under-5 mortality rate at 33 per 1,000. 2 While<br />
these figures do show some improvement when<br />
compared to data from 1990 (41 3 and 34 4 respectively),<br />
the country’s problems, as seen below, remain<br />
structural.<br />
Poverty and inequality: the same old story<br />
Despite the restoration <strong>of</strong> democracy in 1986 and the<br />
subsequent succession <strong>of</strong> regimes that promised to<br />
eradicate poverty and reduce inequality, and despite<br />
the fact that the economy has been growing, the<br />
country is still stuck with high poverty/high inequality<br />
alongside continuing environmental degradation.<br />
While poverty declined to 32.9% in 2006 from<br />
42% in 1991, the faces <strong>of</strong> those in poverty remained<br />
the same: rural, landless, indigenous/tribal, Muslim<br />
and female. Inequality has hardly decreased during<br />
1 G. King and L. Zeng, “Improving Forecasts <strong>of</strong> State Failure,”<br />
World Politics, Vol.53, (July 2001), pp. 623-58.<br />
2 UNICEF, At a Glance: Philippines, .<br />
3 Ibid.<br />
4 World Health Organization, Mortality Country Fact Sheet<br />
2006: Philippines, .<br />
Addressing the vulnerability <strong>of</strong> the country’s already degraded environment is as important as making<br />
the economy grow. In addition, the Philippines long ago exceeded the 0.4 hectares per person required to<br />
satisfy the optimum food requirement/capacity. Decentralization efforts attempting to create growth centres<br />
away from Manila are still unable to break the elite and urban-centred structure <strong>of</strong> power and resources. The<br />
Government must strive to find ways – in cooperation with farmers, NGOs, the mass media, schools and the<br />
national agriculture research system – to achieve long-term food security and environmental sustainability.<br />
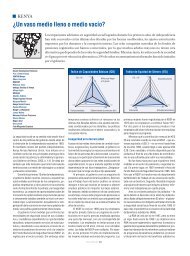
Basic Capabilities Index (BCI)<br />
BCI = 86<br />
Births attended<br />
62<br />
100<br />
0<br />
81<br />
Children reaching<br />
5th grade<br />
100 100<br />
National reports 160 <strong>Social</strong> <strong>Watch</strong><br />
Surviving under-5<br />
the same period: it was 0.4680 in 1991 and 0.4580 in<br />
2006. 5 This is a high level compared to the majority<br />
<strong>of</strong> the Philippines’ Asian neighbours and means the<br />
country is only slightly better-<strong>of</strong>f than most countries<br />
in Latin America (the most unequal region on the<br />
planet). Most importantly, there is wide inequality<br />
among the country’s regions, provinces and municipalities.<br />
The gap between the richest 20% and the poorest<br />
is widening in spite <strong>of</strong> measures such as land<br />
reform and local autonomy. The regions with the<br />
most inequitable income distribution are Central<br />
Visayas, Eastern Visayas, Zamboanga Peninsula,<br />
Northern Mindanao and Caraga. These regions have<br />
Gini coefficients higher than 0.44. More than 50% <strong>of</strong><br />
the 20 poorest provinces were in Mindanao in 2003<br />
and 2006, with Tawi-Tawi having the highest poverty<br />
incidence in 2006.<br />
Debt and corruption – developmental<br />
nightmares<br />
The Government derives two thirds <strong>of</strong> its revenue<br />
mainly from taxes on fixed-income earners. Over the<br />
years it has consistently spent more than it earns. It<br />
sets huge annual budgets and makes up for deficits<br />
by borrowing. It wants to cap the 2011 budget deficit<br />
at 3.2% <strong>of</strong> gross domestic product (GDP) or some<br />
PHP 290 billion (USD 6.69 billion).<br />
Mounting debts and debt service are the bane <strong>of</strong><br />
Philippine development. The country’s outstanding<br />
debt ballooned from PHP 701 billion in 1990 to PHP<br />
4.4 trillion in 2009 (USD 16.2 million to USD 101.5<br />
5 Income inequality or disparity is commonly measured using<br />
the Gini coefficient. A Gini ratio <strong>of</strong> zero means perfect equality<br />
while a ratio <strong>of</strong> one would mean complete inequality.<br />
Gender Equity Index (GEI)<br />
GEI = 76<br />
97 100<br />
Education<br />
100<br />
0<br />
Empowerment<br />
Economic activity<br />
billion), showing a steady increase except for a slight<br />
decline in 2006 and 2007. This is more than 50% <strong>of</strong><br />
the country’s GDP. The debt-to-GDP ratio remained<br />
high at 57.7% at the end <strong>of</strong> 2009 although it had declined<br />
from 63.8% in 2006. 6 In September 2010 each<br />
<strong>of</strong> the 92.2 million Filipinos could be said to owe PHP<br />
47,039 (USD 1,091) to local and foreign creditors.<br />
About a third <strong>of</strong> the national budget goes to<br />
paying the interest and principal <strong>of</strong> the country’s<br />
mounting debt stock. That is a third <strong>of</strong> the pie sliced<br />
<strong>of</strong>f from poverty reduction activities. In addition,<br />
corruption has been a constant feature and has triggered<br />
most <strong>of</strong> the regime changes since the days <strong>of</strong><br />
President Marcos. In 2004 Macapagal-Arroyo said<br />
that corruption was strangling the Philippines and<br />
called on citizens to “join hands to root out this evil.”<br />
The evil, however, continues to be very much alive<br />
and to hinder Philippine development.<br />
The need to break the urban-centred structure<br />
The country’s economic geography demonstrates<br />
highly uneven development and unequal distribution<br />
<strong>of</strong> created wealth. Primate cities suck up most <strong>of</strong><br />
the resources. It is no wonder, therefore, that small<br />
savings deposited in faraway rural banks end up<br />
eventually in big banks in Makati 7 and are then lent to<br />
big borrowers who prefer to invest in already highly<br />
developed areas.<br />
6 C. M. Reinhart<br />
and K. S. Rog<strong>of</strong>f, “Debt to GDP Ratios” in This Time is<br />
Different: Eight Centuries <strong>of</strong> Financial Folly (Princeton:<br />
Princeton University Press, 2009), .<br />
7 The financial centre <strong>of</strong> the Philippines and one <strong>of</strong> the cities<br />
that make up Metro Manila.<br />
61<br />
100 67 100


