burden of deforestation, desertification, erosion of ... - Social Watch
burden of deforestation, desertification, erosion of ... - Social Watch
burden of deforestation, desertification, erosion of ... - Social Watch
You also want an ePaper? Increase the reach of your titles
YUMPU automatically turns print PDFs into web optimized ePapers that Google loves.
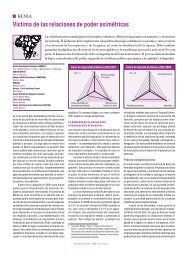
CHART 1<br />
BCI levels (1990, 2000 & 2011)<br />
1990<br />
2000<br />
2011<br />
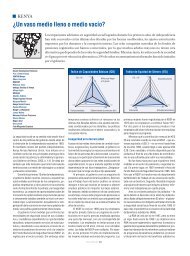
CHART 2<br />
BCI level by region (1990, 2000 & 2011)<br />
100<br />
90<br />
80<br />
70<br />
60<br />
50<br />
CHART 3<br />
1990 2000 2011<br />
Basic Capabilities Index and Co 2 emissions by regions<br />
BCI<br />
100<br />
90<br />
80<br />
70<br />
60<br />
50<br />
0<br />
0%<br />
2011<br />
2011<br />
1990<br />
2000<br />
19902011<br />
2011<br />
2011<br />
2000 2000<br />
2000<br />
1990 2000 2011<br />
1990 2000<br />
1990<br />
1990<br />
World average<br />
2011<br />
2000 2011<br />
1990 2000<br />
1990<br />
Basic<br />
20%<br />
40% 60% 80% 100%<br />
Medium Low Very low Critical<br />
Measuring progress 46<br />
Central Asia<br />
Europe and North<br />
America<br />
Sub-Saharan Africa<br />
East Asia<br />
and the Pacific<br />
Latin America &<br />
Caribbean<br />
South Asia<br />
Middle East &<br />
North Africa<br />
World Average<br />
5.000 10.000 15.000 20.000<br />
CO 2 emissions in tons <strong>of</strong> coal equivalent per capita<br />
World average North America European Union Sub-Saharan Africa East Asia and the Pacific<br />
Latin America & Caribbean South Asia Arab Region China<br />
2011<br />
1990<br />
<strong>Social</strong> <strong>Watch</strong><br />
2000<br />
CHART 4<br />
Trade, income and basic capabilities<br />
World<br />
trade<br />
World per<br />
capita income<br />
World Basic<br />
Capabilities Index<br />
1990 2000<br />
2011<br />
Kuwait, Saudi Arabia, Syria and Tunisia (Middle East<br />
and North Africa); Azerbaijan, Tajikistan, Maldives and<br />
Vietnam (Central, South and East Asia); and Belize,<br />
Brazil, Colombia, El Salvador, Mexico, Paraguay, Peru<br />
and Suriname (Latin America). El Salvador registered<br />
the highest increment in BCI in this group accounting<br />
for a 17 point increase for the period 1990 to 2011.<br />
In contrast, countries such as Ukraine, Bosnia and<br />
Herzegovina, and Thailand have moved down from<br />
basic BCI to medium level. (See chart 1)<br />
Nineteen countries registered low BCI levels<br />
in 2011. Countries such as Bolivia, Honduras and<br />
Nicaragua in Latin America, and Cape Verde, Zimbabwe,<br />
and Swaziland in the Sub-Saharan Africa<br />
region, improved their standing from very low/critic<br />
BCI level to low BCI. Within this group <strong>of</strong> countries<br />
that registered low BCI levels, Bhutan in South Asia<br />
recorded the highest increase <strong>of</strong> 28 points, climbing<br />
up from critical to low BCI level.<br />
The number <strong>of</strong> countries in the critical BCI list has<br />
declined from 42 in 1990 to only 28 by 2011. Countries<br />
such as Benin, Cameroon, Eritrea, Ghana, Kenya, Malawi,<br />
Rwanda, Tanzania and Togo in Sub-Saharan Africa;<br />
Guatemala in Latin America; Djibouti, Egypt, Morocco<br />
and Yemen in the Middle East and North Africa; Laos<br />
and Myanmar in East Asia; and Bhutan and India in<br />
South Asia, have moved up from their previous critical<br />
BCI levels. Nonetheless, the number <strong>of</strong> countries in the<br />
critical list remains substantial especially if one considers<br />
that many poor countries with no reliable data collection<br />
system, indicating poor functioning institutions,<br />
would more likely fall in the critical BCI levels.<br />
The global BCI has progressed between 1990<br />
and 2011, although in general there has been a slower<br />
rate <strong>of</strong> progress between 2000 and 2011 than<br />
between 1990 and 2000. In 1990, the average BCI<br />
value (population weighted) for countries with available<br />
data was 79.4. In 2000, the BCI increased by<br />
4.9 points to 84.3. BCI further increased to 87.1 by<br />
2011, but at a lower increment <strong>of</strong> 2.8 points – lower<br />
than the rate <strong>of</strong> increase registered in the previous<br />
decade. (See chart 2) n


