CATC SATracer/Trainer 3G User's Manual - LeCroy
CATC SATracer/Trainer 3G User's Manual - LeCroy
CATC SATracer/Trainer 3G User's Manual - LeCroy

Create successful ePaper yourself
Turn your PDF publications into a flip-book with our unique Google optimized e-Paper software.
<strong>LeCroy</strong> Corporation<br />
3385 Scott Blvd., Santa Clara, CA 95054 Tel:+1/408.727.6600 Fax+1/408.727.6622<br />
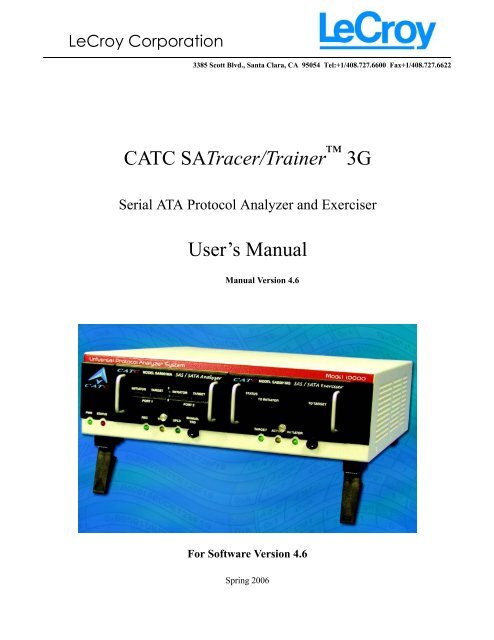
<strong>CATC</strong> <strong>SATracer</strong>/<strong>Trainer</strong> <strong>3G</strong><br />
Serial ATA Protocol Analyzer and Exerciser<br />
User’s <strong>Manual</strong><br />
<strong>Manual</strong> Version 4.6<br />
For Software Version 4.6<br />
Spring 2006
<strong>LeCroy</strong> <strong>SATracer</strong>/<strong>Trainer</strong> Analyzer User’s <strong>Manual</strong> SW Version 4.6<br />
Document Disclaimer<br />
The information in this document has been carefully checked and is<br />
believed to be reliable. However, no responsibility can be assumed for<br />
inaccuracies that may not have been detected.<br />
<strong>LeCroy</strong> reserves the right to revise the information in this document without<br />
notice or penalty.<br />
Trademarks and Servicemarks<br />
Copyright<br />
<strong>LeCroy</strong>, <strong>CATC</strong>, InFusion, and BusEngine are trademarks of <strong>LeCroy</strong>.<br />
Microsoft, Windows, Windows 2000, and Windows XP are registered<br />
trademarks of Microsoft Inc.<br />
All other trademarks are property of their respective companies.<br />
Copyright © 2006, <strong>LeCroy</strong>; All Rights Reserved.<br />
This document may be printed and reproduced without additional<br />
permission, but all copies should contain this copyright notice.<br />
ii<br />
Part number: 730-0054-00
<strong>LeCroy</strong> <strong>SATracer</strong>/<strong>Trainer</strong> Analyzer User’s <strong>Manual</strong> SW Version 4.6<br />
Chapter 1 <strong>LeCroy</strong> Overview. . . . . . . . . . . . . . . . . . . . . . . . . . . . . . 1<br />
General Description . . . . . . . . . . . . . . . . . . . . . . . . . . . . . . . . . 2<br />
Features. . . . . . . . . . . . . . . . . . . . . . . . . . . . . . . . . . . . . . . . . . . 4<br />
SAS/SATA Analyzer and Exerciser BusEngine . . . . . . . . . 5<br />
Power Cord Set . . . . . . . . . . . . . . . . . . . . . . . . . . . . . . . . . . 5<br />
SASTracer/<strong>Trainer</strong> on the UPAS 10000 Platform . . . . . . . 5<br />
Chapter 2 Installation . . . . . . . . . . . . . . . . . . . . . . . . . . . . . . . . . . . 7<br />
System Components/Packing List . . . . . . . . . . . . . . . . . . . . . . 7<br />
Analyzer PC Requirements. . . . . . . . . . . . . . . . . . . . . . . . . . . . 7<br />
Analyzer Hardware Description . . . . . . . . . . . . . . . . . . . . . . . . 7<br />
Analyzer LED Descriptions . . . . . . . . . . . . . . . . . . . . . . . . . . . 8<br />
Front Panel LEDs (from left to right) . . . . . . . . . . . . . . . . . 8<br />
Connectors on the SAS/SATA Analyzer Module . . . . . . . . 9<br />
Rear Panel Description . . . . . . . . . . . . . . . . . . . . . . . . . . . . . . . 9<br />
Setting Up the Analyzer . . . . . . . . . . . . . . . . . . . . . . . . . . . . . 10<br />
Connecting Devices to the Analyzer . . . . . . . . . . . . . . . . . . . 11<br />
Installing the <strong>SATracer</strong> Software . . . . . . . . . . . . . . . . . . . . . . 14<br />
Making a Recording . . . . . . . . . . . . . . . . . . . . . . . . . . . . . . . . 15<br />
Stopping a Recording . . . . . . . . . . . . . . . . . . . . . . . . . . . . 16<br />
Interrupting the Upload Process . . . . . . . . . . . . . . . . . . . . 17<br />
Saving the Trace . . . . . . . . . . . . . . . . . . . . . . . . . . . . . . . . 18<br />
Probe Control Settings . . . . . . . . . . . . . . . . . . . . . . . . . . . . . . 18<br />
Chapter 3 Software Overview . . . . . . . . . . . . . . . . . . . . . . . . . . . 21<br />
Starting the <strong>SATracer</strong>/<strong>Trainer</strong> Program . . . . . . . . . . . . . . . . . 21<br />
Opening Sample Traces . . . . . . . . . . . . . . . . . . . . . . . . . . . . . 21<br />
Tool Tips . . . . . . . . . . . . . . . . . . . . . . . . . . . . . . . . . . . . . . . . . 21<br />
Trace Tool-Tips. . . . . . . . . . . . . . . . . . . . . . . . . . . . . . . . . . . . 22<br />
The Menu bar . . . . . . . . . . . . . . . . . . . . . . . . . . . . . . . . . . . . . 22<br />
The Toolbar . . . . . . . . . . . . . . . . . . . . . . . . . . . . . . . . . . . . . . 25<br />
Pop-Up Menus . . . . . . . . . . . . . . . . . . . . . . . . . . . . . . . . . . . . 27<br />
Status Bar . . . . . . . . . . . . . . . . . . . . . . . . . . . . . . . . . . . . . . . . 28<br />
Recording Progress . . . . . . . . . . . . . . . . . . . . . . . . . . . . . . 28<br />
Recording Status . . . . . . . . . . . . . . . . . . . . . . . . . . . . . . . . 29<br />
Recording Activity . . . . . . . . . . . . . . . . . . . . . . . . . . . . . . 30<br />
Search Status. . . . . . . . . . . . . . . . . . . . . . . . . . . . . . . . . . . 30<br />
Navigation Tools. . . . . . . . . . . . . . . . . . . . . . . . . . . . . . . . . . . 30<br />
Zoom In. . . . . . . . . . . . . . . . . . . . . . . . . . . . . . . . . . . . . . . 30<br />
Zoom Out . . . . . . . . . . . . . . . . . . . . . . . . . . . . . . . . . . . . . 30<br />
Wrap . . . . . . . . . . . . . . . . . . . . . . . . . . . . . . . . . . . . . . . . . 30<br />
Adding Comments to the Trace . . . . . . . . . . . . . . . . . . . . . . . 31<br />
Set Marker. . . . . . . . . . . . . . . . . . . . . . . . . . . . . . . . . . . . . . . . 31<br />
Edit or Clear Marker . . . . . . . . . . . . . . . . . . . . . . . . . . . . . . . . 33<br />
iii
<strong>LeCroy</strong> <strong>SATracer</strong>/<strong>Trainer</strong> Analyzer User’s <strong>Manual</strong> SW Version 4.6<br />
Timing Calculations on Markers . . . . . . . . . . . . . . . . . . . . . . 34<br />
Chapter 4 Recording Options. . . . . . . . . . . . . . . . . . . . . . . . . . . . 35<br />
General Recording Options . . . . . . . . . . . . . . . . . . . . . . . . . . 36<br />
Recording Type. . . . . . . . . . . . . . . . . . . . . . . . . . . . . . . . . 36<br />
Options . . . . . . . . . . . . . . . . . . . . . . . . . . . . . . . . . . . . . . . 36<br />
Recording Scope . . . . . . . . . . . . . . . . . . . . . . . . . . . . . . . . 37<br />
Conventional Single Buffer Recording. . . . . . . . . . . . . . . 37<br />
File Structure for Segmented Files . . . . . . . . . . . . . . . . . . 39<br />
Channel Settings . . . . . . . . . . . . . . . . . . . . . . . . . . . . . . . . . . . 42<br />
Speed Settings. . . . . . . . . . . . . . . . . . . . . . . . . . . . . . . . . . 42<br />
Channel Settings . . . . . . . . . . . . . . . . . . . . . . . . . . . . . . . . 42<br />
Recording Rules . . . . . . . . . . . . . . . . . . . . . . . . . . . . . . . . . . . 43<br />
Recording Rules Toolbar . . . . . . . . . . . . . . . . . . . . . . . . . . . . 44<br />
Recording Rules Page - How it Works . . . . . . . . . . . . . . . . . . 45<br />
Selecting Events . . . . . . . . . . . . . . . . . . . . . . . . . . . . . . . . 45<br />
Selecting a Channel on an Event Button . . . . . . . . . . . . . 45<br />
Assigning an Action . . . . . . . . . . . . . . . . . . . . . . . . . . . . . . . . 46<br />
Dragging a Button to the Global State or Sequence Cell . 46<br />
Types of Pop-up Menus . . . . . . . . . . . . . . . . . . . . . . . . . . . . . 48<br />
Global State Cell and Sequence Cell Pop-up Menus . . . . 48<br />
Event Pop-up Menu . . . . . . . . . . . . . . . . . . . . . . . . . . . . . 48<br />
Action Pop-up Menu. . . . . . . . . . . . . . . . . . . . . . . . . . . . . 49<br />
New Events Menu . . . . . . . . . . . . . . . . . . . . . . . . . . . . . . . . . 51<br />
Types of Properties Dialog Boxes . . . . . . . . . . . . . . . . . . . . . 51<br />
Properties Dialog Box - General Features . . . . . . . . . . . . 52<br />
Event Properties Dialog Boxes - Descriptions . . . . . . . . . . . . 54<br />
Primitive Categories Properties Dialog . . . . . . . . . . . . . . 56<br />
Primitives Properties Dialog. . . . . . . . . . . . . . . . . . . . . . . 57<br />
ATA Commands Properties Dialog. . . . . . . . . . . . . . . . . . 58<br />
ATAPI Command Properties Dialog. . . . . . . . . . . . . . . . . 59<br />
State Properties Dialog . . . . . . . . . . . . . . . . . . . . . . . . . . . . . . 61<br />
Timer Properties Dialog . . . . . . . . . . . . . . . . . . . . . . . . . . 62<br />
Assigning Actions. . . . . . . . . . . . . . . . . . . . . . . . . . . . . . . . . . 62<br />
Setting Conditions: The Role of the Global State Cell . . . . . 63<br />
Filter In and Filter Out . . . . . . . . . . . . . . . . . . . . . . . . . . . 65<br />
Filter In or Out Everything . . . . . . . . . . . . . . . . . . . . . . . . 65<br />
Counting Events . . . . . . . . . . . . . . . . . . . . . . . . . . . . . . . . 65<br />
Creating Event Sequences . . . . . . . . . . . . . . . . . . . . . . . . . . . 67<br />
States. . . . . . . . . . . . . . . . . . . . . . . . . . . . . . . . . . . . . . . . . 67<br />
How to Create an Event Sequence . . . . . . . . . . . . . . . . . . 68<br />
Using a Timer . . . . . . . . . . . . . . . . . . . . . . . . . . . . . . . . . . 71<br />
Recording Options - Channels . . . . . . . . . . . . . . . . . . . . . . . . 73<br />
Where Custom Channel Names Appear . . . . . . . . . . . . . . 73<br />
iv
<strong>LeCroy</strong> <strong>SATracer</strong>/<strong>Trainer</strong> Analyzer User’s <strong>Manual</strong> SW Version 4.6<br />
Chapter 5 Display Options . . . . . . . . . . . . . . . . . . . . . . . . . . . . . . 77<br />
General Display Options. . . . . . . . . . . . . . . . . . . . . . . . . . . . . 77<br />
Setting Color, Formatting, and Hiding Options . . . . . . . . . . . 79<br />
Setting Color Display Options . . . . . . . . . . . . . . . . . . . . . 79<br />
Changing Field Formats . . . . . . . . . . . . . . . . . . . . . . . . . . 80<br />
Hiding Display Options . . . . . . . . . . . . . . . . . . . . . . . . . . 81<br />
Level Hiding Options . . . . . . . . . . . . . . . . . . . . . . . . . . . . . . . 81<br />
Saving Display Options . . . . . . . . . . . . . . . . . . . . . . . . . . . . . 81<br />
Chapter 6 Reading a <strong>CATC</strong> Trace . . . . . . . . . . . . . . . . . . . . . . . . 83<br />
Trace View Features . . . . . . . . . . . . . . . . . . . . . . . . . . . . . . . . 83<br />
Frame, Transport, SCSI, and Management Views . . . . . . . . . 83<br />
View Raw Bits . . . . . . . . . . . . . . . . . . . . . . . . . . . . . . . . . . . . 85<br />
Running Disparity. . . . . . . . . . . . . . . . . . . . . . . . . . . . . . . 87<br />
Expanding and Collapsing Data Fields. . . . . . . . . . . . . . . . . . 87<br />
View Data Block Window . . . . . . . . . . . . . . . . . . . . . . . . . . . 88<br />
Description of View Data Block Window . . . . . . . . . . . . 89<br />
Export Options . . . . . . . . . . . . . . . . . . . . . . . . . . . . . . . . . . . . 90<br />
Packets to Text (Packet View Format) . . . . . . . . . . . . . . . 90<br />
Export to Generator File Format. . . . . . . . . . . . . . . . . . . . 91<br />
Packets to EAS Format . . . . . . . . . . . . . . . . . . . . . . . . . . . 91<br />
Export to CSV Format . . . . . . . . . . . . . . . . . . . . . . . . . . . 91<br />
Chapter 7 Reports . . . . . . . . . . . . . . . . . . . . . . . . . . . . . . . . . . . . . 95<br />
File Information . . . . . . . . . . . . . . . . . . . . . . . . . . . . . . . . . . . 95<br />
Traffic Summary . . . . . . . . . . . . . . . . . . . . . . . . . . . . . . . . . . . 96<br />
Error Summary . . . . . . . . . . . . . . . . . . . . . . . . . . . . . . . . . . . . 97<br />
Timing Calculations . . . . . . . . . . . . . . . . . . . . . . . . . . . . . . . . 97<br />
Bus Utilization . . . . . . . . . . . . . . . . . . . . . . . . . . . . . . . . . . . . 98<br />
Link Tracker Window. . . . . . . . . . . . . . . . . . . . . . . . . . . . . . 102<br />
Frame Tracker Window . . . . . . . . . . . . . . . . . . . . . . . . . . . . 106<br />
Chapter 8 Searching Traces . . . . . . . . . . . . . . . . . . . . . . . . . . . . 109<br />
Go to Trigger. . . . . . . . . . . . . . . . . . . . . . . . . . . . . . . . . . . . . 109<br />
Go to Event ... . . . . . . . . . . . . . . . . . . . . . . . . . . . . . . . . . . . . 109<br />
Go to Marker. . . . . . . . . . . . . . . . . . . . . . . . . . . . . . . . . . . . . 110<br />
Go To . . . . . . . . . . . . . . . . . . . . . . . . . . . . . . . . . . . . . . . . . . 111<br />
Find . . . . . . . . . . . . . . . . . . . . . . . . . . . . . . . . . . . . . . . . . . . . 111<br />
Complex Searches. . . . . . . . . . . . . . . . . . . . . . . . . . . . . . 113<br />
Event Groups . . . . . . . . . . . . . . . . . . . . . . . . . . . . . . . . . 113<br />
Union, Intersection, and Exclusion. . . . . . . . . . . . . . . . . 113<br />
Using Find. . . . . . . . . . . . . . . . . . . . . . . . . . . . . . . . . . . . 114<br />
Find Next . . . . . . . . . . . . . . . . . . . . . . . . . . . . . . . . . . . . 114<br />
Chapter 9 External Interface for Trigger In /Out . . . . . . . . . . 117<br />
v
<strong>LeCroy</strong> <strong>SATracer</strong>/<strong>Trainer</strong> Analyzer User’s <strong>Manual</strong> SW Version 4.6<br />
BNC External Trigger In / Out . . . . . . . . . . . . . . . . . . . . . . . 117<br />
Using the BNC Trigger Out . . . . . . . . . . . . . . . . . . . . . . 117<br />
Using the BNC Trigger In. . . . . . . . . . . . . . . . . . . . . . . . 118<br />
External Interface Breakout Board . . . . . . . . . . . . . . . . . . . . 120<br />
Pin-Outs for the Data In/Out Connector . . . . . . . . . . . . . . . . 120<br />
Prototype Rework Area . . . . . . . . . . . . . . . . . . . . . . . . . 121<br />
Configuring Input Signaling through the Breakout Board . . 122<br />
Chapter 10 Networking <strong>SATracer</strong> . . . . . . . . . . . . . . . . . . . . . . . . 125<br />
Working with Multiple Analyzers . . . . . . . . . . . . . . . . . . . . 125<br />
Hardware Setup for Direct USB Connections . . . . . . . . . . . 126<br />
Setup for Cascaded Multiple Analyzer Use . . . . . . . . . . . . . 126<br />
Set Up for Remote Access over an IP LAN . . . . . . . . . . . . . 127<br />
Configuring the Connection . . . . . . . . . . . . . . . . . . . . . . . . . 127<br />
USB-Connected Analyzers . . . . . . . . . . . . . . . . . . . . . . . 127<br />
Remote Analyzers Over an IP Network . . . . . . . . . . . . . 128<br />
Configuring Cascaded Multiple Analyzers. . . . . . . . . . . 129<br />
Network Chat . . . . . . . . . . . . . . . . . . . . . . . . . . . . . . . . . . . . 130<br />
Chapter 11 Traffic Generation with SA<strong>Trainer</strong> . . . . . . . . . . . . . 131<br />
SAS/SATA Exerciser Hardware . . . . . . . . . . . . . . . . . . . . . . 131<br />
Cabling SAS/SATA Exerciser for Host Emulation. . . . . . . . 131<br />
Cabling SAS/SATA Exerciser for Device Emulation. . . . . . 132<br />
Generating Traffic. . . . . . . . . . . . . . . . . . . . . . . . . . . . . . . . . 132<br />
Creating a Traffic Generation File with SASTracer . . . . 132<br />
Opening a Traffic Generation File . . . . . . . . . . . . . . . . . . . . 134<br />
Layout . . . . . . . . . . . . . . . . . . . . . . . . . . . . . . . . . . . . . . . 134<br />
Starting the Script Editor . . . . . . . . . . . . . . . . . . . . . . . . . . . 135<br />
Toolbar . . . . . . . . . . . . . . . . . . . . . . . . . . . . . . . . . . . . . . 136<br />
File Tabs . . . . . . . . . . . . . . . . . . . . . . . . . . . . . . . . . . . . . 137<br />
Error Log. . . . . . . . . . . . . . . . . . . . . . . . . . . . . . . . . . . . . 137<br />
Overview of Generation & Global Settings Files. . . . . . . . . 138<br />
Traffic Generation (*.ssg) Files . . . . . . . . . . . . . . . . . . . 138<br />
Settings.inc File . . . . . . . . . . . . . . . . . . . . . . . . . . . . . . . 138<br />
Primitive and Frame Definitions. . . . . . . . . . . . . . . . . . . . . . 142<br />
Special Conditions for Frames . . . . . . . . . . . . . . . . . . . . 142<br />
PrimitivesDecl.inc. . . . . . . . . . . . . . . . . . . . . . . . . . . . . . 143<br />
AddressFramesDecl.inc . . . . . . . . . . . . . . . . . . . . . . . . . 143<br />
SSPFrames.inc . . . . . . . . . . . . . . . . . . . . . . . . . . . . . . . . 144<br />
SMPFrames.inc. . . . . . . . . . . . . . . . . . . . . . . . . . . . . . . . 144<br />
STPFrames.inc . . . . . . . . . . . . . . . . . . . . . . . . . . . . . . . . 144<br />
Working with Generation Files. . . . . . . . . . . . . . . . . . . . . . . 144<br />
Generating Traffic. . . . . . . . . . . . . . . . . . . . . . . . . . . . . . . . . 146<br />
Stop Traffic Generation. . . . . . . . . . . . . . . . . . . . . . . . . . 146<br />
vi
<strong>LeCroy</strong> <strong>SATracer</strong>/<strong>Trainer</strong> Analyzer User’s <strong>Manual</strong> SW Version 4.6<br />
Resume Traffic Generation. . . . . . . . . . . . . . . . . . . . . . . 146<br />
Chapter 12 SAS<strong>Trainer</strong> Generation Language . . . . . . . . . . . . . 147<br />
File Structure. . . . . . . . . . . . . . . . . . . . . . . . . . . . . . . . . . . . . 147<br />
Declarations . . . . . . . . . . . . . . . . . . . . . . . . . . . . . . . . . . 147<br />
Generation blocks . . . . . . . . . . . . . . . . . . . . . . . . . . . . . . 147<br />
Language. . . . . . . . . . . . . . . . . . . . . . . . . . . . . . . . . . . . . . . . 147<br />
Comments: . . . . . . . . . . . . . . . . . . . . . . . . . . . . . . . . . . . 147<br />
Includes: . . . . . . . . . . . . . . . . . . . . . . . . . . . . . . . . . . . . . 148<br />
Settings . . . . . . . . . . . . . . . . . . . . . . . . . . . . . . . . . . . . . . 148<br />
Constants. . . . . . . . . . . . . . . . . . . . . . . . . . . . . . . . . . . . . 148<br />
Predefined Constants . . . . . . . . . . . . . . . . . . . . . . . . . . . 148<br />
Data Patterns . . . . . . . . . . . . . . . . . . . . . . . . . . . . . . . . . . 149<br />
Primitives . . . . . . . . . . . . . . . . . . . . . . . . . . . . . . . . . . . . 149<br />
Packets/Frames . . . . . . . . . . . . . . . . . . . . . . . . . . . . . . . . 149<br />
Generation Block . . . . . . . . . . . . . . . . . . . . . . . . . . . . . . . . . 152<br />
Definitions . . . . . . . . . . . . . . . . . . . . . . . . . . . . . . . . . . . . . . 152<br />
Field Variable Declarations. . . . . . . . . . . . . . . . . . . . . . . 153<br />
Changing Frame Fields. . . . . . . . . . . . . . . . . . . . . . . . . . 153<br />
Preprocessor integer arithmetic . . . . . . . . . . . . . . . . . . . 153<br />
Loops . . . . . . . . . . . . . . . . . . . . . . . . . . . . . . . . . . . . . . . 154<br />
SAS<strong>Trainer</strong> Generation Commands . . . . . . . . . . . . . . . . . . . 155<br />
General Commands. . . . . . . . . . . . . . . . . . . . . . . . . . . . . 155<br />
SATA Commands . . . . . . . . . . . . . . . . . . . . . . . . . . . . . . 156<br />
Primitive Commands . . . . . . . . . . . . . . . . . . . . . . . . . . . 157<br />
Wait Commands . . . . . . . . . . . . . . . . . . . . . . . . . . . . . . . 161<br />
Wait Command Groups. . . . . . . . . . . . . . . . . . . . . . . . . . 168<br />
Generation Settings. . . . . . . . . . . . . . . . . . . . . . . . . . . . . 175<br />
Setting Complex "Wait For" Conditions. . . . . . . . . . . . . . . . 186<br />
Setting Conditions with the Generation Options Dialog 187<br />
Chapter 13 Updates and Licensing . . . . . . . . . . . . . . . . . . . . . . . 189<br />
Software, Firmware, and BusEngine Versions . . . . . . . . . . . 189<br />
Software Updates . . . . . . . . . . . . . . . . . . . . . . . . . . . . . . . . . 190<br />
Automatic BusEngine and Firmware Updates . . . . . . . . . . . 191<br />
Updating the BusEngine . . . . . . . . . . . . . . . . . . . . . . . . . 191<br />
Updating the Firmware . . . . . . . . . . . . . . . . . . . . . . . . . . 191<br />
Automatic Updates . . . . . . . . . . . . . . . . . . . . . . . . . . . . . 191<br />
License Information . . . . . . . . . . . . . . . . . . . . . . . . . . . . . . . 193<br />
Updating the Software License. . . . . . . . . . . . . . . . . . . . . . . 194<br />
Appendix A Specifications . . . . . . . . . . . . . . . . . . . . . . . . . . . . . . 195<br />
Package . . . . . . . . . . . . . . . . . . . . . . . . . . . . . . . . . . . . . . 195<br />
Power Requirements . . . . . . . . . . . . . . . . . . . . . . . . . . . . 195<br />
Environmental Conditions . . . . . . . . . . . . . . . . . . . . . . . 195<br />
vii
<strong>LeCroy</strong> <strong>SATracer</strong>/<strong>Trainer</strong> Analyzer User’s <strong>Manual</strong> SW Version 4.6<br />
Probing Characteristics (model SS002MAA &<br />
SS003MAA) . . . . . . . . . . . . . . . . . . . . . . . . . . . . . . . . . . 195<br />
Probing Characteristics (model SS004MAA). . . . . . . . . 196<br />
Recording Memory Size . . . . . . . . . . . . . . . . . . . . . . . . . 196<br />
Host PC Requirements . . . . . . . . . . . . . . . . . . . . . . . . . . 196<br />
Switches . . . . . . . . . . . . . . . . . . . . . . . . . . . . . . . . . . . . . 196<br />
LEDs . . . . . . . . . . . . . . . . . . . . . . . . . . . . . . . . . . . . . . . 196<br />
Basic Trigger Events. . . . . . . . . . . . . . . . . . . . . . . . . . . . 197<br />
Traffic Summary Reports . . . . . . . . . . . . . . . . . . . . . . . . 197<br />
Chapter 14 How to Contact <strong>LeCroy</strong> . . . . . . . . . . . . . . . . . . . . . . 199<br />
viii
<strong>LeCroy</strong> <strong>SATracer</strong>/<strong>Trainer</strong> Analyzer User’s <strong>Manual</strong> SW Version 4.6<br />
1. <strong>LeCroy</strong> Overview<br />
<strong>LeCroy</strong>’s <strong>SATracer</strong>/<strong>Trainer</strong> <strong>3G</strong> is an integrated protocol analyzer and<br />
exerciser platform that provides fast, efficient and accurate debug, test and<br />
verification of Serial ATA semiconductors, devices and systems.<br />
<strong>SATracer</strong>/<strong>Trainer</strong> platform allows designers and validation engineers to<br />
quickly and easily transmit valid and invalid 1.5 or 3 Gbps SATA traffic,<br />
selectively record the exchange and display the results using the <strong>LeCroy</strong><br />
Trace expert analysis software. SA<strong>Trainer</strong> offers both initiator and target<br />
side emulation modes, allowing this all-in-one test platform to play an<br />
important role at every phase of the SATA product development process.<br />
The <strong>SATracer</strong> and SA<strong>Trainer</strong> software operate on the <strong>LeCroy</strong> SAS/SATA<br />
Analyzer and Exerciser platforms. <strong>SATracer</strong> is the software that runs the<br />
SAS/SATA Analyzer plug-in module. This plug-in module installs into the<br />
<strong>LeCroy</strong> 10K platform. SA<strong>Trainer</strong> is traffic generation software that runs the<br />
SAS/SATA Exerciser platform. Together, the Analyzer and Exerciser<br />
platforms can be used selectively for analysis only, traffic generation only,<br />
or perform both analysis and traffic generation at the same time. The<br />
SASTracer/<strong>Trainer</strong> can transmit a single link of 1.5 or 3 Gbps traffic while<br />
providing 1 or 2 recording channels. A “4-wide” recording option is also<br />
available to support wide link analysis tasks.<br />
The heart of the <strong>CATC</strong> platform is the revolutionary <strong>LeCroy</strong> BusEngine.<br />
This state-of-the-art, field-upgradeable, technology core incorporates a<br />
real-time non-intrusive recording engine and configurable tools to trigger<br />
and filter SATA traffic. It can intelligently monitor SATA frame headers<br />
and addresses; or start recording when event counters exceed specified<br />
thresholds.<br />
SA<strong>Trainer</strong> utilizes standard Serial ATA cables and can be programmed to<br />
transmit valid and invalid SATA traffic. It can send specific IO operations<br />
or customized data payloads. The exerciser can “play-back” any previously<br />
recorded trace as a stimulus file and also offers a text-based API for creating<br />
scripts from the ground up.<br />
As with all <strong>LeCroy</strong> analyzers, hardware based pre-capture filtering is<br />
supported for efficient memory management.<br />
For complete product information, please visit www.<strong>LeCroy</strong>.com.<br />
1
<strong>LeCroy</strong> <strong>SATracer</strong>/<strong>Trainer</strong> Analyzer User’s <strong>Manual</strong> SW Version 4.6<br />
Please refer to the Serial ATA Specification for details on the SATA<br />
protocol.<br />
1.1 General Description<br />
SAS/SATA Analyzer and SAS/SATA Exercisers are plug-in modules that<br />
install into a chassis called the Universal Protocol Analyzer System 10K<br />
(UPAS 10K). The UPAS 10K, in turn, connects to a PC over a Hi-Speed<br />
USB cable. The PC functions as the host controller for the SASTracer and<br />
UPAS.<br />
SAS/SATA Analyzer can be controlled by either SASTracer software<br />
(which allows the capture of both SAS and SATA traffic) or <strong>SATracer</strong><br />
(which allows only the capture of SATA traffic.)<br />
Both SASTracer and <strong>SATracer</strong> software run on a Windows-based PC that<br />
serves as the analyzer controller. This controller (or "host" as it is generally<br />
called) controls and configures the analyzer and retrieves and displays trace<br />
data.<br />
Recorded data is presented as a "trace" in the trace viewer as rows of<br />
color-coded graphics. Users can then search this trace for errors and other<br />
events using advanced search utilities, and then hide from the display all but<br />
only the most interesting and relevant data.<br />
The <strong>SATracer</strong>/<strong>Trainer</strong> trace viewing software runs on any personal<br />
computer using the Window 2000 or Windows XP operating systems and<br />
equipped with a functional USB interface.<br />
2
<strong>LeCroy</strong> <strong>SATracer</strong>/<strong>Trainer</strong> Analyzer User’s <strong>Manual</strong> SW Version 4.6<br />
The <strong>SATracer</strong> is capable of on-the-fly detection of and triggering on such<br />
events as Primitives, Bus Conditions, Data Patterns, and Errors. Whether<br />
recording manually or with a specified trigger condition, <strong>SATracer</strong><br />
continuously records the link data in a wrap-around fashion until manually<br />
stopped or until the Trigger Event is detected and a specified post-Trigger<br />
amount of link data is recorded.<br />
Upon detection of a triggering event, the analyzer continues to record data<br />
up to a point specified by the user. Real-time detection of events can be<br />
individually enabled or disabled to allow triggering on events as they<br />
happen. This includes predefined exception or error conditions and a<br />
user-defined set of trigger events.<br />
The <strong>SATracer</strong>/<strong>Trainer</strong> software provides powerful search functions that<br />
enable investigation and highlighting of specific events. In addition to<br />
immediate analysis, you can print any part of the data. Use the Save As<br />
feature to save the data on disk for later viewing. The program also provides<br />
a variety of timing information and data analysis reports.<br />
3
<strong>LeCroy</strong> <strong>SATracer</strong>/<strong>Trainer</strong> Analyzer User’s <strong>Manual</strong> SW Version 4.6<br />
1.2 Features<br />
• Separate Analyzer and Generator Modules that can be integrated into a<br />
single system<br />
• Available with One, Two or Four 1.5 or 3.0 Gbps SATA analysis ports<br />
• Supports Serial ATA Recording at 1.5 or 3.0 Gbps<br />
• Sophisticated Triggering<br />
• Hardware Filtering<br />
• DWORD Display<br />
• 4-lane (SFF-8484) External InFininband Style Connector Option<br />
• Exerciser offers Host and Target Emulation<br />
• Exerciser automatically responds to incoming OOB<br />
• Traffic Summaries<br />
• Collapsible / Expandable Headers<br />
• Automatic Decoding of SATA FIS and ATA Command Layers<br />
• Field Upgradeable BusEngine Technology<br />
• Dynamically Allocated Memory Pool (2 GB)<br />
• 3 Year Hardware Warranty<br />
• All-in-one platform transmits, records, and analyzes the SATA protocol<br />
• Monitor, trigger and record up to 4 Serial Attached SATA links<br />
simultaneously<br />
• Isolate areas of interest with real-time hardware triggering<br />
• Extend capture window by removing non-essential primitives<br />
• Chronologically display all DWORDs on all channels synchronized to a<br />
common clock<br />
• Flexible platform for testing host and end-device behavior<br />
• Automatically bring SATA device under test through power up / reset<br />
and speed negotiation sequence<br />
• Statistical reports provide high level abstraction of events and commands<br />
• Easy “drill-down” on field structures for individual Frames, Commands<br />
and Tasks<br />
• Easily upgrade firmware to support new features<br />
• Protect your investment with industry-leading warranty<br />
4
<strong>LeCroy</strong> <strong>SATracer</strong>/<strong>Trainer</strong> Analyzer User’s <strong>Manual</strong> SW Version 4.6<br />
SAS/SATA Analyzer and Exerciser BusEngine<br />
<strong>LeCroy</strong>’s BusEngine Technology is at the heart of the Analyzer and<br />
Exerciser systems. The revolutionary BusEngine core uses FPGA<br />
technology and incorporates both the real-time recording engine and the<br />
configurable building blocks that implement data/state/error detection,<br />
triggering, external signal monitoring, and event counting and sequencing.<br />
Like the flash-memory-based firmware that controls its operation, all<br />
BusEngine logic is fully field upgradeable, using configuration files that can<br />
be downloaded from the <strong>LeCroy</strong> Website.<br />
Power Cord Set<br />
Cord Manufacturer and Models:<br />
180-0005-00 Quail 5000.079 UL,CSA<br />
180-0013-00 Quail 8500.098 VDE, KEMA, CEBERC, NEMDO, DEMDO, SETI,<br />
OVE, SEV<br />
180-0014-00 Quail 9650.098 ASTA<br />
SASTracer/<strong>Trainer</strong> on the UPAS 10000 Platform<br />
<strong>CATC</strong> 10K chassis includes a USB 2.0 Certified Hi-Speed Device. To<br />
upload traces from the UPAS/SASTracer to an attached PC at Hi-Speed, the<br />
PC must have a USB 2.0 Certified Host Controller and be running Windows<br />
2000 SP3 or Windows XP.<br />
Note The <strong>CATC</strong> 10K products includes 2.0 USB hubs. You might see<br />
the drivers for these generic hubs being installed upon the initial<br />
plug-in.<br />
5
<strong>LeCroy</strong> <strong>SATracer</strong>/<strong>Trainer</strong> Analyzer User’s <strong>Manual</strong> SW Version 4.6<br />
6
<strong>LeCroy</strong> <strong>SATracer</strong>/<strong>Trainer</strong> Analyzer User’s <strong>Manual</strong> SW Version 4.6<br />
2. Installation<br />
<strong>SATracer</strong> is an application that works in conjunction with the SAS/SATA<br />
Analyzer module. The SAS/SATA Analyzer module is sold as part of the<br />
Universal Protocol Analyzer System 10K (UPAS 10K).<br />
This chapter describes how to set up <strong>SATracer</strong> and create your first<br />
recording.<br />
2.1 System Components/Packing List<br />
• One stand-alone SAS/SATA Analyzer module<br />
• One USB cable<br />
• <strong>SATracer</strong> software program CD-ROM<br />
• SATA(SAS) Cables<br />
• Break-out board<br />
Note: Specific components included with the <strong>SATracer</strong>/<strong>Trainer</strong> <strong>3G</strong><br />
system vary based on model and configuration ordered.<br />
2.2 Analyzer PC Requirements<br />
The analyzer connects to a Host PC over a USB cable.<br />
Please consult the readme file on the installation CD for the latest PC<br />
requirements.<br />
2.3 Analyzer Hardware Description<br />
<strong>LeCroy</strong>’s SAS/SATA Analyzer System is based on the <strong>CATC</strong> 10K chassis.<br />
Plug-in modules for SAS/SATA are available with either the Internal SATA<br />
style cable connector (SS002MAA-X & SS003MAA-X) or the new plug-in with<br />
External "Infiniband style" connectors (SS004MAA-X) below.<br />
Figure 1: <strong>LeCroy</strong> Analyzer Systems<br />
Module Part # SS002MAA-X & SS003MAA-X<br />
7<br />
Module Part # SS004MAA-X
<strong>LeCroy</strong> <strong>SATracer</strong>/<strong>Trainer</strong> Analyzer User’s <strong>Manual</strong> SW Version 4.6<br />
2.4 Analyzer LED Descriptions<br />
When powered on, the SAS/SATA Analyzer activates the user-accessible<br />
controls and LEDs on the front and rear panels of the UPAS.<br />
Warning Do not open the UPAS enclosure. There are no operator serviceable<br />
parts inside. Refer servicing to <strong>LeCroy</strong>.<br />
Figure 2: Front Panel (Internal single lane connector - SS002MAA & SS003MAA-X)<br />
Figure 3: Front Panel (4 Port External connector - SS004MAA-X)<br />
Front Panel LEDs (from left to right)<br />
A PWR (power) - Green indicator LED for UPAS. Lights when the unit<br />
power is switched on.<br />
B Status indicator - Red indicator LED for UPAS. Lights during<br />
initialization/power up of UPAS base unit. Blinks if a self-test fails.<br />
C REC (recording) - Green LED. Lights when the unit is recording.<br />
D TRG (triggered) - Orange LED. Lights when the unit triggers on an<br />
event.<br />
E UPLD (Upload) - Green LED. Lights when trace is being uploaded from<br />
the analyzer to the PC.<br />
F <strong>Manual</strong> Trigger - Push-button. Allows a manual Trace capture.<br />
G 1 - 4 (Link Channels 1 - 4) - Green LEDs. Lights when a connection is<br />
established on the corresponding link.<br />
8
<strong>LeCroy</strong> <strong>SATracer</strong>/<strong>Trainer</strong> Analyzer User’s <strong>Manual</strong> SW Version 4.6<br />
Connectors on the SAS/SATA Analyzer Module<br />
• Plug-in Modules SS002MAA-X & SS003MAA-X use single-lane Serial ATA<br />
Connectors (4).<br />
• Plug-in Module SS004MAA-X use 4 port Infiniband style connectors (1).<br />
2.5 Rear Panel Description<br />
From left to right, the UPAS rear panel contains the following components:<br />
Figure 4: Rear Panel<br />
USB type “B” host computer connector<br />
This connector links the analyzer to the Host PC. for the purpose of<br />
transmitting commands from the PC to the analyzer and uploading traces<br />
from the analyzer’s recording memory to the SASTracer software for<br />
viewing and analysis.<br />
RS-232 25 pin "Data Output" Connector<br />
This connector links a 25 pin RS-232 cable to an external breakout board.<br />
The breakout board allows signals to be sent from the analyzer to an external<br />
device such as an oscilloscope or from an external device to the analyzer for<br />
the purpose of triggering on an external input. You configure input/output<br />
signalling through the Recording Options dialog box. Breakout board use<br />
is described at the end of this chapter.<br />
BNC Connectors "Ext. In" and "Ext. Out"<br />
These connectors allow BNC cables to be attached to the analyzer for the<br />
purpose of triggering on external input signals or for sending an output<br />
signal from the analyzer to another device. These connectors have the same<br />
function as the 25 pin RS-232 connector - i.e., they channel input and output<br />
signals but do not support the use of a breakout board.<br />
9
<strong>LeCroy</strong> <strong>SATracer</strong>/<strong>Trainer</strong> Analyzer User’s <strong>Manual</strong> SW Version 4.6<br />
Wide range AC connector module<br />
— Power socket<br />
— Power on/off switch<br />
— Enclosed 5x20 mm 2.0A 250 V fast acting glass fuse<br />
Warning For continued protection against fire, replace fuse only with the type<br />
and rating specified above.<br />
2.6 Setting Up the Analyzer<br />
Step 1 Remove the analyzer from its shipping container.<br />
The SAS/SATA Analyzer module will already be installed in the<br />
left slot of the UPAS. The right slot may have a second analyzer or<br />
a SAS/SATA Exerciser.<br />
Step 2 Connect the Analyzer unit to a 100-volt to 240-volt, 50 Hz to 60 Hz,<br />
120 W power outlet using the provided power cord.<br />
Note: The Analyzer is capable of supporting supply voltages between<br />
100-volt and 240-volt, 50 Hz or 60 Hz, thus supporting all<br />
known supply voltages around the world.<br />
Step 3 Turn on the power switch on the rear of the UPAS.<br />
Note: At power-on, the analyzer initializes itself in approximately ten<br />
seconds and performs an exhaustive self-diagnostic that lasts<br />
about five seconds. The Status LED of the UPAS base unit turns<br />
red on power up/initialization. The LED remains on<br />
approximately 25 seconds while the analyzer performs<br />
self-diagnostic testing. If the diagnostics fail, the Status LED<br />
will blink red, indicating a hardware failure. If this occurs, call<br />
<strong>LeCroy</strong> Customer Support for assistance.<br />
Step 4 Insert the CD into the CD ROM drive of the PC that will be<br />
controlling the analyzer.<br />
Step 5 Connect the USB cable between the USB port on the back of the<br />
analyzer and a USB port on the PC.<br />
The operating system detects the analyzer and begins to install the USB driver.<br />
Step 6 Follow Windows on-screen Plug-and-Play instructions for the<br />
automatic installation of the analyzer as a USB device on the Host<br />
10
<strong>LeCroy</strong> <strong>SATracer</strong>/<strong>Trainer</strong> Analyzer User’s <strong>Manual</strong> SW Version 4.6<br />
PC (the required USB files are included on the SASTracer CD).<br />
Step through the Windows hardware wizard. The wizard will see<br />
that the UPAS has an internal USB hub and will begin loading hub<br />
drivers. Afterwards, the wizard will automatically install<br />
<strong>SATracer</strong>/<strong>Trainer</strong> as a USB device on the PC. When the wizard<br />
prompts you for driver information, point it to the CD which should<br />
be in your disk drive and install catcupa.sys and SASTracer.sys.<br />
2.7 Connecting Devices to the Analyzer<br />
Model SS004MAA-X incorporates the SAS external "Infiniband style"<br />
connector which includes both a non-intrusive as well as a repeater style<br />
front-end. This allows users to selectively switch between these two<br />
probing techniques based on their specific application. Only one pair of<br />
connectors may be used at a time.<br />
Note: User’s with model SS004MAA-X must switch between<br />
"repeater" and "non-intrusive" using the SASTracer software.<br />
Go to Setup > Probe Control to enable "repeater" or<br />
"non-intrusive" mode.<br />
Figure 5: Plug-in Module SS004MAA-X offers two types of probing<br />
Non-intrusive Tap<br />
Also known as passive tapping, this approach silently samples the signal<br />
without re-driving the differential lines (high value resistors contribute to<br />
reduction in amplitude ˜ 15%).<br />
11
<strong>LeCroy</strong> <strong>SATracer</strong>/<strong>Trainer</strong> Analyzer User’s <strong>Manual</strong> SW Version 4.6<br />
Figure 6: Non-intrusive tap diagram<br />
Repeater Tap<br />
In repeater mode, the analyzer reproduces the exact patterns it receives on<br />
the inbound (RX) line. While the repeater does not re-time the signal - it<br />
does "clean-up" normal reflections that can occur over a full length cable<br />
when the analyzer is not in the line.<br />
Figure 7: Repeater tap diagram<br />
When using the External Connector Module (SS004MAA) to probe<br />
between devices that utilize single lane SATA connectors, the special<br />
octopus cable must be used. The SATA side of the octopus cables would be<br />
attached to the devices under test (see Figure 8).<br />
12
<strong>LeCroy</strong> <strong>SATracer</strong>/<strong>Trainer</strong> Analyzer User’s <strong>Manual</strong> SW Version 4.6<br />
Figure 8: Test Setup With DUT Requiring Single Lane SATA Connectors<br />
Note: The initiator side must be a "cross-over" cable.<br />
Figure 9: Test Setup With DUT Requiring External 4 Lane Connector<br />
Note: When using new External Connector Module (SS004MAA)<br />
with standard 4X External InfiniBand style cables, there is no<br />
need to use "cross-over" cable. Both cables above are straight.<br />
13
<strong>LeCroy</strong> <strong>SATracer</strong>/<strong>Trainer</strong> Analyzer User’s <strong>Manual</strong> SW Version 4.6<br />
<strong>LeCroy</strong> Analyzer with Internal SATA Connectors (SS002MAA & SS003MAA)<br />
When using original single-lane "SATA-style" module (SS002MAA &<br />
SS003MAA) with devices that utilize single-lane SATA style connectors,<br />
the special octopus cable must be used. The SATA connector side of the<br />
octopus cables would be attached to the analyzer (see Figure 10).<br />
Figure 10: Test Setup With DUT Requiring External 4 Lane Connector<br />
Note: The target side must be a "cross-over" cable.<br />
2.8 Installing the <strong>SATracer</strong> Software<br />
Once <strong>SATracer</strong> has been recognized as a USB device, install the <strong>SATracer</strong><br />
software on the Host PC.<br />
Step 1 On the PC, run setup on the installation CD and follow the<br />
on-screen instructions.<br />
The <strong>SATracer</strong> software will install on the PC hard disk.<br />
Step 2 To start the application, launch the <strong>LeCroy</strong> SASTracer program<br />
from the Start menu:<br />
Start > Programs > <strong>LeCroy</strong> > <strong>SATracer</strong>.<br />
14
<strong>LeCroy</strong> <strong>SATracer</strong>/<strong>Trainer</strong> Analyzer User’s <strong>Manual</strong> SW Version 4.6<br />
The <strong>SATracer</strong> program opens.<br />
Note: The software may be used with or without the analyzer. When<br />
used without an analyzer, the program functions as a Trace<br />
Viewer to view, analyze, and print captured traffic.<br />
2.9 Making a Recording<br />
After installation, the software is configured to make a four-Mbyte snapshot<br />
recording of your SATA traffic.<br />
To make this recording, follow these steps:<br />
Step 1 Connect a cable to each of the two connectors on the SAS/SATA<br />
Analyzer module, then connect the other ends to the Serial ATA<br />
device under test and Serial ATA host system.<br />
Step 2 From the Setup menu, select Recording Options.<br />
Step 3 Select the General tab.<br />
15
<strong>LeCroy</strong> <strong>SATracer</strong>/<strong>Trainer</strong> Analyzer User’s <strong>Manual</strong> SW Version 4.6<br />
The following window displays the factory default settings such as<br />
“Snapshot” and 16 Mbytes buffer size are displayed. For your first<br />
recording, you can leave these settings unchanged.<br />
Step 4 Click on the Tool Bar. After 16 Mbyte of traffic is recorded, the<br />
<strong>SATracer</strong>/<strong>Trainer</strong> Analyzer uploads the data and displays the<br />
Frames.<br />
Stopping a Recording<br />
You can stop the recording process at any time by pressing .<br />
Afterwards, the trace will automatically upload from the analyzer to the PC.<br />
16
<strong>LeCroy</strong> <strong>SATracer</strong>/<strong>Trainer</strong> Analyzer User’s <strong>Manual</strong> SW Version 4.6<br />
Interrupting the Upload Process<br />
You can interrupt the upload process by pressing the Stop button.<br />
Pressing Stop will cause the following dialog box to open:<br />
This dialog presents options for stopping, continuing, or aborting the<br />
recording:<br />
• Select New Upload Range within the Recorded Buffer<br />
• Slide Bar - Adjust arrows at either end of the slide bar to<br />
select the range of buffer you want uploaded. The color<br />
in the slide bar indicates pre- and post-trigger traffic.<br />
• Full Buffer - Uploads entire buffer to the PC.<br />
• Upload Selection - Uploads whatever range you have<br />
selected via the slide bar.<br />
• Abort Upload?<br />
• Stop - Stops the recording and then displays the trace on<br />
screen.<br />
• Continue - Resumes the recording.<br />
• Flush - Cancels the recording without saving or<br />
displaying the trace.<br />
17
<strong>LeCroy</strong> <strong>SATracer</strong>/<strong>Trainer</strong> Analyzer User’s <strong>Manual</strong> SW Version 4.6<br />
Once you have interrupted an upload, a new button will appear on the<br />
toolbar: . This button ("Re-upload") opens a dialog box with a slide bar<br />
for re-selecting the range of the trace that you would like to upload.<br />
Saving the Trace<br />
When the recording session is finished, the bus traffic is uploaded to the PC<br />
and is automatically saved to the hard drive as a file named data.sata or the<br />
name you assign as the default filename.<br />
Step 1 To save a current recording for future reference, select<br />
Save As from the File menu.<br />
Step 2 Give the recording a unique name and save it to the appropriate<br />
directory.<br />
2.10 Probe Control Settings<br />
The probe control dialog provides several user adjustable settings for the<br />
probe performance. Modification of these settings occur in real-time and do<br />
not require cycling the power or uploading new firmware.<br />
If there’s more than one<br />
analyzer connected, the<br />
user will have an option to<br />
select Probe Control<br />
Settings for each device<br />
individually<br />
18
<strong>LeCroy</strong> <strong>SATracer</strong>/<strong>Trainer</strong> Analyzer User’s <strong>Manual</strong> SW Version 4.6<br />
The Port Settings and OOB Idle Sensitivity are only available when the<br />
SAS/SATA analyzer system is operating in Repeater mode.<br />
The Plug-in Mode options provide an additional control for the External<br />
Connector Module (SS004MAA) only. These controls will be disabled<br />
when attached to the Internal SATA-style module (SS002MAA) because<br />
this module operates in Repeater mode only.<br />
Break Link - Checking this box for a specific channel takes the link to<br />
electrical idle. It has the same effect as manually detaching a single<br />
connector from the device to "break the link". Unchecking the Break Link<br />
box for a specific channel brings the link up. It has the same effect as<br />
attaching a connector to a powered-on device.<br />
High Swing - Alters the repeaters differential output swing to accommodate<br />
for PCB / connector loss. By default, the repeater uses "Normal" swing.<br />
"High" swing may be required when tapping between long backplanes or<br />
extended cable distances:<br />
• Normal Swing: 440 mV min and 660 mV max (peak to peak)<br />
• High Swing: 800 mV min and 1200 mV max (peak to peak)<br />
OOB Idle Sensitivity - Alters the repeaters OOB detection behavior to<br />
accommodate for marginal OOB signal amplitude in SAS/SATA devices<br />
under test. The OOB idle sensitivity offers an adjustable threshold for<br />
detecting an inbound OOB sequence. If two PHYs fail to complete OOB,<br />
19
<strong>LeCroy</strong> <strong>SATracer</strong>/<strong>Trainer</strong> Analyzer User’s <strong>Manual</strong> SW Version 4.6<br />
users may find lowering the OOB idle sensitivity provides a mechanism for<br />
establishing the link even when the OOB signals from the DUT are<br />
marginal.<br />
• Normal - 100mV to 200mV<br />
• Decrease 30mV<br />
• Decrease 60mV<br />
20
<strong>LeCroy</strong> <strong>SATracer</strong>/<strong>Trainer</strong> Analyzer User’s <strong>Manual</strong> SW Version 4.6<br />
3. Software Overview<br />
The <strong>SATracer</strong>/<strong>Trainer</strong> is an application that may be used with or without<br />
hardware. When used without hardware, the program functions as a trace<br />
viewer to view, analyze, and print captured protocol traffic from other<br />
<strong>SATracer</strong> analyzers.<br />
3.1 Starting the <strong>SATracer</strong>/<strong>Trainer</strong> Program<br />
To start the <strong>SATracer</strong>/<strong>Trainer</strong> Program from the Start menu,<br />
Select Start > Programs > <strong>CATC</strong> > <strong>CATC</strong> <strong>SATracer</strong>.<br />
3.2 Opening Sample Traces<br />
A good way to gain familiarity with <strong>SATracer</strong> is to open some of the<br />
provided sample files and explore the menus, pop-up menus, and reports.<br />
3.3 Tool Tips<br />
Throughout the application, Tool Tips provide useful information about<br />
buttons on the toolbar.<br />
21
<strong>LeCroy</strong> <strong>SATracer</strong>/<strong>Trainer</strong> Analyzer User’s <strong>Manual</strong> SW Version 4.6<br />
To display a Tool Tip, position the mouse pointer over<br />
an item of interest such as part of the trace or a button.<br />
3.4 Trace Tool-Tips<br />
Many fields within the Trace will display tool-tips when the mouse pointer<br />
is suspended over them. These tips may provide a simple legend for the cell<br />
or may give substantial added details about the field.<br />
3.5 The Menu bar<br />
While some of the analyzer’s main display window options are familiar,<br />
many contain options specific to the analyzer program.<br />
Table 1: Main Display Pull-Down Menus<br />
Menu Function<br />
File<br />
New GenFile Creates a new (and empty) traffic generation file. To add text, click the<br />
Edit as Text button on the toolbar.<br />
Open… Opens a trace file or traffic generation file.<br />
Close Closes the current trace or generation file.<br />
Save As… Saves all or a specified range of Frames from the current file with a<br />
specified name.<br />
Print… Prints part or all of the current trace or traffic generation file.<br />
Print Preview Produces an on-screen preview before printing.<br />
Print Setup… Sets up your current or new printer.<br />
Edit Comment… Opens a dialog for entering a brief comment about the trace.<br />
Export>> Packets to Text (Packet View Format) - Saves all or part of a Trace<br />
to a text file. Useful for saving traces to floppy disk and for e-mailing.<br />
to Generator File Format ... - Creates a traffic generation file based<br />
on the open trace. This is a fast and easy way of creating a traffic<br />
generation file.<br />
to Packets to EAS Format ... - Creates an EAS file based on the open<br />
trace. Running this command opens a dialog prompting you for a file<br />
name, path, and a range of Frames to be exported.<br />
Convert>> Convert .stg to .ssg - Converts SATA traffic generation files created<br />
by <strong>SATracer</strong> (.stg) to the SASTracer generation format (.ssg).<br />
Exit Exits the <strong>SATracer</strong>/<strong>Trainer</strong> program.<br />
22
<strong>LeCroy</strong> <strong>SATracer</strong>/<strong>Trainer</strong> Analyzer User’s <strong>Manual</strong> SW Version 4.6<br />
Menu Function<br />
Setup<br />
Display Options… Opens a dialog for customizing trace colors, formats, and filters.<br />
Recording<br />
Options…<br />
Configures the analyzer’s recording behavior. Opens a dialog for<br />
selecting event triggers and filters, and for setting the size of the<br />
recording buffer and other recording options.<br />
Update BE/FW… Opens a dialog for updating the BusEngine and Firmware.<br />
Channel Settings Allows renaming of the channels - i.e. the establishment of aliases for<br />
each channel.<br />
Analyzer Network ... Opens a dialog box for browsing to local and networked analyzers.<br />
Within the dialog, click Add to browse. The dialog lists PCs that are<br />
on the LAN. If a PC has an analyzer attached to it, clicking Select<br />
establishes a connection.<br />
All Connected<br />
Devices ...<br />
Opens a dialog box with a list of analyzers connected to the host PC.<br />
Lets you select an analyzer and update the BusEngine, Firmware, and<br />
licensing information.<br />
Record<br />
Start Causes the Analyzer to begin recording.<br />
Stop Causes the Analyzer to stop recording.<br />
Generate<br />
Start Generation Starts traffic generation. This command requires that a traffic<br />
generation file (.ssg) be open.<br />
Stop Generation Stops traffic generation.<br />
Resume Generation Resumes traffic generation if generation has been stopped.<br />
Connect Link Establishes a link between SA<strong>Trainer</strong> and the DUT.<br />
Disconnect Link Breaks the link between SA<strong>Trainer</strong> and the DUT.<br />
Generation Options Opens a dialog for configuring traffic generation. The dialog looks like<br />
the Recording Rules dialog (Setup > Recording Options > Recording<br />
Rules). See Generation Options in the Traffic Generation chapter.<br />
Report<br />
File Information Displays information about the recording such as the number of Frames<br />
and triggering setup.<br />
Error Summary Summarizes the errors throughout the recording. Allows for fast<br />
navigation to errors.<br />
Timing Calculations Calculates timing between two Frames.<br />
Traffic Summary Summarizes the numbers and types of Primitives, Frames, SCSI<br />
Operations, and errors that occurred in the open Trace.<br />
Bus Utilization Displays graphs of various types of events that occurred in the open<br />
trace.<br />
Link Tracker » Opens a window for displaying a detailed chronological view of Bus<br />
activity on a Primitive-by-Primitive basis.<br />
Frame Tracker Opens a window for displaying a detailed chronological view of traffic<br />
on a Frame-by-Frame basis.<br />
23
<strong>LeCroy</strong> <strong>SATracer</strong>/<strong>Trainer</strong> Analyzer User’s <strong>Manual</strong> SW Version 4.6<br />
Menu Function<br />
Search<br />
Go to Trigger Positions the display to show the Trigger event.<br />
Go to Event... Positions the display to the indicated Packet, Frame, Primitive etc. The<br />
menu is context-sensitive and depends on the decode level that you are<br />
currently displaying.<br />
Go to Marker » Positions the display to the selected marked Frame.<br />
Go to » Enables quick searching for specific events using a cascade of pop-up<br />
windows.<br />
Find ... Allows searches by multiple criteria.<br />
Find Next Looks for the next instance of an event specified with Goto or Find.<br />
Search Direction Allows the search direction to be changed from forward to backwards<br />
or backwards to forward.<br />
View<br />
Toolbars Displays list of available Tool bars.<br />
Analyzer Chat Bar Opens a dialog that allows users to conduct chat sessions over an IP<br />
LAN. In order to send and receive electronic text messages, each user<br />
must be working with a PC that is on an IP LAN and also attached to an<br />
analyzer. .<br />
Status Bar Switches display of the Status Bar on or off.<br />
Zoom In Increases the size of the displayed elements.<br />
Zoom Out Decreases the size of the displayed elements.<br />
Wrap Wraps displayed Frames within the window.<br />
Link Layer Displays Link Layer traffic in the trace.<br />
Frame Layer Decodes and displays the Frame Layer.<br />
FIS Layer Decodes and displays FIS layer transactions.<br />
Command (ATA)<br />
Layer<br />
Decodes and displays ATA Application layer.<br />
Window<br />
New Window Switches display of the Tool bar on or off.<br />
Cascade Displays all open windows in an overlapping arrangement.<br />
Tile Displays all open windows as a series of strips across the display.<br />
Arrange Icons Arranges minimized windows at the bottom of the display.<br />
Windows ... Displays a list of open windows.<br />
Help<br />
Help Topics ... Opens online help.<br />
Update License ... Opens a dialog box for entering license key information for the<br />
analyzer.<br />
Display License<br />
Information ...<br />
Opens a dialog box with information about the current status of the<br />
analyzer's license<br />
About ... Displays version information about <strong>SATracer</strong>/<strong>Trainer</strong>.<br />
24
<strong>LeCroy</strong> <strong>SATracer</strong>/<strong>Trainer</strong> Analyzer User’s <strong>Manual</strong> SW Version 4.6<br />
3.6 The Toolbar<br />
The Tool Bar provides quick access to most of the <strong>SATracer</strong>/<strong>Trainer</strong><br />
software functions. You can learn the function of each button by passing the<br />
mouse pointer over them. Descriptions of the buttons appear on the status<br />
bar at the bottom of the window and as tooltips above each button.<br />
Open file Stop Recording<br />
Save As<br />
Preview Zoom In<br />
Print…<br />
Edit as text - opens a text editor for<br />
Zoom Out<br />
editing traffic generation files.<br />
Wrap<br />
Setup Record Options<br />
Setup Display Options<br />
Start Recording<br />
25<br />
Re-upload. This button appears in the<br />
toolbar if Stop is pressed during an<br />
upload. Causes analyzer to re-upload<br />
trace from analyzer buffer to the PC.<br />
Gives options for selecting which part of<br />
the trace you want uploaded.<br />
Find - Opens a dialog for conducting<br />
complex searches<br />
Find Next - repeats last Find or Go To<br />
operation<br />
Trace Panes. Allows multiple traces to be<br />
locked together and scrolled in tandem.<br />
This option only works with .mlt traces<br />
created by multi-analyzer cascades in a<br />
single recording session.
<strong>LeCroy</strong> <strong>SATracer</strong>/<strong>Trainer</strong> Analyzer User’s <strong>Manual</strong> SW Version 4.6<br />
Reports Buttons<br />
Decode Buttons<br />
Hide Buttons<br />
File Information Report. Opens a<br />
summary of the trace file including when<br />
it was made, the Recording Options used<br />
to create the file, and data on the analyzer<br />
that recorded the trace.<br />
Error Report. Opens the Traffic<br />
Summary window and displays a<br />
summary of errors in the trace.<br />
Timing and Bus Usage Calculations.<br />
Opens a calculator for measuring timing<br />
between Frames.<br />
Show Data Block. Opens a dialog for<br />
navigating to data blocks within Frames<br />
and Transactions. Once a data block is<br />
located, the window can display the data<br />
in a variety of formats.<br />
Decode & display Link Layer (Frames &<br />
Primitives)<br />
Decode & display FIS Layer<br />
Multi-segment Trace File Buttons<br />
These buttons become active if a multi-segmented trace file has been<br />
opened. Multi-segment traces are traces that have been recorded as a series<br />
of small segments rather than as a single, large recording. Multi-segmenting<br />
was developed to make it easier to work with large recordings where<br />
navigation can sometimes be difficult.<br />
Multi-segmenting is enabled in the General page of the Recording Options<br />
dialog.<br />
Multi-segmenting produces two kinds of files: segments and an index file<br />
that summarizes the recording and keeps tabs of the various segments.<br />
26<br />
Traffic Summary. Opens a window<br />
displaying a table summary of traffic<br />
recorded in the trace.<br />
Bus Utilization. Presents a graphical<br />
summary of traffic in the trace.<br />
Show Link Tracker. Opens window with<br />
detailed chronological view of traffic on a<br />
Primitive-by-Primitive basis.<br />
Show Frame Tracker. Opens window<br />
with detailed chronological view of traffic<br />
on a Frame-by-Frame basis.<br />
Open Auditor. Opens window that<br />
summarizes the trace in a spreadsheet-like<br />
format.<br />
Decode & display ATA Application layer<br />
(ATA commands)<br />
Hide Align and Notify Primitives Hide Initiator Channel 1<br />
Hide SATA Sync Cont Primitives Hide Target Channel 1<br />
Hide Unassociated traffic
<strong>LeCroy</strong> <strong>SATracer</strong>/<strong>Trainer</strong> Analyzer User’s <strong>Manual</strong> SW Version 4.6<br />
The buttons below allow multi-segmented traces to be navigated.<br />
Show first multisegment file Show next multisegment file<br />
Show previous multisegment file Show last multisegment file<br />
Show multisegment index file<br />
Traffic Generation Buttons<br />
These buttons become active if a traffic generation file (.ssg) is open.<br />
Start Traffic Generation. This button<br />
activates if a traffic generation file (.ssg)<br />
is open and an SA<strong>Trainer</strong> is attached.<br />
3.7 Pop-Up Menus<br />
Pop-up menus within the trace provide options for formatting the trace.<br />
Left Mouse Button - Opens a menu for expanding fields, viewing data<br />
fields, and formatting the trace.<br />
The menu is context-sensitive and changes depending on what part of the<br />
trace has been clicked.<br />
A menu similar to the following appears:<br />
• Data Field - Indicates the type of field that you selected. This<br />
field is context-sensitive.<br />
27<br />
Connect link. Establishes a link between<br />
SA<strong>Trainer</strong> and the DUT. When a<br />
Connect is built into the traffic generation<br />
script, this button will give status on the<br />
connection (it will depress when a connect<br />
occurs and undepress when disconnected.)<br />
Stop Traffic Generation. This button<br />
becomes active if a traffic generation is<br />
Disconnect link<br />
underway.<br />
Resume Traffic Generation. Generation Options. Opens a dialog for<br />
configuring traffic generation.
<strong>LeCroy</strong> <strong>SATracer</strong>/<strong>Trainer</strong> Analyzer User’s <strong>Manual</strong> SW Version 4.6<br />
• View Data Block - Allows raw data to be viewed from a data cell.<br />
• Expand Data/Collapse Data - Expands or collapses data field.<br />
Summarizes the amount of data displayed in the cell.<br />
• Expand All Data Fields - Expands any data fields that are<br />
currently collapsed.<br />
• Collapse All Data Fields - Collapses any data fields that are<br />
currently expanded.<br />
• Format - Presents options for changing the numerical formatting<br />
of the data fields throughout the trace.<br />
• Color - Presents options for changing the color of the data fields<br />
throughout the trace.<br />
• Hide - Hides data fields throughout the trace. To re-display<br />
hidden fields, right-click anywhere in the trace and select Unhide<br />
Cells and then one of the options from the sub-menu.<br />
Right Mouse Button - If you click a cell in the trace with<br />
the right mouse button, a pop-up menu appears and<br />
shows the options for zooming in or out, wrapping the<br />
display, and other formatting options.<br />
3.8 Status Bar<br />
The Status Bar is located at the bottom of the main display window.<br />
Depending on the current activity, the bar can be divided into as many as<br />
four segments.<br />
Recording Progress<br />
When you begin recording, the left-most segment of the Status Bar displays<br />
a recording Progress Indicator:<br />
As recording progresses, the Progress Indicator changes to reflect the<br />
recording progress graphically:<br />
• In the Progress Indicator, a black vertical line illustrates the<br />
location of the Trigger position you selected in Recording Options.<br />
28
<strong>LeCroy</strong> <strong>SATracer</strong>/<strong>Trainer</strong> Analyzer User’s <strong>Manual</strong> SW Version 4.6<br />
— Pre-Trigger progress is displayed in the field to the left of the<br />
Trigger Position.<br />
— When the Trigger position is reached, the progress indicator<br />
wiggles as it waits for the Trigger.<br />
— After the Trigger occurs, the field to the right of the Trigger<br />
fills in the post-Trigger color specified in the Display Options.<br />
— When recording is complete, the upper half of the progress<br />
indicator fills in white, indicating the progress of the data<br />
upload to the host computer.<br />
You should be aware of two exceptional conditions:<br />
• If a Trigger event occurs during the before-Trigger recording, the<br />
before-Trigger color changes to the after-Trigger color to indicate<br />
that not all the expected data was recorded pre-Trigger.<br />
• When you click Stop before or after a Trigger event, the Progress<br />
Bar adjusts to begin uploading the most recently recorded data.<br />
• If you wish to abort an upload that is in progress, click the Stop<br />
button again.<br />
The Progress Bar fills with color in proportion to the specified size and<br />
actual rate at which the hardware is writing and reading the recording<br />
memory. However, the progress indicator is normalized to fill the space<br />
within the Status Bar.<br />
Recording Status<br />
During recording, the current recording status is displayed in the next<br />
segment of the status bar. (Refer to previous screenshot for examples.)<br />
When recording is begun, one of the following messages flashes (depending<br />
on the selected Recording Options):<br />
• Trigger?<br />
• Triggered!<br />
• Uploading<br />
After recording stops, The following occurs:<br />
• Flashing message changes to Uploading data–x% done (x%<br />
indicates the percentage completion of the data uploading process).<br />
• Traffic data is copied to disk (overwriting any previous version of<br />
this file) using the default file name data.sata. You can also create<br />
a file name of your choice by specifying one in the Recording<br />
Options window.<br />
To abort the upload process, press the Stop button.<br />
29
<strong>LeCroy</strong> <strong>SATracer</strong>/<strong>Trainer</strong> Analyzer User’s <strong>Manual</strong> SW Version 4.6<br />
You are asked if you want to keep or discard the partially uploaded data.<br />
When the data is saved, the Recorded Data file appears in the main display<br />
window, and the Recording Status window is cleared.<br />
• If the recording resulted from a Trigger event, the first Frame<br />
following the Trigger (or the Frame that caused the Trigger) is<br />
initially positioned second from the top of the display.<br />
• If the recording did not result from a Trigger event, the display<br />
begins with the first Frame in the traffic file.<br />
Recording Activity<br />
During recording, the fourth segment from the left of the Status Bar displays<br />
Recording activity as a series of vertical bars.<br />
The more vertical bars that are displayed, the greater the amount of activity<br />
being recorded. If there are no vertical bars, there is no recorded activity.<br />
During uploading, the percent of the completed upload is displayed.<br />
Search Status<br />
The rightmost segment displays the current search direction: Fwd (forward)<br />
or Bwd (backward).<br />
3.9 Navigation Tools<br />
You can zoom in and out, and wrap the trace to fit within the screen by using<br />
the following buttons:<br />
Zoom In<br />
Increases the size of the displayed elements, allowing fewer (but larger)<br />
Frame fields per screen.<br />
Click on the Tool Bar.<br />
Zoom Out<br />
Decreases the size of the displayed elements, allowing more (but smaller)<br />
Frame fields per screen.<br />
Wrap<br />
Click on the Tool Bar.<br />
Adjusts the Trace View so that Frames fit onto the next line if they are<br />
longer than the size of the window. Without Wrap, you can use the<br />
horizontal scroll bar to see the hidden part of a Frame.<br />
30
<strong>LeCroy</strong> <strong>SATracer</strong>/<strong>Trainer</strong> Analyzer User’s <strong>Manual</strong> SW Version 4.6<br />
Click on the Tool Bar.<br />
Trace with Wrap turned off. In this example, the Time Stamp extends<br />
off the right edge of the screen.<br />
Trace with Wrap turned on. Entire Frame displays in window.<br />
3.10 Adding Comments to the Trace<br />
You can create, view, or edit the 100-character comment field associated<br />
with each Trace file.<br />
Step 1 From the File menu, select Edit Comment.<br />
The Edit Trace Comment Dialog window appears.<br />
Step 2 Create, view, or edit the comment.<br />
Step 3 Click OK.<br />
3.11 Set Marker<br />
The Set Marker feature allows Frames to be marked so they can be<br />
navigate back to events of interest. Markers also provide you with a way of<br />
tagging events so you can perform timing calculations between them.<br />
The Set Marker command works in conjunction with the Go to Marker<br />
feature. Once you have marked a Frame, you can navigate back to it by<br />
selecting Search > Go to Marker, and then selecting the marker of interest<br />
from the list.<br />
31
<strong>LeCroy</strong> <strong>SATracer</strong>/<strong>Trainer</strong> Analyzer User’s <strong>Manual</strong> SW Version 4.6<br />
To set a marker on a Frame, perform the following steps:<br />
Step 1 Click on Frame # for the Frame you wish to mark.<br />
Step 2 Select Set Marker.<br />
The Edit Market for Frame # comment window appears.<br />
Step 3 Enter your comment.<br />
Step 4 Click OK.<br />
A marked Frame is indicated by a vertical red bar along the left<br />
edge of the Frame # block:<br />
32
<strong>LeCroy</strong> <strong>SATracer</strong>/<strong>Trainer</strong> Analyzer User’s <strong>Manual</strong> SW Version 4.6<br />
3.12 Edit or Clear Marker<br />
To clear or edit comments associated with a Frame marker,<br />
Step 1 Click on Frame # for the chosen packet.<br />
Step 2 To edit the marker comment, select Edit Marker.<br />
The Edit Marker for Frame # comment window appears.<br />
Step 3 Edit the comment as desired.<br />
Step 4 Click OK.<br />
Step 5 To clear a marker, click Clear marker.<br />
The vertical red Marker bar disappears.<br />
33
<strong>LeCroy</strong> <strong>SATracer</strong>/<strong>Trainer</strong> Analyzer User’s <strong>Manual</strong> SW Version 4.6<br />
3.13 Timing Calculations on Markers<br />
Markers can be used as reference points to calculate timing between events.<br />
To perform a timing calculation, select Reports > Timing Calculations,<br />
and then click the Markers buttons to select the markers you want to use for<br />
the calculation. Afterwards, click Calculate to calculate the timing between<br />
the marked events.<br />
You can also calculate timing between markers by clicking the left mouse<br />
button on the first cell of a Frame in the trace window and selecting Time<br />
from Marker from the pop-up menu. The Timing Calculations dialog will<br />
open and prompt you to select a marker. Upon selecting a marker from the<br />
list, the calculation will be performed.<br />
34
<strong>LeCroy</strong> <strong>SATracer</strong>/<strong>Trainer</strong> Analyzer User’s <strong>Manual</strong> SW Version 4.6<br />
4. Recording Options<br />
The Recording Options dialog box presents options for configuring a<br />
recording. The dialog box has four pages of options: General, Channel<br />
Settings, Recording Rules, and Channels.<br />
From the Setup menu, select Recording Options.<br />
Recording Options window appears, displaying the General tab.<br />
35
<strong>LeCroy</strong> <strong>SATracer</strong>/<strong>Trainer</strong> Analyzer User’s <strong>Manual</strong> SW Version 4.6<br />
4.1 General Recording Options<br />
The General page presents options for setting the buffer size, recording type,<br />
and the Trace filename and path.<br />
Two sets of Recording Type options are presented: Recording Scope and<br />
Recording Type.<br />
Recording Type<br />
The Recording Type box presents three options that control how<br />
<strong>SATracer</strong>/<strong>Trainer</strong> begins and ends a recording. The options are Snapshot,<br />
<strong>Manual</strong> Trigger, and Event Trigger.<br />
• Snapshot: A Fixed-length recording. A Snapshot is a recording<br />
whose size is set via the "Buffer Size" box. Recording begins when<br />
the Start Recording button is clicked and ends when either the<br />
selected buffer size is filled or the Stop Recording button is<br />
pressed.<br />
• <strong>Manual</strong> Trigger: A recording whose ending is triggered by<br />
pressing the Trigger button on the front panel.<br />
Recording begins when the Record button is pressed on the<br />
Tool Bar. Recording continues in a circular manner within the<br />
limits set by the buffer size. Recording ends following depression<br />
of the Trigger button on the front panel. Once the Trigger button<br />
has been pressed, recording continues until the post-trigger buffer<br />
has been filled or the Stop button is clicked on the Tool Bar.<br />
• Event Trigger: A recording whose ending is triggered by<br />
user-defined events. Recording begins when the Record button<br />
is clicked on the Tool Bar. Recording continues in a circular<br />
manner within the limits set by the buffer size until a trigger event<br />
is detected and the defined amount of data has been recorded after<br />
the Trigger event.<br />
Options<br />
The options checkboxes appear on the upper right side of the General tab of<br />
the Recording Options window.<br />
• Truncate Data Payload Dwords: Allows data payloads to be<br />
truncated to whatever length is specified in the box. Truncating the<br />
payload preserves recording buffer, thereby increasing the amount<br />
of traffic that can be recorded.<br />
36
<strong>LeCroy</strong> <strong>SATracer</strong>/<strong>Trainer</strong> Analyzer User’s <strong>Manual</strong> SW Version 4.6<br />
• Beep When Trigger Occurs: When this checkbox is selected, the<br />
computer connected to the <strong>SATracer</strong>/<strong>Trainer</strong> beeps three times<br />
when a Trigger condition is first detected.<br />
Recording Scope<br />
Recording Scope presents two important options that affect the size or scope<br />
of the recording. These options are Spooled and Conventional recordings.<br />
The Spooled option enables very large recordings - for example, several<br />
hours. The Conventional option is used for smaller recordings - for<br />
example, several minutes.<br />
Conventional Single Buffer Recording<br />
In a Conventional recording, the entire trace is recorded and stored in the<br />
analyzer buffer before it is uploaded to the host PC. Recordings are thus<br />
limited in size to the size of the analyzer buffer - or 2 GB. If you are<br />
planning to create a moderate-sized recording, this is a good option to select.<br />
You set the buffer size and the trigger position, then begin the recording.<br />
The analyzer’s buffer fills, then the traffic is uploaded to the host PC.<br />
If you are planning to create a large recording or are planning to let the<br />
analyzer run over a several days, then select Spooled Recording. In a<br />
Spooled Recording, traffic is uploaded periodically to the host PC - thus<br />
freeing analyzer buffer and allowing the recording to continue.<br />
Buffer Size - The Buffer Size slide bar adjusts<br />
the recording buffer size from 1.6 megabytes to<br />
2048 MB. This option is used for setting the<br />
memory for a Conventional recording.<br />
The Recording Type option determines how<br />
this buffer is used. Although there are 2048 MB of physical memory in the<br />
Analyzer, the efficiency of the recording ranges from 2:1 to 4:1 ratios of<br />
physical memory to actual SATA traffic. Shorter Frames yield a less<br />
efficient recording. The non-traffic portion of physical memory is utilized<br />
for control and timing information.<br />
Note The scale is not linear and affords more granularity in the smaller<br />
buffer sizes.<br />
Trigger Position - The Trigger Position<br />
slide bar sets the amount of pre- and<br />
post-trigger recording in a Conventional<br />
recording. It also allows adjustment of the<br />
location of the trigger within the defined<br />
37
<strong>LeCroy</strong> <strong>SATracer</strong>/<strong>Trainer</strong> Analyzer User’s <strong>Manual</strong> SW Version 4.6<br />
buffer. You can adjust the Triggering Position between 1 and 99%<br />
post-Trigger. Trigger Position is available only when <strong>Manual</strong> Trigger or<br />
Event Trigger is selected as Recording type.<br />
As an example, if the buffer size is set to 16MB, then for the following<br />
Trigger Position settings, the amount of pre- and post-Trigger data is<br />
• 95% post-triggering: 0.8MB pre-trigger, 15.2MB post-trigger<br />
• 75% post-triggering: 4MB pre-trigger, 12MB post-trigger<br />
• 50% post-triggering: 8MB pre-trigger, 8MB post-trigger<br />
• 25% post-triggering: 12MB pre-trigger, 4MB post-trigger<br />
• 5% post-triggering: 15.2MB pre-trigger, 0.8MB post-trigger<br />
Note When a Trigger occurs, recording continues until the post-Trigger<br />
amount of the buffer is filled.<br />
Note The buffer is limited to 1 GB when in trainer mode/configuration.<br />
Save As Multisegment Trace<br />
This option causes the<br />
analyzer to segment the<br />
trace into multiple files and create an index file called data.mlt that<br />
summarizes the starting and finishing frame for each segment.<br />
This option is useful for very large recordings and for host PCs with limited<br />
memory. In the latter case, multi-segmenting gives a PC with limited<br />
memory a way to open recordings that would otherwise be too large to open.<br />
The only downside to multi-segmenting is that limits the scope of reports<br />
such as Traffic Summary, Bus Utilization, and Error Summary to each of<br />
the segments. You will not be able to perform summary statistics on the full<br />
recording.<br />
The default value for this option is 64 MB. Before attempting large<br />
recordings, it is recommended that you play with this number to see what<br />
value best suits your needs.<br />
To create a multisegmented trace,<br />
Step 1 Check the box marked Save As Multisegmented Trace.<br />
Step 2 Set the file size for each segment in the box marked MB Segments.<br />
38
<strong>LeCroy</strong> <strong>SATracer</strong>/<strong>Trainer</strong> Analyzer User’s <strong>Manual</strong> SW Version 4.6<br />
File Structure for Segmented Files<br />
Multisegmenting produces an index file and segmented trace files. The<br />
default name of the index file is dataXYZ.smt, where XYZ is the last three<br />
digits of the analyzer’s serial number. (You can see the unit’s serial number<br />
by selecting Help > About <strong>SATracer</strong>.) Thus, for example, if you had an<br />
analyzer with the serial number 111, the index file would be called<br />
data111.smt.<br />
The index file and the segmented trace files are stored in a directory named<br />
after the index file. The directory is named indexfilename_smt_files. For<br />
example, if the index file is named data111.smt, the directory will be named<br />
data111_smt_files. Below this directory additional, sequentially numbered<br />
sub-directories (up to 100,000) that house the segmented trace files. These<br />
sub-directories bear simple numerical names: 00000 - 00999. Each of these<br />
subdirectories can hold up to 100 sequentially-numbered segment files.<br />
Collectively, the entire directory structure can hold up to 10 million files.<br />
Example<br />
A 1010 MB recording using 10 MB segments and the default file names will<br />
create the following sub-directories and files. The example below uses the<br />
serial number 111:<br />
• data111.smt This is the index file.<br />
• data111_smt_files\00000\segment_00000.sata<br />
• data111_smt_files\00000\segment_00001.sata<br />
...<br />
• data111_smt_files\00000\segment_00099.sata<br />
• data111_smt_files\00001\segment_00100.sata<br />
• data111_smt_files\00001\segment_00101.sata<br />
The index file looks something like a trace file but contains packet-like<br />
entities that summarize each 10 MB segment.<br />
39
<strong>LeCroy</strong> <strong>SATracer</strong>/<strong>Trainer</strong> Analyzer User’s <strong>Manual</strong> SW Version 4.6<br />
When uploading is complete, the index file will be opened. Each "packet"<br />
in this file corresponds to one of the numbered segments. Double clicking<br />
on the packet will open the corresponding segment file.<br />
Multisegement Toolbar<br />
When an index file is opened like the one shown above,<br />
the Multisegment Toolbar will display. This toolbar lets you navigate the<br />
index file.<br />
Open first segment in<br />
multisegment trace.<br />
Open previous segment<br />
in multisegment trace.<br />
Open index file. This<br />
button becomes active if<br />
a multisegment trace file<br />
is open.<br />
Open next segment in<br />
multisegment trace.<br />
Open last segment in<br />
multisegment trace.<br />
Spooled Recording<br />
In a Spooled recording, uploading commences when the recording is begun.<br />
As traffic is uploaded from the analyzer to the host PC, the analyzer memory<br />
is freed - creating space for recording additional traffic. Recording can thus<br />
continue for long periods of time, and create file lengths well in excess of 2<br />
GBs.<br />
Recording Size<br />
With Spooled Recordings, you are given the option of setting the recording<br />
length based on time or on the recording size.<br />
Record for - Enter the duration of the recording in days, hours, minutes,<br />
and seconds.<br />
Record - Enter the amount of traffic (in MB) that you want the analyzer to<br />
record. Selecting this option will create a fixed length recording that begins<br />
as soon as you click the REC button on the menu bar.<br />
Until Triggered, plus - Enter the amount of traffic (in time) that you want<br />
the analyzer to record following an event trigger. Recording time units are<br />
days, hours, minutes, and seconds.<br />
40
<strong>LeCroy</strong> <strong>SATracer</strong>/<strong>Trainer</strong> Analyzer User’s <strong>Manual</strong> SW Version 4.6<br />
Until Triggered, plus - Enter the amount of traffic (in MB) that you want<br />
the analyzer to record following an event trigger. You select event triggers<br />
in the Recording Rules page -- see Section 4.3, “Recording Rules” on<br />
page 43 for details.<br />
Spooled Recordings - Performance Issues<br />
During a spooled recording if the analyzer buffer fills faster than the trace<br />
can be uploaded to the host PC, the analyzer will briefly suspend recording<br />
until some of the buffer is free. When recording is suspended, gaps will<br />
appear in the trace. These gaps will appear as entries in the trace.<br />
During the recording, you can see if gaps are likely to happen by reading the<br />
status bar at the bottom of the screen.<br />
The Status bar has two fields that you can use to determine if gaps are<br />
occurring or are about to occur. These fields are:<br />
• gaps - Shows how many gaps have occurred.<br />
• Hardware Buffer - shows you how full the analyzer buffer is and<br />
if the analyzer is currently dropping packets. In the example<br />
above, Hardware Buffer field shows that the buffer is full (shown<br />
by the thick green graph) and that the analyzer is currently<br />
dropping packets (shown by thin red line atop of the green graph.)<br />
Preventing Gaps<br />
Gaps can be caused by a number of factors - the number of channels being<br />
recorded, the absence of filtering, the performance of the host PC (for<br />
example, is it using USB 2.0 to upload traffic?), and the amount of traffic<br />
produced by the devices under test.<br />
There are several ways to prevent gaps. You will need to experiment with<br />
your setup to determine what works best for you. You might try filtering<br />
out Aligns and Syncs and turning on data truncation (for example, to 10<br />
Dwords).<br />
41
<strong>LeCroy</strong> <strong>SATracer</strong>/<strong>Trainer</strong> Analyzer User’s <strong>Manual</strong> SW Version 4.6<br />
4.2 Channel Settings<br />
The Channel Settings page lets you to set speed, descrambling, and packing<br />
options for each channel. It also lets you inhibit channel recording.<br />
Speed Settings<br />
Speed Settings provides options for designating the recording speed for<br />
each link. You can manually set the link speed or let the analyzer<br />
auto-negotiate the speed.<br />
The <strong>SATracer</strong> system is designed to pass through the speed negotiation<br />
signaling allowing the initiator and device to determine the link speed using<br />
the method defined in the SATA specification. However, if the negotiated<br />
link speed is higher or lower than the speed selected in this tab, <strong>SATracer</strong><br />
will not decode the traffic properly (there will be errors in the trace). If an<br />
initiator and target are successfully negotiating <strong>3G</strong>bps transmission rate,<br />
choose the <strong>3G</strong>bps Speed Selection in this tab. The user will know if devices<br />
are negotiating successfully by getting clean recordings.<br />
Channel Settings<br />
These options allow you to inhibit recording and turn off scrambling and<br />
packing on a channel by channel basis.<br />
42
<strong>LeCroy</strong> <strong>SATracer</strong>/<strong>Trainer</strong> Analyzer User’s <strong>Manual</strong> SW Version 4.6<br />
Inhibit - Inhibits recording of traffic from selected channels. For example,<br />
if you check the option for T1, it means "record all channels except for<br />
Target channel 1 (T1)."<br />
No Descrambling - Turns off the analyzer’s descrambling from the selected<br />
channels. Select this option if your DUTs are not scrambling their traffic.<br />
No Packing - Turns off primitive and idle packing from the selected<br />
channels.<br />
4.3 Recording Rules<br />
The Recording Rules page lets you set triggers and filters. The page divides<br />
into following areas:<br />
• Toolbar - Contains buttons that control the Recording Rules page.<br />
• Available Events area -- Part of the screen where you can park<br />
buttons that you intend to use in the Global State Cell.<br />
• Global State Cell -- Part of the screen where you create trigger and<br />
filter conditions. You create conditions by dragging event buttons<br />
from the Available Events Area into the Global State Cell and then<br />
assign actions to the event buttons.<br />
• Sequence Cell -- The inactive cell marked by the faint text Drag an<br />
event here to add a new sequence. Once an event button is placed<br />
in this cell, the cell becomes active. The Sequence Cell is used to<br />
create event sequences - chains of events leading to an action: If x<br />
followed by y followed by z occurs, trigger. Event Sequences are<br />
43
<strong>LeCroy</strong> <strong>SATracer</strong>/<strong>Trainer</strong> Analyzer User’s <strong>Manual</strong> SW Version 4.6<br />
created by assigning the action Advance the Sequence to the links in<br />
the chain and trigger (or some other action) to the final event.<br />
• Rule Status Indicator - An indicator that shows the validity status<br />
of the current set of recording rules. When the rules are correct, the<br />
indicator will display the text Config is valid. When incorrect, the<br />
indicator will turn red and display the text Config is Invalid.<br />
• Pop Up Menus (not shown) - Right-clicking on button or area in<br />
the Recording Rules page will access a context-sensitive pop-up<br />
menu containing most of the commands listed in the toolbar.<br />
4.4 Recording Rules Toolbar<br />
The Recording Rules toolbar exposes functionality for controlling the<br />
Recording Rules page.<br />
New Event. Opens a menu of events. Selecting an event<br />
causes an event button to appear in the Available Events area.<br />
Delete Event. Deletes selected event button.<br />
Undo. Undoes last change made to Recording Rules page.<br />
The undo buffer has unlimited depth.<br />
Redo. Repeats changes undone by the Undo button.<br />
Zoom In. Enlarges the display. There are five zoom levels.<br />
The default level is the middle one. If you have a wheel<br />
mouse, you can also zoom by holding down the Control key<br />
and then operating the mouse wheel.<br />
Zoom Out. Makes the display appear smaller.<br />
Show/Hide channels. When pressed, this button tells the<br />
Recording Rules dialog to show the channel buttons on the<br />
Events icons. When unpressed, the channels are hidden.<br />
Show/Hide Properties Dialog. Shows or hides the Properties<br />
dialog of the selected State/Event/Action.<br />
Config is valid. This message displays when the current<br />
Recording Rules configuration is valid and can be executed by<br />
the hardware. This message gets updated every time the<br />
Recording Rules configuration changes. When the<br />
configuration is incorrect, the message is replaced by "Config<br />
is incorrect."<br />
Config is invalid. This message displays when the current<br />
Recording Rules configuration exceeds hardware limitations.<br />
You can click the indicator to get the diagnostics message box<br />
to find the problem.<br />
44
<strong>LeCroy</strong> <strong>SATracer</strong>/<strong>Trainer</strong> Analyzer User’s <strong>Manual</strong> SW Version 4.6<br />
4.5 Recording Rules Page - How it Works<br />
The Recording Rules page can be thought of as a chalk board where you<br />
create a graphical model of the events and actions. In essence, you are<br />
creating a visual representation of the rules that the analyzer should follow<br />
during a recording.<br />
You can create simple or complex rules.<br />
Creating a rule involves three steps:<br />
Step 1 Select one or more events.<br />
Step 2 Select the channels that the analyzer should record.<br />
Step 3 Assign an actions to the events.<br />
Selecting Events<br />
Events are selected from the New Event menu:<br />
Step 1 Click the New Event button.<br />
A menu of Events and Event categories<br />
displays.<br />
Step 2 Select an Event from the menu. Once a<br />
selection has been made, an Event button<br />
appears in the Available Events area. The<br />
Available Events area is an inactive part of the<br />
window where buttons can be parked for future<br />
use.<br />
Selecting a Channel on an Event Button<br />
At the bottom of each event button are small buttons that represent analyzer<br />
channels. Selecting a channel button tells the analyzer which channels to<br />
monitor for trigger and filter events.<br />
Note that deselecting a channel button does not stop the<br />
recording on that channel - it merely disables actions<br />
such as triggers on the channel. Thus, if you had set the<br />
analyzer to trigger on an error but had deselected channel<br />
T1, the analyzer would record traffic on all channels (including T1) but<br />
would ignore any error that occurred on channel T1.<br />
To turn off recording for individual channels, use Inhibit Recording option<br />
in the Recording Options > Channel Settings page. This option will prevent<br />
traffic from being recorded into the trace.<br />
45
<strong>LeCroy</strong> <strong>SATracer</strong>/<strong>Trainer</strong> Analyzer User’s <strong>Manual</strong> SW Version 4.6<br />
4.6 Assigning an Action<br />
Assigning an action tells the analyzer what to do when it has found the<br />
targeted event. If you do not assign an action, the analyzer will look for the<br />
event but do nothing once the event has been encountered.<br />
Assigning an action is a two-step process: first, move an Event button from<br />
the Available Events area on the left to one of the two cells in the center of<br />
the window. Then, right-click on the Event button and assign an action.<br />
Dragging a Button to the Global State or Sequence Cell<br />
The center of the Recording<br />
Rules window is where rules<br />
are defined. To create a rule,<br />
you must drag an Event button<br />
from the Available Events<br />
area on the left to one of the<br />
two cells in the center of the Recording Rules window. The cells in the<br />
center control the duration of the rule: rules created with the Global State<br />
Cell are always enabled, while rules created in the Sequence cell are<br />
conditionally enabled.<br />
The Global State Cell - The Global State<br />
Cell tells the analyzer what events to look for<br />
throughout the entire recording. The cell is<br />
called a "Global State" because the<br />
conditions you define in the cell are always<br />
active. You can place several events in this<br />
cell. Doing so tells the analyzer to look for<br />
all of the events all of the time. For example,<br />
you could place three events in this cell and<br />
have each cause a trigger. Such a<br />
configuration would read "If any of the events occur, trigger."<br />
Sequence Cell - Sequence cells are marked with the faint text Drag to add<br />
a new sequence.<br />
The Sequence Cell is used to<br />
create event sequences. An<br />
event sequence is a chain of<br />
events leading to some action.<br />
For example, "If x is followed<br />
by y and then by z, trigger."<br />
Events linked in a chain are<br />
To activate an Event button, drag it to the<br />
Global State Cell.<br />
46<br />
This configuration reads<br />
"trigger if any of these events<br />
occur."<br />
An event sequence. This reads "If a primitive<br />
is followed by an error, then trigger."
<strong>LeCroy</strong> <strong>SATracer</strong>/<strong>Trainer</strong> Analyzer User’s <strong>Manual</strong> SW Version 4.6<br />
looked at sequentially. Thus, at any given time, the analyzer is often only<br />
be looking for a single event out of the several that might be in the Sequence<br />
cell.<br />
There can be up to 255 events linked together into a sequence. Only one<br />
sequence can be created.<br />
When two or more events have been moved into a Sequence cell, they can<br />
be linked into a sequence by assigning the action Advance the sequence to<br />
events in the chain. The last event in a sequence is then usually assigned the<br />
action Trigger.<br />
There are two ways to assign an action to an event button:<br />
• Right-click on an event button and select Specify Action from<br />
the pop-up menu.<br />
• Double-click on the event button and then select an action from<br />
the Properties dialog box.<br />
Assigning an Action from the Pop-up Menu<br />
To assign an action to an event button via the pop-up menu,<br />
Step 1 Right-click on the button. A pop-up menu appears:<br />
Step 2 Select Specify Action and then an action from the sub-menu. The<br />
menu closes and the action is assigned.<br />
47
<strong>LeCroy</strong> <strong>SATracer</strong>/<strong>Trainer</strong> Analyzer User’s <strong>Manual</strong> SW Version 4.6<br />
Assigning an Action via the Properties Dialog Box<br />
Step 1 You can also assign actions to event buttons via the<br />
Properties dialog box. Double-click on an event button to<br />
open the properties dialog box.<br />
Step 2 Select the Actions tab.<br />
Step 3 Assign an action.<br />
See See Section 4.9 "Types of Properties Dialog Boxes" on page 51<br />
for further details on Properties dialog boxes.<br />
4.7 Types of Pop-up Menus<br />
The pop-up menu are context-sensitive and will display different options<br />
depending on the object you have clicked.<br />
Global State Cell and Sequence Cell Pop-up<br />
Menus<br />
If you click on the Global State Cell or<br />
Sequence Cell (but not one of the buttons<br />
inside them), you will get the following<br />
pop-up menu:<br />
New Event - Brings up a menu of Event types. This is the same menu that<br />
appears when you click the New Event button on the toolbar.<br />
Properties - Brings up the State Properties dialog for the selected state.<br />
Event Pop-up Menu<br />
If you click on an Event button, you will get the<br />
following pop-up menu:<br />
Specify Action(s) - opens a sub-menu with the<br />
following options:<br />
48
<strong>LeCroy</strong> <strong>SATracer</strong>/<strong>Trainer</strong> Analyzer User’s <strong>Manual</strong> SW Version 4.6<br />
• Trigger - Triggers end of recording. Recording continues until<br />
post-trigger buffer is expended. Buffer settings are controlled by the<br />
Recording Options - General page.<br />
• Filter Out - Excludes selected traffic from recording. Filtering<br />
preserves recording memory, thereby extending recording sessions and<br />
excluding events of little interest.<br />
• Advance the Sequence - Appears only in Sequence Cells and is used to<br />
create event sequences. Tells the analyzer to look for the next event in<br />
the sequence.<br />
• Filter In - Includes selected traffic in recording.<br />
• External Trigger Pulse HIGH - Sends an output signal with a Pulse<br />
High format through the output ports on the back of the UPAS. Pulse<br />
High is the default format. Pulse High causes the analyzer to transmit a<br />
5 volt, 40 nanosecond signal.<br />
• External Trigger Pulse LOW - Sends an output signal with a Pulse<br />
Low format through the output ports on the back of the UPAS. Pulse<br />
Low causes the analyzer to transmit a 0 volt, 40 nanosecond signal.<br />
• External Trigger Pulse TOGGLE -This format causes the analyzer to<br />
transmit a signal that will toggle with each trigger event between a<br />
continuous 5 volt signal and a continuous 0 volt signal.<br />
Add Counter - Displays the Event Properties dialog with the Counter<br />
selected and ready to accept the count value. The menu item is not shown<br />
if the counter is not applicable to the selected event. If the counter is already<br />
specified this menu item is replaced with Don’t Use Counter and Change<br />
Counter Value.<br />
Move Event To - Moves selected event to a different position in the<br />
Recording Rules window.<br />
Copy Event To - Copies selected event to a different position in the<br />
Recording Rules window.<br />
Delete this Event - Deletes the selected Event. Alternatively, you can use<br />
the Delete button on the toolbar or keyboard to delete events.<br />
Properties - Opens a dialog box and lets you specify further sub-types (for<br />
example, types of errors) and additional conditions for the selected event.<br />
Action Pop-up Menu<br />
If you click on an Action button, you will get the following pop-up menu:<br />
Trigger - Sets or clears Trigger action.<br />
49
<strong>LeCroy</strong> <strong>SATracer</strong>/<strong>Trainer</strong> Analyzer User’s <strong>Manual</strong> SW Version 4.6<br />
Filter In - Sets or clears Filter In action. This<br />
option precludes the use of Filter Out.<br />
Filter Out - Sets or clears the Filter Out action.<br />
This option precludes the use of Filter In.<br />
Restart All - Restarts any<br />
sequences or counts you may have<br />
set on other buttons. The example<br />
on the right illustrates how the<br />
Restart All action works. This<br />
example reads "Look for a<br />
sequence of five Bus Conditions<br />
and then trigger. If, however, an<br />
Error occurs any time before the<br />
fifth Bus Condition has occurred,<br />
restart the count".<br />
50<br />
Global State Cell.<br />
Action menu for event in<br />
Actions menu for event in<br />
Sequence cell.<br />
Restart example. In this configuration,<br />
<strong>SATracer</strong> will restart its search for a<br />
sequence of 5 Bus Conditions if an error<br />
encountered.<br />
Second restart example. In this<br />
configuration, <strong>SATracer</strong> will restart<br />
its search for the above sequence of<br />
events if a Bus Condition is found.
<strong>LeCroy</strong> <strong>SATracer</strong>/<strong>Trainer</strong> Analyzer User’s <strong>Manual</strong> SW Version 4.6<br />
External Trigger Pulse HIGH, Pulse LOW, Pulse TOGGLE - Causes<br />
the event send an external signal out through the External Out port on the<br />
back of the UPAS. The shape of the signal (Pulse HIGH, Pulse LOW or<br />
Pulse TOGGLE) must be the same for all events sending out such signal.<br />
This means that if you change the output signal for one event, it will<br />
automatically change the signal for all other events sending output signals.<br />
Properties - Displays the Action Properties dialog for the selected state.<br />
4.8 New Events Menu<br />
To add new Event buttons to the Available Events<br />
area, click the New Events button. A menu opens<br />
with the following categories:<br />
• Primitives<br />
• FIS<br />
• ATA Commands<br />
• Data Pattern<br />
• Bus Conditions and OOB Signals<br />
• Errors<br />
• Breakout Board Data<br />
• Timer<br />
4.9 Types of Properties Dialog Boxes<br />
Each cell and button has a properties dialog box that allows refinement of<br />
the options being set.<br />
Properties dialog boxes can be opened by:<br />
• Double-clicking a button or cell.<br />
• Right-clicking a button and selecting Properties from the pop-up<br />
menu.<br />
• Clicking the Properties button on the toolbar.<br />
Properties dialog boxes exist for all items in the Recording Rules page: the<br />
event buttons, action buttons, Global State cell and Sequence cells.<br />
51
<strong>LeCroy</strong> <strong>SATracer</strong>/<strong>Trainer</strong> Analyzer User’s <strong>Manual</strong> SW Version 4.6<br />
Properties Dialog Box - General Features<br />
Properties Dialog boxes share several features: an Icon preview, a Label<br />
Icon, Channel Settings, Negation, Counter, a Pin button, and a Descriptive<br />
String.<br />
Icon Preview - The Icon Preview shows what the button currently looks<br />
like. If you make changes to the Channel settings or the Icon Label, these<br />
changes will immediately display in the Preview.<br />
Icon Label - A text box for labeling the button. Whatever is typed here will<br />
appear on the button.<br />
Channels - These controls allow you to select the channel(s) that the<br />
analyzer should search when it is looking for the event.<br />
Counter - A counter tells the analyzer to search for x instances of the<br />
selected event. For example, if you enter "10," the analyzer will count 10<br />
instances of the selected event before it performs whatever action you<br />
assign. There are only two counts available in the hardware so if you try to<br />
assign more than two, you will get a warning.<br />
Note Counters can not be applied to events with Filter Actions. The<br />
maximum counter value is 65,535.<br />
Negation - Tells the hardware to match the opposite of the event. For<br />
example, if you select NOT for Errors Event, the match will occur on Error<br />
types that are not checked. If you select NOT for a SCSI command, the<br />
match will occur on any FCP_CMND except for the selected one, and also<br />
on the selected one if the additional parameters do not match.<br />
Pin Button - Allows you to "pin" the Properties dialog box to the<br />
application so that it does not go away when another object appears such as<br />
an event, state or action.<br />
52
<strong>LeCroy</strong> <strong>SATracer</strong>/<strong>Trainer</strong> Analyzer User’s <strong>Manual</strong> SW Version 4.6<br />
Description String - This area contains a textual description of the event.<br />
Specific Event Settings - The largest part of the Event Properties dialog<br />
box. By selecting one or more events from the list, you narrow the range of<br />
events that the analyzer searches for.<br />
The options presented in this area vary depending on the selected event.<br />
There are three basic formats:<br />
• Checkboxes<br />
• List<br />
• Pattern Editor<br />
Checkboxes and Lists present options for you to select from. Selecting one<br />
or more option tells the analyzer which event(s) the analyzer should search<br />
for. Examples are shown below:<br />
The Pattern Editor, on the other hand, presents a series of text boxes in<br />
which you can enter a data pattern that the analyzer should search for.<br />
53
<strong>LeCroy</strong> <strong>SATracer</strong>/<strong>Trainer</strong> Analyzer User’s <strong>Manual</strong> SW Version 4.6<br />
The Pattern Editor has two components: the text boxes themselves, in<br />
which a pattern can be entered, and pull-down menus. Pull-down menus are<br />
recognizable by the color of the field headings. If the field heading is blue,<br />
it is a menu. Click it to see the contents.<br />
Actions Tab - The Actions tab opens a page of options for setting triggers<br />
and other actions on the selected events.<br />
4.10 Event Properties Dialog Boxes - Descriptions<br />
Each event button has a Properties dialog box opens with options for further<br />
specifying the type of event that the analyzer should look for. Selecting an<br />
option narrows the search pattern to the selected event.<br />
To open a Properties dialog box for an event button, double click it.<br />
54
<strong>LeCroy</strong> <strong>SATracer</strong>/<strong>Trainer</strong> Analyzer User’s <strong>Manual</strong> SW Version 4.6<br />
Properties dialog boxes have two pages of options: one listing event<br />
sub-categories, and the other listing actions. Below is an example.<br />
There are properties dialog boxes for each of the event categories listed in<br />
the New Events menu. Each dialog is described in this section.<br />
Category Event<br />
Primitives Primitive Categories<br />
Primitives<br />
FIS Register Host to Device<br />
Register Device to Host<br />
Set Device Bits<br />
DMA Activate<br />
BIST Activate<br />
PIO Setup<br />
Data<br />
Route<br />
Vend FIS: 0xFF<br />
ATA Commands<br />
Data Pattern<br />
Bus Conditions and OOB Signals<br />
55
<strong>LeCroy</strong> <strong>SATracer</strong>/<strong>Trainer</strong> Analyzer User’s <strong>Manual</strong> SW Version 4.6<br />
The descriptions below follow the order of events listed in the table above.<br />
PRIMITIVES<br />
Category Event<br />
Errors<br />
Breakout Board Data<br />
Timer<br />
There are two types of primitive events: Primitive Categories and<br />
Primitives.<br />
Primitive Categories Properties Dialog<br />
Presents options for triggering or filtering on various Primitive categories.<br />
If NOT is checked, any unchecked primitive category will generate an event<br />
match.<br />
56
<strong>LeCroy</strong> <strong>SATracer</strong>/<strong>Trainer</strong> Analyzer User’s <strong>Manual</strong> SW Version 4.6<br />
Primitives Properties Dialog<br />
FIS<br />
Presents a menu of Primitive types. Selecting a Primitive from the list<br />
narrows the analyzer’s search to just the selected Primitive. Afterwards, a<br />
trigger or filter can be set on the selection. If NOT is checked, any<br />
unchecked primitive will generate an event match.<br />
There are ten SATA FISs that can be selected from the New Events menu:<br />
Register Host to Device, Register Device to Host, Set Device Bits, DMA<br />
Setup, BIST Activate, PIO Setup, Data, Route, and Vend FIS: 0xFF.<br />
The Properties dialogs for these FISs are similar to one another. They<br />
display data fields for entering data patterns on a bit-by-bit basis. Entering<br />
a data pattern tells the analyzer to search for the specified pattern. If NOT<br />
is checked, any pattern other than the one specified will generate an event<br />
match. The FIS Types properties dialog presents options for triggering or<br />
filtering on several different FIS categories. An example (Register Host to<br />
57
<strong>LeCroy</strong> <strong>SATracer</strong>/<strong>Trainer</strong> Analyzer User’s <strong>Manual</strong> SW Version 4.6<br />
Device) is show below. Each FIS Properties dialog box displays a pattern<br />
editor that allows you to set a bit pattern to be matched. If NOT is checked,<br />
any unchecked primitive category will generate an event match.<br />
Note that some of the data fields have drop-down menus. To see which<br />
fields have menus, position your mouse pointer over the blue field headings.<br />
If the pointer changes into a hand, then the heading will present a menu if it<br />
is clicked.<br />
ATA COMMANDS<br />
ATA Commands are presented in a single dialog box.<br />
ATA Commands Properties Dialog<br />
Presents several options:<br />
Commands - Presents a long list of ATA Commands. Selecting a<br />
command will cause the analyzer to search for the selected command.<br />
Features - A text box for entering a value.<br />
Sector Count - A text box for entering a Sector Count value.<br />
LBA Mode - Select the radio button, then enter a value.<br />
58
<strong>LeCroy</strong> <strong>SATracer</strong>/<strong>Trainer</strong> Analyzer User’s <strong>Manual</strong> SW Version 4.6<br />
Sector/Cylinder/Dev/Head Mode - Select the radio button, then enter<br />
values into the text boxes.<br />
If NOT is checked, any unchecked primitive will generate an event match.<br />
ATAPI COMMANDS<br />
Individual ATAPI 6/7 commands can be selected as a trigger event. Resource<br />
limitations restrict ATAPI triggering to a single channel and to a single ATAPI<br />
event.<br />
ATAPI Command Properties Dialog<br />
To specify ATAPI commands as the recording event, select the command<br />
using the Operation Code or Command name. Additional ATAPI<br />
parameters can be specified by entering bit-level pattern in binary or<br />
decimal including LUN, transfer length and LBA.<br />
59
<strong>LeCroy</strong> <strong>SATracer</strong>/<strong>Trainer</strong> Analyzer User’s <strong>Manual</strong> SW Version 4.6<br />
BUS CONDITIONS AND OOB SIGNALS<br />
ERRORS<br />
Bus Conditions and Out of Band Signals are presented in a single dialog<br />
box.<br />
Select from the check boxes to specify the type of Bus Condition or OOB<br />
Signal that you want the analyzer to search for.<br />
If NOT is checked, any unchecked primitive will generate an event match.<br />
Errors are presented in a single dialog box.<br />
Select from the checkboxes to specify the type(s) of errors you want the<br />
analyzer to search for. If NOT is checked, any unchecked primitive will<br />
generate an event match.<br />
BREAKOUT BOARD DATA<br />
Breakout board data are entered into a single dialog box.<br />
60
<strong>LeCroy</strong> <strong>SATracer</strong>/<strong>Trainer</strong> Analyzer User’s <strong>Manual</strong> SW Version 4.6<br />
The Breakout Board Data properties dialog box lets you specify a bit pattern<br />
from a breakout board that can be used for triggering. If NOT is checked,<br />
an event match will be created for any pattern other than the one specified.<br />
4.11 State Properties Dialog<br />
The State Properties dialog allows you to specify the Global state’s caption.<br />
To access this dialog box, click in the Global State Cell (but not on an Event<br />
button).<br />
61
<strong>LeCroy</strong> <strong>SATracer</strong>/<strong>Trainer</strong> Analyzer User’s <strong>Manual</strong> SW Version 4.6<br />
Timer Properties Dialog<br />
Specify the value for the timer in seconds, milliseconds, microseconds, and<br />
nanoseconds. The actual timer value is shown below the edit controls and<br />
reflects the hardware precision capabilities. The time is rounded up to the<br />
next 7.519 nanosecond sample, which corresponds to the 1.33 MHz internal<br />
clock frequency.<br />
4.12 Assigning Actions<br />
As shown above, you can double-click an Event or Action button to open<br />
the Properties dialog box, and then select the Actions tab. You can then<br />
select an action from one of the options.<br />
The assigned action will be represented by a button to the<br />
right of the Event button.<br />
You can also assign an action by right-clicking on an Event or Action button<br />
and selecting an action from the pop-up menu.<br />
62
<strong>LeCroy</strong> <strong>SATracer</strong>/<strong>Trainer</strong> Analyzer User’s <strong>Manual</strong> SW Version 4.6<br />
The following table shows the types of Actions you can select.<br />
Action Comment<br />
TRIGGER<br />
FILTER OUT<br />
FILTER IN<br />
Triggers the end of the recording.<br />
The end point of the recording is<br />
determined by the buffer settings in<br />
the Recording Options General<br />
page.<br />
Filters traffic in or out of the<br />
recording - thereby conserving<br />
recording buffer space.<br />
Can not be assigned to the events<br />
with Counters.<br />
RESTART ALL Reinitializes counters.<br />
4.13 Setting Conditions: The Role of the Global State<br />
Cell<br />
The Global State cell is the arena in<br />
which you create triggering and/or<br />
filtering conditions. The cell is called<br />
the Global State cell because the<br />
conditions you create are active at all<br />
times. You can think of these conditions as the default conditions. You use<br />
the Global State cell to create simple condition such as "Trigger when you<br />
see an xxx error," or "filter out all xyz primitives."<br />
63
<strong>LeCroy</strong> <strong>SATracer</strong>/<strong>Trainer</strong> Analyzer User’s <strong>Manual</strong> SW Version 4.6<br />
Example - Creating a Simple Event Trigger<br />
To create a simple condition that is active at all times, place an event button<br />
in the Global State cell:<br />
Step 1 Click the New Event button. An<br />
Events menu opens (shown right).<br />
Step 2 Select an event from the menu. The<br />
event will appear as a button in the<br />
Available Events area on the left.<br />
Step 3 Drag the event button to the cell<br />
marked "Global State."<br />
Step 4 Right-click on the button (i.e., not the<br />
Global State cell). A pop-up menu<br />
appears.<br />
Step 5 Select Trigger from the menu. An arrow will project from the error<br />
button and point to a cell marked Trigger.<br />
Creating Multiple Event Conditions in the Global State Cell<br />
When multiple buttons are placed in the Global Cell, it creates an "AND"<br />
condition or an "OR" condition depending on the actions selected.<br />
Creating an OR Condition - When two or more buttons in the Global State<br />
cell are assigned the same action, the analyzer will search for all of the<br />
events and perform the action on which ever event it sees first. The example<br />
below illustrates. It reads "Trigger if an error or a primitive occurs".<br />
Creating an AND Condition - When multiple events are placed in the<br />
Global State cell and assigned different actions, an AND statement is<br />
created. The example below reads "Trigger if an error occurs AND filter out<br />
any primitives that occur."<br />
64
<strong>LeCroy</strong> <strong>SATracer</strong>/<strong>Trainer</strong> Analyzer User’s <strong>Manual</strong> SW Version 4.6<br />
Filter In and Filter Out<br />
A filter causes the analyzer to filter in or out specified events from the<br />
recording. If events are filtered out of the recording, they are excluded and<br />
not simply hidden from the trace. The purpose of filtering is to preserve<br />
recording memory so you can conduct longer recording sessions and<br />
exclude events that do not interest you.<br />
To Filter In or Out traffic,<br />
Step 1 Click the New Event button. The New Event menu opens.<br />
Step 2 Select an event from the menu.<br />
Step 3 Drag the event into the Global State cell.<br />
Step 4 Right-click on the button. A pop-up menu opens.<br />
Step 5 Select Specify Action(s)<br />
Step 6 Select Filter Out (for example).<br />
The analyzer is now configured to filter out the selected event.<br />
Filter In or Out Everything<br />
The options Filter Out Everything or Filter In Everything allow you to<br />
filter all traffic in or out of the trace. These options are intended for a future<br />
release to allow you to selectively exclude and include traffic from a<br />
recording.<br />
Counting Events<br />
In addition to setting triggers and filters, you can also set counters. A<br />
counter is an action that allows you to set a trigger based on a count of<br />
events. For example, you could use a counter to "Trigger following the 16th<br />
occurrence of an error."<br />
To use a counter, follow these steps:<br />
Step 1 Select an event from the Select Event menu and drag it to the Global<br />
State Cell in the center of the dialog box.<br />
Step 2 Click the small channel buttons on the selected Event button to<br />
65
<strong>LeCroy</strong> <strong>SATracer</strong>/<strong>Trainer</strong> Analyzer User’s <strong>Manual</strong> SW Version 4.6<br />
select the channels for the actions.<br />
Step 3 Right-click the event and select Add Counter. A dialog box opens.<br />
Step 4 In the text box to the right of the label Count enter a value.<br />
Step 5 Make sure the checkbox to the left of the label Count is checked.<br />
Step 6 Click the X in the top right corner of the dialog box to close the<br />
dialog. A counter button should appear below your selected event.<br />
66
<strong>LeCroy</strong> <strong>SATracer</strong>/<strong>Trainer</strong> Analyzer User’s <strong>Manual</strong> SW Version 4.6<br />
4.14 Creating Event Sequences<br />
States<br />
Event sequences are chains of events leading to some action. A sequence is<br />
a multi-event "if, then" condition: "If x followed by y followed by z occurs,<br />
trigger." Event sequences are created by dragging two or more buttons into<br />
the Sequence cell. The Sequence cell is a faintly marked cell just below the<br />
Global State cell. The Sequence cell contains the text Drag an event here<br />
to add a new sequence.<br />
Note Event sequences can only be created in the Sequence cell. You<br />
cannot create a sequence in the Global State cell.<br />
Sequences are made up of cells called States. A state is a stage within a<br />
sequence that specifies what events the analyzer should look for and what<br />
actions to apply when the event occurs.<br />
In the example below, the Sequence is composed of two states. The<br />
maximum number of states a sequence can support is 255.<br />
67
<strong>LeCroy</strong> <strong>SATracer</strong>/<strong>Trainer</strong> Analyzer User’s <strong>Manual</strong> SW Version 4.6<br />
The foregoing example reads: "Trigger if you see a Primitive followed by<br />
an error."<br />
How to Create an Event Sequence<br />
To create an event sequence, you drag event buttons to the Sequence cell,<br />
link them with the action Advance the Sequence, then apply a trigger or<br />
other action to the end of the chain. The following steps illustrate how to<br />
create an event sequence.<br />
Step 1 Click the New Event button. The New Event menu opens.<br />
Step 2 Select an event type from the menu, for example an error. A button<br />
appears in the Available Events area.<br />
Step 3 Click the New Event button and select a second event type, for<br />
example a Primitive. At this point, you should see two buttons in the<br />
Available Events area.<br />
Step 4 Drag the first button to the cell marked "Drag an event here to create<br />
a sequence." When you finish, notice how two new cells appear in<br />
the window as shown below the cell where you placed your button.<br />
68
<strong>LeCroy</strong> <strong>SATracer</strong>/<strong>Trainer</strong> Analyzer User’s <strong>Manual</strong> SW Version 4.6<br />
Step 5 Double-click on the button. A Properties dialog box opens.<br />
Step 6 Select desired options from the dialog box, for example an error<br />
sub-type. The options apply immediately.<br />
Step 7 Close the Properties dialog box by clicking the X in the top right<br />
corner. The Properties dialog box closes.<br />
Step 8 Drag the second event button to the cell immediately below the cell<br />
occupied by your first event button. Note that an additional cell<br />
appears marked "Drag an event here to add a sequence."<br />
Step 9 Right-click on the first event button. A pop-up menu appears.<br />
Note Be sure to click on the button itself and not the cell. If you click the<br />
cell, you will get a different menu with fewer options.<br />
69
<strong>LeCroy</strong> <strong>SATracer</strong>/<strong>Trainer</strong> Analyzer User’s <strong>Manual</strong> SW Version 4.6<br />
Step 10 Select Specify Actions. Notice<br />
how this menu differs slightly<br />
from the menu shown earlier in<br />
this chapter. You will see three<br />
options for advancing or<br />
restarting a sequence:<br />
• Advance the Sequence -<br />
Draws an arrow that connects<br />
the selected event button to the<br />
event button below it. This option creates a sequence.<br />
• Restart the Sequence - (Not visible in the menu above.) This<br />
option restarts the entire sequence. This option appears once you<br />
have linked two or more buttons in a sequence. This option<br />
draws an arrow upward from the selected event button to the<br />
beginning of the sequence.<br />
• Restart All - Restart all sequences and counts. This option<br />
creates an arrow pointing a cell marked "Restart All."<br />
Step 11 Select Advance the Sequence. An arrow will appear that connects<br />
the first button to the second.<br />
Step 12 Right-click the second button and select Specify Actions. A<br />
sub-menu appears.<br />
Step 13 Select Trigger. A cell will appear to the right of the second button<br />
saying "Trigger." Your sequence configuration is now complete and<br />
should look like this:<br />
70
<strong>LeCroy</strong> <strong>SATracer</strong>/<strong>Trainer</strong> Analyzer User’s <strong>Manual</strong> SW Version 4.6<br />
Using a Timer<br />
Timers let you set a time-delay for a trigger or other action. The following<br />
example illustrates how timers work.<br />
This example reads "Look for a Primitive. When you see one, wait three<br />
seconds then trigger."<br />
To create the example shown above, perform the following steps:<br />
Step 1 Click the New Event button to open the Event menu.<br />
Step 2 Select an event such as Primitive from the menu. An event button<br />
appears in the Available Events area.<br />
Step 3 Drag the event button into a Sequence cell marked "Drag an event<br />
here to add another state." Once the button is added, the cell turns<br />
blue and acquires a title like "Sequence 1, State 1." Below the cell,<br />
a new cell appears marked "Drag an event here to add another<br />
state."<br />
Step 4 Click the New Events button. The Events menu opens.<br />
Step 5 Select Timer. A Timer button appears in the Available Events list.<br />
Step 6 Drag the Timer Button to the cell marked "Drag an event here to add<br />
another state." The cell turns blue and acquires a title like<br />
"Sequence 1, State 2."<br />
Step 7 To link the two events into a sequence, right-click on the first event<br />
(in our example, the Primitive event button). Be sure to click on the<br />
event button and not on the cell. A pop-up menu appears.<br />
Step 8 Select Specify Action(s). A sub-menu opens.<br />
Step 9 Select Advance the Sequence. The menu closes and an arrow<br />
appears that connects this cell to the State cell below.<br />
Step 10 Right-click on the Timer button. A pop-up menu appears.<br />
Step 11 Select Specify Action(s). A sub-menu opens.<br />
Step 12 Select Trigger. The menu closes and an arrow appears that<br />
71
<strong>LeCroy</strong> <strong>SATracer</strong>/<strong>Trainer</strong> Analyzer User’s <strong>Manual</strong> SW Version 4.6<br />
connects the Timer button to a new cell to the right marked Trigger.<br />
Step 13 To set the duration of the Timer, double-click on the Timer button.<br />
A dialog box appears.<br />
Step 14 Enter a time value in the boxes.<br />
Step 15 Click the x to close the dialog box. The timer is now set.<br />
72
<strong>LeCroy</strong> <strong>SATracer</strong>/<strong>Trainer</strong> Analyzer User’s <strong>Manual</strong> SW Version 4.6<br />
4.15 Recording Options - Channels<br />
The Channels page allows the channel names to be customized. To change<br />
a channel name, select the channel, then click the edit button and enter the<br />
new text, then click OK. Once the options are set, the analyzer will update<br />
the open trace and all future traces with the new channel names.<br />
Note You can also change channel names by clicking on the first cell<br />
of a trace (the channel cell) and selecting Rename Channel<br />
from the pop-up menu.<br />
Where Custom Channel Names Appear<br />
Custom channel names appear in three places:<br />
• The trace itself<br />
• Link Tracker window<br />
• Frame Tracker window<br />
• Bus Usage window<br />
73
<strong>LeCroy</strong> <strong>SATracer</strong>/<strong>Trainer</strong> Analyzer User’s <strong>Manual</strong> SW Version 4.6<br />
Custom Channel Names in the Trace - Custom channel names do not<br />
appear right away in the trace: the original names continue to display. To<br />
see the custom channel names, click in the first cell of the trace (the channel<br />
cell) and select Format from the pop-up menu, then select Custom.<br />
The custom names will then appear in the trace.<br />
Channel I2 renamed as Init_2.<br />
Custom Channel Names in the Link Tracker Window - The Link<br />
Tracker window will automatically show custom channel names as soon as<br />
they have been customized.<br />
Custom Channel Names in the Bus Usage Window - Custom Channel<br />
names automatically appear in the Bus Usage window as soon as they have<br />
been customized. The easiest way to see this is to open the Bus Usage<br />
window and then to open the Properties dialog for the window. It will list<br />
the custom channel names.<br />
74
<strong>LeCroy</strong> <strong>SATracer</strong>/<strong>Trainer</strong> Analyzer User’s <strong>Manual</strong> SW Version 4.6<br />
To open the properties dialog box for the Bus Usage window, right-click in<br />
the window, then choose Properties from the pop-up menu.<br />
75
<strong>LeCroy</strong> <strong>SATracer</strong>/<strong>Trainer</strong> Analyzer User’s <strong>Manual</strong> SW Version 4.6<br />
76
<strong>LeCroy</strong> <strong>SATracer</strong>/<strong>Trainer</strong> Analyzer User’s <strong>Manual</strong> SW Version 4.6<br />
5. Display Options<br />
Use the Display Options menu to specify the way <strong>CATC</strong> Trace information<br />
is displayed.<br />
From the Setup menu, select Display Options.<br />
5.1 General Display Options<br />
Use the General Display Options to specify the basic appearance of a Trace<br />
view.<br />
• Zoom Level: Adjustable in discrete increments from 10% to 200%<br />
percent.<br />
• Enable Tips: Select to enable Tool Tips with explanation text to<br />
pop up when you position your cursor over various fields in the<br />
Trace View.<br />
• Wrap: Causes packets to wrap within the window if their length<br />
exceeds the width of the window.<br />
77
<strong>LeCroy</strong> <strong>SATracer</strong>/<strong>Trainer</strong> Analyzer User’s <strong>Manual</strong> SW Version 4.6<br />
• Hierarchy Lines: Adds faint lines (shown<br />
right) to the left side of the trace showing<br />
the hierarchical relationship of the Frames,<br />
Transactions etc within the trace. When<br />
this option is enabled, the lines display any<br />
time you cascade higher level decodes.<br />
• Right click cell context menu: Activates<br />
the right mouse button for opening cell context menus.<br />
• Timestamp At The Beginning: Moves the timestamp from the<br />
end of the Frame to near the beginning.<br />
• Trace Viewing Level: Allows you to select the hierarchical level at<br />
which traffic is displayed.<br />
• Analysis Tools: Displays report windows such as Link Tracker<br />
and Bus Utilization.<br />
• Fonts: Sets fonts used in trace fields.<br />
• Display Configuration Name: Comment field associated with the<br />
*.opt file containing the current Display Options values. You can<br />
also create and store your unique Display Options for future use.<br />
To create a new Display Options file, follow these steps:<br />
Step 1 Enter a comment for the new file in the Display<br />
Configuration Name field.<br />
Step 2 Click Save...<br />
Step 3 Specify a filename (*.opt).<br />
Step 4 Click Save.<br />
78
<strong>LeCroy</strong> <strong>SATracer</strong>/<strong>Trainer</strong> Analyzer User’s <strong>Manual</strong> SW Version 4.6<br />
5.2 Setting Color, Formatting, and Hiding Options<br />
Click the Color/Format/Hiding tab on the Display Options screen.<br />
Use this window to customize the colors and formats associated with each<br />
field in the Trace view. You can also use this window to hide fields within<br />
the trace.<br />
Setting Color Display Options<br />
To change the colors of elements in the trace, select an item in the Group<br />
and Color column and use the color pallet screen on the right to make the<br />
desired changes.<br />
Note The color of an Invalid Data (packet error) field cannot be<br />
changed; it is permanently set to red.<br />
Use this window to customize the colors associated with each field in the<br />
trace. You can experiment with these options to achieve the color<br />
combination best suited to a particular graphic system.<br />
79
<strong>LeCroy</strong> <strong>SATracer</strong>/<strong>Trainer</strong> Analyzer User’s <strong>Manual</strong> SW Version 4.6<br />
You can also customize the colors by using the options in the Custom tab.<br />
Changing Field Formats<br />
To change field formats, select an item under the Group and Color column.<br />
This action will enable the formats radio buttons on the right. The format<br />
types change with respect to the item selected under the Group and Color<br />
column. For example, if Display Units is selected, the following displays:<br />
The following formats are available:<br />
Note Not every format is available for every item.<br />
80
<strong>LeCroy</strong> <strong>SATracer</strong>/<strong>Trainer</strong> Analyzer User’s <strong>Manual</strong> SW Version 4.6<br />
Hiding Display Options<br />
To hide one or more fields in the trace, select the<br />
appropriate item from the Group and color column, click<br />
the checkbox marked Hidden, and click the Save button.<br />
You can also hide Frames from a trace by selecting the desired options from<br />
the checkboxes.<br />
5.3 Level Hiding Options<br />
The Level Hiding tab allows you to hide various types of traffic. To hide<br />
traffic, select one or more items from the Events Group list and from the list<br />
on the right, then click OK.<br />
5.4 Saving Display Options<br />
To complete your display options settings, use the features at the bottom of<br />
the Display Options window. These features remain the same no matter<br />
which of the four Display Options windows you are working in.<br />
• Click Save to save the currently specified display options for use in<br />
future sessions. Any file name can be specified, but you must use<br />
the .opt extension. If no extension is specified, .opt is added by<br />
default.<br />
81
<strong>LeCroy</strong> <strong>SATracer</strong>/<strong>Trainer</strong> Analyzer User’s <strong>Manual</strong> SW Version 4.6<br />
• Click Load to load a previously saved *.opt file, thus restoring a<br />
previous set of display options.<br />
• The Save as Default function is equivalent to the Save function,<br />
specifying the file name default.opt. Whenever you start up the<br />
Analyzer, it automatically loads the default.opt file if one exists.<br />
• Click OK to apply any changes you have made to Display Options<br />
and close this dialog box.<br />
• Click Cancel to cancel any immediate changes you have made and<br />
exit the Display Options menu.<br />
• Click Apply to apply your changes while keeping the Display<br />
Options window open.<br />
82
<strong>LeCroy</strong> <strong>SATracer</strong>/<strong>Trainer</strong> Analyzer User’s <strong>Manual</strong> SW Version 4.6<br />
6. Reading a <strong>CATC</strong> Trace<br />
6.1 Trace View Features<br />
<strong>SATracer</strong>/<strong>Trainer</strong> trace viewing software display makes extensive use of<br />
color and graphics to fully document the captured traffic. Frames are shown<br />
on separate time-stamped rows, with their individual fields both labeled and<br />
color coded. Data fields can be collapsed to occupy minimal space in the<br />
display (which can in turn be zoomed in and out to optimize screen<br />
utilization). Pop-up Tool Tips annotate Frame fields with detailed<br />
information about their contents.<br />
The display software can operate independent of the hardware and so can<br />
function as a stand-alone Trace Viewer that may be freely distributed.<br />
6.2 Frame, Transport, SCSI, and Management Views<br />
The default display mode is Frame view. The trace can also be viewed in<br />
Transport Layer (Tra), SCSI Application Layer, Management Application,<br />
ATA Application Layer views.<br />
Changing Display Levels<br />
To switch between the Frame, FIS, and ATA Command<br />
application views, click the respective buttons on the Tool<br />
Bar.<br />
83
<strong>LeCroy</strong> <strong>SATracer</strong>/<strong>Trainer</strong> Analyzer User’s <strong>Manual</strong> SW Version 4.6<br />
Frame Layer<br />
Frame Level view is the default decode level. Frame Level view displays<br />
traffic as shown below:<br />
FIS Layer<br />
When you click the FIS button, FIS Layer traffic is decoded and presented<br />
as shown below. To see FIS Layer transactions, you may need to scroll<br />
through the trace or use the Find command (under Search).<br />
ATA Application Layer<br />
When you click the Cmd button, ATA Application Layer traffic is decoded<br />
and presented.<br />
You can "open" any of these decode levels to reveal the components by<br />
clicking the small triangular in the first cell. The following is an example of<br />
an expanded ATA Command Level view showing its constituent FIS Layer<br />
Transactions and Frames:<br />
You can also get additional information on fields by holding your mouse<br />
over selected fields as shown in the following example:<br />
84
<strong>LeCroy</strong> <strong>SATracer</strong>/<strong>Trainer</strong> Analyzer User’s <strong>Manual</strong> SW Version 4.6<br />
You can also set the hierarchical view by selecting checkboxes in the Trace<br />
Viewing Level Options in the Display Options window.<br />
6.3 View Raw Bits<br />
<strong>SATracer</strong> allows you to view low-level 8B/10B values for Serial ATA<br />
traffic. You can expand a specific Frame to view the raw bits by right<br />
clicking on the Frame number and selecting Show Raw Bits.<br />
To view Raw Bits, follow these steps:<br />
Step 1 Click on the first cell of a Frame.<br />
85
<strong>LeCroy</strong> <strong>SATracer</strong>/<strong>Trainer</strong> Analyzer User’s <strong>Manual</strong> SW Version 4.6<br />
Note Raw Bits can be viewed only in Frames.<br />
Step 2 Select Show Raw 10b Codes.<br />
The data 8b and 10b field can be displayed in several formats, as<br />
shown below.<br />
Data Appearance - To change the format of the data, select from following<br />
options:<br />
• 8b - Click the column heading to show hexadecimal values.<br />
• 10b - Click the column heading to show hexadecimal values.<br />
Navigation - To move to the previous or next packet in the trace, click one<br />
of the two buttons at the bottom of the window:<br />
• Prev - Displays data for the previous Frame in the trace.<br />
• Next - Moves to the next Frame in the trace.<br />
Running Disparity Error - If <strong>SATracer</strong> detects Running Disparity Errors<br />
it will display in red and have exclamation marks before and after the value.<br />
86
<strong>LeCroy</strong> <strong>SATracer</strong>/<strong>Trainer</strong> Analyzer User’s <strong>Manual</strong> SW Version 4.6<br />
The 8-bit codes change to 10-bit codes before they get transmitted.<br />
Running Disparity<br />
Running Disparity is a binary parameter with either the value negative (-) or<br />
the value positive (+). After receiving any encoded character, the receiver<br />
shall determine whether the encoded character is valid using the running<br />
disparity parameter as a checksum. The receiver will then calculate a new<br />
value that is either the opposite of the previous character or neutral. The<br />
ability to view changes in Running Disparity polarity is an important part of<br />
the debug process. The <strong>CATC</strong> raw bits view displays the running disparity<br />
of the 10bit code in the column following the raw bits.<br />
6.4 Expanding and Collapsing Data Fields<br />
You can expand a Data Payload field to view it in greater detail or collapse<br />
it when you want a more compact view. <strong>SATracer</strong>/<strong>Trainer</strong> allows you to<br />
expand and collapse the data payload information in four ways:<br />
• Clicking the small triangular arrows on the left side of the data<br />
payload field<br />
• Clicking and holding down the mouse button on the triangular<br />
button on the left side of a data payload field. This action will<br />
expand or collapse data fields for all Frames throughout the trace<br />
• Double-clicking anywhere in the payload field<br />
• Clicking in the data payload field and selecting Expand/Collapse<br />
Data in the pull-down menu.<br />
When you select "Expand Data," only the first 100 dwords are shown. To<br />
view all of the dwords, select "View Data Block."<br />
This section describes expanding or collapsing data payload by using the<br />
menu:<br />
Step 1 In the Serial ATA trace, click in a Data Payload box.<br />
87
<strong>LeCroy</strong> <strong>SATracer</strong>/<strong>Trainer</strong> Analyzer User’s <strong>Manual</strong> SW Version 4.6<br />
Step 2 In the Data Field menu, select Expand Data.<br />
The Data Payload box expands to show more detailed description<br />
of the data:<br />
To collapse data, follow the same steps described above, and select<br />
Collapse Data.<br />
You can also expand or collapse all data payload fields within a<br />
trace by using the above menu.<br />
6.5 View Data Block Window<br />
The View Data Block command opens a dialog box that lets you display and<br />
navigate the data within Frames and Transport Layer transactions. This<br />
dialog box gives you several format choices for the data: binary,<br />
hexadecimal, ASCI, and decimal. It also gives you the ability to navigate<br />
through data fields within different Frames and Transport Layer<br />
transactions.<br />
To access the View Data Block window,<br />
Step 1 Decode to the level of interest by pressing or .<br />
Step 2 Locate a Frame or FIS transaction with a data field such as the one<br />
shown below:<br />
Step 3 Click in the Data field to open a pop-up menu.<br />
Step 4 Choose View Data Block from the menu. The View Data Block<br />
88
<strong>LeCroy</strong> <strong>SATracer</strong>/<strong>Trainer</strong> Analyzer User’s <strong>Manual</strong> SW Version 4.6<br />
window opens.<br />
Description of View Data Block Window<br />
The View Data Block window (henceforth called the View window)<br />
displays the raw data for the selected Data field. Data is displayed in up to<br />
four formats, a column per format. The window has several options for<br />
navigating through Data blocks.<br />
Save. Saves the currently displayed data block into a text file.<br />
Previous and Next. These buttons cause the View window to jump<br />
to the next Frame that has a data block and display that data block.<br />
Data Format Display. Creates a column for the<br />
specified data format and then displays the currently selected data block in<br />
that format.<br />
MSB/LSB Format. Begins the data string with the Most<br />
Significant Bit (MSB) or Least Significant Bit (LSB).<br />
Format Line. Opens a dialog box for setting DWORD length. The<br />
default is 4 dwords.<br />
Synchronize Options. Configures the mouse's<br />
scrolling behavior within the View window.<br />
The menu presents three scrolling options:<br />
• Update only on request - Locks whatever data block currently is<br />
on display in the Data window unless overridden by a direct<br />
request. There are two ways to make a request -- by clicking on<br />
the buttons or by right-clicking in the trace on a data block and<br />
selecting View Data Block from the pop-up menu.<br />
• Update on click - Repositions the Data window to whatever data<br />
block you click on in the trace window.<br />
• Update on scroll - Synchronizes trace scrolling with the Data<br />
window. As you scroll the trace, the Data window will reposition<br />
to show the data block for the Frame at the top of the trace<br />
window.<br />
89
<strong>LeCroy</strong> <strong>SATracer</strong>/<strong>Trainer</strong> Analyzer User’s <strong>Manual</strong> SW Version 4.6<br />
Scroll to Offset. Repositions the Data window to whatever<br />
offset you enter in the Offset box. You can enter an offset value in decimal<br />
or hexadecimal.<br />
6.6 Export Options<br />
Trace data captured by <strong>SATracer</strong> can be exported for other uses, including<br />
uses outside the system. These options are accessed through the File menu<br />
by selecting Export, as shown below.<br />
There are four export options supported. The data fields which will be<br />
present in the exported files are determined by the current screen view.<br />
Please select the appropriate data fields before exporting the data to ensure<br />
that the correct information is present in the exported file.<br />
Packets to Text (Packet View Format)<br />
This option is used to create a text version of the trace (e.g., for use when<br />
emailing a trace section). Selecting this option brings up a screen to allow<br />
you to define the range of events that you want to include in the text file.<br />
The range can be defined by frame number, by markers, or by time.<br />
90
<strong>LeCroy</strong> <strong>SATracer</strong>/<strong>Trainer</strong> Analyzer User’s <strong>Manual</strong> SW Version 4.6<br />
Define the range of events (by frames, markers or time) that you would like<br />
in the exported file and click "OK". A screen will appear for you to provide<br />
a filename for the exported file, and allow you to navigate to the folder<br />
where you wish to store the file. The exported file will have a ".txt"<br />
extension.<br />
Export to Generator File Format<br />
A feature of the SA<strong>Trainer</strong> is the ability to use a trace captured by the<br />
<strong>SATracer</strong> as the basis for traffic to be generated by the SA<strong>Trainer</strong>. In order<br />
to use this feature, the captured trace must first be exported by using the<br />
"Export to Generator File Format" command. See Generating Traffic on<br />
page 156 for a discussion on how to use this feature with the SA<strong>Trainer</strong>.<br />
Packets to EAS Format<br />
This option creates EAS files based on the open trace. Selecting this option<br />
will bring up a screen allowing you to name the files and navigate to the<br />
folder that you would like to store the files. There are three files created,<br />
one file with a ".ecs" extension and two files (one for each channel) with a<br />
".eas" extention. The ".eas" files will have "_000_ch1" and "_000_ch2"<br />
appended to the file name you provided.<br />
Export to CSV Format<br />
Many users might wish to have the trace data exported into a formatted file<br />
(e.g., for import into databases or spreadsheet programs such as Microsoft<br />
Excel). The "Transport to CSV Format" option provides a means of<br />
generating a structured file from trace data captured by SASTracer.<br />
Selecting this option will bring up a screen allowing the user to specify the<br />
information from the current file to be exported and the destination file for<br />
the exported data.<br />
91
<strong>LeCroy</strong> <strong>SATracer</strong>/<strong>Trainer</strong> Analyzer User’s <strong>Manual</strong> SW Version 4.6<br />
Select the destination folder and enter the destination filename for the<br />
exported data. Select the layer to export (either Transport or ATA<br />
Application Layer). Indicate whether you would like hidden packets to be<br />
included in the exported file or just displayed packets. Define the range of<br />
events (by frames, markers or time) that you would like in the exported file<br />
and click "Save".<br />
The exported file will have a ".csv" extension. The first line (or record) in<br />
the .csv file will be a header indicating the name of each variable included<br />
in the file. Each following line (or record) will contain only data.<br />
If opening the exported file from within Microsoft Excel, in the Open File<br />
window under "Files of Type:" select "Text Files (....; *.csv)". When the file<br />
is opened, a spreadsheet is shown with a large number of columns (each<br />
column representing one data type) and a number of rows on the trace which<br />
was selected for export. A typical spreadsheet is shown on the next page.<br />
Once opened, the file can be later saved as any supported Excel file type.<br />
92
<strong>LeCroy</strong> <strong>SATracer</strong>/<strong>Trainer</strong> Analyzer User’s <strong>Manual</strong> SW Version 4.6<br />
93
<strong>LeCroy</strong> <strong>SATracer</strong>/<strong>Trainer</strong> Analyzer User’s <strong>Manual</strong> SW Version 4.6<br />
94
<strong>LeCroy</strong> <strong>SATracer</strong>/<strong>Trainer</strong> Analyzer User’s <strong>Manual</strong> SW Version 4.6<br />
7. Reports<br />
The Report menu provides several reports to assist you in analyzing traffic<br />
recorded by the Analyzer.<br />
7.1 File Information<br />
To display data on a trace, select Report >File Information from the menu.<br />
The File Information dialog opens and provides information about the<br />
recording such as trace date and the version of the Analyzer Firmware and<br />
BusEngine used to record the traffic.<br />
One of the most useful pieces of information in the dialog is the Recording<br />
Options settings used to create the open trace. These settings are listed<br />
under the heading Recording Options shown in the above screenshot.<br />
Below the settings is a blue hypertext link that reads Open Recording<br />
95
<strong>LeCroy</strong> <strong>SATracer</strong>/<strong>Trainer</strong> Analyzer User’s <strong>Manual</strong> SW Version 4.6<br />
Options in a dialog. When clicked, this link causes the software to open<br />
the Recording Options dialog and automatically populate the dialog with the<br />
settings used to create the trace. This link provides a simple and easy way<br />
of loading the options directly into the Recording Options dialog.<br />
7.2 Traffic Summary<br />
The Traffic Summary displays a report of traffic in the <strong>SATracer</strong> and<br />
appears at the bottom of the <strong>SATracer</strong> main window. The left side contains<br />
a tree view where you can expand or collapse types of data you want<br />
displayed to the right of the Traffic Summary window. You can print,<br />
e-mail, save to disk, or display data in a two-column table by using the<br />
buttons in the Traffic Summary tool bar.<br />
From the Report menu, select Traffic Summary.<br />
Navigating<br />
The Traffic Summary window also functions as a trace navigation tool. If<br />
you click one of the numbers in the right side of the window, the trace will<br />
jump to the first instance of your selection. Afterwards, click the up or down<br />
arrows at the top of the Traffic Summary window to navigate forward or<br />
backward through the display.<br />
Buttons<br />
Buttons at the top of the Traffic Summary window serve to format the<br />
display and export summarized data to email, file, or the printer:<br />
96
<strong>LeCroy</strong> <strong>SATracer</strong>/<strong>Trainer</strong> Analyzer User’s <strong>Manual</strong> SW Version 4.6<br />
The buttons have the following functions:<br />
Save As - Saves Traffic<br />
Summary results into an<br />
HTML format<br />
Email - Creates an email<br />
with a *.html file<br />
attachment of the graphs<br />
Print<br />
7.3 Error Summary<br />
The Error Summary button opens the Traffic Summary window and<br />
displays a list of errors analyzed throughout the recording.<br />
Step 1 From the Report menu, select Error Summary.<br />
The Traffic Summary window appears with Error information<br />
displayed.<br />
Step 2 Navigate to an error within the recording by clicking the number of<br />
the Frame containing the error.<br />
Step 3 Use the arrows to cycle though each occurrence of a particular error.<br />
7.4 Timing Calculations<br />
The Timing measures timing between any two specified Frames or<br />
markers. The timing calculator feature is designed specifically for tracking<br />
bus utilization and I/O performance in current or previously captured trace<br />
files. By default the statistics will be calculated on a complete capture file<br />
or one bounded between markers or between any two Frames.<br />
To run the Timing Calculator, perform the following steps:<br />
97<br />
Displays results tabular text format<br />
Displays drop-down menu with:<br />
Grid Lines - Displays/Hides grid lines<br />
Row Selection - Allows entire rows to be selected<br />
Tight Columns - Reformats column widths to<br />
match data
<strong>LeCroy</strong> <strong>SATracer</strong>/<strong>Trainer</strong> Analyzer User’s <strong>Manual</strong> SW Version 4.6<br />
Step 1 From the Report menu, select Timing Calculations.<br />
Step 2 Select the range, and click the Calculate button. The results will<br />
then display in the window.<br />
7.5 Bus Utilization<br />
The Bus Utilization window displays information on bandwidth use.<br />
To open the Bus Utilization window, select Report >Bus Utilization or<br />
click the button marked . A window opens like the one shown below:<br />
Window Layout<br />
The Bus Utilization window divides into two areas:<br />
98
<strong>LeCroy</strong> <strong>SATracer</strong>/<strong>Trainer</strong> Analyzer User’s <strong>Manual</strong> SW Version 4.6<br />
• Graph Area - Displays graphs. Initially, no graphs will be<br />
displayed. To display one or more graphs, click and make a<br />
selection from the menu. See “Graph Areas Menu” on page 101<br />
for an explanation of the types of graphs listed in this menu.<br />
• Min/Max/Avg Area - Displays the minimum, maximum, and<br />
average values for several parameters. Data is available only<br />
after you have displayed the relevant graph. After displaying a<br />
graph, the Min/Max/Avg information is calculated and is<br />
thereafter available to the user even if the graph is closed. The<br />
user can close this section by clicking and deselecting<br />
Statistics Accumulation from the menu.<br />
Bus Utilization Buttons<br />
The Bus Utilization window has a row of buttons for changing the format of<br />
the displayed data and for exporting data:<br />
The buttons have the following functions:<br />
Save As - Saves the graphs<br />
as a bitmap file (*.bmp)<br />
Email - Creates an email<br />
with a *.bmp file attachment<br />
of the graphs<br />
Print<br />
99<br />
Vertical zoom in<br />
Vertical zoom out<br />
Full Screen Select Range<br />
View Settings - opens a<br />
sub-menu with options for<br />
formatting the display. See<br />
“View Settings Menu”<br />
below<br />
Horizontal zoom in<br />
Horizontal zoom out<br />
Click and Drag zoom - Click diagonally to<br />
select and zoom in on part of the graph. The<br />
initial direction you begin dragging the<br />
cursor determines whether the horizontal or<br />
vertical axis is magnified.<br />
Sync and Graph areas - If two or more<br />
graphs are displayed, this button will<br />
synchronize the graphs to one another. Once<br />
synchronized, the positioning slider of one<br />
graph will move the other graphs<br />
Graph Areas - Presents a menu of graphs for<br />
various types of bus data
<strong>LeCroy</strong> <strong>SATracer</strong>/<strong>Trainer</strong> Analyzer User’s <strong>Manual</strong> SW Version 4.6<br />
View Settings Menu<br />
Clicking the View settings button causes a menu to<br />
open with options for formatting the display.<br />
• Orient Horizontally - changes the orientation of<br />
bus usage to horizontal. After selecting this<br />
option, the menu will say "Orient Vertically."<br />
• Tile Vertically - tiles the two graphs vertically<br />
(i.e., side by side).<br />
• Show Markers - Places "tick" marks along the x<br />
axis of each graph.<br />
• Show Plumb Line - Displays a vertical line that connects your<br />
cursor to the horizontal axis. As the mouse is moved, the status bar<br />
will show the packet and time frame to which the cursor is pointing.<br />
• Status - Opens a sub-menu with the following options:<br />
— Bar - Displays a status bar at bottom of graph.<br />
— Tooltip - Causes a tooltip to appear if the mouse pointer is positioned<br />
over part of the graph and left there for a couple of seconds.<br />
— None - Turns off tooltips and the status bar.<br />
• Grid Lines - Opens a sub-menu with the following options:<br />
— Both - Displays both X and Y axis gridlines<br />
— X Axis - Displays X axis gridlines<br />
— Y Axis - Display Y axis gridlines<br />
— None - Turns off gridlines<br />
• Grid on Top - Moves the grid lines above the graph.<br />
• Fonts and Colors - Opens a dialog box for setting the colors and<br />
fonts used in the graphs:<br />
100
<strong>LeCroy</strong> <strong>SATracer</strong>/<strong>Trainer</strong> Analyzer User’s <strong>Manual</strong> SW Version 4.6<br />
Graph Areas Menu<br />
The Graph Areas menu allows you to view different information in the Bus<br />
Utilization window.<br />
Step 1 Click the button.<br />
The Graph Areas menu opens.<br />
Step 2 Select a graph type from the menu. Repeat for additional graphs.<br />
Modifying the Appearance of Graphs<br />
To modify a Bus Usage graph, follow these steps below.<br />
Step 1 With a graph displaying in the Graphs Area, right-click<br />
anywhere in the graph and choose Properties from the<br />
pop-up menu. The following dialog box opens.<br />
Step 2 Select an a data type from the box on the left, then edit the Title,<br />
Appearance, Type, or Color boxes as appropriate.<br />
Step 3 Click OK to apply the changes.<br />
101
<strong>LeCroy</strong> <strong>SATracer</strong>/<strong>Trainer</strong> Analyzer User’s <strong>Manual</strong> SW Version 4.6<br />
Creating a New Graph<br />
To create a new graph,<br />
Step 1 Click .<br />
Step 2 From the menu, select New ...<br />
Step 3 From the Title, Appearance, and Type boxes, select the desired<br />
options.<br />
7.6 Link Tracker Window<br />
The Link Tracker window displays a detailed chronological view of<br />
events. Events are shown on a primitive-by-primitive basis within columns<br />
within the window, each column representing a channel. Time is presented<br />
as rows. Idle time is shown by empty rows in the window. Idles can be<br />
collapsed into gray strips running across the window.<br />
Each time slot in the vertical axis represents the minimum time required by<br />
a dword to traverse the bus.<br />
The time slots are not fixed in size: they vary depending on how zoomed<br />
out the display is. When the Link Tracker is fully zoomed in, time slots for<br />
1.5 G traffic measure 26.66 ns and time slots for 3.0 G traffic measure 13.33<br />
ns.<br />
When the Link Tracker window is fully zoomed out, the grid lines disappear<br />
and the scale changes to 1 dword equaling a line measuring one pixel in<br />
height.<br />
Opening the Link Tracker Window<br />
To open the Link Tracker window, select Report > Link Tracker or click<br />
the button marked . A window opens like the one shown below:<br />
102
<strong>LeCroy</strong> <strong>SATracer</strong>/<strong>Trainer</strong> Analyzer User’s <strong>Manual</strong> SW Version 4.6<br />
Window Layout<br />
The Link Tracker window divides into two areas:<br />
• Toolbar - Presents buttons for changing data format.<br />
• Main Display Area - Displays traffic chronologically as it<br />
occurred in the recording. The window divides into columns: the<br />
first column shows time and traffic is shown on a channel by<br />
channel basis in the columns on the right.<br />
Link Tracker Buttons<br />
The Link Tracker window has a row of buttons for changing the format of<br />
the displayed data and for exporting data:<br />
The buttons have the following functions:<br />
Full Screen<br />
Synchronize Trace View.<br />
Synchronizes the Trace View and<br />
Link Tracker windows so that a move<br />
in one window repositions the other.<br />
Because of the differences in scale<br />
and logic between the Link Tracker<br />
and Trace view windows, scrolling<br />
produces different effects depending<br />
on which window is being scrolled.<br />
Scrolling in the trace window causes<br />
the Link Tracker window to rapidly<br />
jump from event to event. Long<br />
periods of idle time are skipped.<br />
Scrolling in the Link Tracker<br />
window, in contrast, causes small<br />
moves in the trace window. Scrolling<br />
in the Link Tracker window causes<br />
the trace window to pause until the<br />
start of a packet is displayed. At that<br />
point, the trace window repositions<br />
itself. While scrolling through idle<br />
periods or the contents of a packet,<br />
the trace window will not move.<br />
103<br />
View Options. Opens a menu<br />
with three options: Collapsible<br />
Idle Time, Tooltip Display, and<br />
Reset Column Widths. See View<br />
Options Menu below for<br />
descriptions.<br />
Zoom In<br />
Zoom In
<strong>LeCroy</strong> <strong>SATracer</strong>/<strong>Trainer</strong> Analyzer User’s <strong>Manual</strong> SW Version 4.6<br />
View Options Menu<br />
Clicking the View Options button causes a menu to open with options for<br />
formatting the display.<br />
• Time Format- Lets you set the Time format in Link Tracker to<br />
Seconds or Clocks.<br />
• Reset column widths - This option resets column widths to their<br />
defaults and enables columns to resize themselves automatically any<br />
time the application window is resized.<br />
Normally, columns will automatically resize themselves if the<br />
application window is made larger or smaller. However, if you<br />
manually resize any columns in the Link Tracker window, column<br />
widths become static. Thereafter, if you resize the application<br />
window, the Link Tracker columns will not adjust automatically.<br />
Reset Column Widths re-enables this automatic resizing<br />
capability.<br />
Docking and Undocking the Window<br />
You can undock the Link Tracker window by double-clicking on the blue<br />
title bar along the left side of the window. Once undocked, the window can<br />
be dragged anywhere in the application. To redock, double-click again on<br />
the title bar.<br />
Setting Markers<br />
Markers can be set on any dword on any event within the Link Tracker<br />
window. To set a marker, right-click on an event, then select Set Marker<br />
from the pop-up menu. Once marked, events can be easily navigated to via<br />
the Go to Marker command in the Search menu.<br />
104
<strong>LeCroy</strong> <strong>SATracer</strong>/<strong>Trainer</strong> Analyzer User’s <strong>Manual</strong> SW Version 4.6<br />
Calculating Time between Dwords<br />
You can calculate time between dwords by clicking on a specific cell and<br />
then positioning your mouse pointer over a second cell. A tooltip will<br />
display the time delta between the two cells.<br />
Step 1 Click on the cell for the first event to select it.<br />
Step 2 Scroll down through the trace to the second event and position the<br />
mouse pointer over the event. A tooltip will appear showing the<br />
time interval between the first and second events.<br />
More about Cell Selection<br />
When searching for a frame or primitive within Link Tracker, the found cell<br />
will become the selected cell. When a cell is selected, it will remain selected<br />
even if it's off the screen. Keyboard actions in LinkTracker (scrolling, arrow<br />
key, etc...) will not affect the selection. Once a cell is selected, it can only<br />
be deselected by switching the selection to another cell.<br />
Hiding Traffic<br />
You can hide Aligns, Channels and other data from the Link Tracker<br />
window by clicking the Hide buttons on the toolbar in the Trace window<br />
or by selecting one or more of the various Hide options in<br />
the Display Options dialog box.<br />
Searching<br />
When the Trace view and Link Tracker windows are synchronized, the Find<br />
and Go To options in the Search menu will apply to the Link Tracker<br />
window. The Trace and Link Tracker windows can be synchronized by<br />
selecting the Synchronize button .<br />
105
<strong>LeCroy</strong> <strong>SATracer</strong>/<strong>Trainer</strong> Analyzer User’s <strong>Manual</strong> SW Version 4.6<br />
Zooming In and Out<br />
Zooming out can give you a quick, high-level view of a trace.<br />
7.7 Frame Tracker Window<br />
The Frame Tracker window displays a detailed chronological view of<br />
traffic on a Frame-by-Frame basis. Events are shown within columns<br />
within the window, each column representing a channel. Time is presented<br />
as rows. Idle time is shown by empty rows in the window.<br />
Each time slot in the vertical axis represents the minimum time required by<br />
a Frame to traverse the bus.<br />
Opening the Frame Tracker Window<br />
To open the Frame Tracker window, select Report > Frame Tracker or<br />
click the button marked . A window opens like the one shown below:<br />
Window Layout<br />
The Frame Tracker window divides into two areas:<br />
• Toolbar - Presents buttons for changing data format.<br />
• Main Display Area - Displays traffic chronologically as it<br />
occurred in the recording. The window divides into columns: the<br />
first column shows time and traffic is shown on a channel by<br />
channel basis in the columns on the right.<br />
Frame Tracker Buttons<br />
The Frame Tracker window has a row of buttons for<br />
changing the format of the displayed data and for<br />
exporting data:<br />
106
<strong>LeCroy</strong> <strong>SATracer</strong>/<strong>Trainer</strong> Analyzer User’s <strong>Manual</strong> SW Version 4.6<br />
The buttons have the following functions:<br />
Full Screen Zoom In<br />
Synchronize Trace View.<br />
Synchronizes the Trace View and<br />
Frame Tracker windows so that a<br />
move in one window repositions the<br />
other.<br />
View Options. Opens a menu with<br />
three options: Collapsible Idle Time,<br />
Tooltip Display, and Reset Column<br />
Widths. See View Options Menu<br />
below for descriptions.<br />
View Options Menu<br />
Clicking the View Options button causes a menu to open with options for<br />
formatting the display.<br />
• Time Format- Opens a menu with options for setting the time<br />
format. There are two options:<br />
• Seconds<br />
• Clocks<br />
• Reset Column Widths - This option resets column widths to their<br />
defaults.<br />
Normally, columns will automatically resize themselves if the<br />
application window is made larger or smaller. However, if you<br />
manually resize any columns in the Frame Tracker window, column<br />
widths become static. Thereafter, if you resize the application<br />
window, the Frame Tracker columns will not adjust automatically.<br />
Reset Column Widths re-enables this automatic resizing<br />
capability.<br />
Docking and Undocking the Window<br />
You can undock the Frame Tracker window by double-clicking on the blue<br />
title bar along the left side of the window. Once undocked, the window can<br />
be dragged anywhere in the application. To redock, double-click again on<br />
the title bar.<br />
107<br />
Zoom Out
<strong>LeCroy</strong> <strong>SATracer</strong>/<strong>Trainer</strong> Analyzer User’s <strong>Manual</strong> SW Version 4.6<br />
Calculating Time between Frames<br />
In Frame Tracker, you can calculate time between Frames by clicking on an<br />
event and then positioning your mouse pointer over a second event and<br />
reading the ensuing tooltip.<br />
Step 1 Click on the time value for the first event.<br />
Step 2 Scroll down through the trace to the second event and position the<br />
mouse pointer above its time value. A tooltip will appear showing<br />
the time interval between the first and second events.<br />
Hiding Traffic<br />
You can hide Aligns, Channels and other data from the Frame Tracker<br />
window by clicking the Hide buttons on the toolbar in the Trace window<br />
or by selecting one or more of the various Hide options in<br />
the Display Options dialog box.<br />
Searching<br />
When the Trace view and Frame Tracker windows are synchronized, the<br />
Find and Go To options in the Search menu will apply to the Frame Tracker<br />
window. The Trace and Frame Tracker windows can be synchronized by<br />
selecting the Synchronize button .<br />
Zooming In and Out<br />
Zooming out can give you a quick, high-level view of a trace.<br />
108
<strong>LeCroy</strong> <strong>SATracer</strong>/<strong>Trainer</strong> Analyzer User’s <strong>Manual</strong> SW Version 4.6<br />
8. Searching Traces<br />
<strong>SATracer</strong> has several search commands that enable you to navigate a trace<br />
in search of key events such as errors and triggers. These commands are<br />
launched from the Search menu.<br />
To view the search options, click Search in the Menu bar.<br />
8.1 Go to Trigger<br />
To display a Trigger Event, select Go to Trigger from the Search menu.<br />
The Trace View is repositioned with the first Frame following the Trigger<br />
event (or the Frame that caused the Trigger) at the top of your screen.<br />
8.2 Go to Event ...<br />
To display a specific Frame or higher decode level, follow these steps:<br />
Step 1 From the Search menu, select Go to Event ...<br />
The Go to Event window appears.<br />
Step 2 From the Go To pull-down menus,<br />
select Frame, Time, or Markers (if<br />
present).<br />
If you select Frame, a menu of decode<br />
levels will appear. Select the decode<br />
level of interest (if it does not appear, you may have to press a<br />
decode button on the toolbar). Then enter an event number in the<br />
text box to the right.<br />
109
<strong>LeCroy</strong> <strong>SATracer</strong>/<strong>Trainer</strong> Analyzer User’s <strong>Manual</strong> SW Version 4.6<br />
If you select Time, a text box will appear prompting you to enter a<br />
time value.<br />
If you select Marker, a list of Markers in the trace will appear. Select<br />
a Marker from the list.<br />
Step 3 Click OK.<br />
8.3 Go to Marker<br />
The trace view is repositioned with the selected item at the top of<br />
your screen.<br />
To instruct the Analyzer to display a marked Frame, follow these steps:<br />
Step 1 From the Search menu, select Go to Marker.<br />
Step 2 Select the desired Frame from the displayed list.<br />
The Trace View is repositioned with the selected item at the top of<br />
your screen.<br />
Selecting Search > Go to Marker > All Markers will cause a<br />
dialog box to open with a list of all markers in the trace. The dialog<br />
box offers options for editing, deleting, and copying markers.<br />
Note The Go to Marker feature functions in conjunction with the Set<br />
Marker feature. The comments within the parentheses<br />
following each marked Frame are added or edited with the Set<br />
Marker feature. Please refer to Set Marker in Reading a<br />
<strong>CATC</strong> Trace.<br />
110
<strong>LeCroy</strong> <strong>SATracer</strong>/<strong>Trainer</strong> Analyzer User’s <strong>Manual</strong> SW Version 4.6<br />
8.4 Go To<br />
8.5 Find<br />
The Go To feature takes you directly to an event in a Trace by allowing you<br />
to search by a specific criteria. Only the items present in a trace will be<br />
displayed in the Go to menu. If an item is not present in a trace, it is greyed<br />
out in the menu.<br />
To apply the previous Find parameters to the next search, select Find Next<br />
from the Search menu.<br />
Find is a utility for conducting searches of one or more events within a<br />
trace. Find allows you to search different hierarchical levels within the trace<br />
- Frames, Transactions, SCSI Operations, and Mgt Transactions. To start<br />
find,<br />
• Select Find... under Search on the Menu Bar<br />
OR<br />
Click in the Tool Bar.<br />
111
<strong>LeCroy</strong> <strong>SATracer</strong>/<strong>Trainer</strong> Analyzer User’s <strong>Manual</strong> SW Version 4.6<br />
You see the User-Defined Find Events screen:<br />
The Find window divides into three areas:<br />
Left area -- Display options for setting the search level, direction and<br />
origin. The top left box is context-sensitive. In order for the Transactions,<br />
SCSI Operations, and Management Transactions to be active, you will<br />
need to decode these levels in the trace.<br />
The left area includes two options at the bottom:<br />
• Find All - Finds all specified events and extracts the results to a<br />
new window.<br />
• Search in Hidden - Searches for specified events in all of the<br />
trace - including in traffic currently hidden from the display via<br />
the Hide buttons.<br />
Center area -- Controls the event groups to be searched. The selection you<br />
make will display further choices on the right side of the Find window. At<br />
the bottom are three options called Union, Intersection, and Exclusion that<br />
are used with multi-criteria searches. These options are explained below.<br />
Right area -- Controls the specific events to be searched within the trace.<br />
The box in this right section displays events from the selected Event Group.<br />
112
<strong>LeCroy</strong> <strong>SATracer</strong>/<strong>Trainer</strong> Analyzer User’s <strong>Manual</strong> SW Version 4.6<br />
The right area is context sensitive - the Event Group selected in the Center<br />
Area determines what types of events display on the right. For example, if<br />
"Primitive Type" is selected, the right area will display a list of Primitive<br />
types. Bold entries indicate items that actually occurred in the trace.<br />
In the example shown above, Primitive Types is selected. The right side of<br />
the screen shows all of the Primitive Types that occurred in the displayed<br />
trace.<br />
Complex Searches<br />
When conducting complex searches in the Find<br />
dialog box, you first push a decode button in the<br />
toolbar to enable Frames, Transactions, SCSI<br />
Operations, or Management Transactions in the<br />
Search for... box.<br />
In this example, all of the Search for choices are<br />
enabled, and Frames is selected. The Event Groups box in the Find dialog<br />
contains available choices based on the selection.<br />
After you have selected a choice in the Event<br />
Groups, the box on the right of the Find<br />
window will present choices based on your<br />
selection. In the following example, the box<br />
displays the primitive types that are available<br />
in the trace:<br />
Event Groups<br />
Event Groups are categories of events that can<br />
occur in a trace. Clicking on an Event Group<br />
will display a list of Event types on the right<br />
side of the Find window that occur within each<br />
Event Group.<br />
Union, Intersection, and Exclusion<br />
If multiple events are selected, use the options Union or Intersection to<br />
conduct the search.<br />
Union is used to search for any selected event: "Find x or y." Union lets you<br />
tell the Analyzer to search the trace for any of any of the selected items.<br />
Intersection is used to search for all selected events: "Find x and y."<br />
Intersection lets you tell the Analyzer to search the trace for any packet<br />
having all of the selected events.<br />
113
<strong>LeCroy</strong> <strong>SATracer</strong>/<strong>Trainer</strong> Analyzer User’s <strong>Manual</strong> SW Version 4.6<br />
Using Find<br />
Exclusion is used to exclude selected traffic from the trace. Exclusion is<br />
used with Union and Intersection --i.e., you select Exclusion with Union or<br />
Intersection.<br />
• Exclusion + Union -- Exclude packets with any of the specified events.<br />
• Exclusion + Intersection -- Exclude packets with all of the specified events.<br />
Step 1 Select the display level to be searched from the Search For box on<br />
the left side of the window.<br />
For example, to search through Commands, select Commands. The<br />
display level affects options presented in the Events Group box.<br />
Step 2 Select a search direction and origin.<br />
Step 3 Select one or more events from the Events Group box.<br />
Your choices will affect options displayed on the right side of the<br />
dialog.<br />
Step 4 If you have selected two or more criteria, then select either:<br />
• Union: Find all packets that match ANY of the specified events.<br />
• Intersection: Find all packets that match ALL of the specified events.<br />
If you want to selected events from the trace, then select:<br />
• Exclusion: Exclude all packets that match any of the specified events.<br />
Step 5 Click OK. The search then occurs, and the results display.<br />
Find Next<br />
To apply the previous Find parameters to the next search,<br />
Select Find Next under Search on the Menu Bar<br />
OR<br />
Click on the Tool Bar.<br />
When Link Tracker is open and Find Next is used, the software repositions<br />
the LinkTracker (and other views) on the next frame containing the same<br />
primitive. For example, when using Find Next to search for SATA_SYNC<br />
114
<strong>LeCroy</strong> <strong>SATracer</strong>/<strong>Trainer</strong> Analyzer User’s <strong>Manual</strong> SW Version 4.6<br />
primitives - the display will select the next primitive in time starting from<br />
the specified origin (top of the screen, beginning of the file, last match),<br />
regardless of which frame and which recording channel it occurred.<br />
When using Find Next for primitives, the search order will be as shown<br />
115
<strong>LeCroy</strong> <strong>SATracer</strong>/<strong>Trainer</strong> Analyzer User’s <strong>Manual</strong> SW Version 4.6<br />
116
<strong>LeCroy</strong> <strong>SATracer</strong>/<strong>Trainer</strong> Analyzer User’s <strong>Manual</strong> SW Version 4.6<br />
9. External Interface for Trigger In /Out<br />
With each 10K analyzer, <strong>LeCroy</strong> includes two mechanisms for low latency<br />
communications with general purpose test and measurement equipment:<br />
• BNC Trigger in / out - This connection can be used to send<br />
clocking information and recording commands from one analyzer<br />
to another (see "Setup for Cascaded Muliple Analyzer Use in<br />
Section 10.3). The BNC interface can also be used for transmitting<br />
and receiving trigger in / out signals from general purpose<br />
instruments such as a <strong>LeCroy</strong> Oscilloscope or an InFusion Error<br />
Injection system.<br />
• Break out board - The break-out board utilizes a LV TTL level<br />
signal which can provide a simple trigger in/out interface to the<br />
analyzer. It can also be used to configure the analyzer to trigger on<br />
a specific bit pattern received on the break out board data pins.<br />
9.1 BNC External Trigger In / Out<br />
The BNC External Trigger Out capability allows users to specify protocol<br />
level events as Trigger Out signals to external instruments. This provides a<br />
mechanism for SAS or SATA link layer errors detected on the analyzer to<br />
trigger an attached oscilloscope. The BNC Trigger In provides a similar<br />
mechanism allowing physical layer instruments to signal the analyzer to<br />
start capture at a specific instant.<br />
Using the BNC Trigger Out<br />
Step 1 Attach the BNC Trigger Out connector to an appropriate BNC<br />
Trigger In connector on a general purpose test instrument using the<br />
provided BNC cable<br />
Step 2 In the <strong>SATracer</strong> software, under Recording Options, select the<br />
Recording Rules Tab<br />
Step 3 Select the New Event button and specify the protocol level event<br />
desired to initiate the external Trigger Out signal<br />
117
<strong>LeCroy</strong> <strong>SATracer</strong>/<strong>Trainer</strong> Analyzer User’s <strong>Manual</strong> SW Version 4.6<br />
Step 4 Under the Actions Tab, Select the type of External Trigger signal<br />
suitable for the external instrument. The 10K chassis support three<br />
external trigger-out signal types:<br />
• Pulse High<br />
• Pulse Low<br />
• Pulse Toggle<br />
Note: In each case, the BNC signal transmits an LV TTL level signal<br />
Step 5 Select Trigger Analyzer on the Actions Tab if you intend to record<br />
protocol level traffic simultaneously while using the BNC External<br />
Trigger Out signal<br />
Step 6 Press the Record button to arm the analyzer. Trigger indicator on<br />
the analyzer faceplate will indicate when the trigger condition has<br />
been detected by the analyzer system.<br />
Using the BNC Trigger In<br />
Step 1 Attach an appropriate BNC Trigger Out connector on a general<br />
purpose test instrument to the BNC Trigger In connector using the<br />
provided BNC cable.<br />
118
<strong>LeCroy</strong> <strong>SATracer</strong>/<strong>Trainer</strong> Analyzer User’s <strong>Manual</strong> SW Version 4.6<br />
Step 2 In the <strong>SATracer</strong> software, under Recording Options, select the<br />
General Tab and click the radio button Event Trigger under<br />
Recording Type<br />
Step 3 Select the Recording Rules Tab. Remove all triggering events from<br />
the Recording rules (Filtering options can be retained - see<br />
Recording Rules screen image below)<br />
Step 4 Press Record > Start button to arm the analyzer. The analyzer will<br />
indicate it is waiting for a trigger. Any edge detected on the Trigger<br />
In signal will stop the recording and fill the buffer on the analyzer.<br />
Note: Voltage required on the edge condition is 0 to.8V low, 2.0V to 3.3V high. 40nS is<br />
the approximate detection threshold for the BNC Trigger In feature.<br />
Note: There is also a trigger indicator on the analyzer front panel that will indicate when<br />
the trigger condition has been detected by the analyzer.<br />
119
<strong>LeCroy</strong> <strong>SATracer</strong>/<strong>Trainer</strong> Analyzer User’s <strong>Manual</strong> SW Version 4.6<br />
9.2 External Interface Breakout Board<br />
With each analyzer, <strong>LeCroy</strong> includes an External Interface Breakout Board<br />
for accessing several potentially useful standard, LV TTL output and input<br />
signals. The breakout board also offers a simple way to connect logic<br />
analyzers or other tools to the <strong>SATracer</strong> Analyzer unit. Six ground pins and<br />
one 5-volt pin are provided.<br />
The Breakout Board connects via a<br />
cable to the Data In/Out connector<br />
located on the rear of the analyzer<br />
unit. Each signaling pin is isolated by<br />
a 100Ω series resistor and a buffer<br />
inside the Analyzer unit.<br />
9.3 Pin-Outs for the Data In/Out Connector<br />
The following table lists the pin-out and signal descriptions for the Data<br />
In/Out connector on a cable that connects to the Breakout board.<br />
Data In/Out Connector – Pin-Out<br />
Pin Signal Name Signal Description<br />
1 RSV Reserved<br />
2 GND Ground<br />
3 GP OUT General Purpose Output<br />
4 TRG IN 1 Trigger In 1<br />
5 GND Ground<br />
6 DATA 6 Data 6<br />
7 DATA 4 Data 4<br />
8 DATA 3 Data 3<br />
9 DATA 1 Data 1<br />
10 GND Ground<br />
11 RSV Reserved<br />
12 RSV Reserved<br />
13 +5V +5 Volts, 250 mA DC Source<br />
14 RSV Reserved<br />
15 GND Ground<br />
16 TRG OUT Trigger Out<br />
17 TRG IN 0 Trigger In 0<br />
18 DATA 7 Data 7<br />
19 DATA 5 Data 5<br />
20 GND Ground<br />
21 DATA 2 Data 2<br />
22 DATA 0 Data 0<br />
120<br />
Data In/Out Connector (on cable)
<strong>LeCroy</strong> <strong>SATracer</strong>/<strong>Trainer</strong> Analyzer User’s <strong>Manual</strong> SW Version 4.6<br />
Pin Signal Name Signal Description<br />
23 GND Ground<br />
24 RSV Reserved<br />
25 RSV Reserved<br />
Note: (*) Pins 4 and 17 have the same function: they allow external<br />
signals to be used to cause triggering or recording. Pins 3 and 16<br />
are used to transmit output signals. Pins 6, 7, 8, 9, 18, 19, 21, and<br />
22 (data pins) are used to define data patterns for external input<br />
signals. See External Input Signals in Chapter 6.<br />
External Interface Breakout Board<br />
Prototype Rework Area<br />
The Breakout Board contains a prototype rework area for making custom<br />
circuits for rapid development. The area consists of plated-through holes, 20<br />
columns wide by 27 rows long. The top row of holes is connected to GND<br />
and the bottom row is connected to +5V. The remaining holes are not<br />
connected. Use the rework area to insert custom components and wire-wrap<br />
their respective signal, power, and ground pins.<br />
121
<strong>LeCroy</strong> <strong>SATracer</strong>/<strong>Trainer</strong> Analyzer User’s <strong>Manual</strong> SW Version 4.6<br />
9.4 Configuring Input Signaling through the Breakout<br />
Board<br />
To configure the analyzer to trigger on an input signal from the breakout<br />
board, perform the following steps:<br />
Step 1 Select Setup > Recording Rules to open the Recording Options<br />
dialog. The Recording Rules page will display.<br />
Step 2 Click the New Events button to open the New Events menu.<br />
Step 3 Select Breakout Board Data from the New Events menu. This will<br />
cause a button to appear in the Available Events area. The button<br />
will be labeled Breakout Board.<br />
Step 4 Drag the new button to the Global State Cell or to the cell faintly<br />
marked Drag an event here to add another state. The Global<br />
State Cell allows you to set conditions that are globally true (i.e.,<br />
always enabled). The cell marked Drag an event here to add<br />
another state is used to create event sequences - i.e., chains of<br />
events leading to a trigger or other action. For further explanation,<br />
see “Assigning an Action” on page 46.<br />
Step 5 Right-click on the Breakout Board button to open a pop-up menu.<br />
Step 6 Select Properties from the pop-up menu. The Properties dialog<br />
122
<strong>LeCroy</strong> <strong>SATracer</strong>/<strong>Trainer</strong> Analyzer User’s <strong>Manual</strong> SW Version 4.6<br />
opens.<br />
Step 7 If you want to configure the analyzer to trigger on a specific bit<br />
pattern, enter it in the box marked Byte0. Alternatively, you can<br />
enter a hex pattern and mask into the boxes marked Mask and<br />
Match. If no pattern is specified, the analyzer will trigger on ANY<br />
input signal.<br />
Step 8 Click the tab marked Actions.<br />
Step 9 In the Internal Triggering section, select Trigger Analyzer. The<br />
analyzer is now configured to trigger on an input signal.<br />
123
<strong>LeCroy</strong> <strong>SATracer</strong>/<strong>Trainer</strong> Analyzer User’s <strong>Manual</strong> SW Version 4.6<br />
124
<strong>LeCroy</strong> <strong>SATracer</strong>/<strong>Trainer</strong> Analyzer User’s <strong>Manual</strong> SW Version 4.6<br />
10. Networking <strong>SATracer</strong><br />
<strong>SATracer</strong> has networking and cascading functions that are described in this<br />
chapter.<br />
• Cascading -- Allows two to four analyzers be linked (or "cascaded")<br />
together into a single, synchronized, logical unit in order to increase the<br />
number of ports that can be monitored. To enable synchronized<br />
multi-analyzer recording, the analyzers are connected together via their<br />
BNC connectors on the back of the analyzers. This connection is used<br />
to send clocking information and recording commands are sent from one<br />
analyzer to another.<br />
• Networking -- <strong>SATracer</strong> can be run remotely over an IP LAN. Using<br />
the Network browse dialog, you can remotely control one or more<br />
analyzers.<br />
10.1 Working with Multiple Analyzers<br />
Multiple <strong>SATracer</strong> analyzers can be set up in three ways:<br />
Directly Connected by USB - Two or more analyzers can be connected to<br />
a single host PC via USB. In this setup, no additional cables are used (as<br />
they are in a Cascaded setup) and the analyzers function as non-cascaded,<br />
standalone units. Users toggle back and forth between the units.<br />
Cascaded - Two or more local analyzers linked by BNC. One (or all) of the<br />
analyzers then connect via USB to a host PC.<br />
The BNC cable functions to transmit clocking and control information<br />
between the analyzers, thereby allowing the analyzers to function as a<br />
cascade - i.e., a single, logical analyzer. Cascading analyzers allows them<br />
to perform synchronized, multi-analyzer recordings.<br />
Connected Remotely over an IP Network - A PC connected to analyzers<br />
across an IP network.<br />
125
<strong>LeCroy</strong> <strong>SATracer</strong>/<strong>Trainer</strong> Analyzer User’s <strong>Manual</strong> SW Version 4.6<br />
10.2 Hardware Setup for Direct USB Connections<br />
Connecting multiple analyzers to a single PC by USB gives you the<br />
convenience of being able to control multiple analyzers from a single<br />
<strong>SATracer</strong> application. The application provides you with a means of<br />
toggling back and forth between the analyzers.<br />
To set up multiple analyzers via<br />
USB, you attach USB cables<br />
between the analyzers and the host<br />
PC as shown in the illustration on<br />
the right. If you do not intend to<br />
group the analyzers together for<br />
synchronized multi-analyzer recordings, no further hardware setup is<br />
required. If you do intend to group the analyzers, then you will need to add<br />
BNC cables as described in the section below under "Setup for Multiple<br />
Analyzer Use." Once the analyzers are connected and started, you can<br />
browse to the analyzers via the command Setup > Analyzer Network ...<br />
Note The <strong>SATracer</strong> software will allow you to toggle between the<br />
analyzers but not run two copies of <strong>SATracer</strong> software on your<br />
screen simultaneously.<br />
10.3 Setup for Cascaded Multiple Analyzer Use<br />
If you add a BNC connection<br />
between the analyzers shown<br />
above, you create a cascade which<br />
allows the analyzers to function<br />
together as a logical unit.<br />
Cascading increases the numbers<br />
of ports that can be simultaneously recorded.<br />
To set up a cascade, you connect a BNC cable between<br />
the External Output port on the back of one analyzer to<br />
the input port on the second. The first analyzer will<br />
serve as the controlling or master analyzer. It will<br />
transmit clocking information, Recording Option<br />
commands and other data to the other analyzers. If you<br />
plan to group three or four analyzers together,<br />
daisy-chain the remaining analyzers together, and then<br />
loop the output of the last analyzer to the input of the<br />
first analyzer as shown in the figure on the right.<br />
126
<strong>LeCroy</strong> <strong>SATracer</strong>/<strong>Trainer</strong> Analyzer User’s <strong>Manual</strong> SW Version 4.6<br />
10.4 Set Up for Remote Access over an IP LAN<br />
<strong>SATracer</strong>s can be run<br />
remotely over an IP<br />
network. In an IP<br />
network, the analyzers<br />
connect their respective<br />
hosts via USB and the<br />
hosts, in turn, connect to each other via IP.<br />
Setup involves installing <strong>SATracer</strong> software on each analyzer host, then<br />
enabling IP LAN connectivity between the hosts.<br />
When the remote analyzer is powered on, you connect remotely control the<br />
analyzer via its host. Your connection will be Local host => Remote host<br />
=> Analyzer.<br />
Use the command Setup > Analyzer Network to browse to the remote host.<br />
You can cascade IP-connected analyzers by adding BNC connections<br />
between the analyzers as described above in “Setup for Cascaded Multiple<br />
Analyzer Use” on page 126.<br />
10.5 Configuring the Connection<br />
Once you have completed the physical setup, you are ready to configure the<br />
analyzer connection.<br />
USB-Connected Analyzers<br />
Configuration for two or more USB connected analyzers is minimal.<br />
In the following example, two analyzers are linked via USB to a host PC.<br />
You connect to one of the two analyzers.<br />
Step 1 Start the <strong>SATracer</strong> analyzers and the <strong>SATracer</strong> software.<br />
Step 2 From the menu, select Setup > All Connected Devices.<br />
The Analyzer Network dialog box opens. To select an analyzer,<br />
check the relevant checkbox on the left.<br />
127
<strong>LeCroy</strong> <strong>SATracer</strong>/<strong>Trainer</strong> Analyzer User’s <strong>Manual</strong> SW Version 4.6<br />
Step 3 Click Close.<br />
The dialog box closes and the analyzer is selected. The <strong>SATracer</strong><br />
software on your screen will now control the selected analyzer.<br />
Note You can update the Firmware, BusEngine and License from this<br />
dialog by checking an analyzer and then clicking the appropriate<br />
button on the right. You can also directly open and set<br />
Recording Options for any of the analyzers by checking one or<br />
more analyzers and then clicking the Recording Options button.<br />
The Recording Options dialog will open. The settings you create<br />
will apply to all selected analyzers.<br />
Remote Analyzers Over an IP Network<br />
To configure <strong>SATracer</strong> to remotely control an analyzer over an IP LAN,<br />
you will need to use the Analyzer Network dialog to browse to the host<br />
controlling the analyzer and add both the host and its PC to the dialog.<br />
Step 1 From the menu, select Setup > Analyzer Network.<br />
The Analyzer Network dialog box opens. This dialog lists host PCs<br />
and their analyzers. The listed devices are either currently connected<br />
or were connected at some point previously.<br />
Step 2 Remove any host (other than the Local Machine) from the list by<br />
selecting the host and then clicking Remove.<br />
You should keep in the list only the host(s) that you are planning to<br />
immediately use.<br />
Step 3 To add a host and analyzer to the list, click Add.<br />
128
<strong>LeCroy</strong> <strong>SATracer</strong>/<strong>Trainer</strong> Analyzer User’s <strong>Manual</strong> SW Version 4.6<br />
A browse dialog box opens.<br />
Step 4 Browse to the host that has an analyzer attached to it and double<br />
click on it.<br />
Step 5 The host will be added to the Analyzer Network dialog.<br />
Step 6 Click Close to close the dialog box.<br />
Step 7 Select Setup > All Connected Devices ... to open the Analyzer<br />
Devices dialog box.<br />
Step 8 Uncheck all boxes except for the one for the remote analyzer that<br />
you wish to connect to.<br />
Step 9 Click Close to close the dialog box and establish a connection to the<br />
selected analyzer.<br />
Configuring Cascaded Multiple Analyzers<br />
To configure analyzers to work as a group (i.e., into a cascade), attach BNC<br />
cables as described “Setup for Cascaded Multiple Analyzer Use” on page<br />
126, then perform the following steps:<br />
Step 1 Perform Steps 1 and 2 as described above in “USB-Connected<br />
Analyzers” on page 127.<br />
The Analyzer Devices dialog box will open.<br />
Step 2 In the Analyzer Devices dialog box, verify that the checkboxes are<br />
checked for the cascaded analyzers.<br />
Step 3 Click Close.<br />
The dialog closes and the analyzers are selected.<br />
129
<strong>LeCroy</strong> <strong>SATracer</strong>/<strong>Trainer</strong> Analyzer User’s <strong>Manual</strong> SW Version 4.6<br />
Step 4 Test the setup by recording some traffic.<br />
If the analyzers are not connected by the BNC cables, an error<br />
message will appear prompting you to correct the problem.<br />
10.6 Network Chat<br />
Analyzer Network Chat is a utility that allows users to conduct chat<br />
sessions over an IP LAN.<br />
In order to send and receive electronic text messages, each user must be<br />
working with a PC that is attached to an analyzer. And each PC must, in<br />
turn, be connected to an IP LAN.<br />
To start a chat session,<br />
Step 1 Select View > Analyzer Network Chat Bar from the menu. The<br />
following dialog opens.<br />
Step 2 Click in the cell at the bottom of the window and type some text.<br />
Step 3 Click Send. The sent text will appear in the top of the window next<br />
to your prompt.<br />
130
<strong>LeCroy</strong> <strong>SATracer</strong>/<strong>Trainer</strong> Analyzer User’s <strong>Manual</strong> SW Version 4.6<br />
11. Traffic Generation with SA<strong>Trainer</strong><br />
SA<strong>Trainer</strong> is traffic generation software that runs on the SAS/SATA<br />
Exerciser hardware module. SA<strong>Trainer</strong> can emulate a SATA host or<br />
device.<br />
Traffic generation enables engineers to test designs under realistic<br />
conditions and to transmit known errors, allowing engineers to observe how<br />
devices handle faulty link conditions.<br />
Traffic generation is performed via the execution of text-based scripts.<br />
These scripts contain statements about the types of traffic to be generated.<br />
11.1 SAS/SATA Exerciser Hardware<br />
The SA<strong>Trainer</strong> software requires both the SAS/SATA Analyzer module<br />
and the SAS/SATA Exerciser module that plugs into the right slot of the<br />
UPAS 10K.<br />
11.2 Cabling SAS/SATA Exerciser for Host Emulation<br />
Connect the SATA cable from<br />
the SAS/SATA Exerciser To<br />
Target port to the Device port<br />
on the unit under test. This<br />
transmits the Traffic<br />
Generator stream from the To<br />
Target port on the SAS/SATA<br />
Exerciser to the Device-side<br />
port on the unit under test.<br />
131
<strong>LeCroy</strong> <strong>SATracer</strong>/<strong>Trainer</strong> Analyzer User’s <strong>Manual</strong> SW Version 4.6<br />
11.3 Cabling SAS/SATA Exerciser for Device Emulation<br />
Connect the SATA cable from<br />
the SAS/SATA Exerciser To<br />
Initiator port to the Host-side<br />
port on the unit under test. This<br />
transmits the Traffic Generator<br />
stream from the To Initiator<br />
port on the SAS/SATA<br />
Exerciser to the Host-side port<br />
on the unit under test.<br />
11.4 Generating Traffic<br />
Generating traffic using the SA<strong>Trainer</strong> is a two step process. First,<br />
text-based Traffic Generator file must be created. This file can be created<br />
through a special conversion command in <strong>SATracer</strong> that converts a trace<br />
file into a traffic generator file. Alternatively, you can edit an existing file<br />
or write your own.<br />
This text file is named with an .ssg extension. Once the file has been created,<br />
in can be opened and displayed in the SASTracer application. You can<br />
invoke the SASTracer application to transmit the traffic generation file by<br />
using the Traffic Signal button .<br />
Creating a Traffic Generation File with SASTracer<br />
The easiest way to create a Traffic Generation file is to convert an <strong>SATracer</strong><br />
trace file (*.sas) into a *.ssg file. This is done with the Export function in<br />
<strong>SATracer</strong>.<br />
Step 1 Open a trace file.<br />
Step 2 From the menu, select File>Export>to Generator File Format<br />
132
<strong>LeCroy</strong> <strong>SATracer</strong>/<strong>Trainer</strong> Analyzer User’s <strong>Manual</strong> SW Version 4.6<br />
(.ssg). The Export to Generator Text screen appears.<br />
There are several options:<br />
File Name - Enter a user-defined file name.<br />
Save As Type - There is but one option: SAS<strong>Trainer</strong> Generator<br />
Files (.ssg). This file type is used by both SAS<strong>Trainer</strong> and<br />
SA<strong>Trainer</strong> to generate traffic.<br />
Link and Direction - Select the source and direction of the traffic<br />
you are going to export into a traffic generation file. You can only<br />
export a single uni-directional link (for example, I1).<br />
Do not export hidden packets - If selected, will only export traffic<br />
that is currently displayed onscreen. Traffic hidden via the various<br />
hide buttons will not be exported into the traffic generation file.<br />
Use Auto Alignment - If selected, exports Auto Aligns to the traffic<br />
generation file.<br />
From - (Optional) Enter the range of traffic (in Frames, Markers, or<br />
Time) to be exported. The default is to export all traffic in the open<br />
trace.<br />
Step 3 Select the desired options, the click Save.<br />
A Generator file (*.ssg) has now been created and can be read with the<br />
<strong>SATracer</strong>/<strong>Trainer</strong> application.<br />
133
<strong>LeCroy</strong> <strong>SATracer</strong>/<strong>Trainer</strong> Analyzer User’s <strong>Manual</strong> SW Version 4.6<br />
11.5 Opening a Traffic Generation File<br />
Once the Traffic Generation file (*.ssg) file has been created, you can then<br />
open it in the <strong>SATracer</strong> application.<br />
To open a Traffic Generation file,<br />
Step 1 Select Open under File on the Menu Bar<br />
OR<br />
Click on the Tool Bar.<br />
Step 2 Select a Generator text file (*.ssg) and click Open. If needed,<br />
navigate to the install directory. For samples, see the install<br />
directory. The Generator file appears in a Trace view, shown<br />
below:<br />
Layout<br />
The .ssg file will show several colored bars across the screen that represent<br />
global settings. The bars serve to show how the generation file is currently<br />
configured. These settings include the link speed (1.5 Gbps vs. 3.0 Gbps),<br />
the type of device (SATA Host or Device), COMINIT, COMWAKE and<br />
some other settings. As changes are made and saved to the traffic generation<br />
file, the bars will immediately update.<br />
134
<strong>LeCroy</strong> <strong>SATracer</strong>/<strong>Trainer</strong> Analyzer User’s <strong>Manual</strong> SW Version 4.6<br />
The actual traffic pattern that is about to be generated appears below the bars<br />
as a series of Frames. In the generation file shown in the above screenshot,<br />
the first generation Frame is a Start of Address Frame labeled as Frame 8.<br />
You can edit the traffic generation file to add, edit or remove frames.<br />
11.6 Starting the Script Editor<br />
To edit an .ssg file, use the Script Editor. The Script Edit is an editing tool<br />
that will display the .ssg file and its supporting Include files.<br />
To launch the Script Editor: click the Script Editor button on the toolbar<br />
or right-click in the trace window and choose Edit as Text.<br />
The Script Editor window will open and display in the lower portion of the<br />
trace window.<br />
The Script Editor divides into three areas: the toolbar, the script window,<br />
and the file tabs at the bottom of the window. If errors occur, a log will open<br />
at the bottom of the window.<br />
135
<strong>LeCroy</strong> <strong>SATracer</strong>/<strong>Trainer</strong> Analyzer User’s <strong>Manual</strong> SW Version 4.6<br />
Toolbar<br />
The toolbar contains buttons for saving your edits, navigating, searching<br />
and other functions.<br />
The buttons have the following functions:<br />
Save. Saves your edits and<br />
immediately updates the setting bars<br />
and Frames shown in the trace<br />
window.<br />
View Options. Opens a menu with<br />
three options: Enable Outlining,<br />
Toggle Outlining, and Line Numbers.<br />
See View Options Menu below for<br />
descriptions.<br />
View Options Menu<br />
The View Options button has a menu with three options:<br />
• Enable Outlining - Adds an expandable/collapsible<br />
tree structure to the left side of the Script Editor<br />
showing the hierarchical relationship of the script lines.<br />
• Show Line Numbers - Adds line numbers to the left<br />
side of the Script Editor window.<br />
• Show Tooltips - Displays tooltips in the editor window.<br />
• Toggle Outlining - Toggles the outline tree between collapsed and<br />
expanded states.<br />
136<br />
Go to next bookmark.<br />
Go to previous bookmark.<br />
Cut. Clear all bookmarks.<br />
Copy. Find.<br />
Paste. Find and Replace.<br />
Undo. Print.<br />
Redo. Go to Definition.<br />
Add/Remove bookmark. Allows<br />
markers to be set or removed to aid in<br />
navigation.<br />
Open File Under Cursor. Opens<br />
whatever file has been pointed to<br />
with the mouse in the script.<br />
This command works with<br />
Include statements.
<strong>LeCroy</strong> <strong>SATracer</strong>/<strong>Trainer</strong> Analyzer User’s <strong>Manual</strong> SW Version 4.6<br />
Pop-up Menu<br />
Right click anywhere in the<br />
script window to open a<br />
pop-up menu with the<br />
following options:<br />
Cut - Cuts selected text.<br />
Copy - Copies selected text.<br />
Paste - Pastes selected text.<br />
Go to Definition of - Repositions the script window to whatever definition<br />
has been selected.<br />
Open File - Opens whatever file has been pointed to with the mouse in the<br />
script. This command works with Include statements - for example,<br />
"%include "Generation\Include\PrimitivesDecl.inc".<br />
Close File - Closes whatever script file is currently being displayed.<br />
Enable Outlining, Toggle Outlining, and Line Numbers - Enables the<br />
three options described above under View Options Menu.<br />
File Tabs<br />
At the bottom of the window are a series of tabs that allow the .ssg file and<br />
its supporting Include files to be opened and edited. The Include files open<br />
automatically when the software first reads the script.<br />
Error Log<br />
Whenever you create a scripting error, a log will open at the bottom of the<br />
application window. When the error is corrected, the window automatically<br />
closes.<br />
137
<strong>LeCroy</strong> <strong>SATracer</strong>/<strong>Trainer</strong> Analyzer User’s <strong>Manual</strong> SW Version 4.6<br />
11.7 Overview of Generation & Global Settings Files<br />
Sample .ssg files and Include files reside in two<br />
directories called \Samples and \Include that are<br />
typically installed in:<br />
C:\Program Files\<strong>CATC</strong>\<strong>SATracer</strong>\Generation.<br />
Traffic Generation (*.ssg) Files<br />
The .ssg traffic generation files are text files consisting of include<br />
statements, a generation block and, optionally, global statements.<br />
The generation block is the code responsible for the actual traffic<br />
generation. It is marked by the tag "Generation." The composition and<br />
format of the generation block is described later.<br />
The include statements provide links to the Include files which, in turn,<br />
provide the definitions for primitives, frames, and "global settings" - i.e.,<br />
settings that hold for most or all of the generation session.<br />
The definitions for SAS and SATA traffic are contained in<br />
<strong>LeCroy</strong>-provided Include files: Settings.inc, PrimitivesDecl.inc,<br />
AddressFramesDecl.inc, SSPFrames.inc, SMPFrames.inc and<br />
SSPFrames.inc.<br />
Settings.inc File<br />
The Settings.inc file contains global statements about the link, the type of<br />
device being emulated, and other conditions that are to exist throughout part<br />
or all of the traffic generation. This file must be included in the traffic<br />
generation file.<br />
There are fifteen groups of settings in this file:<br />
• AutoMode<br />
• COMINIT/COMRESET OOB Signal<br />
• COMWAKE OOB Signal<br />
• COMSAS OOB Signal<br />
• Generation Commands<br />
138
<strong>LeCroy</strong> <strong>SATracer</strong>/<strong>Trainer</strong> Analyzer User’s <strong>Manual</strong> SW Version 4.6<br />
• Link Speed<br />
• SATA Link Initialization<br />
• SAS Speed Negotiation<br />
• SATA Speed Negotiation<br />
• Autowait:<br />
• SAS After<br />
• SAS Before<br />
• SATA After<br />
• SATA Before<br />
• Wait Command Timeout<br />
• Scrambling Mode<br />
Details about each group of settings are described in the following chapter<br />
Traffic Generation Language.<br />
Editing Settings.inc<br />
Text in the Settings.inc file can be edited directly or copied into the<br />
beginning of the traffic generation file and edited there. Many users opt for<br />
this latter approach.<br />
When editing global settings, keep in mind the following rule:<br />
• The last line encountered before the generation block takes<br />
precedence. Thus, if the following two lines about the device<br />
emulation were added just above the generation block, the second<br />
would take effect:<br />
set GenerationMode = GEN_MODE_SATA_HOST<br />
set GenerationMode = GEN_MODE_SATA_DEVICE<br />
139
<strong>LeCroy</strong> <strong>SATracer</strong>/<strong>Trainer</strong> Analyzer User’s <strong>Manual</strong> SW Version 4.6<br />
The Global Setting "AutoAlign"<br />
AutoAlign is a global setting that may be on or off depending on the type of<br />
device you are emulating. There is an AutoAlign setting for SAS and one<br />
for SATA - for example, "set AutoAlignSAS = ON" and "set<br />
AutoAlignSATA=OFF."<br />
SAS - Sends AutoAligns every 2048 dwords.<br />
SATA - Sends AutoAligns every 256 dwords.<br />
If you plan to set and reset AutoAlign in the middle of traffic generation,<br />
then you need to know what the defaults are for AutoAlign. The defaults<br />
are as follows:<br />
For SATA host/device emulation, then<br />
• AutoAlignSATA is assumed to be ON<br />
• AutoAlignSAS is assumed to be OFF.<br />
For SAS emulation, then the assumptions are opposite:<br />
For STP,<br />
• AutoAlignSATA is assumed to be OFF<br />
• AutoAlignSAS is assumed to be ON<br />
• AutoAlignSAS and AutoAlignSATA are assumed to be ON<br />
140
<strong>LeCroy</strong> <strong>SATracer</strong>/<strong>Trainer</strong> Analyzer User’s <strong>Manual</strong> SW Version 4.6<br />
Placing Global Settings in the Generation Block<br />
Some global settings such as AutoAlign = On/Off can be set and reset in the<br />
generation block. For example, a user might want to set SASAutoAlign =<br />
ON prior to traffic generation and then have it change to OFF half way<br />
through the generation session.<br />
When placed within the generation block and then viewed in the trace<br />
window, global settings appear as colored bars interspersed amidst the<br />
traffic.<br />
141
<strong>LeCroy</strong> <strong>SATracer</strong>/<strong>Trainer</strong> Analyzer User’s <strong>Manual</strong> SW Version 4.6<br />
While most global settings can be set in the generation block, three will be<br />
ignored if placed within the generation block:<br />
set Link Speed =<br />
set GenerationMode =<br />
set SSC =<br />
These commands should be configured either in the Setting.inc file or at the<br />
beginning of the traffic generation file as a global statement.<br />
11.8 Primitive and Frame Definitions<br />
Five other Include files are provided that define the most of the known<br />
templates for Primitives and Frames. The five are:<br />
• PrimitivesDecl.inc<br />
• AddressFramesDecl.inc<br />
• SSPFramesDecl.inc<br />
• SMPFramesDecl.inc<br />
• STPFramesDecl.inc.<br />
Each of the Frame templates defines header and field structure.<br />
The default value for all Frame fields is zero.<br />
Special Conditions for Frames<br />
There are three conditions about Frames that need to be kept in mind when<br />
configuring Frame generation:<br />
1. Frame delimiters need to agree - At the present time, when defining a<br />
Frame, make sure that the Frame Prologue and Frame Epilogue agree. Do<br />
not mix types. For example, do not mix a SAS Start of Frame (SOF) with a<br />
SAS End of Address Frame (EOAF).<br />
A SAS SOF should be matched to a SAS EOF, a SAS SOAF should be<br />
matched to a SAS EOAF. If generating SATA traffic, a SATA_SOF should<br />
be matched to a SATA_EOF.<br />
At the present time, if you mix different types of prologues and epilogues<br />
for any given Frame, the Frame will be ignored.<br />
142
<strong>LeCroy</strong> <strong>SATracer</strong>/<strong>Trainer</strong> Analyzer User’s <strong>Manual</strong> SW Version 4.6<br />
2. Data Length Fields can be fixed-length or variable - By default, data<br />
Frames are of a fixed length. If you want to generate variable length<br />
Frames, then place an asterisk in the Data definition field in the<br />
SSPFramesDecl.inc file:<br />
Data : *<br />
If you replace the asterisk with a value, then the field becomes fixed length.<br />
3. CRC Calculations will be calculated by SA<strong>Trainer</strong> unless told<br />
otherwise - If the CRC is not explicitly set in the traffic generation file,<br />
SA<strong>Trainer</strong> will assume that you want it and will calculate and display it in<br />
front of the generated Frames.<br />
If the user provides a CRC value, SA<strong>Trainer</strong> will use that value even if it is<br />
incorrect. This gives the user the option of configuring the generator to<br />
create errors.<br />
If the generation file was created through the Export command (i.e., File ><br />
Export > To Generator File Format ...), the CRC is calculated but<br />
commented out. If the source trace has a bad CRC, the CRC is exported into<br />
the generation file and is not commented out.<br />
PrimitivesDecl.inc<br />
The PrimitivesDecl.inc file defines Primitives. The file consists of a<br />
declarations (left) and the corresponding byte stream (right).<br />
To generate Primitives, copy relevant portions of text on the left (i.e., not the<br />
bytes shown right) from this file into the generator block section of the .ssg<br />
file.<br />
For examples of usage, see primitives.ssg in the Samples directory.<br />
AddressFramesDecl.inc<br />
The AddressFramesDecl.inc file defines Address Frames.<br />
For examples of usage, see AddressFrames.ssg in the Samples directory.<br />
143
<strong>LeCroy</strong> <strong>SATracer</strong>/<strong>Trainer</strong> Analyzer User’s <strong>Manual</strong> SW Version 4.6<br />
SSPFrames.inc<br />
The SSPFrames.inc file defines SSP Frames.<br />
For examples of usage, see SSPFrames.ssg in the Samples directory.<br />
SMPFrames.inc<br />
The SMPFrames.inc file defines SMP frames<br />
For examples of usage, see SMPFrames.ssg in the Samples directory.<br />
STPFrames.inc<br />
The STPFrames.inc file defines STP frames<br />
For examples of usage, see STPFrames.ssg in the Samples directory.<br />
11.9 Working with Generation Files<br />
The easiest way to generate traffic is to start with one of the sample<br />
generation files and edit the settings to see how the script file behaves. As<br />
you make and save changes, the trace view of the generation file is<br />
automatically updated.<br />
144
<strong>LeCroy</strong> <strong>SATracer</strong>/<strong>Trainer</strong> Analyzer User’s <strong>Manual</strong> SW Version 4.6<br />
The following screenshots shows the sample file SSPFrames.ssg as it<br />
appears in the script editor and trace window.<br />
In the lower screenshot, global settings make up the eight bars at the top of<br />
the window. Below that are five frames. If you look at the script itself, you<br />
will see that there are six frame commands, five active and one commented<br />
out.<br />
145
<strong>LeCroy</strong> <strong>SATracer</strong>/<strong>Trainer</strong> Analyzer User’s <strong>Manual</strong> SW Version 4.6<br />
11.10 Generating Traffic<br />
Once the .ssg file has been opened onscreen, recording and traffic<br />
generation can begin at any time.<br />
Step 1 Click to begin the recording.<br />
Step 2 If the script does not have a connect block built into it, connect<br />
the exerciser to the DUT by clicking the Connect Link button<br />
. Clicking this button will cause the generator to invoke the<br />
various settings in your script (for example, the global settings)<br />
and then establish a connection.<br />
Step 3 Click the Start Generation button on the Tool Bar.<br />
While generating traffic, a bar appears on the right of the trace view,<br />
indicating that traffic generation is taking place (The green light on the<br />
Traffic signal button also blinks during traffic generation).<br />
Stop Traffic Generation<br />
Normally, traffic generation stops automatically when SA<strong>Trainer</strong> reaches<br />
the end of the Generator file.<br />
To manually stop traffic generation, Click the Stop Generation button .<br />
Resume Traffic Generation<br />
If traffic generation is stopped prior to the end of the script, it can be<br />
resumed.<br />
To resume traffic generation, Click the Stop Generation button .<br />
146
<strong>LeCroy</strong> <strong>SATracer</strong>/<strong>Trainer</strong> Analyzer User’s <strong>Manual</strong> SW Version 4.6<br />
12. SAS<strong>Trainer</strong> Generation Language<br />
The SAS<strong>Trainer</strong> File Generation Language is an API that allows you to<br />
separate traffic into text commands. These commands are used construct<br />
primitives and frames that are sent to the host or the device.<br />
12.1 File Structure<br />
Traffic Generation files (*.ssg) should have the following structure:<br />
Declarations<br />
• Global generation settings<br />
• Constants<br />
• Data patterns<br />
• Chain of symbols (primitives, raw data, etc)<br />
• Packet templates<br />
Note Some declared objects could be used in further declarations as long<br />
as they are previously declared. No forward declarations are allowed<br />
at this time.<br />
Generation blocks<br />
• List of generation instructions<br />
Note It is possible to create many generation blocks - but at current time<br />
only a block with the name 'Generation' will be executed. (Calls of<br />
some blocks from another blocks are not currently allowed)<br />
12.2 Language<br />
Comments:<br />
'#' - Comment symbol. The line remainder after this symbol will be ignored.<br />
'/*' '*/' - Comment Block. All the text between '/' '*' and '*' '/' is ignored.<br />
/*<br />
*/<br />
This is an example of a block of comments.<br />
147
<strong>LeCroy</strong> <strong>SATracer</strong>/<strong>Trainer</strong> Analyzer User’s <strong>Manual</strong> SW Version 4.6<br />
Includes:<br />
%include "FileName.inc" - This directive includes the file "FileName.inc".<br />
This lets the user add common definitions and templates into new scripts.<br />
Language parser makes sure the same file is not included more than once.<br />
Example:<br />
%include "SomeInc.inc" # This directive will actually include file<br />
'SomeInc_1.inc'<br />
%inline - The same as %include, but without the Language parser check.<br />
Settings<br />
Using the "Set "Constant Name" = Value" statement, users can set different<br />
constants/modes using the following value types:<br />
• Predefined constants (TRUE/FALSE/ON/OFF/INFINITE/etc)<br />
• Numbers<br />
Examples:<br />
Set AutoAlignSATA=ON<br />
Set WaitTimeOut=239<br />
Constants<br />
Only unsigned integers can be defined as constants. Some constants are<br />
predefined in SAS<strong>Trainer</strong><br />
Examples:<br />
Const SOME_HEX_DATA = 0xAABBFFEE # defines hexadecimal<br />
constant<br />
Const SOME_DEC_DATA = 12 # defines decimal constant<br />
Const "SOME DEC DATA" = 64 # defines decimal constant<br />
Const "Some Hex Data" = 0xCDCDBEBE<br />
Predefined Constants<br />
• TRUE<br />
• FALSE<br />
• ON<br />
• OFF<br />
• INFINITE<br />
148
<strong>LeCroy</strong> <strong>SATracer</strong>/<strong>Trainer</strong> Analyzer User’s <strong>Manual</strong> SW Version 4.6<br />
Data Patterns<br />
Data patterns are streams of hexadecimal values. Using '['']' lets the user<br />
include constants or predefined data pattern in another pattern.<br />
Examples:<br />
DataPattern PATTERN_1 = AAAABBBB [SOME_HEX_DATA]<br />
EEEEFFFF 1210ABB1 AAAABBBB 1210ABB1 AAAABBBB<br />
1210ABB1 AAAABBBB 1210ABB1 ["SOME DEC DATA"] 1210AB<br />
DataPattern PATTERN_2 = 00000000 11111111 22222222 33333333<br />
AAAABBBB 55556666 FEFEFEFE CDCDCDCD 9999BBBB<br />
12343434 6767676B 56BBFF<br />
DataPattern PATTERN_3 = [PATTERN_1] FFFFFFFF EEEEEEEE<br />
[SOME_HEX_DATA]<br />
DataPattern SOME_PATTERN = BBBBBBBB DDDDDDDD<br />
Primitives<br />
Primitives can be defined using the following:<br />
• Byte values ('k' indicates control symbol). The 10b codes are calculated<br />
based on the current running disparity<br />
• Primitives are completely interchangeable with SymChains.<br />
Example:<br />
Primitive "CHAIN (ONE)" = kBC 1E 1E 1E kBC 1A 0F<br />
SymChain ChainTwo = k28.5 D12.3 D10.2 D11.6<br />
SymChain ChainThree = k28.3 3EA 25 k18 IFA<br />
Primitive SOF = kBC 18 E4 67<br />
Primitive EOF = kBC 18 F0 9B<br />
• Raw 10 bits codes. This definition might cause running disparity errors.<br />
Example:<br />
Primitive "CHAIN (TWO)" = 305 2D4 1E4 362<br />
• Mixed bytes and 10b codes. This definition might cause running<br />
disparity errors.<br />
Example:<br />
Primitive "CHAIN (TWO)" = 305 2D4 1E4 362 ["CHAIN (ONE)"]<br />
Packets/Frames<br />
Using the "Frame" or "Packet" keyword, user can define a frame of traffic<br />
to be used in the generation stream. Declarations of prolog and epilog may<br />
be mixed with field declarations.<br />
149
<strong>LeCroy</strong> <strong>SATracer</strong>/<strong>Trainer</strong> Analyzer User’s <strong>Manual</strong> SW Version 4.6<br />
Frame "name" : "parent name"<br />
{<br />
Field Definition 0: "Field Name : Field Length = Default Value"<br />
…<br />
Field Definition n: "Field Name : Field Length = Default Value"<br />
Primitive Definition 0: "Primitive name, offset, count"<br />
…<br />
Primitive Definition m: "Primitive name, offset, count"<br />
Prolog = "primitive name"<br />
Epilog = "primitive name"<br />
}<br />
• Field Definition<br />
• Field length is in bits, '*' means that the length is variable and will<br />
be set based on the assigned value<br />
• Field starting offset is calculated from frame start based on the<br />
length of the previous fields<br />
Examples:<br />
Field32 : 32 = 0xAABBFFEE<br />
FrameType : 8 = 12<br />
HashedDest : 24 = HEX_DATA<br />
Reserved1 : 8 = 0xDA<br />
Field16 : 16 = 0xAAAA<br />
Reserved2 : 8 = 0xAD<br />
CRC : 32<br />
• Data field Definition<br />
• "Data = { pattern }" - Pattern is assigned to Data<br />
• "Data = count, value" - A pattern of "count" times "value" is<br />
assigned to Data<br />
• "Data = count, start value, step" - A pattern of values starting with<br />
"start value" with steps of "step" and a length of "count" is assigned<br />
to Data<br />
• Primitive definition. Primitives are inserted into the frame payload.<br />
Primitive definitions are inherited by descended frame templates<br />
150
<strong>LeCroy</strong> <strong>SATracer</strong>/<strong>Trainer</strong> Analyzer User’s <strong>Manual</strong> SW Version 4.6<br />
• Assigning '*' clears all previous settings (maybe from parent frame<br />
template).<br />
• Offset specifies the dword offset where this primitive will be<br />
inserted in the Frame<br />
• Count specifies how many times to repeat the primitive<br />
Examples:<br />
Primitive : *<br />
Primitive : SOF, 48 # where 48 = offset<br />
Primitive : "CLOSE (NORMAL)", 36, 5 # where 5 = repeat<br />
• Prolog and Epilog define Primitive chains to be used at the<br />
beginning and end of the frame<br />
Examples:<br />
Prolog = SOF # For this frame primitive 'SOF' is used as a Prolog.<br />
Epilog = EOF # For this frame primitive 'EOF' is used as a Epilog.<br />
• Frames can be derived from other Frames, therefore inheriting the layout<br />
of the parent Frame. In this case, the user may:<br />
• Change Prolog and Epilog<br />
• Change default field values<br />
• Add new fields<br />
Frame Examples:<br />
Frame Some_Frame<br />
{<br />
Field32 : 32 = 0xAABBFFEE<br />
FrameType : 8 = 12<br />
HashedDest : 24 = HEX_DATA<br />
Reserved1 : 8 = 0xDA<br />
Field16 : 16 = 0xAAAA<br />
Reserved2 : 8 = 0xAD<br />
Data : * = PATTERN_1<br />
CRC : 32<br />
Primitive : *<br />
Primitive : SOF, 48<br />
Primitive : SOF, 96<br />
151
<strong>LeCroy</strong> <strong>SATracer</strong>/<strong>Trainer</strong> Analyzer User’s <strong>Manual</strong> SW Version 4.6<br />
Primitive : "CLOSE (NORMAL)", 36, 5<br />
Prolog = SOF<br />
Epilog = EOF<br />
}<br />
Frame Some_Frame_1 : Some_Frame<br />
{<br />
Field32 = "Some Hex Data"<br />
Data = { 11111111 22222222 33333333 44444444 55555555 }<br />
Opcode : 128, 8, 0x2A<br />
LBA : 64<br />
}<br />
Primitive : *<br />
Primitive : "CLOSE (NORMAL)", 24, 48<br />
Prolog = "CHAIN (ONE)"<br />
Epilog = "CHAIN (ONE)"<br />
12.3 Generation Block<br />
SAS<strong>Trainer</strong> will generate the stream that is defined in this block.<br />
Generation<br />
{<br />
Chain Definition (Repeat = N, Idle = M)<br />
Chain Definition (N, M)<br />
Chain Definition<br />
Frame Definition<br />
Frame Definition (RunningDisp = ON/OFF)<br />
Frame Definition<br />
{<br />
Field Definition<br />
Data Definition<br />
} (Repeat = N, Idle = M, RunningDisp = ON/OFF)<br />
}<br />
12.4 Definitions<br />
• Chain Definition:<br />
• Without any parameters, the chain is sent once<br />
152
<strong>LeCroy</strong> <strong>SATracer</strong>/<strong>Trainer</strong> Analyzer User’s <strong>Manual</strong> SW Version 4.6<br />
• With "Repeat" and "Idle" parameters, the chain is sent N times and<br />
then nothing is sent (idle) M times. "Repeat" and "Idle" are<br />
optional.<br />
• Frame Definition<br />
• Without any parameters, send the frame based in default values<br />
• With "RunningDisp" ON, send the frames based on default values<br />
and insert a running disparity error.<br />
• With parameters overriding or adding to a template frame, with or<br />
without injection of an overriding or adding to a template frame,<br />
with or without injection of running disparity error.<br />
Field Variable Declarations<br />
You can declare a variable (var_name) as a frame of type (frame_type)<br />
$var_name = frame_type<br />
Note Frame variables can be declared/re-declared and used many times.<br />
Changing Frame Fields<br />
You can change some fields in a frame variable<br />
Change var_name { field_name = value }<br />
Preprocessor integer arithmetic<br />
The user can declare DWORD variables, make arithmetic operations and<br />
use them in field and parameters assignments<br />
Note: Arithmetic expressions are allowed only in numeric variable<br />
assignments.<br />
Examples:<br />
Legal Operations<br />
x = 2<br />
y = ( z = 12 ) + ( SOME_DEC_DATA + 36 ) / 8<br />
z = 0x1 > 5 ) / 12<br />
153
<strong>LeCroy</strong> <strong>SATracer</strong>/<strong>Trainer</strong> Analyzer User’s <strong>Manual</strong> SW Version 4.6<br />
Loops<br />
SOF ( Repeat = x, Idle = y )<br />
X<br />
{<br />
Field16 = 0xEEEE # Example of the data payload assignment which<br />
uses both integer variables, constants, hex literals and data patterns<br />
Data = { y y y y 7a7a7a7a "Some Hex Data" "Some Hex Data"<br />
8b8b8b8b z z z z [PATTERN_3] }<br />
}<br />
( Repeat = 10, Idle = y ) # uses integer variable for parameter/setting<br />
Illegal operations<br />
x = y + 2<br />
SOF ( Repeat = (x+y)*7 ) # - illegal, use z = (x+y)*7 SOF ( Repeat = z )<br />
instead<br />
Loops can be used in two modes:<br />
1. Using an integer number, loop a specified number of loops. This number has to<br />
be smaller than 64K.<br />
2. Using the word "infinite", loops for ever.<br />
Loops ( loop_count/Infinite )<br />
{<br />
send instructions<br />
assignments<br />
change values<br />
send instructions<br />
}<br />
Example:<br />
LOOP( 50 )<br />
{<br />
"CHAIN (ONE)"<br />
"CHAIN (TWO)"<br />
Some_Frame<br />
$Y = Some_Frame { Data = 256, 0xFEFEFEFE }<br />
Y<br />
Change Y { Field32 = x }<br />
Y<br />
Y<br />
}<br />
154
<strong>LeCroy</strong> <strong>SATracer</strong>/<strong>Trainer</strong> Analyzer User’s <strong>Manual</strong> SW Version 4.6<br />
12.5 SAS<strong>Trainer</strong> Generation Commands<br />
General Commands<br />
CLEAR_CREDIT_AVAIL This commands clears the credit established<br />
with the command WF_CREDIT_AVAIL.<br />
(See WF_CREDIT_AVAIL in following<br />
section on Wait Commands for explanation).<br />
RD_POS Generator will insert one idle dword into<br />
gen stream, which will bring current RD to<br />
positive level<br />
RD_NEG Generator will insert one idle dword into<br />
gen stream, which will bring current RD to<br />
negative level<br />
RD_ERROR Generator will insert one idle dword into<br />
gen stream, which will bring intentionally<br />
break RD sequence creating RD error<br />
CONNECT Generator will go through connection<br />
sequence using current GenFile settings<br />
(gen mode, speed e.t.c.) Generation will not<br />
resume until connection is established<br />
DISCONNECT Generator will break existing connection to<br />
DUT<br />
PAUSE Generator will come to a break and the user<br />
will be able to resume generation by pressing<br />
Resume button on Generation toolbar.<br />
Generator shall transmit idle dwords while<br />
in the Pause.<br />
OUTPUT_ON Takes the <strong>Trainer</strong> out of Electric Idle state.<br />
If it is already out of Electric Idle, this is a<br />
NOP.<br />
OOB Commands<br />
COMINIT Generator will send COMINIT OOB signals<br />
using current COMINIT settings.<br />
COMRESET Generator will send COMRESET OOB signals<br />
using current COMRESET settings.<br />
155
<strong>LeCroy</strong> <strong>SATracer</strong>/<strong>Trainer</strong> Analyzer User’s <strong>Manual</strong> SW Version 4.6<br />
COMWAKE Generator will send COMWAKE OOB signals<br />
using current COMWAKE settings.<br />
COMSAS Generator will send COMSAS OOB signals<br />
using current COMSAS settings.<br />
SATA_ALIGN Generator will go through SATA_ALIGN<br />
stage of SATA SpeedNeg process using current<br />
SATA_ALIGN settings.<br />
SATA_D10_2 Generator will go through SATA_D10_2<br />
stage of SATA SpeedNeg process using current<br />
SATA_D10_2 settings.<br />
SPEED_NEG_RCDT Generator will go through<br />
SPEED_NEG_RCDT stage of SAS Speed-<br />
Neg process using current<br />
SPEED_NEG_RCDT settings.<br />
SPEED_NEG_ALIGN0 Generator will go through<br />
SPEED_NEG_ALIGN0 stage of SAS<br />
SpeedNeg process using current<br />
SPEED_NEG_ALIGN0 settings.<br />
SPEED_NEG_ALIGN1 Generator will go through<br />
SPEED_NEG_ALIGN1 stage of SAS<br />
SpeedNeg process using current<br />
SPEED_NEG_ALIGN1 settings.<br />
SATA Commands<br />
Look at STP sample file for syntax.<br />
• SEND_SATA_FRAME<br />
• SendSATAFrame<br />
• SATAData<br />
• SATA_Data<br />
• SATACRC<br />
• SATA_CRC<br />
• SATAXXXX<br />
• SATA_XXXX<br />
156
<strong>LeCroy</strong> <strong>SATracer</strong>/<strong>Trainer</strong> Analyzer User’s <strong>Manual</strong> SW Version 4.6<br />
Primitive Commands<br />
The following is a list of SAS and SATA primitives declared in<br />
"Primitives.Decl.inc" as Symbol Chains. If you want to use these primitives<br />
in your script you must also include "Primitives.Decl.inc" in your script.<br />
• SOF<br />
• EOF<br />
• SOAF<br />
• EOAF<br />
• ALIGN (0)<br />
• ALIGN (1)<br />
• ALIGN (2)<br />
• ALIGN (3)<br />
• NOTIFY (ENABLE SPINUP)<br />
• NOTIFY (RESERVED 0)<br />
• NOTIFY (RESERVED 1)<br />
• NOTIFY (RESERVED 2)<br />
• ACK<br />
• NAK (CRC ERROR)<br />
• NAK (RESERVED 0)<br />
• NAK (RESERVED 1<br />
• NAK (RESERVED 2)<br />
• CREDIT_BLOCKED<br />
• RRDY (NORMAL)<br />
• RRDY (RESERVED 0)<br />
• RRDY (RESERVED 1)<br />
• SATA_SOF<br />
• SATA_EOF<br />
• SATA_CONT<br />
• SATA_DMAT<br />
• SATA_HOLD<br />
• SATA_HOLDA<br />
• SATA_PMACK<br />
• SATA_PMNAK<br />
• SATA_PMREQ_P<br />
157
<strong>LeCroy</strong> <strong>SATracer</strong>/<strong>Trainer</strong> Analyzer User’s <strong>Manual</strong> SW Version 4.6<br />
• SATA_PMREQ_S<br />
• SATA_R_ERR<br />
• SATA_R_IP<br />
• SATA_R_OK<br />
• SATA_R_RDY<br />
• SATA_SYNC<br />
• SATA_WTRM<br />
• SATA_X_RDY<br />
• SATA_ERROR<br />
• AIP (NORMAL)<br />
• AIP (RESERVED 0)<br />
• AIP (RESERVED 1)<br />
• AIP (RESERVED 2)<br />
• AIP (RESERVED WAITING ON PARTIAL)<br />
• AIP (WAITING ON CONNECTION)<br />
• AIP (WAITING ON DEVICE)<br />
• AIP (WAITING ON PARTIAL)<br />
• BREAK<br />
• BROADCAST (CHANGE)<br />
• BROADCAST (RESERVED 0)<br />
• BROADCAST (RESERVED 1)<br />
• BROADCAST (RESERVED 2)<br />
• BROADCAST (RESERVED 3)<br />
• BROADCAST (RESERVED 4)<br />
• BROADCAST (RESERVED CHANGE 0)<br />
• BROADCAST (RESERVED CHANGE 1)<br />
• CLOSE (CLEAR AFFILIATION)<br />
• CLOSE (NORMAL)<br />
• CLOSE (RESERVED 0)<br />
• CLOSE (RESERVED 1)<br />
• ERROR<br />
• HARD_RESET<br />
• OPEN_ACCEPT<br />
• OPEN_REJECT (BAD DESTINATION)<br />
158
<strong>LeCroy</strong> <strong>SATracer</strong>/<strong>Trainer</strong> Analyzer User’s <strong>Manual</strong> SW Version 4.6<br />
• OPEN_REJECT (CONNECTION RATE NOT SUPPORTED)<br />
• OPEN_REJECT (NO DESTINATION)<br />
• OPEN_REJECT (PATHWAY BLOCKED)<br />
• OPEN_REJECT (PROTOCOL NOT SUPPORTED)<br />
• OPEN_REJECT (RESERVED ABANDON 0)<br />
• OPEN_REJECT (RESERVED ABANDON 1)<br />
• OPEN_REJECT (RESERVED ABANDON 2)<br />
• OPEN_REJECT (RESERVED ABANDON 3)<br />
• OPEN_REJECT (RESERVED CONTINUE 0)<br />
• OPEN_REJECT (RESERVED CONTINUE 1)<br />
• OPEN_REJECT (RESERVED INITIALIZE 0)<br />
• OPEN_REJECT (RESERVED INITIALIZE 1)<br />
• OPEN_REJECT (RESERVED STOP 0)<br />
• OPEN_REJECT (RESERVED STOP 1)<br />
• OPEN_REJECT (RETRY)<br />
• OPEN_REJECT (STP RESOURCES BUSY)<br />
• OPEN_REJECT (WRONG DESTINATION)<br />
• DONE (ACK/NAK TIMEOUT)<br />
• DONE (CREDIT TIMEOUT)<br />
• DONE (NORMAL)<br />
• DONE (RESERVED 0)<br />
• DONE (RESERVED 1)<br />
• DONE (RESERVED TIMEOUT 0)<br />
• DONE (RESERVED TIMEOUT 1)<br />
• SAS Specific Script-Defined Constants<br />
• SAS_AF_DT_NO_DEVICE_ATTACHED<br />
• SAS_AF_DT_END_DEVICE<br />
• SAS_AF_DT_EDGE_EXPANDER_DEVICE<br />
• SAS_AF_DT_FANOUT_EXPANDER_DEVICE<br />
• SAS_AF_FT_IDENTIFY<br />
• SAS_AF_FT_OPEN<br />
159
<strong>LeCroy</strong> <strong>SATracer</strong>/<strong>Trainer</strong> Analyzer User’s <strong>Manual</strong> SW Version 4.6<br />
• SAS_AF_PROTOCOL_SMP<br />
• SAS_AF_PROTOCOL_SSP<br />
• SAS_AF_PROTOCOL_STP<br />
• SAS_AF_PROTOCOL_UNKNOWN<br />
• SAS_AF_RATE_1_5_GBPS<br />
• SAS_AF_RATE_3_GBPS<br />
• SMP_FRAME_TYPE_REQUEST<br />
• SMP_FRAME_TYPE_RESPONSE<br />
• SMP_REPORT_GENERAL<br />
• SMP_REPORT_MANUFACTURER_INFO<br />
• SMP_DISCOVER<br />
• SMP_REPORT_PHY_ERROR_LOG<br />
• SMP_REPORT_PHY_SATA<br />
• SMP_REPORT_ROUTE_INFO<br />
• SMP_CONFIGURE_ROUTE_INFO<br />
• SMP_PHY_CONTROL<br />
• SSP_FRAME_TYPE_DATA<br />
• SSP_FRAME_TYPE_XFER_RDY<br />
• SSP_FRAME_TYPE_COMMAND<br />
• SSP_FRAME_TYPE_RESPONSE<br />
• SSP_FRAME_TYPE_TASK<br />
• SSP_FRAME_TYPE_VENDOR<br />
160
<strong>LeCroy</strong> <strong>SATracer</strong>/<strong>Trainer</strong> Analyzer User’s <strong>Manual</strong> SW Version 4.6<br />
Wait Commands<br />
Syntax: WAIT_FOR { ... ... }<br />
WaitCommand Name Description<br />
WF_TIMEOUT Timeout Credit<br />
Available<br />
When WF_TIMEOUT is<br />
requested in WAIT_FOR<br />
command the wait session<br />
will be released after timeout<br />
has elapsed.<br />
WF_SOF primitive<br />
WF_EOF primitive<br />
WF_SOAF primitive<br />
WF_EOAF primitive<br />
WF_ACK primitive<br />
WF_NAK_CRC_ERROR primitive<br />
WF_NAK_RESERVED_0 primitive<br />
161<br />
The Timeout value can be set<br />
two different ways:<br />
1. Through the global Wait-<br />
Timeout setting that can<br />
appear anywhere in generation.<br />
Default value is 1000<br />
microseconds. Syntax:<br />
Set WaitTimeout =<br />
(in microseconds)<br />
2. Through local WaitTimeout<br />
value for this specific<br />
wait session. Syntax:<br />
WAIT_FOR (<br />
) { WF_TIMEOUT<br />
}<br />
In this case wait for other<br />
commands will be released<br />
no later then after<br />
number_of_microseconds,<br />
but global WaitTimeout<br />
value remains unchanged<br />
for future use.<br />
See Generation\Include\<br />
WaitCommands.inc in your<br />
SASTracer program folder<br />
for the samples of syntax.<br />
WF_NAK_RESERVED_1 primitive
<strong>LeCroy</strong> <strong>SATracer</strong>/<strong>Trainer</strong> Analyzer User’s <strong>Manual</strong> SW Version 4.6<br />
WaitCommand Name Description<br />
WF_NAK_RESERVED_2 primitive<br />
WF_CREDIT_AVAIL Credit Available<br />
This function is based on a<br />
10-bit counter whose value<br />
can range from -512 to +511<br />
(twos-complement). This<br />
counter is cleared by sending<br />
or receiving an<br />
OPEN_ACCEPT primitive,<br />
or by execution of a<br />
CLEAR_CREDIT_AVAIL<br />
command in the script.<br />
162<br />
This counter is incremented<br />
by receiving any SAS RRDY<br />
primitive and is decremented<br />
by sending SAS SOF. The<br />
wait_for command will wait<br />
for this counter to have a positive<br />
value between +1 and<br />
+511. This wait_for condition<br />
is intended to be used before<br />
sending a SAS frame within a<br />
connection.<br />
ClEAR_CREDIT_AVAIL<br />
clears this credit function.<br />
WF_CREDIT_BLOCKED_RECEIVED CreditBlocked<br />
Received<br />
This function is based on a<br />
flip-flop which is cleared by<br />
sending or receiving an<br />
OPEN_ACCEPT primitive. It<br />
is set by receiving a<br />
CREDIT_BLOCKED primitive.<br />
It is intended to be used<br />
in conjunction with<br />
wf_credit_avail to prevent<br />
script hangs in those cases<br />
where there is not going to<br />
be any more credit granted.<br />
WF_CREDIT_BLOCKED primitive<br />
WF_RRDY_NORMAL primitive<br />
WF_RRDY_RESERVED_0 primitive<br />
WF_RRDY_RESERVED_1 primitive
<strong>LeCroy</strong> <strong>SATracer</strong>/<strong>Trainer</strong> Analyzer User’s <strong>Manual</strong> SW Version 4.6<br />
WaitCommand Name Description<br />
WF_BREAK primitive<br />
WF_CLOSE_CLEAR_AFFILIATION primitive<br />
WF_CLOSE_NORMAL primitive<br />
WF_CLOSE_RESERVED_0 primitive<br />
WF_CLOSE_RESERVED_1 primitive<br />
WF_DONE_ACK_NAK_TIMEOUT primitive<br />
WF_DONE_CREDIT_TIMEOUT primitive<br />
WF_DONE_NORMAL primitive<br />
WF_DONE_RESERVED_0 primitive<br />
WF_DONE_RESERVED_1 primitive<br />
WF_DONE_RESERVED_TIMEOUT_0 primitive<br />
WF_DONE_RESERVED_TIMEOUT_1 primitive<br />
WF_ERROR primitive<br />
WF_HARD_RESET primitive<br />
WF_AIP_NORMAL primitive<br />
WF_AIP_RESERVED_0 primitive<br />
WF_AIP_RESERVED_1 primitive<br />
WF_AIP_RESERVED_2 primitive<br />
WF_AIP_RESERVED_WAIT_ON_PART primitive<br />
WF_AIP_WAIT_ON_CONN primitive<br />
WF_AIP_WAIT_ON_DEVICE primitive<br />
163
<strong>LeCroy</strong> <strong>SATracer</strong>/<strong>Trainer</strong> Analyzer User’s <strong>Manual</strong> SW Version 4.6<br />
WaitCommand Name Description<br />
WF_AIP_WAIT_ON_PARTIAL primitive<br />
WF_IDENTIFY_FRAME Identify Address<br />
Frame<br />
WF_OPEN_FRAME Open Address<br />
Frame<br />
WF_SMP_REQUEST SMP Request<br />
Frame<br />
WF_SMP_RESPONSE SMP Response<br />
Frame<br />
WF_REC_RESOURCES_OUTPUT_A Advanced Wait<br />
Condition A<br />
This command causes generation<br />
to wait for Event "A" to<br />
occur that you defined in the<br />
Generation Options dialog<br />
described at the end of this<br />
chapter.<br />
WF_REC_RESOURCES_OUTPUT_B Advanced Wait<br />
Condition B<br />
This command causes generation<br />
to wait for Event "B" to<br />
occur that you defined in the<br />
Generation Options dialog<br />
described at the end of this<br />
164<br />
chapter.<br />
WF_REC_RESOURCES_OUTPUT_C Advanced Wait<br />
Condition C<br />
This command causes generation<br />
to wait for Event "C" to<br />
occur that you defined in the<br />
Generation Options dialog<br />
described at the end of this<br />
chapter.
<strong>LeCroy</strong> <strong>SATracer</strong>/<strong>Trainer</strong> Analyzer User’s <strong>Manual</strong> SW Version 4.6<br />
WaitCommand Name Description<br />
WF_REC_RESOURCES_OUTPUT_D Advanced Wait<br />
Condition D<br />
This command causes generation<br />
to wait for Event "D" to<br />
occur that you defined in the<br />
Generation Options dialog<br />
described at the end of this<br />
165<br />
chapter.<br />
WF_REC_RESOURCES_OUTPUT_E Advanced Wait<br />
Condition E<br />
This command causes generation<br />
to wait for Event "E" to<br />
occur that you defined in the<br />
Generation Options dialog<br />
described at the end of this<br />
chapter.<br />
WF_REC_RESOURCES_OUTPUT_F Advanced Wait<br />
Condition F<br />
This command causes generation<br />
to wait for Event "F" to<br />
occur that you defined in the<br />
Generation Options dialog<br />
described at the end of this<br />
chapter.<br />
WF_COMRESET_COMINIT COMRESET OOB<br />
Signals<br />
WF_COMSAS COMSAS OOB<br />
Signals<br />
WF_COMWAKE COMWAKE OOB<br />
Signals<br />
WF_BLOCK1_MISC_RESERVED_0 reserved<br />
WF_BLOCK1_MISC_RESERVED_1 reserved<br />
WF_BLOCK1_MISC_RESERVED_2 reserved<br />
WF_BLOCK1_MISC_RESERVED_3 reserved<br />
WF_BLOCK1_MISC_RESERVED_4 reserved
<strong>LeCroy</strong> <strong>SATracer</strong>/<strong>Trainer</strong> Analyzer User’s <strong>Manual</strong> SW Version 4.6<br />
WaitCommand Name Description<br />
WF_SATA_CONT primitive<br />
WF_SATA_DMAT primitive<br />
WF_SATA_EOF primitive<br />
WF_SATA_ERROR primitive<br />
WF_SATA_HOLD primitive<br />
WF_SATA_HOLDA primitive<br />
WF_SATA_PMACK primitive<br />
WF_SATA_PMNAK primitive<br />
WF_SATA_PMREQ_P primitive<br />
WF_SATA_PMREQ_S primitive<br />
WF_SATA_R_ERR primitive<br />
WF_SATA_R_IP primitive<br />
WF_SATA_R_OK primitive<br />
WF_SATA_R_RDY primitive<br />
WF_SATA_SOF primitive<br />
WF_SATA_SYNC primitive<br />
WF_SATA_WTRM primitive<br />
WF_SATA_X_RDY primitive<br />
WF_OPEN_ACCEPT primitive<br />
WF_OPEN_REJECT_BAD_DESTINATION primitive<br />
WF_OPEN_REJECT_CONN_RATE_NOT_SUPPORTED primitive<br />
WF_OPEN_REJECT_NO_DESTINATION primitive<br />
WF_OPEN_REJECT_PATHWAY_BLOCKED primitive<br />
WF_OPEN_REJECT_PROTOCOL_NOT_SUPPORTED primitive<br />
WF_OPEN_REJECT_RETRY primitive<br />
166
<strong>LeCroy</strong> <strong>SATracer</strong>/<strong>Trainer</strong> Analyzer User’s <strong>Manual</strong> SW Version 4.6<br />
WaitCommand Name Description<br />
WF_OPEN_REJECT_STP_RESOURCES_BUSY primitive<br />
WF_OPEN_REJECT_WRONG_DESTINATION primitive<br />
WF_OPEN_REJECT_RESERVED_ABANDON_0 primitive<br />
WF_OPEN_REJECT_RESERVED_ABANDON_1 primitive<br />
WF_OPEN_REJECT_RESERVED_ABANDON_2 primitive<br />
WF_OPEN_REJECT_RESERVED_ABANDON_3 primitive<br />
WF_OPEN_REJECT_RESERVED_CONTINUE_0 primitive<br />
WF_OPEN_REJECT_RESERVED_CONTINUE_1 primitive<br />
WF_OPEN_REJECT_RESERVED_INITIALIZE_0 primitive<br />
WF_OPEN_REJECT_RESERVED_INITIALIZE_1 primitive<br />
WF_OPEN_REJECT_RESERVED_STOP_0 primitive<br />
WF_OPEN_REJECT_RESERVED_STOP_1 primitive<br />
WF_ALIGN_0 primitive<br />
WF_ALIGN_1 primitive<br />
WF_ALIGN_2 primitive<br />
WF_ALIGN_3 primitive<br />
WF_NOTIFY_ENABLE_SPINUP primitive<br />
WF_NOTIFY_RESERVED_0 primitive<br />
WF_NOTIFY_RESERVED_1 primitive<br />
WF_NOTIFY_RESERVED_2 primitive<br />
WF_BROADCAST_CHANGE primitive<br />
WF_BROADCAST_RESERVED_0 primitive<br />
WF_BROADCAST_RESERVED_1 primitive<br />
167
<strong>LeCroy</strong> <strong>SATracer</strong>/<strong>Trainer</strong> Analyzer User’s <strong>Manual</strong> SW Version 4.6<br />
WF_BROADCAST_RESERVED_2 primitive<br />
WF_BROADCAST_RESERVED_3 primitive<br />
WF_BROADCAST_RESERVED_4 primitive<br />
WF_BROADCAST_RESERVED_CHANGE_0 primitive<br />
WF_BROADCAST_RESERVED_CHANGE_1 primitive<br />
WF_BLOCK2_MISC_RESERVED_0 reserved<br />
WF_BLOCK2_MISC_RESERVED_1 reserved<br />
Wait Command Groups<br />
WF_ALL_SOF<br />
WaitCommand Name Description<br />
Wait Command Group Group Contents<br />
168<br />
WF_SOF<br />
WF_SOAF<br />
WF_ALL_EOF WF_EOF<br />
WF_SOAF<br />
WF_NAK WF_NAK_CRC_<br />
ERROR<br />
WF_NAK_<br />
RESERVED_0<br />
WF_NAK_<br />
RESERVED_1<br />
WF_NAK_<br />
RESERVED_2
<strong>LeCroy</strong> <strong>SATracer</strong>/<strong>Trainer</strong> Analyzer User’s <strong>Manual</strong> SW Version 4.6<br />
Wait Command Group Group Contents<br />
WF_RRDY WF_RRDY_<br />
NORMAL<br />
169<br />
WF_RRDY_<br />
RESERVED_0<br />
WF_RRDY_<br />
RESERVED_1<br />
WF_CREDIT_OK WF_CREDIT_<br />
AVAIL<br />
WF_CREDIT_BLO<br />
CKED_RECEIVED<br />
WF_CLOSE WF_CLOSE_CLEA<br />
R_AFFILIATION<br />
WF_CLOSE_<br />
NORMAL<br />
WF_CLOSE_<br />
RESERVED_0<br />
WF_CLOSE_<br />
RESERVED_1
<strong>LeCroy</strong> <strong>SATracer</strong>/<strong>Trainer</strong> Analyzer User’s <strong>Manual</strong> SW Version 4.6<br />
Wait Command Group Group Contents<br />
WF_DONE WF_DONE_ACK_<br />
NAK_TIMEOUT<br />
170<br />
WF_DONE_<br />
CREDIT_<br />
TIMEOUT<br />
WF_DONE_<br />
NORMAL<br />
WF_DONE_<br />
RESERVED_0<br />
WF_DONE_<br />
RESERVED_1<br />
WF_DONE_<br />
RESERVED_<br />
TIMEOUT_0<br />
WF_DONE_<br />
RESERVED_<br />
TIMEOUT_1
<strong>LeCroy</strong> <strong>SATracer</strong>/<strong>Trainer</strong> Analyzer User’s <strong>Manual</strong> SW Version 4.6<br />
Wait Command Group Group Contents<br />
WF_AIP WF_AIP_NORMAL<br />
171<br />
WF_AIP_<br />
RESERVED_0<br />
WF_AIP_<br />
RESERVED_1<br />
WF_AIP_<br />
RESERVED_2<br />
WF_AIP_<br />
RESERVED_WAIT<br />
_ON_PART<br />
WF_AIP_WAIT_<br />
ON_CONN<br />
WF_AIP_WAIT_<br />
ON_DEVICE<br />
WF_AIP_WAIT_<br />
ON_PARTIAL<br />
WF_REC_RESOURCES WF_REC_<br />
RESOURCES_<br />
OUTPUT_A<br />
WF_REC_<br />
RESOURCES_<br />
OUTPUT_B<br />
WF_REC_<br />
RESOURCES_<br />
OUTPUT_C<br />
WF_REC_<br />
RESOURCES_<br />
OUTPUT_D<br />
WF_REC_<br />
RESOURCES_<br />
OUTPUT_E<br />
WF_REC_<br />
RESOURCES_<br />
OUTPUT_F
<strong>LeCroy</strong> <strong>SATracer</strong>/<strong>Trainer</strong> Analyzer User’s <strong>Manual</strong> SW Version 4.6<br />
WF_RCV_STATUS<br />
WF_PM_REQ<br />
WF_PM_STATUS<br />
Wait Command Group Group Contents<br />
172<br />
WF_SATA_R_ERR<br />
WF_SATA_R_OK<br />
WF_SATA_<br />
PMREQ_P<br />
WF_SATA_<br />
PMREQ_S<br />
WF_SATA_<br />
PMACK<br />
WF_SATA_<br />
PMNAK
<strong>LeCroy</strong> <strong>SATracer</strong>/<strong>Trainer</strong> Analyzer User’s <strong>Manual</strong> SW Version 4.6<br />
Wait Command Group Group Contents<br />
WF_OPEN_REJECT WF_OPEN_REJEC<br />
T_BAD_DESTINA<br />
TION<br />
173<br />
WF_OPEN_<br />
REJECT_CONN_<br />
RATE_NOT_<br />
SUPPORTED<br />
WF_OPEN_<br />
REJECT_NO_<br />
DESTINATION<br />
WF_OPEN_<br />
REJECT_<br />
PATHWAY_<br />
BLOCKED<br />
WF_OPEN_<br />
REJECT_<br />
PROTOCOL_NOT_<br />
SUPPORTED<br />
WF_OPEN_<br />
REJECT_RETRY<br />
WF_OPEN_<br />
REJECT_STP_<br />
RESOURCES_<br />
BUSY<br />
WF_OPEN_<br />
REJECT_WRONG_<br />
DESTINATION<br />
WF_OPEN_<br />
REJECT_<br />
RESERVED_<br />
ABANDON_0<br />
WF_OPEN_<br />
REJECT_<br />
RESERVED_<br />
ABANDON_1<br />
WF_OPEN_<br />
REJECT_<br />
RESERVED_<br />
ABANDON_2
<strong>LeCroy</strong> <strong>SATracer</strong>/<strong>Trainer</strong> Analyzer User’s <strong>Manual</strong> SW Version 4.6<br />
WF_OPEN_RESPONSE<br />
Wait Command Group Group Contents<br />
174<br />
WF_OPEN_<br />
ACCEPT<br />
WF_OPEN_<br />
REJECT<br />
WF_ALIGN WF_ALIGN_0<br />
WF_ALIGN_1<br />
WF_ALIGN_2<br />
WF_ALIGN_3<br />
WF_NOTIFY WF_NOTIFY_<br />
ENABLE_SPINUP<br />
WF_NOTIFY_<br />
RESERVED_0<br />
WF_NOTIFY_<br />
RESERVED_1<br />
WF_NOTIFY_<br />
RESERVED_2
<strong>LeCroy</strong> <strong>SATracer</strong>/<strong>Trainer</strong> Analyzer User’s <strong>Manual</strong> SW Version 4.6<br />
WF_BROADCAST WF_BROADCAST_<br />
CHANGE<br />
Generation Settings<br />
Global Settings<br />
Setting<br />
Wait Command Group Group Contents<br />
Table 2: Generation Settings<br />
Default<br />
Value<br />
175<br />
Description<br />
WF_BROADCAST_<br />
RESERVED_0<br />
WF_BROADCAST_<br />
RESERVED_1<br />
WF_BROADCAST_<br />
RESERVED_2<br />
WF_BROADCAST_<br />
RESERVED_3<br />
WF_BROADCAST_<br />
RESERVED_4<br />
WF_BROADCAST_<br />
RESERVED_<br />
CHANGE_0<br />
WF_BROADCAST_<br />
RESERVED_<br />
CHANGE_1<br />
GenerationMode >>>>> Generation Mode - must be<br />
defined or no generation will<br />
take place. Possible Values:<br />
GEN_MODE_SATA_HOST<br />
GEN_MODE_SATA_DEVICE<br />
GEN_MODE_SAS_INITIATOR<br />
GEN_MODE_SAS_TARGET<br />
Default Value:<br />
GEN_MODE_ERROR - undefined<br />
mode
<strong>LeCroy</strong> <strong>SATracer</strong>/<strong>Trainer</strong> Analyzer User’s <strong>Manual</strong> SW Version 4.6<br />
Setting<br />
SSC 0 Spread Spectrum Clocking<br />
mode for SATA. Can only be<br />
set outside Generation block.<br />
MultiSpeedMode 0 When set, the change of<br />
speed within Generation<br />
block is allowed with following<br />
syntax: set Speed =<br />
LINK_SPEED_1_5G /<br />
LINK_SPEED_<strong>3G</strong>.<br />
AutoMode Settings<br />
Table 2: Generation Settings<br />
Default<br />
Value<br />
AutoOOBMode 0 When set, the generator will<br />
go through the stages of<br />
bringing up the link automatically,<br />
including waiting for<br />
and responding to the device<br />
or host it is connected to.<br />
AutoHoldMode 0 When set, the generator will<br />
respond automatically to<br />
Hold requests. Not supported<br />
for version 1.1<br />
(reserved).<br />
AutoDMAT 0 When set, the generator will<br />
respond automatically to<br />
DMAT requests. Not supported<br />
for version 1.1<br />
(reserved).<br />
AutoHandshake 0 When set, the generator will<br />
respond automatically to<br />
TBD commands. Not supported<br />
for version 1.1<br />
(reserved).<br />
176<br />
Description
<strong>LeCroy</strong> <strong>SATracer</strong>/<strong>Trainer</strong> Analyzer User’s <strong>Manual</strong> SW Version 4.6<br />
Setting<br />
AutoSpeedNeg 0 When set, the generator will<br />
automatically go throughthe<br />
speed negotiation process,<br />
for the speed set in the<br />
PINTERFACEC_SERDES<br />
register for the <strong>Trainer</strong>.<br />
AutoAlignSATA 0 When set, the generator will<br />
automatically inserting the<br />
stream 2 Align(0) primitives<br />
every 254 dwords, as specified<br />
in the SATA spec.<br />
AutoAlignSAS 0 When set, the generator will<br />
automatically inserting the<br />
stream Align primitives<br />
every 2048 dwords, as specified<br />
in the SAS spec.Two<br />
Align modes can be turned<br />
on simultaneously, to support<br />
STP<br />
COMINIT Settings<br />
Table 2: Generation Settings<br />
Default<br />
Value<br />
COMINIT_NegLen 800 The number of bursts to send<br />
as part of this OOB<br />
type.Each Burst is followed<br />
by an Idle. The Burst-Idle<br />
pairs are repeated the<br />
requested number of times,<br />
and then followed by the<br />
Negation_length of Idle.<br />
COMINIT_IdleLen 480 Burst time between each<br />
OOB idle in OOBIs.During<br />
the specified period, the generator<br />
will send ALIGN(0) at<br />
the specified speed.<br />
177<br />
Description
<strong>LeCroy</strong> <strong>SATracer</strong>/<strong>Trainer</strong> Analyzer User’s <strong>Manual</strong> SW Version 4.6<br />
Setting<br />
COMINIT_BurstLen 160 Idle time between each OOB<br />
burst in OOBIs.During the<br />
specified period, the generator<br />
will keep the line at electric<br />
idle.<br />
COMINIT_NumBursts 6 Negation time at the end of<br />
the OOB signal in<br />
OOBIs.During the specified<br />
period, the generator will<br />
keep the line at electric idle.<br />
COMWAKE Settings<br />
Table 2: Generation Settings<br />
Default<br />
Value<br />
COMWAKE_NegLen 280 The number of bursts to send<br />
as part of this OOB<br />
type.Each Burst is followed<br />
by an Idle. The Burst-Idle<br />
pairs are repeated the<br />
requested number of times,<br />
and then followed by the<br />
Negation_length of Idle.<br />
COMWAKE_IdleLen 160 Burst time between each<br />
OOB idle in OOBIs.During<br />
the specified period, the generator<br />
will send ALIGN(0) at<br />
the specified speed.<br />
COMWAKE_BurstLen 160 Idle time between each OOB<br />
burst in OOBIs.During the<br />
specified period, the generator<br />
will keep the line at electric<br />
idle.<br />
COMWAKE_NumBursts 6 Negation time at the end of<br />
the OOB signal in<br />
OOBIs.During the specified<br />
period, the generator will<br />
keep the line at electric idle.<br />
178<br />
Description
<strong>LeCroy</strong> <strong>SATracer</strong>/<strong>Trainer</strong> Analyzer User’s <strong>Manual</strong> SW Version 4.6<br />
Setting<br />
COMSAS Settings<br />
COMSAS_NegLen 2400 The number of bursts to send<br />
as part of this OOB<br />
type.Each Burst is followed<br />
by an Idle. The Burst-Idle<br />
pairs are repeated the<br />
requested number of times,<br />
and then followed by the<br />
Negation_length of Idle.<br />
COMSAS_IdleLen 1440 Burst time between each<br />
OOB idle in OOBIs.During<br />
the specified period, the generator<br />
will send ALIGN(0) at<br />
the specified speed.<br />
COMSAS_BurstLen 160 Idle time between each OOB<br />
burst in OOBIs.During the<br />
specified period, the generator<br />
will keep the line at electric<br />
idle.<br />
COMSAS_NumBursts 6 Negation time at the end of<br />
the OOB signal in<br />
OOBIs.During the specified<br />
period, the generator will<br />
keep the line at electric idle.<br />
SATA Link Init Settings<br />
Table 2: Generation Settings<br />
Default<br />
Value<br />
OOB_SATA_D102_Time 100000 D10.2 time for SATA link<br />
synchronization in<br />
OOBIs.During the specified<br />
period, the generator will<br />
transmit D10.2 symbols.<br />
179<br />
Description
<strong>LeCroy</strong> <strong>SATracer</strong>/<strong>Trainer</strong> Analyzer User’s <strong>Manual</strong> SW Version 4.6<br />
Setting<br />
OOB_SATA_Align_Time 100000 ALIGN(0) time for SATA<br />
link synchronization in<br />
OOBIs.During the specified<br />
period, the generator will<br />
transmit ALIGN(0) primitives.<br />
SAS Speed Negotiation Settings<br />
Table 2: Generation Settings<br />
Default<br />
Value<br />
OOB_SAS_Align1_Time 81920 ALIGN(1) time for SAS<br />
speed negotiation in<br />
OOBIs.During the specified<br />
period, the generator will<br />
transmit ALIGN(1) primitives.<br />
OOB_SAS_Align0_Time 81920 ALIGN(0) time for SAS<br />
speed negotiation in<br />
OOBIs.During the specified<br />
period, the generator will<br />
transmit ALIGN(0) primitives.<br />
OOB_SAS_Interspeed_Time 750000 Interspeed time for SAS<br />
speed negotiation in<br />
OOBIs.During the specified<br />
period, the generator will<br />
keep the line at electric idle.<br />
180<br />
Description
<strong>LeCroy</strong> <strong>SATracer</strong>/<strong>Trainer</strong> Analyzer User’s <strong>Manual</strong> SW Version 4.6<br />
SATA Speed Negotiation Settings<br />
OOB_SpeedNeg_RCDT 750000 Maximum time in OOBIs<br />
during the speed negotiation<br />
window for a transmitter to<br />
reply with ALIGN(1).<br />
OOB_SpeedNeg_SNTT 163840 Time in OOBIs during which<br />
ALIGN(0) or ALIGN(1) is<br />
transmitted at each physical<br />
link rate during the speed<br />
negotiation sequence.<br />
OOB_SpeedNeg_SNLT 153600 Time in OOBIs during which<br />
the transmitter shall transmit<br />
idle between rates during<br />
speed negotiation.<br />
Speed Settings<br />
Setting<br />
Table 2: Generation Settings<br />
Default<br />
Value<br />
Speed >>>>> Link Speed Possible Values:<br />
LINK_SPEED_1_5G<br />
LINK_SPEED_<strong>3G</strong> Default<br />
Value: LINK_SPEED_1_5G<br />
RateMatching 0 When set, the generator will<br />
automatically inserting the<br />
stream Align(0) primitive<br />
after every dword.<br />
181<br />
Description
<strong>LeCroy</strong> <strong>SATracer</strong>/<strong>Trainer</strong> Analyzer User’s <strong>Manual</strong> SW Version 4.6<br />
Setting<br />
Scrambling Mode Settings<br />
ScramblingMode >>>>> Raw Data Scrambling Mode<br />
- Only those raw dwords will<br />
be scrambled that contain<br />
only data bytes (no 10bit<br />
symbols or 'K' bytes. Scrambling<br />
is reset by changing<br />
ScramblingMode or by any<br />
valid SAS or SATA frame.<br />
Possible Values:<br />
SCRAMBLING_MODE_NONE<br />
SCRAMBLING_MODE_SAS<br />
SCRAMBLING_MODE_SATA<br />
Default Value:<br />
SCRAMBLING_MODE_NONE<br />
Wait Timeout Settings<br />
WaitTimeout 1000 Sets global WaitTimeout<br />
value in microseconds<br />
AUTO_WAIT_SAS_AFTER Settings<br />
AUTO_WAIT_SAS_AFTER_<br />
CLOSE_FOR_CLOSE<br />
AUTO_WAIT_SAS_AFTER_EOF_<br />
FOR_ACK<br />
AUTO_WAIT_SAS_AFTER_EOF_<br />
FOR_ACK_OR_NAK<br />
Table 2: Generation Settings<br />
Default<br />
Value<br />
FALSE When set, the generator will<br />
insert WAIT_FOR CLOSE<br />
command immediately after<br />
each CLOSE primitive.<br />
FALSE When set, the generator will<br />
insert WAIT_FOR ACK<br />
command immediately after<br />
each EOF primitive.<br />
FALSE When set, the generator will<br />
insert WAIT_FOR ACK or<br />
NAK command immediately<br />
after each EOF primitive.<br />
182<br />
Description
<strong>LeCroy</strong> <strong>SATracer</strong>/<strong>Trainer</strong> Analyzer User’s <strong>Manual</strong> SW Version 4.6<br />
Setting<br />
AUTO_WAIT_SAS_AFTER_<br />
OPEN_FOR_OPEN_ACCEPT<br />
AUTO_WAIT_SAS_AFTER_<br />
OPEN_FOR_OPEN_REJECT<br />
AUTO_WAIT_SAS_AFTER_<br />
IDENTIFY_FOR_IDENTIFY_<br />
FRAME<br />
AUTO_WAIT_SAS_AFTER_SMP<br />
_REQ_FOR_RESP<br />
AUTO_WAIT_SAS_BEFORE Settings<br />
AUTO_WAIT_SAS_BEFORE_<br />
CLOSE_FOR_CLOSE<br />
AUTO_WAIT_SAS_BEFORE_<br />
SOF_FOR_CREDIT<br />
AUTO_WAIT_SAS_BEFORE_<br />
IDENTIFY_FOR_IDENTIFY_<br />
FRAME<br />
Table 2: Generation Settings<br />
Default<br />
Value<br />
FALSE When set, the generator will<br />
insert WAIT_FOR<br />
OPEN_ACCEPT command<br />
immediately after each Open<br />
Address Frame.<br />
FALSE When set, the generator will<br />
insert WAIT_FOR<br />
OPEN_REJECT command<br />
immediately after each Open<br />
Address Frame.<br />
FALSE When set, the generator will<br />
insert WAIT_FOR Identify<br />
Frame command immediately<br />
after each Identify<br />
Address Frame.<br />
FALSE When set, the generator will<br />
insert WAIT_FOR SMP<br />
Response Frame command<br />
immediately after each SMP<br />
Request Frame.<br />
FALSE When set, the generator will<br />
insert WAIT_FOR CLOSE<br />
command right before each<br />
CLOSE primitive.<br />
FALSE When set, the generator will<br />
insert WAIT_FOR CREDIT<br />
command right before each<br />
SOF primitive.<br />
FALSE When set, the generator will<br />
insert WAIT_FOR Identify<br />
Frame command right before<br />
each Identify Address Frame.<br />
183<br />
Description
<strong>LeCroy</strong> <strong>SATracer</strong>/<strong>Trainer</strong> Analyzer User’s <strong>Manual</strong> SW Version 4.6<br />
Setting<br />
AUTO_WAIT_SAS_BEFORE_<br />
OPEN_ACCEPT_FOR_OPEN<br />
AUTO_WAIT_SAS_BEFORE_<br />
OPEN_REJECT_FOR_OPEN<br />
AUTO_WAIT_SAS_BEFORE_AIP<br />
_FOR_OPEN<br />
AUTO_WAIT_SAS_BEFORE_<br />
SMP_RESP_FOR_REQ<br />
AUTO_WAIT_SATA_AFTER Settings<br />
AUTO_WAIT_SATA_AFTER_X_<br />
RDY_FOR_R_RDY<br />
AUTO_WAIT_SATA_AFTER_<br />
WTRM_FOR_STATUS<br />
Table 2: Generation Settings<br />
Default<br />
Value<br />
FALSE When set, the generator will<br />
insert WAIT_FOR Open<br />
Frame command right before<br />
each OPEN_ACCEPT primitive.<br />
FALSE When set, the generator will<br />
insert WAIT_FOR Open<br />
Frame command right before<br />
each OPEN_REJECT primitive.<br />
FALSE When set, the generator will<br />
insert WAIT_FOR Open<br />
Frame command right before<br />
each primitive of AIP group.<br />
FALSE When set, the generator will<br />
insert WAIT_FOR SMP<br />
Request Frame command<br />
right before each SMP<br />
Response Frame.<br />
FALSE When set, the generator will<br />
insert WAIT_FOR<br />
SATA_R_RDY command<br />
immediately after each case<br />
of SATA_CONT primitive<br />
following SATA_X_RDY<br />
primitive.<br />
FALSE When set, the generator will<br />
insert WAIT_FOR<br />
SATA_R_ERR or<br />
SATA_R_OK command<br />
immediately after each case<br />
of SATA_CONT primitive<br />
following SATA_WTRM<br />
primitive.<br />
184<br />
Description
<strong>LeCroy</strong> <strong>SATracer</strong>/<strong>Trainer</strong> Analyzer User’s <strong>Manual</strong> SW Version 4.6<br />
Setting<br />
AUTO_WAIT_SATA_AFTER_PM<br />
REQ_S_FOR_RESPONSE<br />
AUTO_WAIT_SATA_AFTER_PM<br />
REQ_P_FOR_RESPONSE<br />
AUTO_WAIT_SATA_AFTER_<br />
SYNC_FOR_SYNC<br />
AUTO_WAIT_SATA_BEFORE Settings<br />
AUTO_WAIT_SATA_BEFORE_<br />
PMACK_FOR_PMREQ<br />
AUTO_WAIT_SATA_BEFORE_<br />
PMNAK_FOR_PMREQ<br />
Table 2: Generation Settings<br />
Default<br />
Value<br />
FALSE When set, the generator will<br />
insert WAIT_FOR<br />
SATA_PMACK or<br />
SATA_PMNAK command<br />
immediately after each case<br />
of SATA_CONT primitive<br />
following SATA_PMREQ_S<br />
primitive.<br />
FALSE When set, the generator will<br />
insert WAIT_FOR<br />
SATA_PMACK or<br />
SATA_PMNAK command<br />
immediately after each case<br />
of SATA_CONT primitive<br />
following SATA_PMREQ_P<br />
primitive.<br />
FALSE When set, the generator will<br />
insert WAIT_FOR<br />
SATA_SYNC command<br />
immediately after each case<br />
of SATA_CONT primitive<br />
following SATA_SYNC<br />
primitive.<br />
FALSE When set, the generator will<br />
insert WAIT_FOR<br />
SATA_PMREQ_S or<br />
SATA_PMREQ_P command<br />
right before each<br />
SATA_PMACK primitive.<br />
FALSE When set, the generator will<br />
insert WAIT_FOR<br />
SATA_PMREQ_S or<br />
SATA_PMREQ_P command<br />
right before each<br />
SATA_PMNAK primitive.<br />
185<br />
Description
<strong>LeCroy</strong> <strong>SATracer</strong>/<strong>Trainer</strong> Analyzer User’s <strong>Manual</strong> SW Version 4.6<br />
Setting<br />
AUTO_WAIT_SATA_BEFORE_<br />
RERR_FOR_WTRM<br />
AUTO_WAIT_SATA_BEFORE_<br />
ROK_FOR_WTRM<br />
AUTO_WAIT_SATA_BEFORE_RI<br />
P_FOR_SOF<br />
AUTO_WAIT_SATA_BEFORE_<br />
R_RDY_FOR_X_RDY<br />
Table 2: Generation Settings<br />
Default<br />
Value<br />
12.6 Setting Complex "Wait For" Conditions<br />
The Generation Options dialog lets users define complex "Wait For" events<br />
and assign a letter value ("A" through "F") to the definition so that you can<br />
refer to the definition by letter instead of by textual name.<br />
Once a letter value has been assigned to an event, the letter is referred to in<br />
your generation script using the following command syntax:<br />
Wait_For {WF_REC_RESOURCES_OUTPUT_A}<br />
where "A," in this case, is the defined condition.<br />
FALSE When set, the generator will<br />
insert WAIT_FOR<br />
SATA_R_ERR command<br />
right before each<br />
SATA_WTRM primitive.<br />
FALSE When set, the generator will<br />
insert WAIT_FOR<br />
SATA_R_OK command<br />
right before each<br />
SATA_WTRM primitive.<br />
FALSE When set, the generator will<br />
insert WAIT_FOR<br />
SATA_R_IP command right<br />
before each SATA_SOF<br />
primitive.<br />
FALSE When set, the generator will<br />
insert WAIT_FOR<br />
SATA_X_RDY command<br />
right before each<br />
SATA_R_RDY primitive.<br />
186<br />
Description
<strong>LeCroy</strong> <strong>SATracer</strong>/<strong>Trainer</strong> Analyzer User’s <strong>Manual</strong> SW Version 4.6<br />
Setting Conditions with the Generation Options Dialog<br />
To set a complex condition, open the Generation Options dialog:<br />
Step 1 Select Generate > Generation Options from the menu.<br />
The Generation Options dialog opens. The Generation<br />
Options dialog looks very similar to the Recording Rules<br />
dialog:<br />
Step 2 Click the New Events button and select an event from the menu.<br />
The selected event should appear in the Available Events area<br />
along the left side of the dialog box.<br />
Step 3 Drag the new event button to the Global State cell.<br />
Step 4 Right-click on the new event button and select Specify Action(s).<br />
A menu appears showing the letters A through F and the option<br />
"No action."<br />
187
<strong>LeCroy</strong> <strong>SATracer</strong>/<strong>Trainer</strong> Analyzer User’s <strong>Manual</strong> SW Version 4.6<br />
Step 5 Select a letter from the menu.<br />
The menu closes. The event<br />
button should now point to a<br />
neighboring button that has the<br />
letter value you assigned.<br />
Step 6 Once the condition has been defined, you can then add the<br />
Wait For command line (with whatever letter you assigned)<br />
to your script. For example:<br />
Wait_For {WF_REC_RESOURCES_OUTPUT_A}<br />
188
<strong>LeCroy</strong> <strong>SATracer</strong>/<strong>Trainer</strong> Analyzer User’s <strong>Manual</strong> SW Version 4.6<br />
13. Updates and Licensing<br />
From time to time as modifications are made to the <strong>SATracer</strong>/<strong>Trainer</strong><br />
Analyzer, it may become necessary to update the <strong>SATracer</strong>/<strong>Trainer</strong><br />
software. You can obtain new software from the <strong>LeCroy</strong> website:<br />
www.lecroy.com<br />
When you download new SASTracer software, firmware and BusEngine<br />
files are included as part of the software package. Occasionally, <strong>LeCroy</strong><br />
will update these files. The new files will install automatically following<br />
installation of the new analyzer software. If you prefer, however, you can<br />
manually update firmware and BusEngine. This chapter describes both<br />
automatic and manual updates.<br />
Note: <strong>LeCroy</strong> analyzers come with a Three Year Investment<br />
Protection Agreement that entitles users to new software.<br />
Thereafter, to obtain new software the user will need to renew<br />
the <strong>LeCroy</strong> Maintenance Agreement. Contact <strong>LeCroy</strong> for<br />
details.<br />
13.1 Software, Firmware, and BusEngine Versions<br />
The Readme.txt file on the installation CD and on the installed directory on<br />
your hard drive gives last-minute updates about the current release. Included<br />
with each release are the most recent downloadable images of the Firmware<br />
and the BusEngine.<br />
Once the <strong>SATracer</strong>/<strong>Trainer</strong> Analyzer has completed the self diagnostics<br />
and is connected to the PC, you can check the latest version of the software<br />
and BusEngine.<br />
To check information about the current software, select<br />
About SASTracer… from the Help menu.<br />
The About SASTracer window appears.<br />
About SASTracer details revisions of the following software and<br />
hardware:<br />
• <strong>SATracer</strong>/<strong>Trainer</strong> Software Version, Build Number<br />
• <strong>SATracer</strong>/<strong>Trainer</strong> Firmware Version<br />
• BusEngine Version, Build Number<br />
• Unit Serial Number<br />
189
<strong>LeCroy</strong> <strong>SATracer</strong>/<strong>Trainer</strong> Analyzer User’s <strong>Manual</strong> SW Version 4.6<br />
Note: When contacting <strong>LeCroy</strong> for technical support, please have<br />
available all the revisions reported in the About SASTracer<br />
window.<br />
13.2 Software Updates<br />
When a new software release is available, it is posted on the Support page<br />
of the <strong>LeCroy</strong> website at www.<strong>LeCroy</strong>.com/support.html.<br />
To update the software, follow these steps:<br />
Step 1 Find the latest released software version on the <strong>LeCroy</strong> website<br />
under Support.<br />
If you are running the latest version of the software, no further<br />
action is needed.<br />
If you are not running the latest version, continue to Step 3.<br />
Step 2 Download the Zip file from the website.<br />
Step 3 Unzip the files into your choice of directory.<br />
Step 4 Click Start, then Run, and browse to where you unzipped<br />
the files.<br />
Step 5 Select the program named Setup and click Open.<br />
Step 6 Click OK to run the Setup and begin the installation.<br />
Step 7 Follow the on-screen instructions to complete the<br />
installation.<br />
Step 8 Read the Readme file for important information on changes<br />
in the release.<br />
190
<strong>LeCroy</strong> <strong>SATracer</strong>/<strong>Trainer</strong> Analyzer User’s <strong>Manual</strong> SW Version 4.6<br />
13.3 Automatic BusEngine and Firmware Updates<br />
BusEngine and Firmware updates often need to be performed when you<br />
update the <strong>SATracer</strong>/<strong>Trainer</strong> software. These updates can be performed<br />
automatically or manually. Both processes are described.<br />
Updating the BusEngine<br />
The BusEngine core is the heart of the <strong>SATracer</strong>/<strong>Trainer</strong> Analyzer. Using<br />
FPGA technology, it incorporates both the high speed recording engine and<br />
the configurable building blocks that implement data/state/error detections,<br />
triggering, capture filtering, external signal monitoring, and event counting<br />
and sequencing. Both the BusEngine program and the Firmware that<br />
manages the internal microcontroller are fully field updateable.<br />
Within a new software release, it may be necessary to update the Analyzer’s<br />
BusEngine hardware for proper operation. The Readme file lets you know<br />
if this is necessary.<br />
Updating the Firmware<br />
Within a new software release, it may also be necessary to update the<br />
Analyzer’s firmware for proper operation. The Readme file informs you if<br />
this is necessary.<br />
Automatic Updates<br />
When the <strong>SATracer</strong>/<strong>Trainer</strong> software is updated, the software may become<br />
incompatible with the BusEngine and Firmware. If a recording is attempted,<br />
<strong>SATracer</strong>/<strong>Trainer</strong> displays an error message and then automatically begins<br />
an update process for the BusEngine and Firmware.<br />
To perform an automatic BusEngine and Firmware update, follow these<br />
steps:<br />
Step 1 If needed, update the <strong>SATracer</strong>/<strong>Trainer</strong> software, following the<br />
steps outlined in "Software Updates."<br />
Step 2 Turn on the <strong>SATracer</strong>/<strong>Trainer</strong> Analyzer.<br />
Step 3 Select Start > Record from the menu.<br />
Because the BusEngine and/or the Firmware are incompatible with<br />
the current <strong>SATracer</strong>/<strong>Trainer</strong> software version, an error message<br />
191
<strong>LeCroy</strong> <strong>SATracer</strong>/<strong>Trainer</strong> Analyzer User’s <strong>Manual</strong> SW Version 4.6<br />
appears showing your current versions and indicating what versions<br />
you need to install.<br />
Step 4 Click Yes.<br />
The Analyzer Setup window appears.<br />
Step 5 Click Update.<br />
You can select only one item at this point. If both the BusEngine<br />
and the Firmware need to be updated, the update will complete for<br />
the first item and then return to the above window so the second<br />
update can be performed.<br />
Note: Once you have started updating the BusEngine or Firmware, do<br />
not interrupt the update!<br />
When the second update has finished, the following message<br />
appears and tells you that the update is complete.<br />
192
<strong>LeCroy</strong> <strong>SATracer</strong>/<strong>Trainer</strong> Analyzer User’s <strong>Manual</strong> SW Version 4.6<br />
Step 6 To complete the update, power cycle the <strong>SATracer</strong>/<strong>Trainer</strong><br />
(turn the unit off then back on).<br />
If you are running Windows 2000, the Analyzer will automatically<br />
reboot, and the following message will appear:<br />
Step 7 Click OK.<br />
In this instance, you do not need to power cycle the Analyzer (turn<br />
off then back on).<br />
13.4 License Information<br />
Licensing information for SASTracer can be viewed by selecting Display<br />
License Information from the Help menu. The License window provides<br />
maintenance expiration for SASTracer.<br />
193
<strong>LeCroy</strong> <strong>SATracer</strong>/<strong>Trainer</strong> Analyzer User’s <strong>Manual</strong> SW Version 4.6<br />
13.5 Updating the Software License<br />
A current License agreement with <strong>LeCroy</strong> entitles the analyzer owner to<br />
continued technical support and access to software updates as they are<br />
published on the <strong>LeCroy</strong> website.<br />
If your license expires, a License Key must be obtained by <strong>LeCroy</strong> (refer to<br />
the contact information at the back of this manual.)<br />
Once the License Key is obtained, follow these steps to install it:<br />
Step 1 From the Help menu, select Update License. The Update License<br />
dialog appears.<br />
Step 2 Enter the path and filename for the License key or use the Browse<br />
button to navigate to the directory that contains the License Key.<br />
Step 3 Select the *.lic file, and then click Update Device.<br />
194
<strong>LeCroy</strong> <strong>SATracer</strong>/<strong>Trainer</strong> Analyzer User’s <strong>Manual</strong> SW Version 4.6<br />
Appendix A: Specifications<br />
<strong>SATracer</strong>/<strong>Trainer</strong> is a hardware module that installs into the <strong>CATC</strong> 10K<br />
System. The following specifications describe a combined<br />
<strong>SATracer</strong>/<strong>Trainer</strong> on the <strong>CATC</strong> 10K chassis.<br />
Package<br />
Dimensions: <strong>CATC</strong> 10K: 12.2 x 12.2 x 3.5 inches<br />
(31.1 x 31.1 x 8.9 cm)<br />
SASTracer Plug-in: 4.5 x 6.7 x 1.3 inches<br />
(11.3 x 17.0 x 3.2 cm)<br />
SAS/SATA Exerciser Plug-in: 4.5 x 6.7 x 1.3 inches<br />
(11.3 x 17.0 x 3.2 cm)<br />
Connectors: <strong>CATC</strong> 10K:<br />
AC power connection<br />
External trigger connection (TRIG IN/OUT, BNC)<br />
PC connection (USB 2.0 Hi-Speed, type "B")<br />
Break-out board (type "D")<br />
Weight: <strong>CATC</strong> 10K: 9.5 lbs (4.3 kg)<br />
SASTracer Plug-in: 1 lb 11.4 oz (.77 kg)<br />
SAS/SATA Exerciser Plug-in: 1 lb 11.4 oz (.77 kg)<br />
Power Requirements<br />
90-254VAC, 47-63Hz (universal input), 120W maximum<br />
Environmental Conditions<br />
Operating Range: 0 to 40 °C (32 to 104 °F)<br />
Storage Range: -20 to 80 °C (-4 to 176 °F)<br />
Humidity: 10 to 90%, non-condensing<br />
Probing Characteristics (model SS002MAA & SS003MAA)<br />
Connecting Type: One Port Model - Single Pair of Internal Connectors<br />
(Initiator and Target; Serial ATA Standard)<br />
Two Port Model - Dual Pair of Internal Connectors<br />
(Initiator and Target; Serial ATA Standard)<br />
Four Port Model - Single Pair of Internal Connectors<br />
(Initiator and Target; Serial ATA Standard)<br />
SAS/SATA Exerciser<br />
Connection Type:<br />
Single Initiator and Target connectors<br />
(for transmission only)<br />
195
<strong>LeCroy</strong> <strong>SATracer</strong>/<strong>Trainer</strong> Analyzer User’s <strong>Manual</strong> SW Version 4.6<br />
Probing Characteristics (model SS004MAA)<br />
Connector Type: 2 pairs SAS External 4 lane Connector:<br />
Non-intrusive tap - samples the signal without re-driving<br />
the differential lines (high value resistors contribute to<br />
reduction in amplitude ˜ 15%).<br />
Repeater tap - re-drives the signal at either SAS (high<br />
swing) or SATA (low swing) voltages; does not re-time the<br />
signal.<br />
Recording Memory Size<br />
2 GBytes for trace capture, timing and control information.<br />
Host PC Requirements<br />
Operating System: Windows 98SE, Windows 2000, Windows ME or<br />
Windows XP<br />
Switches<br />
Power: On/off<br />
<strong>Manual</strong> Trigger: When pressed, triggers the end of the recording<br />
LEDs<br />
<strong>CATC</strong> 10K: Illuminated when the analyzer is powered on.<br />
Status (STATUS): Illuminates for approximately 25 seconds during<br />
initialization/power up of the UPAS base unit. If this LED<br />
blinks following initialization, this is an indication that<br />
initialization failed.<br />
Recording (REC): Illuminated when the analyzer is actively recording traffic<br />
data<br />
Triggered (TRG): Illuminated during power-on testing and when the analyzer<br />
has detected a valid trigger condition.<br />
UPloading (UPLD): Illuminated when the analyzer is uploading its recording<br />
memory to the Host PC for displaying the <strong>CATC</strong> trace<br />
SASTracer Plug-in<br />
Module:<br />
Status (STATUS): Illuminates when there is traffic on both the host and device<br />
sides. Blinks when there is traffic on one side only.<br />
196
<strong>LeCroy</strong> <strong>SATracer</strong>/<strong>Trainer</strong> Analyzer User’s <strong>Manual</strong> SW Version 4.6<br />
Basic Trigger Events<br />
Frames: SSP Command, Data, Response, Task, X_RDY and<br />
Vendor Unique, SMP Request, Response, Report, Discover<br />
and Configure<br />
Primitives: ACK, CREDIT_BLOCKED, DONE<br />
(ACK/NAK TIMEOUT), NAK, RRDY, SOF, AIP,<br />
BREAK, BROADCAST, CLOSE, OPEN_ACCEPT,<br />
OPEN_REJECT, and more task management functions<br />
Errors: Invalid 10b codes, CRC Errors, Running Disparity Errors,<br />
Time-outs, Alignment errors, Code Violation<br />
SCSI Operations: Pending SCSI I/Os, SCSI I/O Response, SCSI I/O Latency,<br />
SCSI I/O Throughput, Frame Length, Data Throughput,<br />
Link Utilization (%), Frame Count<br />
Traffic Summary Reports<br />
Data Frames<br />
Primitives<br />
Connects/Disconnects<br />
Errors<br />
ATA Commands<br />
Read Response (min, max, avg.)<br />
Write Response (min, max, avg.)<br />
197
<strong>LeCroy</strong> <strong>SATracer</strong>/<strong>Trainer</strong> Analyzer User’s <strong>Manual</strong> SW Version 4.6<br />
198
<strong>LeCroy</strong> <strong>SATracer</strong>/<strong>Trainer</strong> Analyzer User’s <strong>Manual</strong> SW Version 4.6<br />
How to Contact <strong>LeCroy</strong><br />
Type of Service Contact<br />
Call for technical support… US and Canada: 1 (800) 909-2282<br />
Worldwide: 1 (408) 653-1260<br />
Fax your questions… Worldwide: 1 (408) 727-6622<br />
Write a letter… <strong>LeCroy</strong><br />
Send e-mail…<br />
Protocol Solutions Group<br />
Customer Support<br />
3385 Scott Blvd.<br />
Santa Clara, CA 95054<br />
USA<br />
support@<strong>CATC</strong>.com<br />
Visit <strong>LeCroy</strong>’s web site… http://www.lecroy.com/<br />
Limited Hardware Warranty<br />
So long as you or your authorized<br />
representative ("you" or "your"), fully<br />
complete and return the registration card<br />
provided with the applicable hardware product<br />
or peripheral hardware products (each a<br />
"Product") within fifteen days of the date of receipt from <strong>LeCroy</strong> or one of its<br />
authorized representatives, <strong>LeCroy</strong> warrants that the Product will be free from<br />
defects in materials and workmanship for a period of three years (the "Warranty<br />
Period"). You may also complete your registration form via the internet by visiting<br />
http://www.lecroy.com/support/register/. The Warranty Period commences on the<br />
earlier of the date of delivery by <strong>LeCroy</strong> of a Product to a common carrier for<br />
shipment to you or to <strong>LeCroy</strong>'s authorized representative from whom you purchase<br />
the Product.<br />
What this Warranty Does Not Cover<br />
This warranty does not cover damage due to external causes including accident,<br />
damage during shipment after delivery to a common carrier by <strong>LeCroy</strong>, abuse,<br />
misuse, problems with electrical power, including power surges and outages,<br />
servicing not authorized by <strong>LeCroy</strong>, usage or operation not in accordance with<br />
Product instructions, failure to perform required preventive maintenance, software<br />
related problems (whether or not provided by <strong>LeCroy</strong>), problems caused by use of<br />
accessories, parts or components not supplied by <strong>LeCroy</strong>, Products that have been<br />
modified or altered by someone other than <strong>LeCroy</strong>, Products with missing or altered<br />
service tags or serial numbers, and Products for which <strong>LeCroy</strong> has not received<br />
payment in full.<br />
199
<strong>LeCroy</strong> <strong>SATracer</strong>/<strong>Trainer</strong> Analyzer User’s <strong>Manual</strong> SW Version 4.6<br />
Coverage During Warranty Period<br />
During the Warranty Period, <strong>LeCroy</strong> or its authorized representatives will repair or<br />
replace Products, at <strong>LeCroy</strong>'s sole discretion, covered under this limited warranty<br />
that are returned directly to <strong>LeCroy</strong>'s facility or through <strong>LeCroy</strong>'s authorized<br />
representatives.<br />
How to Obtain Warranty Service<br />
To request warranty service, you must complete and return the registration card or<br />
register via the internet within the fifteen day period described above and report<br />
your covered warranty claim by contacting <strong>LeCroy</strong> Technical Support or its<br />
authorized representative.<br />
<strong>LeCroy</strong> Technical Support can be reached at 800-909-7112 or via email at<br />
support@catc.com. You may also refer to <strong>LeCroy</strong>'s website at<br />
http://www.lecroy.com for more information on how to contact an authorized<br />
representative in your region. If warranty service is required, <strong>LeCroy</strong> or its<br />
authorized representative will issue a Return Material Authorization Number. You<br />
must ship the Product back to <strong>LeCroy</strong> or its authorized representative, in its original<br />
or equivalent packaging, prepay shipping charges, and insure the shipment or<br />
accept the risk of loss or damage during shipment. <strong>LeCroy</strong> must receive the Product<br />
prior to expiration of the Warranty Period for the repair(s) to be covered. <strong>LeCroy</strong><br />
or its authorized representative will thereafter ship the repaired or replacement<br />
Product to you freight prepaid by <strong>LeCroy</strong> if you are located in the continental<br />
United States. Shipments made outside the continental United States will be sent<br />
freight collect.<br />
Please remove any peripheral accessories or parts before you ship the Product.<br />
<strong>LeCroy</strong> does not accept liability for lost or damaged peripheral accessories, data or<br />
software.<br />
<strong>LeCroy</strong> owns all parts removed from Products it repairs. <strong>LeCroy</strong> may use new<br />
and/or reconditioned parts, at its sole discretion, made by various manufacturers in<br />
performing warranty repairs. If <strong>LeCroy</strong> repairs or replaces a Product, the Warranty<br />
Period for the Product is not extended.<br />
If <strong>LeCroy</strong> evaluates and determines there is "no trouble found" in any Product<br />
returned or that the returned Product is not eligible for warranty coverage, <strong>LeCroy</strong><br />
will inform you of its determination. If you thereafter request <strong>LeCroy</strong> to repair the<br />
Product, such labor and service shall be performed under the terms and conditions<br />
200
<strong>LeCroy</strong> <strong>SATracer</strong>/<strong>Trainer</strong> Analyzer User’s <strong>Manual</strong> SW Version 4.6<br />
of <strong>LeCroy</strong>'s then current repair policy. If you chose not to have the Product repaired<br />
by <strong>LeCroy</strong>, you agree to pay <strong>LeCroy</strong> for the cost to return the Product to you and<br />
that <strong>LeCroy</strong> may require payment in advance of shipment.<br />
General Provisions<br />
THIS LIMITED WARRANTY GIVES YOU SPECIFIC LEGAL RIGHTS. YOU<br />
MAY HAVE ADDITIONAL RIGHTS THAT VARY BY JURISDICTION.<br />
LECROY'S RESPONSIBILITY FOR DEFECTS IN MATERIALS AND<br />
WORKMANSHIP IS LIMITED TO REPAIR AND REPLACEMENT AS SET<br />
FORTH IN THIS LIMITED WARRANTY STATEMENT. EXCEPT AS<br />
EXPRESSLY STATED IN THIS WARRANTY STATEMENT, LECROY<br />
DISCLAIMS ALL EXPRESS AND IMPLIED WARRANTIES FOR ANY<br />
PRODUCT INCLUDING, BUT NOT LIMITED TO, ANY IMPLIED<br />
WARRANTIES OF AND CONDITIONS OF MERCHANTABILITY AND<br />
FITNESS FOR A PARTICULAR PURPOSE, AND ANY WARRANTIES THAT<br />
MAY ARISE FROM ANY COURSE OF DEALING, COURSE OF<br />
PERFORMANCE OR TRADE USAGE. SOME JURISDICTIONS MAY NOT<br />
ALLOW LIMITATIONS ON HOW LONG AN IMPLIED WARRANTY LASTS,<br />
SO THE PRECEDING LIMITATION MAY NOT APPLY TO YOU.<br />
LECROY DOES NOT ACCEPT LIABILITY BEYOND THE REMEDIES SET<br />
FORTH IN THIS LIMITED WARRANTY STATEMENT OR FOR<br />
INCIDENTAL OR CONSEQUENTIAL DAMAGES INCLUDING, WITHOUT<br />
LIMITATION, ANY LIABILITY FOR THIRD PARTY CLAIMS AGAINST<br />
YOU FOR DAMAGES, PRODUCTS NOT BEING AVAILABLE FOR USE, OR<br />
FOR LOST DATA OR SOFTWARE. LECROY'S LIABILITY TO YOU MAY<br />
NOT EXCEED THE AMOUNT YOU PAID FOR THE PRODUCT THAT IS THE<br />
SUBJECT OF A CLAIM. SOME JURISDICTIONS DO NOT ALLOW THE<br />
EXCLUSION OR LIMITATION OF INCIDENTAL OR CONSEQUENTIAL<br />
DAMAGES, SO THE PRECEDING EXCLUSION OR LIMITATION MAY NOT<br />
APPLY TO YOU.<br />
The limited warranty on a Product may be transferred for the remaining term if the<br />
then current owner transfers ownership of the Product and notifies <strong>LeCroy</strong> of the<br />
transfer. You may notify <strong>LeCroy</strong> of the transfer by writing to Technical Support at<br />
<strong>LeCroy</strong>, 3385 Scott Blvd., Santa Clara, CA 95054 USA or by email at:<br />
support@catc.com. Please include the transferring owner's name and address, the<br />
name and address of the new owner, the date of transfer, and the Product serial<br />
number.<br />
201
<strong>LeCroy</strong> <strong>SATracer</strong>/<strong>Trainer</strong> Analyzer User’s <strong>Manual</strong> SW Version 4.6<br />
202