

Brushstrokes - October 2011 - Surface Coatings Association of New ...
Brushstrokes - October 2011 - Surface Coatings Association of New ...
Brushstrokes - October 2011 - Surface Coatings Association of New ...

You also want an ePaper? Increase the reach of your titles
YUMPU automatically turns print PDFs into web optimized ePapers that Google loves.
Table 1 – interior wall paint formulation<br />
techniques to achieve the optimum particle size distribution without<br />
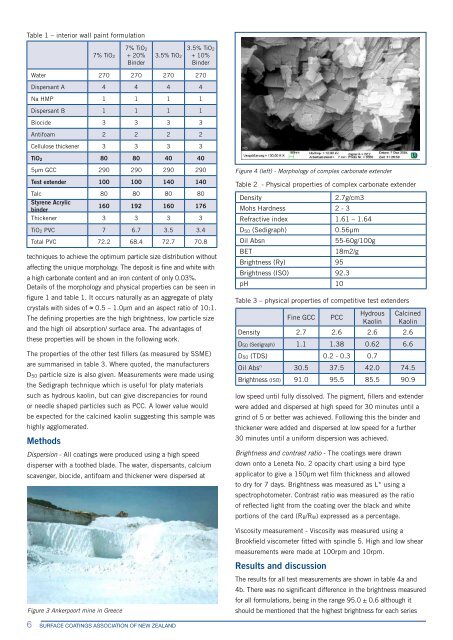
affecting the unique morphology. The deposit is fine and white with<br />
a high carbonate content and an iron content <strong>of</strong> only 0.03%.<br />
Details <strong>of</strong> the morphology and physical properties can be seen in<br />
figure 1 and table 1. It occurs naturally as an aggregate <strong>of</strong> platy<br />
crystals with sides <strong>of</strong> ≈ 0.5 – 1.0µm and an aspect ratio <strong>of</strong> 10:1.<br />
The defining properties are the high brightness, low particle size<br />
and the high oil absorption/ surface area. The advantages <strong>of</strong><br />
these properties will be shown in the following work.<br />
The properties <strong>of</strong> the other test fillers (as measured by SSME)<br />
are summarised in table 3. Where quoted, the manufacturers<br />
D50 particle size is also given. Measurements were made using<br />
the Sedigraph technique which is useful for platy materials<br />
such as hydrous kaolin, but can give discrepancies for round<br />
or needle shaped particles such as PCC. A lower value would<br />
be expected for the calcined kaolin suggesting this sample was<br />
highly agglomerated.<br />
Methods<br />
7% TiO2<br />
7% TiO2<br />
+ 20%<br />
Binder<br />
3.5% TiO2<br />
Dispersion - All coatings were produced using a high speed<br />
disperser with a toothed blade. The water, dispersants, calcium<br />
scavenger, biocide, antifoam and thickener were dispersed at<br />
6 SURFACE COATINGS ASSOCIATION OF NEW ZEALAND<br />
3.5% TiO2<br />
+ 10%<br />
Binder<br />
Water 270 270 270 270<br />
Dispersant A 4 4 4 4<br />
Na HMP 1 1 1 1<br />
Dispersant B 1 1 1 1<br />
Biocide 3 3 3 3<br />
Antifoam 2 2 2 2<br />
Cellulose thickener 3 3 3 3<br />
TiO2 80 80 40 40<br />
5µm GCC 290 290 290 290<br />
Test extender 100 100 140 140<br />
Talc 80 80 80 80<br />
Styrene Acrylic<br />
binder<br />
160 192 160 176<br />
Thickener 3 3 3 3<br />
TiO2 PVC 7 6.7 3.5 3.4<br />
Total PVC 72.2 68.4 72.7 70.8<br />
Figure 3 Ankerpoort mine in Greece<br />
Figure 4 (left) - Morphology <strong>of</strong> complex carbonate extender<br />
Table 2 - Physical properties <strong>of</strong> complex carbonate extender<br />
Density 2.7g/cm3<br />
Mohs Hardness 2 - 3<br />
Refractive index 1.61 – 1.64<br />
D50 (Sedigraph) 0.56µm<br />
Oil Absn 55-60g/100g<br />
BET 18m2/g<br />
Brightness (Ry) 95<br />
Brightness (ISO) 92.3<br />
pH 10<br />
Table 3 – physical properties <strong>of</strong> competitive test extenders<br />
Fine GCC PCC<br />
low speed until fully dissolved. The pigment, fillers and extender<br />
were added and dispersed at high speed for 30 minutes until a<br />
grind <strong>of</strong> 5 or better was achieved. Following this the binder and<br />
thickener were added and dispersed at low speed for a further<br />
30 minutes until a uniform dispersion was achieved.<br />
Brightness and contrast ratio - The coatings were drawn<br />
down onto a Leneta No. 2 opacity chart using a bird type<br />
applicator to give a 150µm wet film thickness and allowed<br />
to dry for 7 days. Brightness was measured as L* using a<br />
spectrophotometer. Contrast ratio was measured as the ratio<br />
<strong>of</strong> reflected light from the coating over the black and white<br />
portions <strong>of</strong> the card (RB/RW) expressed as a percentage.<br />
Viscosity measurement - Viscosity was measured using a<br />
Brookfield viscometer fitted with spindle 5. High and low shear<br />
measurements were made at 100rpm and 10rpm.<br />
Results and discussion<br />
Hydrous<br />
Kaolin<br />
Calcined<br />
Kaolin<br />
Density 2.7 2.6 2.6 2.6<br />
D50 (Sedigraph) 1.1 1.38 0.62 6.6<br />
D50 (TDS) 0.2 - 0.3 0.7<br />
Oil Absn 30.5 37.5 42.0 74.5<br />
Brightness (ISO) 91.0 95.5 85.5 90.9<br />
The results for all test measurements are shown in table 4a and<br />
4b. There was no significant difference in the brightness measured<br />
for all formulations, being in the range 95.0 ± 0.6 although it<br />
should be mentioned that the highest brightness for each series