

Shadow Economies and Corruption All Over the World - Index of - IZA
Shadow Economies and Corruption All Over the World - Index of - IZA
Shadow Economies and Corruption All Over the World - Index of - IZA

Create successful ePaper yourself
Turn your PDF publications into a flip-book with our unique Google optimized e-Paper software.
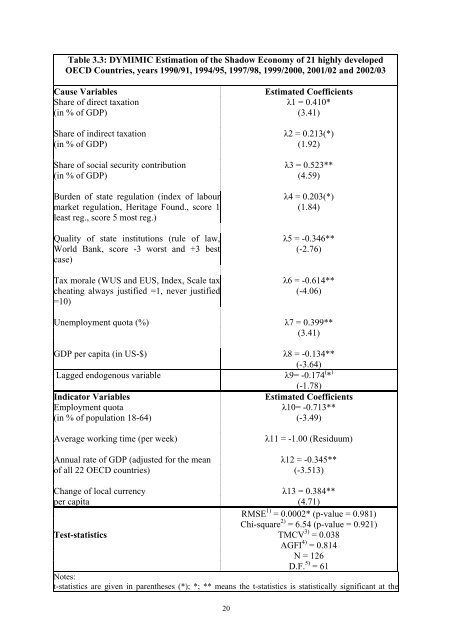
Table 3.3: DYMIMIC Estimation <strong>of</strong> <strong>the</strong> <strong>Shadow</strong> Economy <strong>of</strong> 21 highly developed<br />
OECD Countries, years 1990/91, 1994/95, 1997/98, 1999/2000, 2001/02 <strong>and</strong> 2002/03<br />
Cause Variables Estimated Coefficients<br />
Share <strong>of</strong> direct taxation λ1 = 0.410*<br />
(in % <strong>of</strong> GDP) (3.41)<br />
Share <strong>of</strong> indirect taxation λ2 = 0.213(*)<br />
(in % <strong>of</strong> GDP) (1.92)<br />
Share <strong>of</strong> social security contribution λ3 = 0.523**<br />
(in % <strong>of</strong> GDP) (4.59)<br />
Burden <strong>of</strong> state regulation (index <strong>of</strong> labour<br />
market regulation, Heritage Found., score 1<br />
least reg., score 5 most reg.)<br />
Quality <strong>of</strong> state institutions (rule <strong>of</strong> law,<br />
<strong>World</strong> Bank, score -3 worst <strong>and</strong> +3 best<br />
case)<br />
Tax morale (WUS <strong>and</strong> EUS, <strong>Index</strong>, Scale tax<br />
cheating always justified =1, never justified<br />
=10)<br />
λ4 = 0.203(*)<br />
(1.84)<br />
λ5 = -0.346**<br />
(-2.76)<br />
λ6 = -0.614**<br />
(-4.06)<br />
Unemployment quota (%) λ7 = 0.399**<br />
(3.41)<br />
GDP per capita (in US-$) λ8 = -0.134**<br />
(-3.64)<br />
Lagged endogenous variable<br />
λ9= -0.174 ( * )<br />
(-1.78)<br />
Indicator Variables Estimated Coefficients<br />
Employment quota λ10= -0.713**<br />
(in % <strong>of</strong> population 18-64) (-3.49)<br />
Average working time (per week) λ11 = -1.00 (Residuum)<br />
Annual rate <strong>of</strong> GDP (adjusted for <strong>the</strong> mean λ12 = -0.345**<br />
<strong>of</strong> all 22 OECD countries) (-3.513)<br />
Change <strong>of</strong> local currency λ13 = 0.384**<br />
per capita (4.71)<br />
RMSE 1) = 0.0002* (p-value = 0.981)<br />
Chi-square 2) = 6.54 (p-value = 0.921)<br />
Test-statistics TMCV 3) = 0.038<br />
AGFI 4) = 0.814<br />
N = 126<br />
D.F. 5) = 61<br />
Notes:<br />
t-statistics are given in paren<strong>the</strong>ses (*); *; ** means <strong>the</strong> t-statistics is statistically significant at <strong>the</strong><br />
20


