

Shadow Economies and Corruption All Over the World - Index of - IZA
Shadow Economies and Corruption All Over the World - Index of - IZA
Shadow Economies and Corruption All Over the World - Index of - IZA

You also want an ePaper? Increase the reach of your titles
YUMPU automatically turns print PDFs into web optimized ePapers that Google loves.
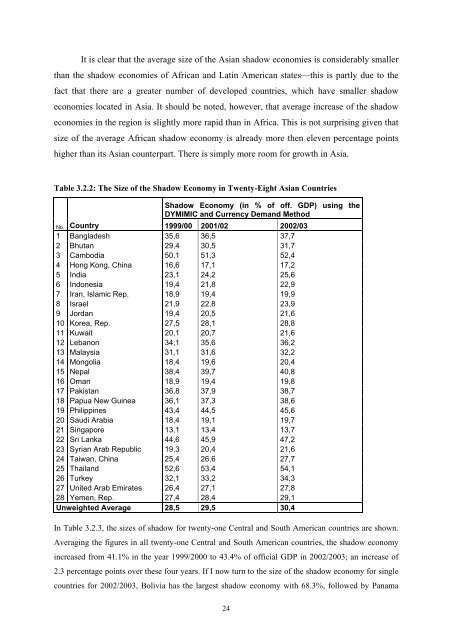
It is clear that <strong>the</strong> average size <strong>of</strong> <strong>the</strong> Asian shadow economies is considerably smaller<br />
than <strong>the</strong> shadow economies <strong>of</strong> African <strong>and</strong> Latin American states––this is partly due to <strong>the</strong><br />
fact that <strong>the</strong>re are a greater number <strong>of</strong> developed countries, which have smaller shadow<br />
economies located in Asia. It should be noted, however, that average increase <strong>of</strong> <strong>the</strong> shadow<br />
economies in <strong>the</strong> region is slightly more rapid than in Africa. This is not surprising given that<br />
size <strong>of</strong> <strong>the</strong> average African shadow economy is already more <strong>the</strong>n eleven percentage points<br />
higher than its Asian counterpart. There is simply more room for growth in Asia.<br />
Table 3.2.2: The Size <strong>of</strong> <strong>the</strong> <strong>Shadow</strong> Economy in Twenty-Eight Asian Countries<br />
<strong>Shadow</strong> Economy (in % <strong>of</strong> <strong>of</strong>f. GDP) using <strong>the</strong><br />
DYMIMIC <strong>and</strong> Currency Dem<strong>and</strong> Method<br />
No. Country 1999/00 2001/02 2002/03<br />
1 Bangladesh 35,6 36,5 37,7<br />
2 Bhutan 29,4 30,5 31,7<br />
3 Cambodia 50,1 51,3 52,4<br />
4 Hong Kong, China 16,6 17,1 17,2<br />
5 India 23,1 24,2 25,6<br />
6 Indonesia 19,4 21,8 22,9<br />
7 Iran, Islamic Rep. 18,9 19,4 19,9<br />
8 Israel 21,9 22,8 23,9<br />
9 Jordan 19,4 20,5 21,6<br />
10 Korea, Rep. 27,5 28,1 28,8<br />
11 Kuwait 20,1 20,7 21,6<br />
12 Lebanon 34,1 35,6 36,2<br />
13 Malaysia 31,1 31,6 32,2<br />
14 Mongolia 18,4 19,6 20,4<br />
15 Nepal 38,4 39,7 40,8<br />
16 Oman 18,9 19,4 19,8<br />
17 Pakistan 36,8 37,9 38,7<br />
18 Papua New Guinea 36,1 37,3 38,6<br />
19 Philippines 43,4 44,5 45,6<br />
20 Saudi Arabia 18,4 19,1 19,7<br />
21 Singapore 13,1 13,4 13,7<br />
22 Sri Lanka 44,6 45,9 47,2<br />
23 Syrian Arab Republic 19,3 20,4 21,6<br />
24 Taiwan, China 25,4 26,6 27,7<br />
25 Thail<strong>and</strong> 52,6 53,4 54,1<br />
26 Turkey 32,1 33,2 34,3<br />
27 United Arab Emirates 26,4 27,1 27,8<br />
28 Yemen, Rep. 27,4 28,4 29,1<br />
Unweighted Average 28,5 29,5 30,4<br />
In Table 3.2.3, <strong>the</strong> sizes <strong>of</strong> shadow for twenty-one Central <strong>and</strong> South American countries are shown.<br />
Averaging <strong>the</strong> figures in all twenty-one Central <strong>and</strong> South American countries, <strong>the</strong> shadow economy<br />
increased from 41.1% in <strong>the</strong> year 1999/2000 to 43.4% <strong>of</strong> <strong>of</strong>ficial GDP in 2002/2003; an increase <strong>of</strong><br />
2.3 percentage points over <strong>the</strong>se four years. If I now turn to <strong>the</strong> size <strong>of</strong> <strong>the</strong> shadow economy for single<br />
countries for 2002/2003, Bolivia has <strong>the</strong> largest shadow economy with 68.3%, followed by Panama<br />
24


