

Shadow Economies and Corruption All Over the World - Index of - IZA
Shadow Economies and Corruption All Over the World - Index of - IZA
Shadow Economies and Corruption All Over the World - Index of - IZA

Create successful ePaper yourself
Turn your PDF publications into a flip-book with our unique Google optimized e-Paper software.
3.2.4 South West Pacific Isl<strong>and</strong>s<br />
The size <strong>and</strong> development <strong>of</strong> <strong>the</strong> shadow economies <strong>of</strong> 10 South West Pacific isl<strong>and</strong>s is<br />
presented in table 3.2.6.<br />
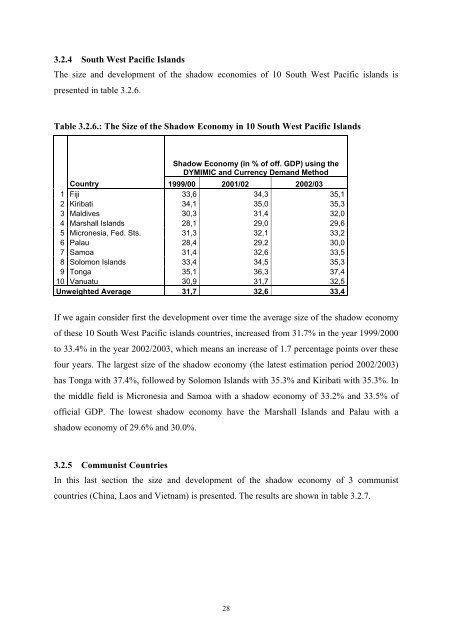
Table 3.2.6.: The Size <strong>of</strong> <strong>the</strong> <strong>Shadow</strong> Economy in 10 South West Pacific Isl<strong>and</strong>s<br />
<strong>Shadow</strong> Economy (in % <strong>of</strong> <strong>of</strong>f. GDP) using <strong>the</strong><br />
DYMIMIC <strong>and</strong> Currency Dem<strong>and</strong> Method<br />
Country 1999/00 2001/02 2002/03<br />
1 Fiji 33,6 34,3 35,1<br />
2 Kiribati 34,1 35,0 35,3<br />
3 Maldives 30,3 31,4 32,0<br />
4 Marshall Isl<strong>and</strong>s 28,1 29,0 29,6<br />
5 Micronesia, Fed. Sts. 31,3 32,1 33,2<br />
6 Palau 28,4 29,2 30,0<br />
7 Samoa 31,4 32,6 33,5<br />
8 Solomon Isl<strong>and</strong>s 33,4 34,5 35,3<br />
9 Tonga 35,1 36,3 37,4<br />
10 Vanuatu 30,9 31,7 32,5<br />
Unweighted Average 31,7 32,6 33,4<br />
If we again consider first <strong>the</strong> development over time <strong>the</strong> average size <strong>of</strong> <strong>the</strong> shadow economy<br />
<strong>of</strong> <strong>the</strong>se 10 South West Pacific isl<strong>and</strong>s countries, increased from 31.7% in <strong>the</strong> year 1999/2000<br />
to 33.4% in <strong>the</strong> year 2002/2003, which means an increase <strong>of</strong> 1.7 percentage points over <strong>the</strong>se<br />
four years. The largest size <strong>of</strong> <strong>the</strong> shadow economy (<strong>the</strong> latest estimation period 2002/2003)<br />
has Tonga with 37.4%, followed by Solomon Isl<strong>and</strong>s with 35.3% <strong>and</strong> Kiribati with 35.3%. In<br />
<strong>the</strong> middle field is Micronesia <strong>and</strong> Samoa with a shadow economy <strong>of</strong> 33.2% <strong>and</strong> 33.5% <strong>of</strong><br />
<strong>of</strong>ficial GDP. The lowest shadow economy have <strong>the</strong> Marshall Isl<strong>and</strong>s <strong>and</strong> Palau with a<br />
shadow economy <strong>of</strong> 29.6% <strong>and</strong> 30.0%.<br />
3.2.5 Communist Countries<br />
In this last section <strong>the</strong> size <strong>and</strong> development <strong>of</strong> <strong>the</strong> shadow economy <strong>of</strong> 3 communist<br />
countries (China, Laos <strong>and</strong> Vietnam) is presented. The results are shown in table 3.2.7.<br />
28


