Description Page - Doosan Power Systems
Description Page - Doosan Power Systems
Description Page - Doosan Power Systems

Create successful ePaper yourself
Turn your PDF publications into a flip-book with our unique Google optimized e-Paper software.
DOOSAN BABCOCK ENERGY<br />
Annual Report and Financial Statements 2007<br />
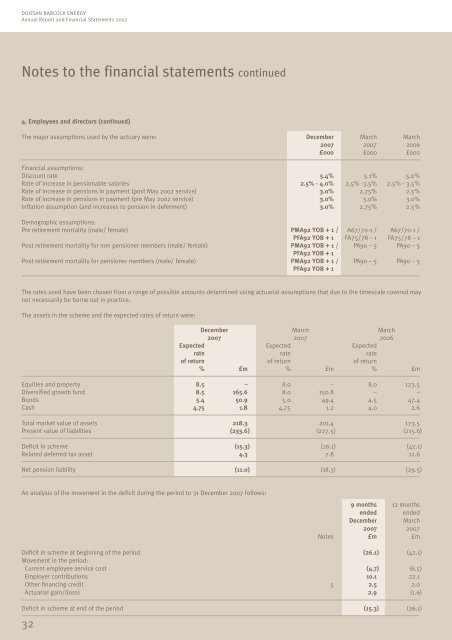
Notes to the financial statements continued<br />
4. Employees and directors (continued)<br />
The major assumptions used by the actuary were: December March March<br />
2007 2007 2006<br />
£000 £000 £000<br />
Financial assumptions:<br />
Discount rate 5.4% 5.1% 5.0%<br />
Rate of increase in pensionable salaries 2.5% - 4.0% 2.5% -3.5% 2.5% - 3.5%<br />
Rate of increase in pensions in payment (post May 2002 service) 3.0% 2.75% 2.5%<br />
Rate of increase in pensions in payment (pre May 2002 service) 3.0% 3.0% 3.0%<br />
Inflation assumption (and increases to pension in deferment) 3.0% 2.75% 2.5%<br />
Demographic assumptions:<br />
Pre retirement mortality (male/ female) PMA92 YOB + 1 / A67/70-1 / A67/70-1 /<br />
PFA92 YOB + 1 FA75/78 – 1 FA75/78 – 1<br />
Post retirement mortality for non pensioner members (male/ female) PMA92 YOB + 1 / PA90 – 5 PA90 – 5<br />
PFA92 YOB + 1<br />
Post retirement mortality for pensioner members (male/ female) PMA92 YOB + 1 / PA90 – 5 PA90 – 5<br />
PFA92 YOB + 1<br />
The rates used have been chosen from a range of possible amounts determined using actuarial assumptions that due to the timescale covered may<br />
not necessarily be borne out in practice.<br />
The assets in the scheme and the expected rates of return were:<br />
32<br />
December March March<br />
2007 2007 2006<br />
Expected Expected Expected<br />
rate rate rate<br />
of return of return of return<br />
% £m % £m % £m<br />
Equities and property 8.5 – 8.0 – 8.0 123.5<br />
Diversified growth fund 8.5 165.6 8.0 150.8 – –<br />
Bonds 5.4 50.9 5.0 49.4 4.5 47.4<br />
Cash 4.75 1.8 4.75 1.2 4.0 2.6<br />
Total market value of assets 218.3 201.4 173.5<br />
Present value of liabilities (233.6) (227.5) (215.6)<br />
Deficit in scheme (15.3) (26.1) (42.1)<br />
Related deferred tax asset 4.3 7.8 12.6<br />
Net pension liability (11.0) (18.3) (29.5)<br />
An analysis of the movement in the deficit during the period to 31 December 2007 follows:<br />
9 months 12 months<br />
ended ended<br />
December March<br />
2007 2007<br />
Notes £m £m<br />
Deficit in scheme at beginning of the period (26.1) (42.1)<br />
Movement in the period:<br />
Current employee service cost (4.7) (6.5)<br />
Employer contributions 10.1 22.1<br />
Other financing credit 5 2.5 2.0<br />
Actuarial gain/(loss) 2.9 (1.6)<br />
Deficit in scheme at end of the period (15.3) (26.1)