Staffing Data - City of Wyoming
Staffing Data - City of Wyoming
Staffing Data - City of Wyoming

You also want an ePaper? Increase the reach of your titles
YUMPU automatically turns print PDFs into web optimized ePapers that Google loves.
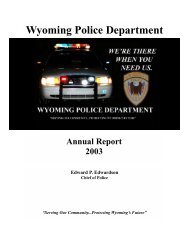
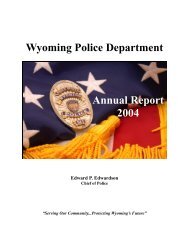
<strong>Wyoming</strong> Police Department Annual Report WYPD 2002<br />
Property Crime Defined<br />
Property Crime Offense <strong>Data</strong><br />
UCR Property Crime Index<br />
10 Year Trend 1993-2002<br />
Violent Crime Property Crime includes<br />
the <strong>of</strong>fenses <strong>of</strong> burglary, larceny-theft,<br />
motor vehicle theft, arson. The object <strong>of</strong><br />
the theft-type <strong>of</strong>fenses is the taking <strong>of</strong><br />
money and property, but there is no<br />
force or threat <strong>of</strong> force against the victims.<br />
Arson is included since it involves<br />
the destruction <strong>of</strong> property; its victims<br />
maybe subjected to force.<br />
• During 2002, 2,592 property crimes<br />
were reported to the <strong>Wyoming</strong> Police<br />
Department.<br />
• Based upon a population <strong>of</strong> 70,000,<br />
the adjusted property crime rate for<br />
the <strong>City</strong> <strong>of</strong> <strong>Wyoming</strong> was 3,702.8<br />
per 100,000.<br />
• The 2001 national average rate for<br />
property crime <strong>of</strong>fenses for cities<br />
outside metropolitan areas was<br />
4057.6 per 100,000 inhabitants.<br />
Geographically, the Midwest property<br />
crime rate was 3,559 per<br />
100,000; while the U.S. rate was<br />
3,656 per 100,000 inhabitants.<br />
• The 2002 WYPD property crime rate<br />
was 7 percent higher than 2001.<br />
• The 2002 WYPD property crime<br />
rate is 30 percent lower than the<br />
1995 rate<br />
33<br />
3,900<br />
3,400<br />
2,900<br />
2,400<br />
3900<br />
3400<br />
2900<br />
2400<br />
Property Crime Reported<br />
Offense Distribution<br />
Burglary<br />
28%<br />
Motor<br />
Vehicle<br />
Theft<br />
9%<br />
3,241<br />
Arson<br />
1%<br />
Property Crime Totals<br />
1993 - 2002<br />
3,530 3,703 3,582<br />
1993<br />
1994<br />
1995<br />
1996<br />
2,471<br />
3,116<br />
1997<br />
1998<br />
2,615<br />
2,465<br />
Property Crime Totals<br />
Ten Year Trend<br />
Larceny<br />
62%<br />
2,406<br />
1999<br />
2000<br />
2001<br />
2,592<br />
2002<br />
1993<br />
1994<br />
1995<br />
1996<br />
1997<br />
1998<br />
1999<br />
2000<br />
2001<br />
2002