OFFSHORE WIND Economies of scale, engineering ... - CiteSeerX
OFFSHORE WIND Economies of scale, engineering ... - CiteSeerX
OFFSHORE WIND Economies of scale, engineering ... - CiteSeerX

You also want an ePaper? Increase the reach of your titles
YUMPU automatically turns print PDFs into web optimized ePapers that Google loves.
Garrad Hassan and Partners Ltd Document: 3914/BR/01 Issue: C FINAL<br />
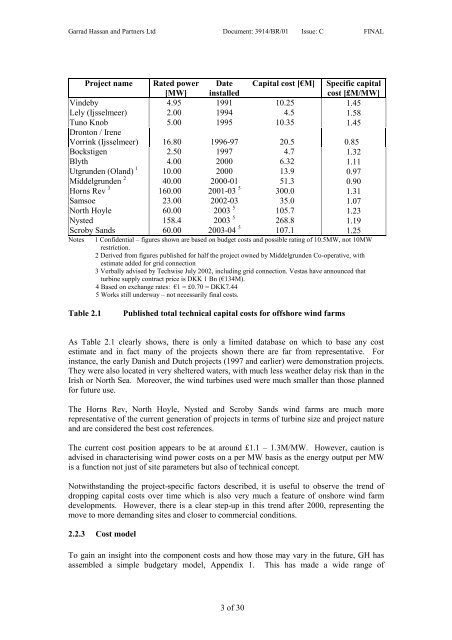
Project name Rated power Date Capital cost [€M] Specific capital<br />
[MW] installed<br />
cost [£M/MW]<br />
Vindeby 4.95 1991 10.25 1.45<br />
Lely (Ijsselmeer) 2.00 1994 4.5 1.58<br />
Tuno Knob<br />
Dronton / Irene<br />
5.00 1995 10.35 1.45<br />
Vorrink (Ijsselmeer) 16.80 1996-97 20.5 0.85<br />
Bockstigen 2.50 1997 4.7 1.32<br />
Blyth 4.00 2000 6.32 1.11<br />
Utgrunden (Oland) 1<br />
10.00 2000 13.9 0.97<br />
Middelgrunden 2<br />
40.00 2000-01 51.3 0.90<br />
Horns Rev 3<br />
160.00 2001-03 5<br />
300.0 1.31<br />
Samsoe 23.00 2002-03 35.0 1.07<br />
North Hoyle 60.00 2003 5<br />
105.7 1.23<br />
Nysted 158.4 2003 5<br />
268.8 1.19<br />
Scroby Sands 60.00 2003-04 5<br />
3 <strong>of</strong> 30<br />
107.1 1.25<br />
Notes 1 Confidential – figures shown are based on budget costs and possible rating <strong>of</strong> 10.5MW, not 10MW<br />
restriction.<br />
2 Derived from figures published for half the project owned by Middelgrunden Co-operative, with<br />
estimate added for grid connection<br />
3 Verbally advised by Techwise July 2002, including grid connection. Vestas have announced that<br />
turbine supply contract price is DKK 1 Bn (€134M).<br />
4 Based on exchange rates: €1 = £0.70 = DKK7.44<br />
5 Works still underway – not necessarily final costs.<br />
Table 2.1 Published total technical capital costs for <strong>of</strong>fshore wind farms<br />
As Table 2.1 clearly shows, there is only a limited database on which to base any cost<br />
estimate and in fact many <strong>of</strong> the projects shown there are far from representative. For<br />
instance, the early Danish and Dutch projects (1997 and earlier) were demonstration projects.<br />
They were also located in very sheltered waters, with much less weather delay risk than in the<br />
Irish or North Sea. Moreover, the wind turbines used were much smaller than those planned<br />
for future use.<br />
The Horns Rev, North Hoyle, Nysted and Scroby Sands wind farms are much more<br />
representative <strong>of</strong> the current generation <strong>of</strong> projects in terms <strong>of</strong> turbine size and project nature<br />
and are considered the best cost references.<br />
The current cost position appears to be at around £1.1 – 1.3M/MW. However, caution is<br />
advised in characterising wind power costs on a per MW basis as the energy output per MW<br />
is a function not just <strong>of</strong> site parameters but also <strong>of</strong> technical concept.<br />
Notwithstanding the project-specific factors described, it is useful to observe the trend <strong>of</strong><br />
dropping capital costs over time which is also very much a feature <strong>of</strong> onshore wind farm<br />
developments. However, there is a clear step-up in this trend after 2000, representing the<br />
move to more demanding sites and closer to commercial conditions.<br />
2.2.3 Cost model<br />
To gain an insight into the component costs and how those may vary in the future, GH has<br />
assembled a simple budgetary model, Appendix 1. This has made a wide range <strong>of</strong>