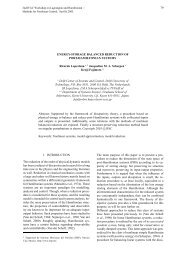
Gas-Liquid Mass Transfer Coefficient in Stirred Tank Reactors - ITM
Gas-Liquid Mass Transfer Coefficient in Stirred Tank Reactors - ITM
Gas-Liquid Mass Transfer Coefficient in Stirred Tank Reactors - ITM

You also want an ePaper? Increase the reach of your titles
YUMPU automatically turns print PDFs into web optimized ePapers that Google loves.
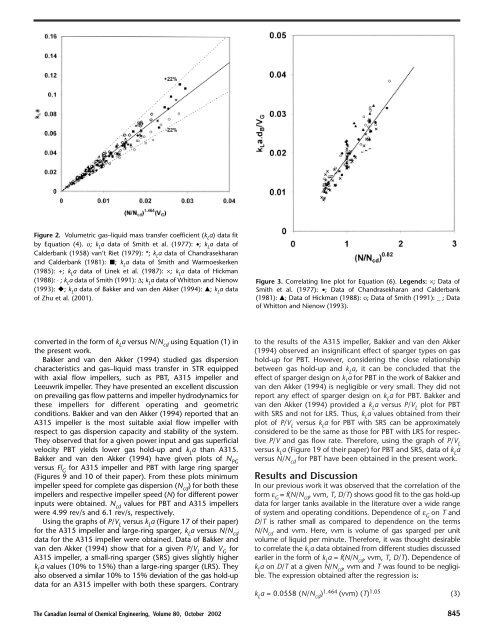
Figure 2. Volumetric gas–liquid mass transfer coefficient (k L a) data fit<br />
by Equation (4). o; k L a data of Smith et al. (1977): ∑; k L a data of<br />
Calderbank (1958) van’t Riet (1979): *; k L a data of Chandrasekharan<br />
and Calderbank (1981): �; k L a data of Smith and Warmoeskerken<br />
(1985): +; k L a data of L<strong>in</strong>ek et al. (1987): ¥; k L a data of Hickman<br />
(1988): ◊ ; k L a data of Smith (1991): D; k L a data of Whitton and Nienow<br />
(1993): �; k L a data of Bakker and van den Akker (1994): �; k L a data<br />
of Zhu et al. (2001).<br />
converted <strong>in</strong> the form of k L a versus N/N cd us<strong>in</strong>g Equation (1) <strong>in</strong><br />
the present work.<br />
Bakker and van den Akker (1994) studied gas dispersion<br />
characteristics and gas–liquid mass transfer <strong>in</strong> STR equipped<br />
with axial flow impellers, such as PBT, A315 impeller and<br />
Leeuwrik impeller. They have presented an excellent discussion<br />
on prevail<strong>in</strong>g gas flow patterns and impeller hydrodynamics for<br />
these impellers for different operat<strong>in</strong>g and geometric<br />
conditions. Bakker and van den Akker (1994) reported that an<br />
A315 impeller is the most suitable axial flow impeller with<br />
respect to gas dispersion capacity and stability of the system.<br />
They observed that for a given power <strong>in</strong>put and gas superficial<br />
velocity PBT yields lower gas hold-up and k L a than A315.<br />
Bakker and van den Akker (1994) have given plots of N PG<br />
versus Fl G for A315 impeller and PBT with large r<strong>in</strong>g sparger<br />
(Figures 9 and 10 of their paper). From these plots m<strong>in</strong>imum<br />
impeller speed for complete gas dispersion (N cd ) for both these<br />
impellers and respective impeller speed (N) for different power<br />
<strong>in</strong>puts were obta<strong>in</strong>ed. N cd values for PBT and A315 impellers<br />
were 4.99 rev/s and 6.1 rev/s, respectively.<br />
Us<strong>in</strong>g the graphs of P/V L versus k L a (Figure 17 of their paper)<br />
for the A315 impeller and large-r<strong>in</strong>g sparger, k L a versus N/N cd<br />
data for the A315 impeller were obta<strong>in</strong>ed. Data of Bakker and<br />
van den Akker (1994) show that for a given P/V L and V G for<br />
A315 impeller, a small-r<strong>in</strong>g sparger (SRS) gives slightly higher<br />
k L a values (10% to 15%) than a large-r<strong>in</strong>g sparger (LRS). They<br />
also observed a similar 10% to 15% deviation of the gas hold-up<br />
data for an A315 impeller with both these spargers. Contrary<br />
Figure 3. Correlat<strong>in</strong>g l<strong>in</strong>e plot for Equation (6). Legends: ¥; Data of<br />
Smith et al. (1977): ∑; Data of Chandrasekharan and Calderbank<br />
(1981): �; Data of Hickman (1988): o; Data of Smith (1991): _ ; Data<br />
of Whitton and Nienow (1993).<br />
to the results of the A315 impeller, Bakker and van den Akker<br />
(1994) observed an <strong>in</strong>significant effect of sparger types on gas<br />
hold-up for PBT. However, consider<strong>in</strong>g the close relationship<br />
between gas hold-up and k L a, it can be concluded that the<br />
effect of sparger design on k L a for PBT <strong>in</strong> the work of Bakker and<br />
van den Akker (1994) is negligible or very small. They did not<br />
report any effect of sparger design on k L a for PBT. Bakker and<br />
van den Akker (1994) provided a k L a versus P/V L plot for PBT<br />
with SRS and not for LRS. Thus, k L a values obta<strong>in</strong>ed from their<br />
plot of P/V L versus k L a for PBT with SRS can be approximately<br />
considered to be the same as those for PBT with LRS for respective<br />
P/V and gas flow rate. Therefore, us<strong>in</strong>g the graph of P/V L<br />
versus k L a (Figure 19 of their paper) for PBT and SRS, data of k L a<br />
versus N/N cd for PBT have been obta<strong>in</strong>ed <strong>in</strong> the present work.<br />
Results and Discussion<br />
In our previous work it was observed that the correlation of the<br />
form e G = f(N/N cd , vvm, T, D/T) shows good fit to the gas hold-up<br />
data for larger tanks available <strong>in</strong> the literature over a wide range<br />
of system and operat<strong>in</strong>g conditions. Dependence of e G on T and<br />
D/T is rather small as compared to dependence on the terms<br />
N/N cd and vvm. Here, vvm is volume of gas sparged per unit<br />
volume of liquid per m<strong>in</strong>ute. Therefore, it was thought desirable<br />
to correlate the k L a data obta<strong>in</strong>ed from different studies discussed<br />
earlier <strong>in</strong> the form of k L a = f(N/N cd , vvm, T, D/T). Dependence of<br />
k L a on D/T at a given N/N cd , vvm and T was found to be negligible.<br />
The expression obta<strong>in</strong>ed after the regression is:<br />
k L a = 0.0558 (N/N cd ) 1.464 (vvm) (T) 1.05 (3)<br />
The Canadian Journal of Chemical Eng<strong>in</strong>eer<strong>in</strong>g, Volume 80, October 2002 845