power people - TransGrid
power people - TransGrid
power people - TransGrid

Create successful ePaper yourself
Turn your PDF publications into a flip-book with our unique Google optimized e-Paper software.
noteS to the fInancIal StatementS<br />
For The year ended 30Th June 2009<br />
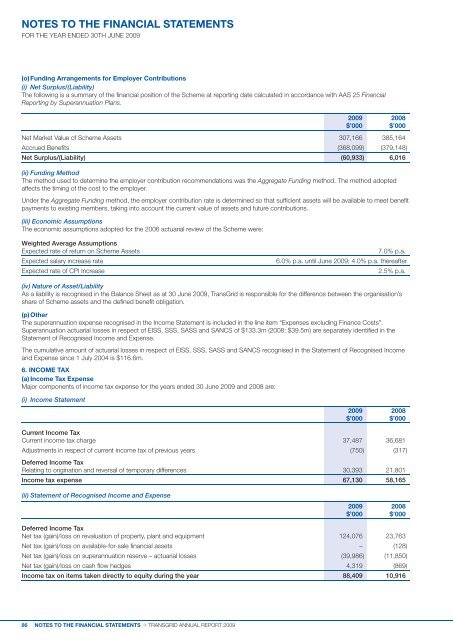
(o) funding arrangements for employer contributions<br />
(i) Net Surplus/(Liability)<br />
The following is a summary of the financial position of the scheme at reporting date calculated in accordance with aas 25 Financial<br />
Reporting by Superannuation Plans.<br />
2009 2008<br />
$’000 $’000<br />
net Market Value of scheme assets 307,166 385,164<br />
accrued Benefits (368,099) (379,148)<br />
Net Surplus/(Liability) (60,933) 6,016<br />
(ii) Funding Method<br />
The method used to determine the employer contribution recommendations was the Aggregate Funding method. The method adopted<br />
affects the timing of the cost to the employer.<br />
under the Aggregate Funding method, the employer contribution rate is determined so that sufficient assets will be available to meet benefit<br />
payments to existing members, taking into account the current value of assets and future contributions.<br />
(iii) Economic Assumptions<br />
The economic assumptions adopted for the 2006 actuarial review of the scheme were:<br />
Weighted Average Assumptions<br />
expected rate of return on scheme assets 7.0% p.a.<br />
expected salary increase rate 6.0% p.a. until June 2009; 4.0% p.a. thereafter<br />
expected rate of Cpi increase 2.5% p.a.<br />
(iv) Nature of Asset/Liability<br />
as a liability is recognised in the Balance sheet as at 30 June 2009, <strong>TransGrid</strong> is responsible for the difference between the organisation’s<br />
share of scheme assets and the defined benefit obligation.<br />
(p) other<br />
The superannuation expense recognised in the income statement is included in the line item “expenses excluding Finance Costs”.<br />
superannuation actuarial losses in respect of eiss, sss, sass and sanCs of $133.3m (2008: $39.5m) are separately identified in the<br />
statement of recognised income and expense.<br />
The cumulative amount of actuarial losses in respect of eiss, sss, sass and sanCs recognised in the statement of recognised income<br />
and expense since 1 July 2004 is $116.6m.<br />
6. Income tax<br />
(a) Income tax expense<br />
Major components of income tax expense for the years ended 30 June 2009 and 2008 are:<br />
(i) Income Statement<br />
86 noteS to the fInancIal StatementS > <strong>TransGrid</strong> annual reporT 2009<br />
2009 2008<br />
$’000 $’000<br />
Current Income Tax<br />
Current income tax charge 37,487 36,681<br />
adjustments in respect of current income tax of previous years (750) (317)<br />
Deferred Income Tax<br />
relating to origination and reversal of temporary differences 30,393 21,801<br />
Income tax expense 67,130 58,165<br />
(ii) Statement of Recognised Income and Expense<br />
2009 2008<br />
$’000 $’000<br />
Deferred Income Tax<br />
net tax (gain)/loss on revaluation of property, plant and equipment 124,076 23,763<br />
net tax (gain)/loss on available-for-sale financial assets – (128)<br />
net tax (gain)/loss on superannuation reserve – actuarial losses (39,986) (11,850)<br />
net tax (gain)/loss on cash flow hedges 4,319 (869)<br />
Income tax on items taken directly to equity during the year 88,409 10,916