Image Analysis with CASA - ESO
Image Analysis with CASA - ESO
Image Analysis with CASA - ESO
- TAGS
- image
- analysis
- casa
- www.eso.org

You also want an ePaper? Increase the reach of your titles
YUMPU automatically turns print PDFs into web optimized ePapers that Google loves.
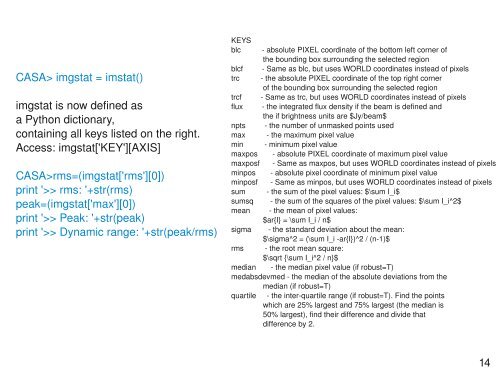
<strong>CASA</strong>> imgstat = imstat()<br />
imgstat is now defined as<br />
a Python dictionary,<br />
containing all keys listed on the right.<br />
Access: imgstat['KEY'][AXIS]<br />
<strong>CASA</strong>>rms=(imgstat['rms'][0])<br />
print '>> rms: '+str(rms)<br />
peak=(imgstat['max'][0])<br />
print '>> Peak: '+str(peak)<br />
print '>> Dynamic range: '+str(peak/rms)<br />
KEYS<br />
blc absolute PIXEL coordinate of the bottom left corner of<br />
the bounding box surrounding the selected region<br />
blcf Same as blc, but uses WORLD coordinates instead of pixels<br />
trc the absolute PIXEL coordinate of the top right corner<br />
of the bounding box surrounding the selected region<br />
trcf Same as trc, but uses WORLD coordinates instead of pixels<br />
flux the integrated flux density if the beam is defined and<br />
the if brightness units are $Jy/beam$<br />
npts the number of unmasked points used<br />
max the maximum pixel value<br />
min minimum pixel value<br />
maxpos absolute PIXEL coordinate of maximum pixel value<br />
maxposf Same as maxpos, but uses WORLD coordinates instead of pixels<br />
minpos absolute pixel coordinate of minimum pixel value<br />
minposf Same as minpos, but uses WORLD coordinates instead of pixels<br />
sum the sum of the pixel values: $\sum I_i$<br />
sumsq the sum of the squares of the pixel values: $\sum I_i^2$<br />
mean the mean of pixel values:<br />
$ar{I} = \sum I_i / n$<br />
sigma the standard deviation about the mean:<br />
$\sigma^2 = (\sum I_i ar{I})^2 / (n1)$<br />
rms the root mean square:<br />
$\sqrt {\sum I_i^2 / n}$<br />
median the median pixel value (if robust=T)<br />
medabsdevmed the median of the absolute deviations from the<br />
median (if robust=T)<br />
quartile the interquartile range (if robust=T). Find the points<br />
which are 25% largest and 75% largest (the median is<br />
50% largest), find their difference and divide that<br />
difference by 2.<br />
14