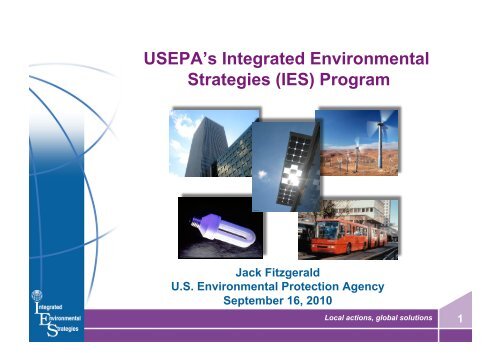
USEPA's Integrated Environmental Strategies (IES) Program
USEPA's Integrated Environmental Strategies (IES) Program
USEPA's Integrated Environmental Strategies (IES) Program
Create successful ePaper yourself
Turn your PDF publications into a flip-book with our unique Google optimized e-Paper software.
USEPA’s <strong>Integrated</strong> <strong>Environmental</strong><br />
<strong>Strategies</strong> (<strong>IES</strong>) <strong>Program</strong><br />
Jack Fitzgerald<br />
U.S. <strong>Environmental</strong> Protection Agency<br />
September 16, 2010<br />
Local actions, global solutions 1
History of <strong>IES</strong><br />
• Initiated in 1998 as a capacity-enhancing program for<br />
developing countries<br />
• Identifies and analyzes integrated environmental strategies<br />
and co-benefits (i.e., greenhouse-gas and air-pollution<br />
mitigation)<br />
• Partners local teams in developing countries with experts<br />
and tools from EPA, <strong>IES</strong> projects in other countries, and<br />
other organizations (e.g., US AID)<br />
Local actions, global solutions 2
An Explanation of <strong>Integrated</strong> Measures<br />
• <strong>Integrated</strong> measures that reduce GHG emissions and improve local air quality<br />
• Low-sulfur coal<br />
• Smokestack controls<br />
• Catalytic converters<br />
• Diesel particle traps<br />
• Evaporative controls<br />
Local<br />
Adapted from Jason West et al (2002)<br />
<strong>Integrated</strong><br />
• Clean fuels/renewables<br />
• Energy efficiency programs<br />
• Methane gas recovery<br />
• Fuel switching<br />
• Public transport and land<br />
use<br />
• Retirement of older vehicles<br />
• Efficiency standards for new<br />
vehicles/appliances<br />
• Modal switch<br />
<strong>Integrated</strong><br />
Global<br />
• Geological and<br />
terrestrial sequestration<br />
• Land use and land use<br />
change<br />
• Control of other GHGs<br />
(N 2O, HFCs, PFCs, SF 6)<br />
Local actions, global solutions 3
Goals of <strong>IES</strong><br />
• Identify strategies that reduce GHG emissions and improve<br />
local air quality while meeting public health and economic<br />
development objectives.<br />
• Provide stakeholders with quantitative estimates of global<br />
and local co-benefits of policies and technologies.<br />
• Engage stakeholders to lay groundwork for implementation<br />
of cost-effective air quality management strategies.<br />
• Build analytical, institutional, and human capacity for<br />
multidisciplinary analysis of GHG mitigation, health, and<br />
environmental impacts of alternative strategies.<br />
Local actions, global solutions 4
• Argentina<br />
• Brazil<br />
• Chile<br />
• China<br />
• Colombia<br />
• India<br />
• Mexico<br />
• Philippines<br />
• Republic of Korea<br />
<strong>IES</strong> Partner Countries<br />
Local actions, global solutions 5
Summary of <strong>IES</strong> Project Steps<br />
1. Scope project and build team<br />
2. Develop emissions scenarios<br />
3. Calculate atmospheric concentrations<br />
4. Quantify public health effects<br />
5. Perform economic valuation of health benefits<br />
6. Rank measures and share results<br />
7. Implement measures<br />
Local actions, global solutions 6
Scope Project and Build a Team<br />
• Acquire commitment from government host<br />
organization<br />
• Identify technical team, project coordinator,<br />
technical leaders, and <strong>IES</strong> partners<br />
• Organize formal scoping meeting<br />
• Develop project work plan outlining the<br />
coordination of all project activities<br />
Local actions, global solutions 7
Develop Emissions Scenarios<br />
• Compile base-year emissions inventory<br />
• Develop baseline and mitigation emissions<br />
scenarios<br />
• Select emissions model<br />
• Perform fuel consumption and emissions sector<br />
surveys<br />
• Collect fuel-use data<br />
• Develop emissions factors<br />
• Run model to project future emissions for each<br />
scenario<br />
• Summarize results for air quality analysis<br />
Local actions, global solutions 8
Calculate Atmospheric Concentrations<br />
• Assess existing ambient air quality<br />
• Identify target emissions<br />
• Select air quality model<br />
• Collect local, historical ambient air quality<br />
monitoring data<br />
• Collect local, historical meteorological data<br />
• Run model to project future ambient<br />
concentrations for each scenario<br />
• Summarize results for health effects analysis<br />
Local actions, global solutions 9
Quantify Public Health Effects<br />
• Determine health endpoints and analytical<br />
methodologies<br />
• Develop/identify appropriate health risk functions.<br />
• Collect local public health data<br />
• Perform local epidemiological studies or adapt<br />
results<br />
• Estimate avoided health effects for each scenario.<br />
• Perform uncertainty analysis<br />
• Summarize results for economic valuation<br />
analysis<br />
Local actions, global solutions 10
Performing Economic Valuation of<br />
Health Benefits<br />
• Collect economic valuation data<br />
• Determine appropriate valuation methods<br />
• Apply selected valuation approaches<br />
• Perform benefits transfer, if necessary<br />
• Perform comprehensive valuation analysis<br />
• Summarize results through a range of valuation<br />
scenarios<br />
Local actions, global solutions 11
China Project Example<br />
• Preliminary national assessment of urban<br />
air pollution, greenhouse gas emissions,<br />
economic, and health impacts of clean<br />
energy and transportation strategies and<br />
policies for China<br />
• Three scenarios examined:<br />
– Base Case: Business as usual<br />
– Scenario 1: Climate change policies (CCP)<br />
– Scenario 2: CCP + pollution control policies (PCP)<br />
• Models and Tools Used:<br />
– Long-range Energy Alternative Planning (LEAP) model<br />
– TRACE-P emissions inventory (to project impact on emissions from<br />
LEAP energy utilization results)<br />
– Models-3/Community Multiscale Air Quality (CMAQ)<br />
– EPA’s <strong>Environmental</strong> Benefits Mapping and Analysis <strong>Program</strong><br />
(BenMAP)<br />
Local actions, global solutions 12
China National Assessment Scenarios<br />
Policies Key Assumptions<br />
Business as Usual (BAU) -Electricity and gas fuel are the dominant energy sources in urban<br />
households<br />
Climate Change Policies<br />
(CCP)<br />
Pollution Control Policies<br />
(PCP)<br />
-Energy Conservation Law and related laws are implemented<br />
-For mobile sources, Euro III standards are implemented in 2008, Euro IV in<br />
2012, and more strict standards in 2018 and 2025<br />
-”Two controlled zones” policies are successfully implemented<br />
-Energy intensity in the industrial sector decreases more rapidly<br />
-Energy conservation standards for buildings improve significantly, and<br />
dispersed heating supplies are replaced by more centralized ones<br />
-More energy-saving appliances are used in the residential sector<br />
-Automobile fuel economy increases more rapidly<br />
-Efficiency of electricity plants and heat boilers increases<br />
-Replacement of small power plants with larger ones is accelerated, and<br />
FGD and NOX control technologies begin to be widely used after 2012<br />
-Efficiency of SO2 and NOX control in the industrial sector is significantly<br />
improved<br />
PM control is more focused, and more electrostatic precipitators and<br />
baghouse filters are installed<br />
-For mobile sources, EURO III standards are implemented in 2008, EURO<br />
IV in 2010, and more strict standards in 2015 and 2020<br />
Local actions, global solutions 13
China National Assessment Results<br />
Projected Levels of GHG and Local Pollutant Emissions in 2030<br />
GHG/<br />
Pollutant<br />
BAU Scenario1 %<br />
Reduction<br />
from BAU<br />
Scenario 2 %<br />
Reduction<br />
from BAU<br />
CO2 1,889 1,560 17.4% 1,523 19.4%<br />
SO2 28,085 23,382 16.7% 16,067 42.8%<br />
NOX 17,470 15,094 13.6% 12,596 27.9%<br />
BC 691 514 25.6% 424 38.6%<br />
OC 1,582 1,301 17.7% 1,166 26.3%<br />
NMVOC 16,945 15,198 10.3% 12,512 26.2%<br />
Local actions, global solutions 14
India Project Example<br />
• In 2003, the Supreme Court of India<br />
directed several states to produce<br />
action plans to combat rapidly<br />
increasing air pollution and related<br />
widespread respiratory disease<br />
• The Andhra Pradesh Pollution Control<br />
Board (APPCB) embarked on a source apportionment study in<br />
Hyderabad to identify the sources of PM included in previous<br />
<strong>IES</strong> projects and additional sources not included in the original<br />
<strong>IES</strong> inventory<br />
• 4 Objectives:<br />
– Improve and validate the 2001 Hyderabad emissions inventory by<br />
determining major sources of PM<br />
– Build capacity in sampling and analysis<br />
– Strengthen environmental management at the local level<br />
– Provide data to support the reduction of both PM and GHG<br />
emissions through integrated strategies<br />
Local actions, global solutions 15
Source Apportionment Results Overview<br />
Source %PM10 %PM2.5<br />
Vehicles 48 49<br />
Road Dust 33 5<br />
Secondary<br />
Pollutants<br />
8 5<br />
Industry 6 5<br />
Biomass Burning 5 5<br />
• Based on the findings of the <strong>IES</strong> co-benefits analysis, APPCB<br />
recommended several intervention strategies as particularly<br />
effective in achieving co-control of PM and CO2 in Hyderabad<br />
Local actions, global solutions 16
Potential Emissions Reductions Through<br />
Co-Benefits<br />
Estimated Reductions in PM10 and CO2 Through Co-Benefits Measures Compared to Business as<br />
Usual Projections for 2010<br />
Form of Intervention Tons of<br />
PM10<br />
Reduction in<br />
PM10<br />
Tons of<br />
CO2<br />
Reduction in<br />
CO2<br />
Convert all petrol-based 3-wheelers to LPG 847 2.5% 105,847 1.1%<br />
Promote public transportation, with expected reductions in<br />
km traveled<br />
Replace 50% of the current diesel public transport bus fleet<br />
with newer diesel buses<br />
Inspect and maintain in-use vehicles to improve<br />
deterioration rates by 5%<br />
Double the stringency of emission standards for in-use<br />
diesel goods vehicles (light and heavy duty)<br />
Promote wet sweeping to reduce silt loading on paved<br />
roads by 20% and increase moisture content on unpaved<br />
roads by 5%<br />
1,554 4.5% 642,599 6.9%<br />
211 0.6% 55,851 0.6%<br />
202 0.6% 154,670 1.6%<br />
1,317 3.8% 834,393 8.9%<br />
630 1.8%<br />
Improve dust collection efficiency at industrial sites by 25% 2,105 6.1%<br />
Local actions, global solutions 17
Ranking Measures and Sharing Results<br />
• Quantify cumulative costs and benefits for each<br />
recommendation<br />
• Develop benefit-cost ratios for each<br />
recommendation<br />
• Prioritize recommended measures based on<br />
benefit-cost ratios or other criteria<br />
• Share project results<br />
• Identify additional steps to advance<br />
implementation<br />
Local actions, global solutions 18
Implementing Measures<br />
• Incorporate results into policymaking processes<br />
• Build support for implementation<br />
• Institutionalize <strong>IES</strong> process and results.<br />
• Develop funding proposals<br />
Local actions, global solutions 19
Thank You!<br />
Jack Fitzgerald<br />
<strong>Integrated</strong> <strong>Environmental</strong> <strong>Strategies</strong> <strong>Program</strong><br />
U.S. <strong>Environmental</strong> Protection Agency<br />
Washington, D.C.<br />
Local actions, global solutions 20


