REAL ESTATE REPORT - REDI-net.com
REAL ESTATE REPORT - REDI-net.com
REAL ESTATE REPORT - REDI-net.com
- TAGS
- real
- estate
- redi-net.com

Create successful ePaper yourself
Turn your PDF publications into a flip-book with our unique Google optimized e-Paper software.
WINTER 2011 | VOL 39 | NO 4<br />
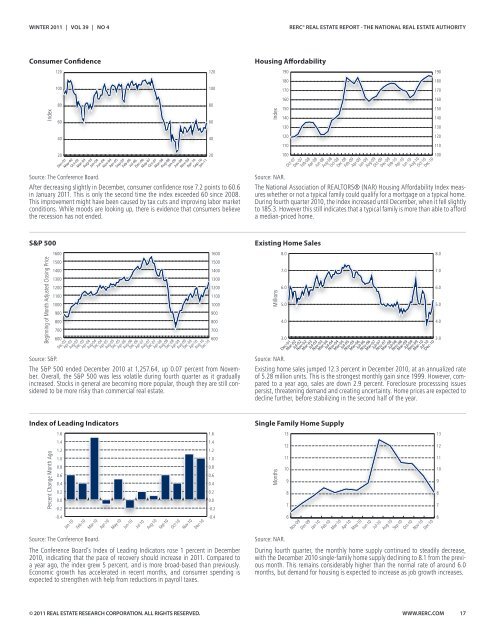
Consumer Confidence<br />
Index<br />
After decreasing slightly in December, consumer confidence rose 7.2 points to 60.6<br />
in January 2011. This is only the second time the index exceeded 60 since 2008.<br />
This improvement might have been caused by tax cuts and improving labor market<br />
conditions. While moods are looking up, there is evidence that consumers believe<br />
the recession has not ended.<br />
S&P 500<br />
120<br />
100<br />
80<br />
60<br />
40<br />
20<br />
Dec-01<br />
May-02<br />
Oct-02<br />
Mar-03<br />
Aug-03<br />
Source: The Conference Board.<br />
Beginning of Month Adjusted Closing Price<br />
1600<br />
1500<br />
1400<br />
1300<br />
1200<br />
1100<br />
1000<br />
900<br />
800<br />
700<br />
600<br />
Source: S&P.<br />
Dec-02<br />
Apr-03<br />
Aug-03<br />
Dec-03<br />
Apr-04<br />
Index of Leading Indicators<br />
Jan-04<br />
Jun-04<br />
Nov-04<br />
Apr-05<br />
Sep-05<br />
Feb-06<br />
Jul-06<br />
Dec-06<br />
May-07<br />
Oct-07<br />
Mar-08<br />
Aug-08<br />
Jan-09<br />
Jun-09<br />
Nov-09<br />
Apr-10<br />
Sep-10<br />
Jan-11<br />
Aug-04<br />
Dec-04<br />
Apr-05<br />
Aug-05<br />
Dec-05<br />
Apr-06<br />
Aug-06<br />
Dec-06<br />
Apr-07<br />
Aug-07<br />
Dec-07<br />
Apr-08<br />
Aug-08<br />
Dec-08<br />
Apr-09<br />
Aug-09<br />
Dec-09<br />
Apr-10<br />
Aug-10<br />
Dec-10<br />
The S&P 500 ended December 2010 at 1,257.64, up 0.07 percent from November.<br />
Overall, the S&P 500 was less volatile during fourth quarter as it gradually<br />
increased. Stocks in general are be<strong>com</strong>ing more popular, though they are still considered<br />
to be more risky than <strong>com</strong>mercial real estate.<br />
Percent Change Month Ago<br />
1.6<br />
1.4<br />
1.2<br />
1.0<br />
0.8<br />
0.6<br />
0.4<br />
0.2<br />
0.0<br />
-0.2<br />
-0.4<br />
Source: The Conference Board.<br />
Jan-10<br />
Feb-10<br />
Mar-10<br />
Apr-10<br />
May-10<br />
Jun-10<br />
Jul-10<br />
Aug-10<br />
Sep-10<br />
Oct-10<br />
Nov-10<br />
Dec-10<br />
The Conference Board’s Index of Leading Indicators rose 1 percent in December<br />
2010, indicating that the pace of recovery should increase in 2011. Compared to<br />
a year ago, the index grew 5 percent, and is more broad-based than previously.<br />
Economic growth has accelerated in recent months, and consumer spending is<br />
expected to strengthen with help from reductions in payroll taxes.<br />
© 2011 <strong>REAL</strong> <strong>ESTATE</strong> RESEARCH CORPORATION. ALL RIGHTS RESERVED.<br />
120<br />
100<br />
80<br />
60<br />
40<br />
20<br />
1600<br />
1500<br />
1400<br />
1300<br />
1200<br />
1100<br />
1000<br />
900<br />
800<br />
700<br />
600<br />
1.6<br />
1.4<br />
1.2<br />
1.0<br />
0.8<br />
0.6<br />
0.4<br />
0.2<br />
0.0<br />
-0.2<br />
-0.4<br />
Existing Home Sales<br />
RERC © <strong>REAL</strong> <strong>ESTATE</strong> <strong>REPORT</strong> - THE NATIONAL <strong>REAL</strong> <strong>ESTATE</strong> AUTHORITY<br />
Housing Affordability<br />
Index<br />
Source: NAR.<br />
190<br />
180<br />
170<br />
160<br />
150<br />
140<br />
130<br />
120<br />
110<br />
100<br />
Oct-07<br />
Dec-07<br />
Feb-08<br />
Apr-08<br />
The National Association of <strong>REAL</strong>TORS® (NAR) Housing Affordability Index measures<br />
whether or not a typical family could qualify for a mortgage on a typical home.<br />
During fourth quarter 2010, the index increased until December, when it fell slightly<br />
to 185.3. However this still indicates that a typical family is more than able to afford<br />
a median-priced home.<br />
Millions<br />
8.0<br />
7.0<br />
6.0<br />
5.0<br />
4.0<br />
3.0<br />
Single Family Home Supply<br />
Jun-08<br />
Aug-08<br />
Oct-08<br />
Dec-08<br />
Feb-09<br />
Apr-09<br />
Jun-09<br />
Aug-09<br />
Oct-09<br />
Dec-09<br />
Feb-10<br />
Apr-10<br />
Jun-10<br />
Aug-10<br />
Oct-10<br />
Dec-10<br />
Dec-01<br />
Mar-02<br />
Jul-02<br />
Nov-02<br />
Mar-03<br />
Jul-03<br />
Nov-03<br />
Mar-04<br />
Jul-04<br />
Nov-04<br />
Mar-05<br />
Jul-05<br />
Nov-05<br />
Mar-06<br />
Jul-06<br />
Nov-06<br />
Mar-07<br />
Jul-07<br />
Nov-07<br />
Mar-08<br />
Jul-08<br />
Nov-08<br />
Mar-09<br />
Jul-09<br />
Nov-09<br />
Mar-10<br />
Jul-10<br />
Dec-10<br />
Source: NAR.<br />
Existing home sales jumped 12.3 percent in December 2010, at an annualized rate<br />
of 5.28 million units. This is the strongest monthly gain since 1999. However, <strong>com</strong>pared<br />
to a year ago, sales are down 2.9 percent. Foreclosure processsing issues<br />
persist, threatening demand and creating uncertainty. Home prices are expected to<br />
decline further, before stabilizing in the second half of the year.<br />
Months<br />
13<br />
12<br />
11<br />
10<br />
Source: NAR.<br />
9<br />
8<br />
7<br />
6<br />
Nov-09<br />
Dec-09<br />
Jan-10<br />
Feb-10<br />
Mar-10<br />
Apr-10<br />
May-10<br />
Jun-10<br />
Jul-10<br />
Aug-10<br />
Sep-10<br />
Oct-10<br />
Nov-10<br />
Dec-10<br />
During fourth quarter, the monthly home supply continued to steadily decrease,<br />
with the December 2010 single-family home supply declining to 8.1 from the previous<br />
month. This remains considerably higher than the normal rate of around 6.0<br />
months, but demand for housing is expected to increase as job growth increases.<br />
190<br />
180<br />
170<br />
160<br />
150<br />
140<br />
130<br />
120<br />
110<br />
100<br />
8.0<br />
7.0<br />
6.0<br />
5.0<br />
4.0<br />
3.0<br />
13<br />
12<br />
11<br />
10<br />
WWW.RERC.COM 17<br />
9<br />
8<br />
7<br />
6