REAL ESTATE REPORT - REDI-net.com
REAL ESTATE REPORT - REDI-net.com
REAL ESTATE REPORT - REDI-net.com
- TAGS
- real
- estate
- redi-net.com

Create successful ePaper yourself
Turn your PDF publications into a flip-book with our unique Google optimized e-Paper software.
RERC © <strong>REAL</strong> <strong>ESTATE</strong> <strong>REPORT</strong> - THE NATIONAL <strong>REAL</strong> <strong>ESTATE</strong> AUTHORITY<br />
INDUSTRIAL<br />
n Some of RERC’s institutional investment survey respondents<br />
stated that the industrial sector was a good investment<br />
opportunity during fourth quarter 2010 because of reasonable<br />
pricing and attractive risk-adjusted returns, as job growth and<br />
trade increased. However, respondents also noted that due<br />
to weak leasing fundamentals and poor locations, particularly<br />
for the industrial flex and industrial research and development<br />
(R&D) sectors, the industrial sector overall continued to struggle,<br />
despite continued manufacturing growth.<br />
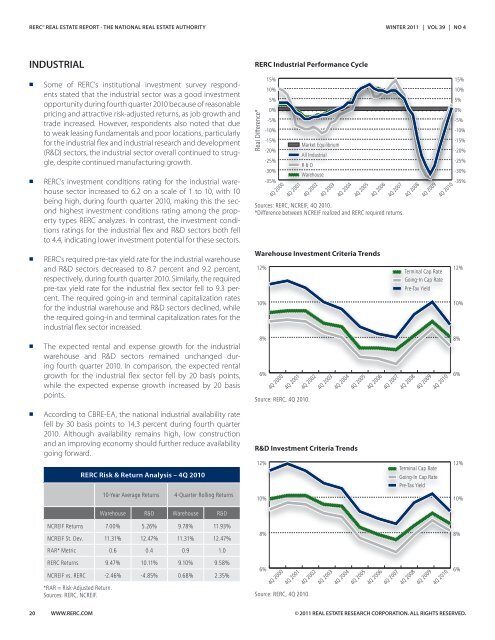
n RERC’s investment conditions rating for the industrial warehouse<br />
sector increased to 6.2 on a scale of 1 to 10, with 10<br />
being high, during fourth quarter 2010, making this the second<br />
highest investment conditions rating among the property<br />
types RERC analyzes. In contrast, the investment conditions<br />
ratings for the industrial flex and R&D sectors both fell<br />
to 4.4, indicating lower investment potential for these sectors.<br />
n RERC’s required pre-tax yield rate for the industrial warehouse<br />
and R&D sectors decreased to 8.7 percent and 9.2 percent,<br />
respectively, during fourth quarter 2010. Similarly, the required<br />
pre-tax yield rate for the industrial flex sector fell to 9.3 percent.<br />
The required going-in and terminal capitalization rates<br />
for the industrial warehouse and R&D sectors declined, while<br />
the required going-in and terminal capitalization rates for the<br />
industrial flex sector increased.<br />
n The expected rental and expense growth for the industrial<br />
warehouse and R&D sectors remained unchanged during<br />
fourth quarter 2010. In <strong>com</strong>parison, the expected rental<br />
growth for the industrial flex sector fell by 20 basis points,<br />
while the expected expense growth increased by 20 basis<br />
points.<br />
n According to CBRE-EA, the national industrial availability rate<br />
fell by 30 basis points to 14.3 percent during fourth quarter<br />
2010. Although availability remains high, low construction<br />
and an improving economy should further reduce availability<br />
going forward.<br />
20 WWW.RERC.COM<br />
RERC Risk & Return Analysis – 4Q 2010<br />
10-Year Average Returns 4-Quarter Rolling Returns<br />
Warehouse R&D Warehouse R&D<br />
NCREIF Returns 7.00% 5.26% 9.78% 11.93%<br />
NCREIF St. Dev. 11.31% 12.47% 11.31% 12.47%<br />
RAR* Metric 0.6 0.4 0.9 1.0<br />
RERC Returns 9.47% 10.11% 9.10% 9.58%<br />
NCREIF vs. RERC -2.46% -4.85% 0.68% 2.35%<br />
*RAR = Risk-Adjusted Return.<br />
Sources: RERC, NCREIF.<br />
RERC Industrial Performance Cycle<br />
Real Difference*<br />
15%<br />
10%<br />
5%<br />
0%<br />
-5%<br />
-10%<br />
-15%<br />
-20%<br />
-25%<br />
-30%<br />
-35%<br />
4Q 2000<br />
4Q 2001<br />
Market Equilibrium<br />
All Industrial<br />
R & D<br />
Warehouse<br />
4Q 2002<br />
4Q 2003<br />
4Q 2004<br />
4Q 2005<br />
4Q 2006<br />
Sources: RERC, NCREIF, 4Q 2010.<br />
*Difference between NCREIF realized and RERC required returns.<br />
Warehouse Investment Criteria Trends<br />
12%<br />
10%<br />
8%<br />
6%<br />
4Q 2000<br />
4Q 2001<br />
Source: RERC, 4Q 2010.<br />
4Q 2002<br />
4Q 2003<br />
4Q 2004<br />
R&D Investment Criteria Trends<br />
12%<br />
10%<br />
8%<br />
6%<br />
4Q 2000<br />
4Q 2001<br />
Source: RERC, 4Q 2010.<br />
4Q 2002<br />
4Q 2003<br />
4Q 2004<br />
4Q 2005<br />
4Q 2005<br />
4Q 2006<br />
4Q 2006<br />
WINTER 2011 | VOL 39 | NO 4<br />
4Q 2007<br />
4Q 2007<br />
4Q 2007<br />
4Q 2008<br />
4Q 2009<br />
Terminal Cap Rate<br />
Going-In Cap Rate<br />
Pre-Tax Yield<br />
4Q 2008<br />
4Q 2009<br />
Terminal Cap Rate<br />
Going-In Cap Rate<br />
Pre-Tax Yield<br />
4Q 2008<br />
4Q 2009<br />
4Q 2010<br />
4Q 2010<br />
4Q 2010<br />
15%<br />
10%<br />
-10%<br />
-15%<br />
-20%<br />
-25%<br />
-30%<br />
-35%<br />
© 2011 <strong>REAL</strong> <strong>ESTATE</strong> RESEARCH CORPORATION. ALL RIGHTS RESERVED.<br />
5%<br />
0%<br />
-5%<br />
12%<br />
10%<br />
8%<br />
6%<br />
12%<br />
10%<br />
8%<br />
6%