REAL ESTATE REPORT - REDI-net.com
REAL ESTATE REPORT - REDI-net.com
REAL ESTATE REPORT - REDI-net.com
- TAGS
- real
- estate
- redi-net.com

Create successful ePaper yourself
Turn your PDF publications into a flip-book with our unique Google optimized e-Paper software.
WINTER 2011 | VOL 39 | NO 4<br />
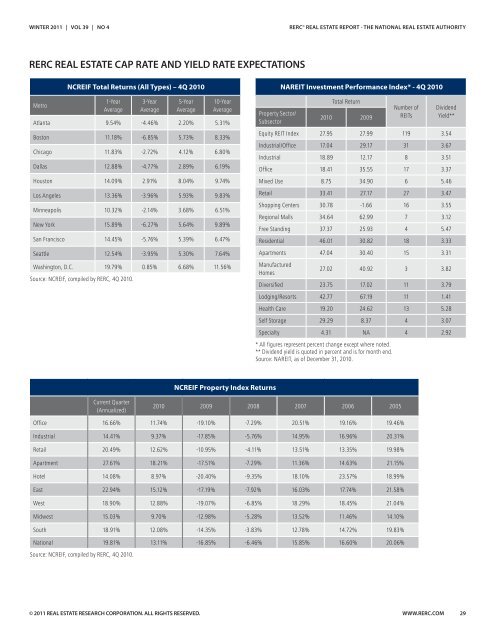
RERC <strong>REAL</strong> <strong>ESTATE</strong> CAP RATE AND YIELD RATE EXPECTATIONS<br />
Metro<br />
NCREIF Total Returns (All Types) – 4Q 2010<br />
1-Year<br />
Average<br />
3-Year<br />
Average<br />
5-Year<br />
Average<br />
© 2011 <strong>REAL</strong> <strong>ESTATE</strong> RESEARCH CORPORATION. ALL RIGHTS RESERVED.<br />
10-Year<br />
Average<br />
Atlanta 9.54% -4.46% 2.20% 5.31%<br />
Boston 11.18% -6.85% 5.73% 8.33%<br />
Chicago 11.83% -2.72% 4.12% 6.80%<br />
Dallas 12.88% -4.77% 2.89% 6.19%<br />
Houston 14.09% 2.91% 8.04% 9.74%<br />
Los Angeles 13.36% -3.96% 5.93% 9.83%<br />
Minneapolis 10.32% -2.14% 3.68% 6.51%<br />
New York 15.89% -6.27% 5.64% 9.89%<br />
San Francisco 14.45% -5.76% 5.39% 6.47%<br />
Seattle 12.54% -3.95% 5.30% 7.64%<br />
Washington, D.C. 19.79% 0.85% 6.68% 11.56%<br />
Source: NCREIF, <strong>com</strong>piled by RERC, 4Q 2010.<br />
Current Quarter<br />
(Annualized)<br />
Property Sector/<br />
Subsector<br />
RERC © <strong>REAL</strong> <strong>ESTATE</strong> <strong>REPORT</strong> - THE NATIONAL <strong>REAL</strong> <strong>ESTATE</strong> AUTHORITY<br />
NAREIT Investment Performance Index* - 4Q 2010<br />
Total Return<br />
2010 2009<br />
Number of<br />
REITs<br />
Dividend<br />
Yield**<br />
Equity REIT Index 27.95 27.99 119 3.54<br />
Industrial/Office 17.04 29.17 31 3.67<br />
Industrial 18.89 12.17 8 3.51<br />
Office 18.41 35.55 17 3.37<br />
Mixed Use 8.75 34.90 6 5.46<br />
Retail 33.41 27.17 27 3.47<br />
Shopping Centers 30.78 -1.66 16 3.55<br />
Regional Malls 34.64 62.99 7 3.12<br />
Free Standing 37.37 25.93 4 5.47<br />
Residential 46.01 30.82 18 3.33<br />
Apartments 47.04 30.40 15 3.31<br />
Manufactured<br />
Homes<br />
NCREIF Property Index Returns<br />
27.02 40.92 3 3.82<br />
Diversified 23.75 17.02 11 3.79<br />
Lodging/Resorts 42.77 67.19 11 1.41<br />
Health Care 19.20 24.62 13 5.28<br />
Self Storage 29.29 8.37 4 3.07<br />
Specialty 4.31 NA 4 2.92<br />
* All figures represent percent change except where noted.<br />
** Dividend yield is quoted in percent and is for month end.<br />
Source: NAREIT, as of December 31, 2010.<br />
2010 2009 2008 2007 2006 2005<br />
Office 16.66% 11.74% -19.10% -7.29% 20.51% 19.16% 19.46%<br />
Industrial 14.41% 9.37% -17.85% -5.76% 14.95% 16.96% 20.31%<br />
Retail 20.49% 12.62% -10.95% -4.11% 13.51% 13.35% 19.98%<br />
Apartment 27.61% 18.21% -17.51% -7.29% 11.36% 14.63% 21.15%<br />
Hotel 14.08% 8.97% -20.40% -9.35% 18.10% 23.57% 18.99%<br />
East 22.94% 15.12% -17.19% -7.92% 16.03% 17.74% 21.58%<br />
West 18.90% 12.88% -19.07% -6.85% 18.29% 18.45% 21.04%<br />
Midwest 15.03% 9.70% -12.98% -5.28% 13.52% 11.46% 14.10%<br />
South 18.91% 12.08% -14.35% -3.83% 12.78% 14.72% 19.83%<br />
National 19.81% 13.11% -16.85% -6.46% 15.85% 16.60% 20.06%<br />
Source: NCREIF, <strong>com</strong>piled by RERC, 4Q 2010.<br />
WWW.RERC.COM 29