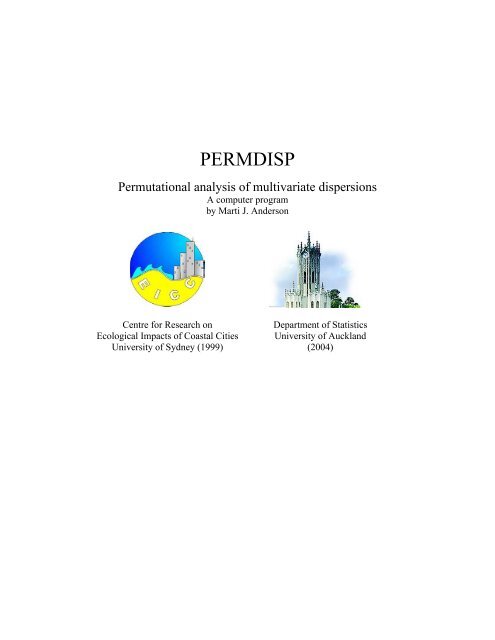
PERMDISP - Department of Statistics
PERMDISP - Department of Statistics
PERMDISP - Department of Statistics

You also want an ePaper? Increase the reach of your titles
YUMPU automatically turns print PDFs into web optimized ePapers that Google loves.
<strong>PERMDISP</strong><br />
Permutational analysis <strong>of</strong> multivariate dispersions<br />
A computer program<br />
by Marti J. Anderson<br />
Centre for Research on <strong>Department</strong> <strong>of</strong> <strong>Statistics</strong><br />
Ecological Impacts <strong>of</strong> Coastal Cities University <strong>of</strong> Auckland<br />
University <strong>of</strong> Sydney (1999) (2004)
DISCLAIMER<br />
2<br />
This FORTRAN program is provided without any explicit or implicit warranty <strong>of</strong> correct functioning. It<br />
has been developed as part <strong>of</strong> a university-based research program. If, however, you should encounter<br />
problems with this program, the author will be happy to help solve them. Researchers can use this program<br />
for scientific and research purposes, but intellectual property and copyright for the source code and<br />
program remains the property <strong>of</strong> Marti Jane Anderson. The program relies on several canned routines in<br />
FORTRAN from Numerical Recipes (Press et al. 1992). Namely, for finding the eigenvalues <strong>of</strong> a real<br />
symmetric distance matrix, using a householder reduction, I used the routines “tred2” and “tqli.” Also, for<br />
sorting, I used a variation <strong>of</strong> the routine “piksr2.” To determine the number <strong>of</strong> possible permutations, I used<br />
the gamma function for calculating factorials (“gammln”), the function for calculating the logarithm <strong>of</strong> a<br />
factorial (“factln”), and a variation on the function for a binomial coefficient (“bico”).<br />
Users <strong>of</strong> the program may refer to the present user’s guide as follows:<br />
Anderson, M.J. (2004). <strong>PERMDISP</strong>: a FORTRAN computer program for permutatinoal analysis <strong>of</strong><br />
multivariate dispersions (for any two-factor ANOVA design) using permutation tests. <strong>Department</strong><br />
<strong>of</strong> <strong>Statistics</strong>, University <strong>of</strong> Auckland, New Zealand.<br />
Author’s contact details:<br />
Dr Marti J. Anderson<br />
<strong>Department</strong> <strong>of</strong> <strong>Statistics</strong><br />
University <strong>of</strong> Auckland<br />
Private Bag 92019<br />
Auckland, New Zealand<br />
Tel: 64-9-373-7599 ext 85052<br />
Fax: 64-9-373-7018<br />
Email: mja@stat.auckland.ac.nz<br />
Website: http://www.stat.auckland.ac.nz/~mja
I. Introduction<br />
3<br />
<strong>PERMDISP</strong> is a computer program for comparing the multivariate dispersions among groups on the basis<br />
<strong>of</strong> any distance or dissimilarity measure <strong>of</strong> choice. More specifically, the test can be considered in two<br />
steps: (1) calculation <strong>of</strong> the distances from observations to their centroids and (2) comparison <strong>of</strong> the<br />
average <strong>of</strong> these distances among groups, using ANOVA. A P-value is then obtained using permutation <strong>of</strong><br />
the observations. The approach is a multivariate analogue to Levene’s test (Levene 1960). The analysis <strong>of</strong><br />
these distances to centroids can be done for any two-factor design, just as in PERMANOVA. It is wellknown<br />
that the test for differences in location among groups in multivariate space (such as PERMANOVA)<br />
is sensitive to differences in dispersion among the groups. Thus, rejection <strong>of</strong> the null hypothesis for<br />
PERMANOVA suggests that groups may differ because <strong>of</strong> their location, their relative dispersion, or both.<br />
The program is designed to be used as a companion to PERMANOVA, to assist in unraveling the possible<br />
reasons for rejection <strong>of</strong> the null hypothesis. It is also useful in its own right, however, to investigate<br />
differences in dispersions alone when hypotheses <strong>of</strong> this nature arise. For example, it has been suggested<br />
that variability in the structure <strong>of</strong> ecological assemblages may increase (Warwick and Clarke 1993) or<br />
decrease (e.g. Chapman et al. 1995) as a consequence <strong>of</strong> environmental stress or impact.<br />
II. Description <strong>of</strong> the Test Statistic<br />
Levene (1960) proposed doing an analysis <strong>of</strong> variance (ANOVA) on the absolute values <strong>of</strong><br />
deviations <strong>of</strong> observations from their group mean. For Levene’s test, let x ij be the observation on the<br />
univariate response variable for the jth observation (j = 1, …, n) in the ith group (i = 1, …, g). One then<br />
does a traditional ANOVA comparing the values <strong>of</strong> zij = xij<br />
− xi<br />
among the g groups, where<br />
n<br />
xi = ∑ j=<br />
1<br />
x<br />
ij<br />
. A multivariate analogue was described by Van Valen (1978) and given in Manly (1994),<br />
based on distances. As such, it opened up possibilities for ecological analysis based on distances or<br />
dissimilarities. Here, one does a traditional ANOVA on the Euclidean distances from individual<br />
observation vectors to their group centroid (Fig. 1). Thus, let x ij be a multivariate response vector for the<br />
jth observation (j = 1, …, n) in the ith group (i = 1, …, g), consisting <strong>of</strong> the responses x ijk on each <strong>of</strong> k = 1,<br />
…, p variables (e.g. in an ecological context, the vectors may be counts <strong>of</strong> abundances for each <strong>of</strong> p species<br />
or taxa). Calculate Euclidean distances as:<br />
zij = ij − xi<br />
=<br />
p<br />
∑ ( x −<br />
k=<br />
1 ijk<br />
xik =<br />
n<br />
x j 1 ijk<br />
2<br />
x x )<br />
(1)<br />
where i x is a vector <strong>of</strong> means ∑ =<br />
for each <strong>of</strong> the k = 1, …, p variables for the ith group.<br />
Hereafter, we shall use the notation 1 2 x x − to denote the Euclidean distance between two specified<br />
x . One then does a univariate ANOVA comparing the z ij ’s among the g groups. If two or<br />
vectors x 1 and 2<br />
more groups differ in their relative dispersions, then these distances ( z ij ’s) will be different, on average,<br />
among the groups (e.g. Fig. 1).<br />
ik
Variable 2<br />
x1<br />
j<br />
x1<br />
z1 j<br />
4<br />
Variable 1<br />
Fig. 1. Example <strong>of</strong> a multivariate systems with 2 variables (2 dimensions) and 10 observations in each <strong>of</strong> 2<br />
groups. The values <strong>of</strong> the z’s will, on average, differ significantly if the dispersion <strong>of</strong> points in multivariate<br />
space differs for the two groups.<br />
Now, rather than take the z’s and do a traditional univariate ANOVA on them, the program <strong>PERMDISP</strong><br />
does a permutational ANOVA (Anderson 2001). Thus, the same F-statistics are calculated, but P-values are<br />
obtained by permutation. In this fashion, we make no particular assumptions about the nature <strong>of</strong> the<br />
distribution <strong>of</strong> the original variables, nor <strong>of</strong> the z’s. In other words, consider that after <strong>PERMDISP</strong> has<br />
calculated the values for the z’s (one for each observation), it inputs these into the PERMANOVA<br />
procedure to test the null hypothesis <strong>of</strong> no difference in the average value <strong>of</strong> the z’s among the groups (see<br />
the PERMANOVA user notes for further details about this procedure).<br />
One special feature <strong>of</strong> the <strong>PERMDISP</strong> method is that it does not need to be based on Euclidean distances,<br />
as shown in Fig. 1. In fact, the z’s can be based on any dissimilarity measure <strong>of</strong> choice. If the measure<br />
chosen is not Euclidean, then the centroid in the space <strong>of</strong> observation points for a particular group is no<br />
longer going to be simply the arithmetic average <strong>of</strong> the original observations using the original variables.<br />
Instead, one must first calculate principal coordinates from the distance matrix chosen, then calculate<br />
appropriate centroids and z values from these (e.g. see McArdle and Anderson 2001). This and the use <strong>of</strong><br />
permutations are two important ways in which the method used here differs from that described by<br />
Underwood and Chapman (1998).<br />
III. Notes<br />
Note 1: If you have 2 observations per group, then the distance to the centroid (i.e. the value <strong>of</strong> z) will be<br />
the same for the two observations within the same group. Thus, there will be no within-group variance<br />
when the sample size is only 2. For this reason, the program will not calculate the tests <strong>of</strong> dispersion for<br />
sample sizes less than n = 3.<br />
Note 2: If you have a nested hierarchical design (i.e. factor B nested within factor A), there are two<br />
approaches to the test <strong>of</strong> dispersions. The first is using the individual observations as the units <strong>of</strong><br />
dispersion. The second is in the test <strong>of</strong> factor A, one might also use the centroids <strong>of</strong> the levels <strong>of</strong> factor B<br />
within A as the units <strong>of</strong> dispersion. For the nested design, the program <strong>PERMDISP</strong> will ask whether you<br />
wish to calculate dispersion using the second approach after it does the calculations using the first<br />
approach.<br />
Note 3: Your choice <strong>of</strong> transformation will radically affect your results. This is a well-known fact for<br />
univariate analysis, but is <strong>of</strong>ten forgotten in the context <strong>of</strong> multivariate analysis. Recall that many workers<br />
x2<br />
j<br />
x2<br />
z2 j
5<br />
use transformations to “fix” the problem <strong>of</strong> heterogeneity when dealing with univariate data sets. Be aware<br />
that when you transform data (using square roots, fourth roots, logs, etc.) you are also affecting the relative<br />
spread <strong>of</strong> the observations.<br />
Note 4: Your choice <strong>of</strong> distance or dissimilarity measure will radically affect your results. Many<br />
dissimilarity measure have intrinsic row (observation) standardizations in them, such as Bray-Curtis, Chisquared,<br />
CY dissimilarity, etc. As such, these change the relative dispersions within groups, especially for<br />
observations that have species with large abundances. Distance measures such as Euclidean, Manhattan and<br />
Gower’s measure do not have such intrinsic row standardizations.<br />
III. Running the Program<br />
A. Parameters <strong>of</strong> the Program<br />
The parameters <strong>of</strong> <strong>PERMDISP</strong> are currently set as follows:<br />
maximum no. <strong>of</strong> levels <strong>of</strong> either factor (a or b) = 20<br />
maximum sample size (no. <strong>of</strong> replicates, n) = 50<br />
maximum no. <strong>of</strong> variables = 500<br />
maximum total no. <strong>of</strong> observations or samples (N = a x b x n) = 500<br />
If the program will not run on your machine, it could be that the parameter settings are too large for your<br />
computer’s memory, or your data matrix or design exceeds the parameter settings.<br />
B. Format and Structure <strong>of</strong> the Input Data File<br />
One can either input a file containing raw data, or input a file containing a symmetric matrix <strong>of</strong> distances or<br />
dissimilarities. In each case, the file must be saved in tab delimited (ASCII text, *.txt) or comma delimited<br />
(*.csv) format. If you are using a Macintosh, then save the file (for example, from Excel) as “Text<br />
(Windows)”. If you save it as a simple text file from Excel, it won’t run unless you open up the file again<br />
(for example, using a text editor such as BBEdit) and manually add a carriage return (“Enter”) to the end <strong>of</strong><br />
the last line. This is a weird quirk <strong>of</strong> the way the Mac version <strong>of</strong> Excel saves text files that, for some reason<br />
unknown to me, causes my program to crash. You should not experience any such problem, however, if the<br />
file is saved as “Text (Windows)” or if the file was created using a different text editor.<br />
The option <strong>of</strong> entering a symmetric distance matrix means that the user can base the analysis on any<br />
distance measure <strong>of</strong> choice. If none <strong>of</strong> the choices <strong>of</strong> distance measures <strong>of</strong>fered in the <strong>PERMDISP</strong> program<br />
are suitable, then one can use a different distance function in another program and input this distance or<br />
dissimilarity matrix directly.<br />
A file containing raw data can be organised in one <strong>of</strong> two ways. Either (i) observations are in rows and<br />
variables (species) are in columns or (ii) variables are in rows and observations are in columns. The<br />
organisation <strong>of</strong> the samples should follow the experimental design, with the first partitioning <strong>of</strong> the data<br />
according to factor 1, the second partitioning according to factor 2, etc. For example, let’s say the data are<br />
organised so that columns are variables and rows are samples. In the case <strong>of</strong> two species variables in a 2factor<br />
crossed (orthogonal) experimental design, where each factor has 2 levels and the sample size is n =<br />
3, one would have two columns <strong>of</strong> numbers (corresponding to the two species) with the following<br />
organisation:
Factor 1<br />
Level 1<br />
Level 2<br />
Factor 2<br />
Level 1<br />
Level 2<br />
Level 1<br />
Level 2<br />
6<br />
Sp. 1 Sp. 2<br />
5<br />
4<br />
1<br />
0<br />
3<br />
7<br />
2<br />
7<br />
5<br />
8<br />
3<br />
0<br />
4<br />
1<br />
1<br />
2<br />
6<br />
2<br />
6<br />
3<br />
7<br />
8<br />
9<br />
1<br />
Data file<br />
(no headers<br />
on columns<br />
or rows)<br />
The matrix should be saved (preferably as an ASCII text file, commonly using the extension *.txt), with no<br />
headers on either the columns or the rows. This is the input file for the program. To avoid dealing with long<br />
file names and paths to locate files, place the file in the same location on your computer (i.e. the same<br />
directory) as the <strong>PERMDISP</strong>.exe (or <strong>PERMDISP</strong>.mac) file, for use with the program. Double-click on the<br />
“<strong>PERMDISP</strong>.exe” (or “<strong>PERMDISP</strong>.mac”) file to run the program.<br />
C. Output File<br />
The output file will contain the details <strong>of</strong> your experimental design, the choices you have made (in terms <strong>of</strong><br />
the distance measure, any transformation or standardization you have used, the method and number <strong>of</strong><br />
permutations chosen, etc.) and the ANOVA table <strong>of</strong> results. The F-ratio and associated P-value for each<br />
term in the analysis can be interpreted in the same way that one would interpret the result <strong>of</strong> a univariate<br />
analysis <strong>of</strong> variance, but it is the hypothesis <strong>of</strong> “no difference in multivariate dispersions among groups” for<br />
each factor that is being tested.<br />
It is a good idea to name the output file something with the extension *.txt on the end. This means that<br />
when one is working in Windows, double-clicking on the output file brings it up automatically in Notepad<br />
(for example) for easy examination and printing, if desired.<br />
D. Questions Asked by the Program<br />
The questions asked by the program are best demonstrated by an example. The data analysed here are from<br />
an experiment concerning the effect <strong>of</strong> shade and the effect <strong>of</strong> proximity to the seafloor on assemblages <strong>of</strong><br />
subtidal invertebrates and algae on hard surfaces near marinas (courtesy <strong>of</strong> Dr Tim Glasby). For further<br />
details, see Glasby (1999).<br />
The experiment was a two-way crossed (orthogonal) design with n = 4 having the following structure:<br />
Factor 1 = Position (fixed, 2 levels: far or near to the seafloor)<br />
Factor 2 = Shade (fixed, 3 levels: shade, a procedural control in the form <strong>of</strong> a clear plexiglass shade, and no<br />
shade)<br />
Organisms colonising subtidal 15cm x 15cm sandstone settlement plates were counted and a total <strong>of</strong> 46<br />
taxa were included in analyses. (Organisms that occurred less than twice were not included). The data<br />
matrix (24 rows (samples) x 46 columns (taxa)) is contained in an ASCII text file called “Tim.txt.”<br />
The questions asked by the program are given in Courier font, while responses given for this data set are<br />
in Times bold italics. Note that you can stop the program at any time by typing Ctrl-C (as for any DOS<br />
program) or, if you are a Mac user and this does not work, then try typing a period (a full stop) while<br />
holding down the apple key.<br />
______________________________________________________________________________________
Type the name <strong>of</strong> the input file containing your data<br />
Tim.txt<br />
7<br />
Type a name for the output file <strong>of</strong> results (*.txt)<br />
Results.txt<br />
Note: If the program crashes it may be because you already have a file in the directory with the same name<br />
as what you are typing here for the output file. If so, then you need to delete the previous file or type a new<br />
name. Unfortunately, the program is not smart enough to write over the top <strong>of</strong> an existing file.<br />
Nature <strong>of</strong> the data in the input file:<br />
1) raw data (n x p)<br />
2) distance matrix (n x n)<br />
1<br />
Structure <strong>of</strong> the input file:<br />
1) rows are samples and columns are variables<br />
2) columns are samples and rows are variables<br />
1<br />
How many variables (columns) are there?<br />
46<br />
Choice <strong>of</strong> transformation:<br />
1) none<br />
2) square-root<br />
3) fourth-root<br />
4) ln(x)<br />
5) ln(x+1)<br />
6) log10(x)<br />
7) log10(x+1)<br />
5) presence/absence<br />
3<br />
Choice <strong>of</strong> standardization:<br />
1) none<br />
2) standardize by row (sample) sums<br />
3) standardize by column (variable) sums<br />
4) double standardize by row and column sums<br />
5) standardize each variable to z-scores (normalize)<br />
6) standardize each variable by dividing by its s.d.<br />
7) standardize each variable by dividing by its range<br />
1<br />
Choice <strong>of</strong> distance measure:<br />
1) Bray-Curtis dissimilarity<br />
2) square root <strong>of</strong> Bray-Curtis<br />
3) Euclidean distance<br />
4) Orloci's Chord distance<br />
5) Chi-square metric<br />
6) Chi-square distance<br />
7) Hellinger distance<br />
8) Gower dissimilarity<br />
9) Gower, excluding double zeros<br />
10) Canberra distance<br />
11) square root <strong>of</strong> Canberra distance<br />
12) CY dissimilarity<br />
13) Deviance based on the binomial<br />
14) Deviance per observation (scale invariant)<br />
15) Kulczynski dissimilarity<br />
16) McArdle-Gower dissimilarity<br />
17) Manhattan (city block) distance<br />
18) Jaccard dissimilarity<br />
1<br />
Note: The same options were used here for the analysis as were chosen for the PERMANOVA <strong>of</strong> these<br />
data (see the PERMANOVA user notes). This was done so that the null hypothesis <strong>of</strong> no differences in
dispersion could be examined for these data as a companion to the PERMANOVA test for location<br />
differences that might be sensitive to this issue.<br />
Do you want to output the distance matrix?<br />
1) Yes<br />
2) No<br />
2<br />
This is usually not necessary unless you want to see particular distance values.<br />
ANOVA Experimental design:<br />
1) One-way<br />
2) Two-way nested<br />
3) Two-way crossed (i.e. factorial or orthogonal)<br />
3<br />
Experimental design <strong>of</strong> two-way crossed analysis:<br />
1) Fixed effects - both factors are fixed<br />
2) Random effects - both factors are random<br />
3) Mixed model - factor 1 is fixed, 2 is random<br />
4) Mixed model - factor 1 is random, 2 is fixed<br />
1<br />
What is the name <strong>of</strong> factor 1?<br />
Position<br />
Type the number <strong>of</strong> levels for factor 1<br />
2<br />
What is the name <strong>of</strong> factor 2?<br />
Shade<br />
Type the number <strong>of</strong> levels for factor 2<br />
3<br />
What is the number <strong>of</strong> replicates?<br />
4<br />
How many permutations do you want for the tests?<br />
(i.e. 99, 499, 999, 4999, etc.)<br />
9999<br />
Which general method <strong>of</strong> permutation do you want?<br />
1) Permutation <strong>of</strong> raw data<br />
2) Permutation <strong>of</strong> residuals (reduced model)<br />
3) Permutation <strong>of</strong> residuals (full model)<br />
1<br />
Type an integer to be used as the seed<br />
for the random permutations<br />
5<br />
The program will then print the results <strong>of</strong> the permutational tests <strong>of</strong> dispersions. This is written<br />
simultaneously to the screen and to the output file. In this case, the output looks like this:<br />
8<br />
--- Results ---<br />
Permutational Test <strong>of</strong> Multivariate Dispersion:<br />
tests for heterogeneity in the average dissimilarities<br />
<strong>of</strong> points from the central location <strong>of</strong> their group.<br />
Possible Denom.<br />
Source df SS MS F P No.perm. MS<br />
-----------------------------------------------------------------------------<br />
Posit 1 0.7265 0.7265 0.0777 0.7870 0.135E+07 Res<br />
Shade 2 8.6154 4.3077 0.4609 0.6377 0.158E+10 Res
9<br />
PoxSh 2 28.3288 14.1644 1.5154 0.2532 >1.0E+10 Res<br />
Resid 18 168.2509 9.3473<br />
Total 23 205.9217<br />
-----------------------------------------------------------------------------<br />
Data were transformed to fourth root<br />
No standardization<br />
Analysis based on Bray-Curtis dissimilarities<br />
Permutation <strong>of</strong> raw data<br />
No. <strong>of</strong> permutations used = 9999<br />
Once you have investigated the results, you may wish to analyse particular terms further by a posteriori<br />
tests. In the analysis <strong>of</strong> Tim’s data, there were no significant differences in multivariate dispersion among<br />
the groups. Thus, there is no need to investigate pair-wise comparisons. The next question <strong>of</strong> the program<br />
is:<br />
Would you like pair-wise a posteriori tests?<br />
(results are printed directly to the output file)<br />
1) Yes<br />
2) No<br />
2<br />
These results have been sent to the output file.<br />
End <strong>of</strong> the program.<br />
Press q to quit.<br />
q<br />
After completing <strong>PERMDISP</strong>, open the output file to see all <strong>of</strong> the results, including any a posteriori<br />
comparisons you may have done. The output file also contains the details <strong>of</strong> the experimental design. In the<br />
case <strong>of</strong> Tim’s data, the file “Results.txt” looks like this:<br />
Program <strong>PERMDISP</strong><br />
by M.J. Anderson<br />
<strong>Department</strong> <strong>of</strong> <strong>Statistics</strong>, University <strong>of</strong> Auckland (2004)<br />
Input file:Tim.txt<br />
--- Experimental Design ---<br />
Two-way crossed (orthogonal) ANOVA<br />
Factor 1 is Position with 2 levels<br />
Factor 2 is Shade with 3 levels<br />
Factors 1 and 2 are fixed<br />
The no. <strong>of</strong> replicates = 4<br />
The no. <strong>of</strong> variables = 46<br />
--- Results ---<br />
Permutational Test <strong>of</strong> Multivariate Dispersion:<br />
tests for heterogeneity in the average dissimilarities<br />
<strong>of</strong> points from the central location <strong>of</strong> their group.<br />
Possible Denom.<br />
Source df SS MS F P No.perm. MS<br />
-----------------------------------------------------------------------------<br />
Posit 1 0.7265 0.7265 0.0777 0.7870 0.135E+07 Res<br />
Shade 2 8.6154 4.3077 0.4609 0.6377 0.158E+10 Res<br />
PoxSh 2 28.3288 14.1644 1.5154 0.2532 >1.0E+10 Res<br />
Resid 18 168.2509 9.3473<br />
Total 23 205.9217<br />
-----------------------------------------------------------------------------<br />
Data were transformed to fourth root<br />
No standardization<br />
Analysis based on Bray-Curtis dissimilarities<br />
Permutation <strong>of</strong> raw data<br />
No. <strong>of</strong> permutations used = 9999
10<br />
The interpretation <strong>of</strong> the analysis is that there were no significant differences in multivariate dispersions for<br />
either <strong>of</strong> the factors: Position or Shade. The PERMANOVA (see the notes for the PERMANOVA program)<br />
did, however, find significant Position and Shade effects for these data on the basis <strong>of</strong> Bray-Curtis<br />
dissimilarities calculated on fourth-root transformed abundances. Thus, the effect <strong>of</strong> different positions and<br />
the effect <strong>of</strong> different shading treatments was to cause a shift in the assemblage structure (i.e. a location<br />
effect), not to make the assemblages either more or less variable.<br />
These results are supported by a visual assessment <strong>of</strong> patterns in a non-metric MDS plot <strong>of</strong> double-root<br />
transformed data using Bray-Curtis distances, as shown below:<br />
IV. References<br />
1 = Far from the seafloor<br />
2 = Close to the seafloor<br />
2<br />
1<br />
2<br />
2<br />
1<br />
1<br />
2<br />
1<br />
2<br />
2<br />
2<br />
1<br />
2<br />
2<br />
2<br />
1<br />
1<br />
Anderson, M.J. (2001). A new method for non-parametric multivariate analysis <strong>of</strong> variance. Austral<br />
Ecology 26: 32-46.<br />
Chapman, M.G., Underwood, A.J. and Skilleter, G.A. (1995). Variability at different spatial scales between<br />
a subtidal assemblage exposed to the discharge <strong>of</strong> sewage and two control locations. Journal <strong>of</strong><br />
Experimental Marine Biology and Ecology 189: 103-122.<br />
Glasby, T.M. (1999). Interactive effects <strong>of</strong> shading and proximity to the seafloor on the development <strong>of</strong><br />
subtidal epibiotic assemblages. Marine Ecology Progress Series 190: 113-124.<br />
Levene, H. (1960). Robust tests for equality <strong>of</strong> variances. Pages 278-292 in I. Olkin, S. G. Ghurye, W.<br />
Hoeffding, W. G. Madow, and H. B. Mann, editors. Contributions to probability and statistics.<br />
Stanford University Press, Stanford, California.<br />
Manly, B.F.J. (1994). Multivariate statistical methods: a primer, 2 nd edition. Chapman and Hall/CRC, Boca<br />
Raton, Florida.<br />
McArdle, B.H. and Anderson, M.J. (2001). Fitting multivariate models to community data: a comment on<br />
distance-based redundancy analysis. Ecology 82(1): 290-297.<br />
Press, W.H., Teuklosky, S.A., Vetterling, W.T. and Flannery, B.P. (1992). Numerical Recipes in<br />
FORTRAN, 2 nd edition. Cambridge University Press, Cambridge.<br />
Underwood, A.J. and Chapman, M.G. (1998). A method for analysing spatial scales <strong>of</strong> variation in<br />
composition <strong>of</strong> assemblages. Oecologia 117: 570-578.<br />
Van Valen, L. (1978). The statistics <strong>of</strong> variation. Evolutionary Theory 4: 33-43 (Erratum Evolutionary<br />
Theory 4: 202).<br />
1<br />
2<br />
2<br />
1<br />
1<br />
1<br />
Stress = 0.12<br />
1<br />
Shaded<br />
Control<br />
Open
Warwick, R.M. and Clarke, K.R. (1993). Increased variability as a symptom <strong>of</strong> stress in marine<br />
communities. Journal <strong>of</strong> Experimental Marine Biology and Ecology 172: 215-226.<br />
11