PERMDISP - Department of Statistics
PERMDISP - Department of Statistics
PERMDISP - Department of Statistics

Create successful ePaper yourself
Turn your PDF publications into a flip-book with our unique Google optimized e-Paper software.
I. Introduction<br />
3<br />
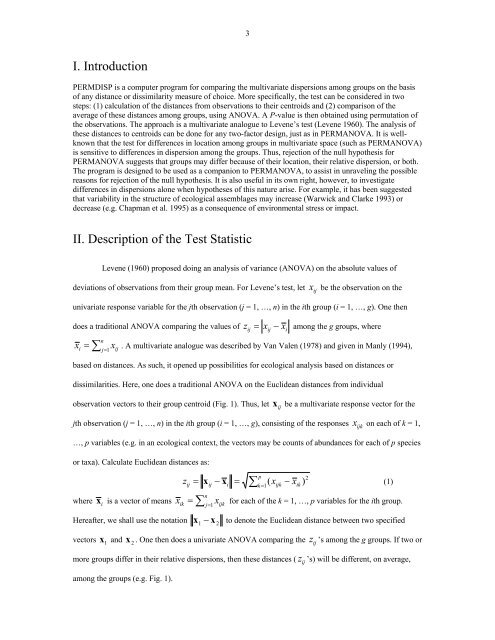
<strong>PERMDISP</strong> is a computer program for comparing the multivariate dispersions among groups on the basis<br />
<strong>of</strong> any distance or dissimilarity measure <strong>of</strong> choice. More specifically, the test can be considered in two<br />
steps: (1) calculation <strong>of</strong> the distances from observations to their centroids and (2) comparison <strong>of</strong> the<br />
average <strong>of</strong> these distances among groups, using ANOVA. A P-value is then obtained using permutation <strong>of</strong><br />
the observations. The approach is a multivariate analogue to Levene’s test (Levene 1960). The analysis <strong>of</strong><br />
these distances to centroids can be done for any two-factor design, just as in PERMANOVA. It is wellknown<br />
that the test for differences in location among groups in multivariate space (such as PERMANOVA)<br />
is sensitive to differences in dispersion among the groups. Thus, rejection <strong>of</strong> the null hypothesis for<br />
PERMANOVA suggests that groups may differ because <strong>of</strong> their location, their relative dispersion, or both.<br />
The program is designed to be used as a companion to PERMANOVA, to assist in unraveling the possible<br />
reasons for rejection <strong>of</strong> the null hypothesis. It is also useful in its own right, however, to investigate<br />
differences in dispersions alone when hypotheses <strong>of</strong> this nature arise. For example, it has been suggested<br />
that variability in the structure <strong>of</strong> ecological assemblages may increase (Warwick and Clarke 1993) or<br />
decrease (e.g. Chapman et al. 1995) as a consequence <strong>of</strong> environmental stress or impact.<br />
II. Description <strong>of</strong> the Test Statistic<br />
Levene (1960) proposed doing an analysis <strong>of</strong> variance (ANOVA) on the absolute values <strong>of</strong><br />
deviations <strong>of</strong> observations from their group mean. For Levene’s test, let x ij be the observation on the<br />
univariate response variable for the jth observation (j = 1, …, n) in the ith group (i = 1, …, g). One then<br />
does a traditional ANOVA comparing the values <strong>of</strong> zij = xij<br />
− xi<br />
among the g groups, where<br />
n<br />
xi = ∑ j=<br />
1<br />
x<br />
ij<br />
. A multivariate analogue was described by Van Valen (1978) and given in Manly (1994),<br />
based on distances. As such, it opened up possibilities for ecological analysis based on distances or<br />
dissimilarities. Here, one does a traditional ANOVA on the Euclidean distances from individual<br />
observation vectors to their group centroid (Fig. 1). Thus, let x ij be a multivariate response vector for the<br />
jth observation (j = 1, …, n) in the ith group (i = 1, …, g), consisting <strong>of</strong> the responses x ijk on each <strong>of</strong> k = 1,<br />
…, p variables (e.g. in an ecological context, the vectors may be counts <strong>of</strong> abundances for each <strong>of</strong> p species<br />
or taxa). Calculate Euclidean distances as:<br />
zij = ij − xi<br />
=<br />
p<br />
∑ ( x −<br />
k=<br />
1 ijk<br />
xik =<br />
n<br />
x j 1 ijk<br />
2<br />
x x )<br />
(1)<br />
where i x is a vector <strong>of</strong> means ∑ =<br />
for each <strong>of</strong> the k = 1, …, p variables for the ith group.<br />
Hereafter, we shall use the notation 1 2 x x − to denote the Euclidean distance between two specified<br />
x . One then does a univariate ANOVA comparing the z ij ’s among the g groups. If two or<br />
vectors x 1 and 2<br />
more groups differ in their relative dispersions, then these distances ( z ij ’s) will be different, on average,<br />
among the groups (e.g. Fig. 1).<br />
ik