Uniformity Control in Planetary Chemical Vapor Deposition Reactor ...
Uniformity Control in Planetary Chemical Vapor Deposition Reactor ...
Uniformity Control in Planetary Chemical Vapor Deposition Reactor ...

You also want an ePaper? Increase the reach of your titles
YUMPU automatically turns print PDFs into web optimized ePapers that Google loves.
17th IFAC World Congress (IFAC'08)<br />
Seoul, Korea, July 6-11, 2008<br />
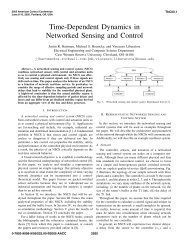
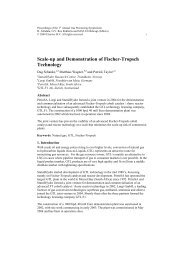
Fig. 3. Representative gas-phase concentration plot for<br />
Pe = 9 (top); result<strong>in</strong>g deposition profile as a function<br />
of reactor position (bottom). Red l<strong>in</strong>e <strong>in</strong>dicates wafer<br />
lead<strong>in</strong>g edge location, dashed red l<strong>in</strong>e <strong>in</strong>dicates wafer<br />
centerl<strong>in</strong>e. Simulation results correspond to parameters<br />
listed <strong>in</strong> Table 1.<br />
2.3 Representative simulation<br />
Consider a representative planetary reactor system with<br />
the design and operat<strong>in</strong>g parameters listed <strong>in</strong> Table 1.<br />
These design and operat<strong>in</strong>g parameter values correspond<br />
to the work of Beccard, et al. [1999], where an SiC film<br />
deposition process was simulated over a 2<strong>in</strong> wafer. The<br />
value of Pe = 9 was determ<strong>in</strong>ed so that our simulation<br />
results would corroborate with the lowest-flow simulation<br />
of Beccard, et al. [1999].<br />
In the upper plot of Fig. 3, gas flows from left to right<br />
between the upper and lower walls of the reaction chamber.<br />
When the gas enters, it is most highly concentrated <strong>in</strong> the<br />
deposition species; this concentration rapidly dim<strong>in</strong>ishes<br />
to near zero at the reactor outlet (η = 1) because of the<br />
diffusion to and deposition on both reactor walls.<br />
2.4 <strong>Deposition</strong> rate<br />
Because of the high susceptor temperature typically used<br />
<strong>in</strong> epitaxial MOCVD, the reactor operates <strong>in</strong> a mass<br />
transfer-limited mode - this fact was used to def<strong>in</strong>e the<br />
zero-concentration boundary conditions of the Graetz<br />
problem. Under these conditions, the deposition rate<br />
Dp(η) at the reactor roof and along the length of the<br />
susceptor is<br />
Dp(η) = DdcT<br />
∂xd(η)<br />
∂z<br />
�<br />
�<br />
�<br />
� z=0,h<br />
Parameter Value<br />
R0 0.0349 m<br />
Rw 0.0251 m<br />
Rs 0.0797 m<br />
Pe<br />
9<br />
I 8<br />
J 10<br />
J0<br />
2<br />
Table 1. Representative reactor operat<strong>in</strong>g, design,<br />
and simulation parameters.<br />
934<br />
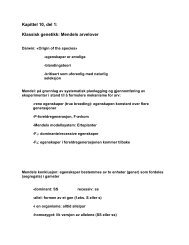
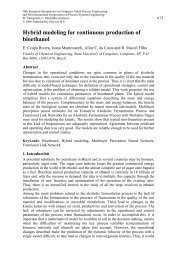
Fig. 4. Stalled (mesh) and rotationally averaged (solid)<br />
wafer maps for Pe = 9<br />
= DdcT<br />
�<br />
∂xd(η) �<br />
�<br />
h ∂ζ<br />
� ζ=0,1<br />
where the subscript d denotes the gas phase species that<br />
contribute to the deposition process. See the lower plot<br />
of Fig. 3 for a representative deposition profile over the<br />
susceptor surface.<br />
We project this deposition profile over the wafer doma<strong>in</strong> to<br />
f<strong>in</strong>d δ(r ′ , θ), where r ′ and θ denote coord<strong>in</strong>ates local to the<br />
wafer. An example of what such a projection may look like<br />
can be seen <strong>in</strong> Fig. 4 where the mesh surface illustrates the<br />
deposition profile over the stalled wafer and the deposition<br />
profile Dp corresponds to the simulation results illustrated<br />
<strong>in</strong> Fig. 3. The rotationally averaged profiles are found to<br />
be<br />
α(r ′ ) = 1<br />
2π<br />
�<br />
2π<br />
0<br />
δ(r ′ , θ) dθ.<br />
This bowl-shaped rotationally averaged profile is shown as<br />
the solid curve <strong>in</strong> Fig. 4.<br />
2.5 Comparison to detailed simulations<br />
Consider Fig. 5, where one SiC film thickness profile taken<br />
from Beccard, et al. [1999] is shown as the thicker solid<br />
curve; this profile corresponds the lowest carrier gas flow<br />
rate of Fig. 4 of the cited study. We plot our solutions<br />
found for values of Pe = [2, 9, 50, 500], demonstrat<strong>in</strong>g the<br />
excellent match achieved between the deposition profiles<br />
for the case Pe = 9. The changes <strong>in</strong> the deposition<br />
profile with Pe also match those found <strong>in</strong> Beccard, et al.<br />
[1999]. Overall, we f<strong>in</strong>d that our simplified model does<br />
an excellent job of approximat<strong>in</strong>g a more detailed reactor<br />
system model.<br />
2.6 Non-uniformity control<br />
If the average film thickness over the entire wafer surface<br />
is given by<br />
αavg = 1<br />
πR2 �Rw<br />
α(r<br />
w<br />
′ ) r dr<br />
0