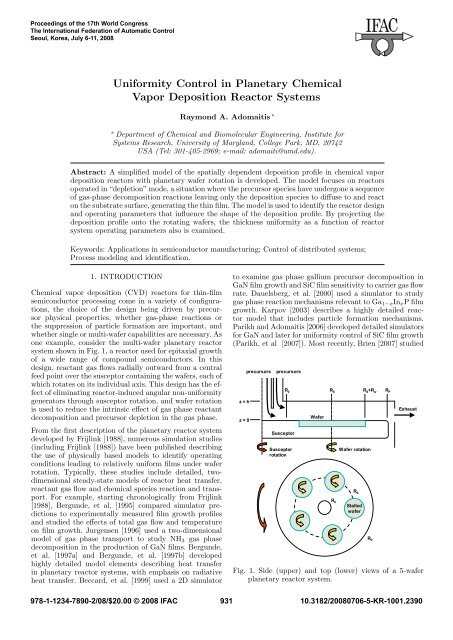
Uniformity Control in Planetary Chemical Vapor Deposition Reactor ...
Uniformity Control in Planetary Chemical Vapor Deposition Reactor ...
Uniformity Control in Planetary Chemical Vapor Deposition Reactor ...

You also want an ePaper? Increase the reach of your titles
YUMPU automatically turns print PDFs into web optimized ePapers that Google loves.
Proceed<strong>in</strong>gs of the 17th World Congress<br />
The International Federation of Automatic <strong>Control</strong><br />
Seoul, Korea, July 6-11, 2008<br />
<strong>Uniformity</strong> <strong>Control</strong> <strong>in</strong> <strong>Planetary</strong> <strong>Chemical</strong><br />
<strong>Vapor</strong> <strong>Deposition</strong> <strong>Reactor</strong> Systems<br />
Raymond A. Adomaitis ∗<br />
∗ Department of <strong>Chemical</strong> and Biomolecular Eng<strong>in</strong>eer<strong>in</strong>g, Institute for<br />
Systems Research, University of Maryland, College Park, MD, 20742<br />
USA (Tel: 301-405-2969; e-mail: adomaiti@umd.edu).<br />
Abstract: A simplified model of the spatially dependent deposition profile <strong>in</strong> chemical vapor<br />
deposition reactors with planetary wafer rotation is developed. The model focuses on reactors<br />
operated <strong>in</strong> “depletion” mode, a situation where the precursor species have undergone a sequence<br />
of gas-phase decomposition reactions leav<strong>in</strong>g only the deposition species to diffuse to and react<br />
on the substrate surface, generat<strong>in</strong>g the th<strong>in</strong> film. The model is used to identify the reactor design<br />
and operat<strong>in</strong>g parameters that <strong>in</strong>fluence the shape of the deposition profile. By project<strong>in</strong>g the<br />
deposition profile onto the rotat<strong>in</strong>g wafers, the thickness uniformity as a function of reactor<br />
system operat<strong>in</strong>g parameters also is exam<strong>in</strong>ed.<br />
Keywords: Applications <strong>in</strong> semiconductor manufactur<strong>in</strong>g; <strong>Control</strong> of distributed systems;<br />
Process model<strong>in</strong>g and identification.<br />
1. INTRODUCTION<br />
<strong>Chemical</strong> vapor deposition (CVD) reactors for th<strong>in</strong>-film<br />
semiconductor process<strong>in</strong>g come <strong>in</strong> a variety of configurations,<br />
the choice of the design be<strong>in</strong>g driven by precursor<br />
physical properties, whether gas-phase reactions or<br />
the suppression of particle formation are important, and<br />
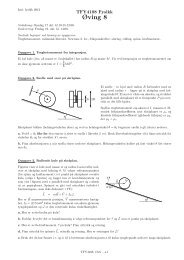
whether s<strong>in</strong>gle or multi-wafer capabilities are necessary. As<br />
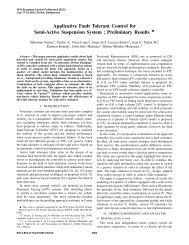
one example, consider the multi-wafer planetary reactor<br />
system shown <strong>in</strong> Fig. 1, a reactor used for epitaxial growth<br />
of a wide range of compound semiconductors. In this<br />
design, reactant gas flows radially outward from a central<br />
feed po<strong>in</strong>t over the susceptor conta<strong>in</strong><strong>in</strong>g the wafers, each of<br />
which rotates on its <strong>in</strong>dividual axis. This design has the effect<br />
of elim<strong>in</strong>at<strong>in</strong>g reactor-<strong>in</strong>duced angular non-uniformity<br />
generators through susceptor rotation, and wafer rotation<br />
is used to reduce the <strong>in</strong>tr<strong>in</strong>sic effect of gas phase reactant<br />
decomposition and precursor depletion <strong>in</strong> the gas phase.<br />
From the first description of the planetary reactor system<br />
developed by Frijl<strong>in</strong>k [1988], numerous simulation studies<br />
(<strong>in</strong>clud<strong>in</strong>g Frijl<strong>in</strong>k [1988]) have been published describ<strong>in</strong>g<br />
the use of physically based models to identify operat<strong>in</strong>g<br />
conditions lead<strong>in</strong>g to relatively uniform films under wafer<br />
rotation. Typically, these studies <strong>in</strong>clude detailed, twodimensional<br />
steady-state models of reactor heat transfer,<br />
reactant gas flow and chemical species reaction and transport.<br />
For example, start<strong>in</strong>g chronologically from Frijl<strong>in</strong>k<br />
[1988], Bergunde, et al. [1995] compared simulator predictions<br />
to experimentally measured film growth profiles<br />
and studied the effects of total gas flow and temperature<br />
on film growth. Jurgensen [1996] used a two-dimensional<br />
model of gas phase transport to study NH3 gas phase<br />
decomposition <strong>in</strong> the production of GaN films. Bergunde,<br />
et al. [1997a] and Bergunde, et al. [1997b] developed<br />
highly detailed model elements describ<strong>in</strong>g heat transfer<br />
<strong>in</strong> planetary reactor systems, with emphasis on radiative<br />
heat transfer. Beccard, et al. [1999] used a 2D simulator<br />
to exam<strong>in</strong>e gas phase gallium precursor decomposition <strong>in</strong><br />
GaN film growth and SiC film sensitivity to carrier gas flow<br />
rate. Dauelsberg, et al. [2000] used a simulator to study<br />
gas phase reaction mechanisms relevant to Ga1−xInxP film<br />
growth. Karpov [2003] describes a highly detailed reactor<br />
model that <strong>in</strong>cludes particle formation mechanisms.<br />
Parikh and Adomaitis [2006] developed detailed simulators<br />
for GaN and later for uniformity control of SiC film growth<br />
(Parikh, et al [2007]). Most recently, Brien [2007] studied<br />
z = h<br />
z = 0<br />
Group V<br />
precursors<br />
Group III<br />
precursors<br />
R 0<br />
Susceptor<br />
Susceptor<br />
rotation<br />
Wafer<br />
R S<br />
R 0<br />
Wafer rotation<br />
R S<br />
Stalled<br />
wafer<br />
R S +R w<br />
R P<br />
R P<br />
Exhaust<br />
Fig. 1. Side (upper) and top (lower) views of a 5-wafer<br />
planetary reactor system.<br />
978-1-1234-7890-2/08/$20.00 © 2008 IFAC 931 10.3182/20080706-5-KR-1001.2390
17th IFAC World Congress (IFAC'08)<br />
Seoul, Korea, July 6-11, 2008<br />
GaAs film growth with a focus on reactor <strong>in</strong>let design for<br />
uniformity control and effective precursor utilization.<br />
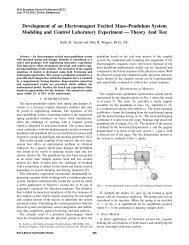
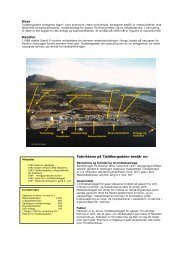
Fig. 2. SiC film thickness (<strong>in</strong> µm) over a stalled wafer;<br />
reactant gas flow is from left to right. Experimental<br />
data are taken from Parikh, et al [2007].<br />
1.1 Depletion mode of operation<br />
In all the model<strong>in</strong>g and optimization studies cited, one<br />
or more of the precursors undergoes a sequence of gasphase<br />
decomposition reactions produc<strong>in</strong>g gas phase species<br />
capable of deposition. For example, <strong>in</strong> SiC deposition,<br />
silane undergoes the decomposition sequence<br />
SiH4 → SiH2 → Si<br />
where the atomic Si is primarily responsible for film<br />
formation. Likewise <strong>in</strong> GaN systems, trimethylgallium<br />
(TMG) thermally decomposes <strong>in</strong>to the dimethyl- and<br />
monomethyl subalkyls <strong>in</strong> the follow<strong>in</strong>g manner<br />
TMG → DMG → MMG → Ga.<br />
with the MMG and atomic gallium contribut<strong>in</strong>g largely to<br />
the film growth rate (Parikh and Adomaitis [2006]).<br />
Given these decomposition and deposition reaction pathways,<br />
the radial flow CVD reactor can be conceptually<br />
split up <strong>in</strong>to three dist<strong>in</strong>ct regions of reactor operation<br />
along the radial direction r: the first is the central region<br />
where the reactants heat quickly (see Parikh and<br />
Adomaitis [2006] for an example) due to the high reactor<br />
temperature required for epitaxial growth. After sufficient<br />
heat<strong>in</strong>g, the gas phase reactions commence, and the second<br />
reactor region is characterized by an <strong>in</strong>creas<strong>in</strong>g deposition<br />
rate with respect to r. The third and f<strong>in</strong>al region beg<strong>in</strong>s<br />
after the peak deposition rate; <strong>in</strong> this region, the species<br />
<strong>in</strong>volved <strong>in</strong> gas phase reactions have been depleted and<br />
only those important to film growth rema<strong>in</strong>, result<strong>in</strong>g <strong>in</strong><br />
a radial deposition profile that tapers off with <strong>in</strong>creas<strong>in</strong>g<br />
r. See Fig. 2 for an example of thickness data on a stalled<br />
wafer, illustrat<strong>in</strong>g how a relatively thick film is formed at<br />
the wafer lead<strong>in</strong>g edge and the nearly order of magnitude<br />
drop <strong>in</strong> thickness <strong>in</strong> the direction of gas flow, a film profile<br />
characteristic of the depletion zone.<br />
1.2 <strong>Uniformity</strong> control <strong>in</strong> the depletion zone<br />
In virtually all of the optimization studies cited, the<br />
reactor operat<strong>in</strong>g parameters were set so that the wafer<br />
was located <strong>in</strong> the depletion zone. Therefore, we exam<strong>in</strong>e<br />
the follow<strong>in</strong>g four issues def<strong>in</strong><strong>in</strong>g the ma<strong>in</strong> contributions<br />
of this paper:<br />
(1) Develop a simplified model of the deposition rate<br />
profile <strong>in</strong> the depletion zone;<br />
(2) Identify which design and operat<strong>in</strong>g parameters affect<br />
the deposition profile <strong>in</strong> this zone to determ<strong>in</strong>e which<br />
parameters are most effective for controll<strong>in</strong>g nonuniformity;<br />
(3) Determ<strong>in</strong>e the range of the parameters where reasonable<br />
uniformity (e.g., less than 1% mean squared<br />
non-unifomity) is to be found;<br />
(4) Exam<strong>in</strong>e representative published results to determ<strong>in</strong>e<br />
if the simplified reactor model and uniformity<br />
optimization results are consistent with the previous<br />
studies.<br />
2. REACTOR MODELING<br />
In the depletion zone of the reactor, no gas phase reactions<br />
take place and the reactor temperature can be assumed<br />
constant. We also assume pressure-<strong>in</strong>duced density variations<br />
are negligible, and viscosity, density, and all other<br />
gas properties are constant with respect to spatial position<br />
<strong>in</strong> this reaction zone.<br />
We def<strong>in</strong>e the flux of a gas phase species si <strong>in</strong> the r<br />
direction<br />
∂ci<br />
flux = civr − Di<br />
∂r<br />
where ci is the concentration of species i, vr the radial<br />
velocity, and Di the diffusivity of species i, a material<br />
balance on a two-dimensional differential element gives<br />
�<br />
1 ∂<br />
xirvr − Dir<br />
r ∂r<br />
∂xi<br />
�<br />
+<br />
∂r<br />
∂<br />
�<br />
�<br />
∂xi<br />
xivz − Di = 0 (1)<br />
∂z<br />
∂z<br />
where xi is the mole fraction of species i. For constant<br />
density ρ and viscosity µ, the equations of fluid motion<br />
can be written as<br />
�<br />
�<br />
∂vr ∂vr<br />
ρ vr + vz<br />
∂r ∂z<br />
= − ∂p<br />
� �<br />
1 ∂<br />
+ µ r<br />
∂r r ∂r<br />
∂vr<br />
�<br />
+<br />
∂r<br />
∂2vr vr<br />
−<br />
∂z2 r2 �<br />
�<br />
�<br />
∂vz ∂vz<br />
ρ vr + vz<br />
∂r ∂z<br />
= − ∂p<br />
� �<br />
1 ∂<br />
+ µ r<br />
∂z r ∂r<br />
∂vz<br />
�<br />
+<br />
∂r<br />
∂2vz ∂z2 �<br />
932<br />
together with the cont<strong>in</strong>uity equation:<br />
1 ∂<br />
r ∂r (rvr) + ∂vz<br />
= 0<br />
∂z<br />
where p(r, z) is the gas pressure and vz the vertical<br />
component of gas velocity.
17th IFAC World Congress (IFAC'08)<br />
Seoul, Korea, July 6-11, 2008<br />
2.1 Simplifications<br />
Assum<strong>in</strong>g the gas flow field is fully developed, that the<br />
ceil<strong>in</strong>g height h is constant with respect to the radial<br />
coord<strong>in</strong>ate r, and that the fluid <strong>in</strong>ertial terms are negligible<br />
(ρ is small), vz = 0 and the fluid flow model<strong>in</strong>g equations<br />
reduce to the s<strong>in</strong>gle equation<br />
0 = − ∂p<br />
+ µ<br />
∂r<br />
� 1<br />
r<br />
∂<br />
∂r<br />
�<br />
r ∂vr<br />
∂r<br />
�<br />
+ ∂2vr vr<br />
−<br />
∂z2 r2 �<br />
which can be further simplified us<strong>in</strong>g the cont<strong>in</strong>uity equation<br />
1 ∂<br />
r ∂r (rvr) = 0<br />
to f<strong>in</strong>d<br />
µ ∂2vr ∂p<br />
=<br />
∂z2 ∂r<br />
which can be solved for vr(r, z) given the boundary conditions<br />
vr(r, 0) = vr(r, h) = 0 and that the total volumetric<br />
flow of reactant gas V at reactor operat<strong>in</strong>g temperature<br />
and pressure:<br />
vr(r, z) = −z(h − z) 1 ∂p<br />
3V<br />
= z(h − z)<br />
2µ ∂r πh3r .<br />
For<br />
xirvr ≫ Dir ∂xi<br />
∂r<br />
and vz = 0, equation (1) reduces to the well-known Graetz<br />
problem Hsu [1963]:<br />
z(h − z) 3V<br />
πh3 1 ∂xi ∂<br />
= Di<br />
r ∂r 2xi ∂z2 subject to boundary conditions<br />
xi(R0, z) = 1 for z ∈ (0, h)<br />
xi(r, 0) = xi(r, h) = 0 r ∈ [R0, RP ].<br />
See Fig. 1 and Table 1 for the def<strong>in</strong>itions of R0, RW , RP<br />
and other notation.<br />
Def<strong>in</strong><strong>in</strong>g<br />
r − R0<br />
η =<br />
RS + RW − R0<br />
and ζ = z<br />
h<br />
and the Peclet number and dimensionless <strong>in</strong>let position<br />
parameter η0 for this system as<br />
3V h<br />
Pe =<br />
πDi(RS + RW − R0) 2 , η0<br />
R0<br />
=<br />
RW + RS − R0<br />
we f<strong>in</strong>d<br />
subject to<br />
1 ∂x<br />
ζ(1 − ζ)<br />
η + η0 ∂η<br />
1 ∂<br />
=<br />
Pe<br />
2x ∂ζ 2<br />
(2)<br />
xi(0, ζ) = 1 for ζ ∈ (0, 1) (3)<br />
xi(η, 0) = xi(η, 1) = 0 η ∈ [0, 1]. (4)<br />
At this po<strong>in</strong>t, we make the follow<strong>in</strong>g observation: the<br />
deposition profile depends only on two parameters: η0 and<br />
933<br />
Pe. Physically, this translates <strong>in</strong>to a clear def<strong>in</strong>ition of<br />
the operational parameters that most <strong>in</strong>fluence the film<br />
thickness profile: the carrier gas flow rate V can be used<br />
to adjust Pe which is proportional to V . While the start<strong>in</strong>g<br />
po<strong>in</strong>t of the depletion zone η0 will also depend on V , η0 can<br />
be manipulated by the feed gas heat<strong>in</strong>g rate or susceptor<br />
temperature.<br />
2.2 Solution<br />
Equation 2, subject to the boundary conditions (3-4),<br />
can be solved us<strong>in</strong>g the eigenfunction expansion general<br />
solution<br />
∞�<br />
x(η, ζ) = aie λi(η+η0)2 /2Peψi(ζ) i=1<br />
where the ψi(η) are orthonormal eigenfunctions (with respect<br />
to <strong>in</strong>ner product weight function ζ(1−ζ)) computed<br />
as solutions to the eigenvalue problem<br />
d2ψ = λψζ(1 − ζ) subject to ψ(0) = ψ(1) = 0.<br />
dζ2 The <strong>in</strong>let condition is used to f<strong>in</strong>d the particular solution<br />
e λiη2<br />
0 /2Pe ai =<br />
�1<br />
0<br />
ψi(ζ) ζ(1 − ζ)dζ.<br />
This solution procedure works well for large Pe and small<br />
η0; however, for small values of Pe and when η > 0, the<br />
solution converges slowly, if at all, because the ai grow<br />
<strong>in</strong>f<strong>in</strong>itely large with <strong>in</strong>creas<strong>in</strong>g i. Therefore, we pose a<br />
solution <strong>in</strong> the form<br />
J0 �<br />
I� J�<br />
x(η, ζ) = ajψj(ζ) + bi,jφi(η)ψj(ζ) (5)<br />
j=1<br />
i=1 j=1<br />
where the ψj(η) are the even, normalized solutions to the<br />
eigenvalue problem<br />
d2ψ = λψ subject to ψ(0) = ψ(1) = 0<br />
dζ2 and the φi(η) are orthonormal polynomials <strong>in</strong> η that vanish<br />
at η = 0. Evaluat<strong>in</strong>g (5) at η = 0 and project<strong>in</strong>g the result<br />
onto each basis function gives<br />
aj = σj<br />
�1<br />
0<br />
ψj(ζ)dζ, j = 1, . . . , J0<br />
where the σj are Fourier-space filter coefficients used to<br />
reduce the Gibbs’ oscillations at the reaction zone <strong>in</strong>let. A<br />
Galerk<strong>in</strong> procedure then is implemented by substitut<strong>in</strong>g<br />
(5) <strong>in</strong>to (2) and project<strong>in</strong>g the residual onto each basis<br />
function to f<strong>in</strong>d<br />
I�<br />
J�<br />
i=1 j=1<br />
bi,j<br />
� ζ(1 − ζ)<br />
η + η0<br />
φ ′ iψj, φmψn<br />
�<br />
= 1<br />
anλn +<br />
Pe<br />
1<br />
bm,nλn<br />
Pe
17th IFAC World Congress (IFAC'08)<br />
Seoul, Korea, July 6-11, 2008<br />
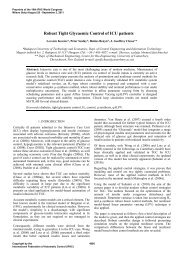
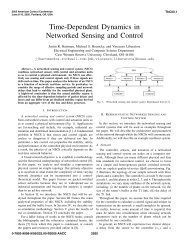
Fig. 3. Representative gas-phase concentration plot for<br />
Pe = 9 (top); result<strong>in</strong>g deposition profile as a function<br />
of reactor position (bottom). Red l<strong>in</strong>e <strong>in</strong>dicates wafer<br />
lead<strong>in</strong>g edge location, dashed red l<strong>in</strong>e <strong>in</strong>dicates wafer<br />
centerl<strong>in</strong>e. Simulation results correspond to parameters<br />
listed <strong>in</strong> Table 1.<br />
2.3 Representative simulation<br />
Consider a representative planetary reactor system with<br />
the design and operat<strong>in</strong>g parameters listed <strong>in</strong> Table 1.<br />
These design and operat<strong>in</strong>g parameter values correspond<br />
to the work of Beccard, et al. [1999], where an SiC film<br />
deposition process was simulated over a 2<strong>in</strong> wafer. The<br />
value of Pe = 9 was determ<strong>in</strong>ed so that our simulation<br />
results would corroborate with the lowest-flow simulation<br />
of Beccard, et al. [1999].<br />
In the upper plot of Fig. 3, gas flows from left to right<br />
between the upper and lower walls of the reaction chamber.<br />
When the gas enters, it is most highly concentrated <strong>in</strong> the<br />
deposition species; this concentration rapidly dim<strong>in</strong>ishes<br />
to near zero at the reactor outlet (η = 1) because of the<br />
diffusion to and deposition on both reactor walls.<br />
2.4 <strong>Deposition</strong> rate<br />
Because of the high susceptor temperature typically used<br />
<strong>in</strong> epitaxial MOCVD, the reactor operates <strong>in</strong> a mass<br />
transfer-limited mode - this fact was used to def<strong>in</strong>e the<br />
zero-concentration boundary conditions of the Graetz<br />
problem. Under these conditions, the deposition rate<br />
Dp(η) at the reactor roof and along the length of the<br />
susceptor is<br />
Dp(η) = DdcT<br />
∂xd(η)<br />
∂z<br />
�<br />
�<br />
�<br />
� z=0,h<br />
Parameter Value<br />
R0 0.0349 m<br />
Rw 0.0251 m<br />
Rs 0.0797 m<br />
Pe<br />
9<br />
I 8<br />
J 10<br />
J0<br />
2<br />
Table 1. Representative reactor operat<strong>in</strong>g, design,<br />
and simulation parameters.<br />
934<br />
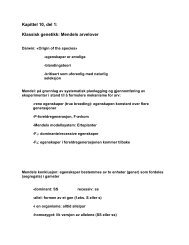
Fig. 4. Stalled (mesh) and rotationally averaged (solid)<br />
wafer maps for Pe = 9<br />
= DdcT<br />
�<br />
∂xd(η) �<br />
�<br />
h ∂ζ<br />
� ζ=0,1<br />
where the subscript d denotes the gas phase species that<br />
contribute to the deposition process. See the lower plot<br />
of Fig. 3 for a representative deposition profile over the<br />
susceptor surface.<br />
We project this deposition profile over the wafer doma<strong>in</strong> to<br />
f<strong>in</strong>d δ(r ′ , θ), where r ′ and θ denote coord<strong>in</strong>ates local to the<br />
wafer. An example of what such a projection may look like<br />
can be seen <strong>in</strong> Fig. 4 where the mesh surface illustrates the<br />
deposition profile over the stalled wafer and the deposition<br />
profile Dp corresponds to the simulation results illustrated<br />
<strong>in</strong> Fig. 3. The rotationally averaged profiles are found to<br />
be<br />
α(r ′ ) = 1<br />
2π<br />
�<br />
2π<br />
0<br />
δ(r ′ , θ) dθ.<br />
This bowl-shaped rotationally averaged profile is shown as<br />
the solid curve <strong>in</strong> Fig. 4.<br />
2.5 Comparison to detailed simulations<br />
Consider Fig. 5, where one SiC film thickness profile taken<br />
from Beccard, et al. [1999] is shown as the thicker solid<br />
curve; this profile corresponds the lowest carrier gas flow<br />
rate of Fig. 4 of the cited study. We plot our solutions<br />
found for values of Pe = [2, 9, 50, 500], demonstrat<strong>in</strong>g the<br />
excellent match achieved between the deposition profiles<br />
for the case Pe = 9. The changes <strong>in</strong> the deposition<br />
profile with Pe also match those found <strong>in</strong> Beccard, et al.<br />
[1999]. Overall, we f<strong>in</strong>d that our simplified model does<br />
an excellent job of approximat<strong>in</strong>g a more detailed reactor<br />
system model.<br />
2.6 Non-uniformity control<br />
If the average film thickness over the entire wafer surface<br />
is given by<br />
αavg = 1<br />
πR2 �Rw<br />
α(r<br />
w<br />
′ ) r dr<br />
0
17th IFAC World Congress (IFAC'08)<br />
Seoul, Korea, July 6-11, 2008<br />
growth rate<br />
12<br />
10<br />
8<br />
6<br />
4<br />
2<br />
0<br />
wafer location<br />
Beccard et al., 1999<br />
Pe = 2<br />
Pe = 9<br />
Pe = 50<br />
Pe = 500<br />
−2<br />
0 0.02 0.04 0.06 0.08 0.1 0.12 0.14<br />
r (m)<br />
Fig. 5. Depletion plot with data estimated from Beccard,<br />
et al. [1999]. Growth rate is given <strong>in</strong> arbitrary units<br />
<strong>in</strong> the cited study.<br />
Non−uniformity<br />
10 −1<br />
10 −2<br />
10 −3<br />
10 1<br />
Fig. 6. Wafer uniformity Nu as a function of Pe. Red circle<br />
marks the po<strong>in</strong>t where Pe = 9 and the nonuniformity<br />
is approximately 8%.<br />
we assess the degree of nonunifomity as<br />
Pe<br />
10 2<br />
Nu = �(δ(r ′ , θ)/αavg − 1�.<br />
Simulation results <strong>in</strong> Beccard, et al. [1999] demonstrated<br />
little change <strong>in</strong> η0 as the carrier gas flow rate was varied;<br />
therefore, Pe can be adjusted <strong>in</strong>dependently of η0 <strong>in</strong><br />
that system, mak<strong>in</strong>g Nu a function only of Pe. In this<br />
plot we see that for all Pe > 15 we achieve less than<br />
1% non-uniformity over the rotationally averaged wafer.<br />
There is a local non-uniformity m<strong>in</strong>imum at approximately<br />
Pe = 20, and the non-uniformity approaches zero as<br />
Pe → ∞, the case where the carrier gas flow rate is<br />
so high that the film becomes uniform over the stalled<br />
wafer surface. While this condition can produce perfect<br />
thickness uniformity, it comes as great expense because of<br />
the excessive consumption of reactant gases, mak<strong>in</strong>g the<br />
local m<strong>in</strong>imum an attractive alternative setpo<strong>in</strong>t.<br />
10 3<br />
935<br />
ACKNOWLEDGEMENTS<br />
The author gratefully acknowledges the support of the<br />
National Science Foundation through grant CTS-0554045<br />
REFERENCES<br />
Beccard, R., D. Schmitz, E. G. Woelk, G. Strauch, Y.<br />
Makarov, M. Heuken, M. Deschler, and H. Juergensen<br />
(1999) High temperature CVD systems to grow GaN<br />
or SiC based structures, J. Mat. Sci. and Eng. B61-62<br />
314-319.<br />
Bergunde, T., D. Gutsche, L. Kad<strong>in</strong>ski, Yu. Makarov, and<br />
M. Weyers (1995) Transport and reaction behavior <strong>in</strong><br />
Aix-2000 <strong>Planetary</strong> metalorganic vapor phase epitaxy<br />
reactor, J. Crystal Growth 146 564-569.<br />
Bergunde, T., M. Dauelsberg, L. Kad<strong>in</strong>ski, Yu. N.<br />
Makarov, M. Weyers, D. Schmitz, G. Strauch, and J.<br />
Jurgensen (1997) Heat transfer and mass transport <strong>in</strong> a<br />
multiwafer MOVPE reactor: modell<strong>in</strong>g and experimental<br />
studies, J. Crystal Growth 170 66-71.<br />
Bergunde, T., M. Dauelsberg, L. Kad<strong>in</strong>ski, Yu. N.<br />
Makarov, V. S. Yuferev, D. Schmitz, G. Strauch, and<br />
J. Jurgensen (1997) Process optimization of MOVPE<br />
growth by numerical modell<strong>in</strong>g of transport phenomena<br />
<strong>in</strong>clud<strong>in</strong>g thermal radiation, J. Crystal Growth 180 660-<br />
669.<br />
Brien, D., M. Dauelsberg, K. Christiansen, J. Hofeldt, M.<br />
Deufel, and M. Heuken (2007) Modell<strong>in</strong>g and simulation<br />
of MOVPE of GaAs-based compound semiconductors <strong>in</strong><br />
production scale <strong>Planetary</strong> <strong>Reactor</strong>s, J. Crystal Growth<br />
303 330-333.<br />
Dauelsberg, M., L. Kad<strong>in</strong>ski, Yu. N. Makarov, T.<br />
Bergunde, G. Strauch, and M. Weyers (2000) Model<strong>in</strong>g<br />
and experimental verification of transport and deposition<br />
behavior dur<strong>in</strong>g MOVPE of Ga1−xInxP <strong>in</strong> the<br />
<strong>Planetary</strong> <strong>Reactor</strong>, J. Crystal Growth 208 85-92.<br />
Frijl<strong>in</strong>k, P. M. (1988) A new versatile, large size MOVPE<br />
reactor, J. Crystal Growth 93 207-215.<br />
Hsu, S. T. (1963) Eng<strong>in</strong>eer<strong>in</strong>g Heat Transfer, D. Van<br />
Nostrand Company, Inc.<br />
Jurgensen, H., D. Schmitz, G. Strauch, E. Woelk, M.<br />
Dauelsberg, L. Kad<strong>in</strong>ski, Yu. N. Makarov (1996)<br />
MOCVD equipment for recent developments towards<br />
the blue and green solid state laser MRS Internet J.<br />
Nitride Semicond. Res. 1, Article 26.<br />
Karpov, S. Yu. (2003) Advances <strong>in</strong> the model<strong>in</strong>g of<br />
MOVPE processes, J. Crystal Growth 248 1-7.<br />
Parikh, R. P. and R. A. Adomaitis (2006) An overview<br />
of gallium nitride growth chemistry and its effect on<br />
reactor design: Application to a planetary radial flow<br />
CVD system, J. Crystal Growth 286 259-278.<br />
Parikh, R. P., R. A. Adomaitis, J. D. Oliver, and B.<br />
H. Ponczak (2007) Implementation of a geometricallybased<br />
criterion for film uniformity control <strong>in</strong> a planetary<br />
SiC CVD reactor system, J. Process <strong>Control</strong> 17 477-488.