effect of sintering time and cooling rate on sinterhardenable materials
effect of sintering time and cooling rate on sinterhardenable materials
effect of sintering time and cooling rate on sinterhardenable materials

Create successful ePaper yourself
Turn your PDF publications into a flip-book with our unique Google optimized e-Paper software.
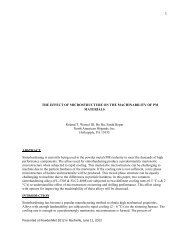
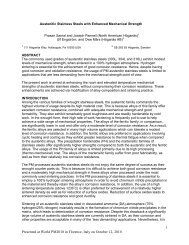
ABSTRACT<br />
EFFECT OF SINTERING TIME AND COOLING RATE<br />
ON SINTERHARDENABLE MATERIALS<br />
Ingalill Nyberg, Mary Schmidt <str<strong>on</strong>g>and</str<strong>on</strong>g> Peter Thorne, North American Höganäs Inc.<br />
Jas<strong>on</strong> Gabler, Thomas J. Jesberger <str<strong>on</strong>g>and</str<strong>on</strong>g> Stephen Feldbauer, ABBOTT Furnace Co.<br />
Sinter hardening is a cost-<str<strong>on</strong>g>effect</str<strong>on</strong>g>ive process that combines <str<strong>on</strong>g>sintering</str<strong>on</strong>g> <str<strong>on</strong>g>and</str<strong>on</strong>g> heat treatment in <strong>on</strong>e step. It is<br />
known that the <str<strong>on</strong>g>cooling</str<strong>on</strong>g> <str<strong>on</strong>g>rate</str<strong>on</strong>g> following <str<strong>on</strong>g>sintering</str<strong>on</strong>g> greatly affects material microstructures, which determine<br />
the final properties <str<strong>on</strong>g>of</str<strong>on</strong>g> sinter-hardened <strong>materials</strong>.<br />
This study investigated the properties <str<strong>on</strong>g>of</str<strong>on</strong>g> three sinter-hardenable <strong>materials</strong> (Cr/Mo pre-alloy, Cu/Mo<br />
diffusi<strong>on</strong> b<strong>on</strong>ded <str<strong>on</strong>g>and</str<strong>on</strong>g> Ni/Mo pre-alloy) at three <str<strong>on</strong>g>sintering</str<strong>on</strong>g> <str<strong>on</strong>g>time</str<strong>on</strong>g>s <str<strong>on</strong>g>and</str<strong>on</strong>g> three <str<strong>on</strong>g>cooling</str<strong>on</strong>g> <str<strong>on</strong>g>rate</str<strong>on</strong>g>s. The objective was<br />
to underst<str<strong>on</strong>g>and</str<strong>on</strong>g> how these <str<strong>on</strong>g>sintering</str<strong>on</strong>g> c<strong>on</strong>diti<strong>on</strong>s influence the development <str<strong>on</strong>g>of</str<strong>on</strong>g> martensite in the<br />
microstructure <str<strong>on</strong>g>and</str<strong>on</strong>g> thereby c<strong>on</strong>trol the hardness <str<strong>on</strong>g>and</str<strong>on</strong>g> mechanical properties <str<strong>on</strong>g>of</str<strong>on</strong>g> <strong>materials</strong>. This was<br />
accomplished through examining the percentage <str<strong>on</strong>g>of</str<strong>on</strong>g> martensite <str<strong>on</strong>g>and</str<strong>on</strong>g> microstructural homogeneity.<br />
INTRODUCTION<br />
Sinter hardening combines <str<strong>on</strong>g>sintering</str<strong>on</strong>g> <str<strong>on</strong>g>and</str<strong>on</strong>g> heat treatment in a single step to c<strong>on</strong>fer high strength <str<strong>on</strong>g>and</str<strong>on</strong>g> wear<br />
resistance while minimizing the number <str<strong>on</strong>g>of</str<strong>on</strong>g> processing steps. The microstructure <str<strong>on</strong>g>of</str<strong>on</strong>g> sinter hardened steels<br />
is primarily martensitic. Both <str<strong>on</strong>g>sintering</str<strong>on</strong>g> <str<strong>on</strong>g>time</str<strong>on</strong>g> <str<strong>on</strong>g>and</str<strong>on</strong>g> <str<strong>on</strong>g>cooling</str<strong>on</strong>g> <str<strong>on</strong>g>rate</str<strong>on</strong>g> affect the material’s microstructure. To<br />
better underst<str<strong>on</strong>g>and</str<strong>on</strong>g> how <str<strong>on</strong>g>sintering</str<strong>on</strong>g> c<strong>on</strong>diti<strong>on</strong>s affect material microstructure <str<strong>on</strong>g>and</str<strong>on</strong>g> hence mechanical<br />
properties, the percentage <str<strong>on</strong>g>of</str<strong>on</strong>g> martensite <str<strong>on</strong>g>and</str<strong>on</strong>g> the microstructural homogeneity were evaluated for three<br />
sinter hardenable <strong>materials</strong> at each <str<strong>on</strong>g>of</str<strong>on</strong>g> three different <str<strong>on</strong>g>sintering</str<strong>on</strong>g> <str<strong>on</strong>g>time</str<strong>on</strong>g>s <str<strong>on</strong>g>and</str<strong>on</strong>g> three different <str<strong>on</strong>g>cooling</str<strong>on</strong>g> <str<strong>on</strong>g>rate</str<strong>on</strong>g>s.<br />
Changing the type <str<strong>on</strong>g>and</str<strong>on</strong>g> amount <str<strong>on</strong>g>of</str<strong>on</strong>g> alloying elements, the <str<strong>on</strong>g>time</str<strong>on</strong>g> at <str<strong>on</strong>g>sintering</str<strong>on</strong>g> temperature <str<strong>on</strong>g>and</str<strong>on</strong>g> the post<str<strong>on</strong>g>sintering</str<strong>on</strong>g><br />
<str<strong>on</strong>g>cooling</str<strong>on</strong>g> <str<strong>on</strong>g>rate</str<strong>on</strong>g>, will affect the amount <str<strong>on</strong>g>of</str<strong>on</strong>g> martensite <str<strong>on</strong>g>and</str<strong>on</strong>g> bainite in the microstructure.<br />
EXPERIMENTAL PROCEDURE<br />
Materials<br />
Three sinter hardenable <strong>materials</strong> were analyzed for this investigati<strong>on</strong>. Astaloy CrL <str<strong>on</strong>g>and</str<strong>on</strong>g> Astaloy A are<br />
pre-alloyed <strong>materials</strong> while D. DH is a diffusi<strong>on</strong>-alloyed material. D. DH is based <strong>on</strong> a fully pre-alloyed<br />
powder with 1.5% Mo to which 2%Cu has been diffusi<strong>on</strong> alloyed. The chemical compositi<strong>on</strong> <str<strong>on</strong>g>of</str<strong>on</strong>g> the base<br />
1
powders used is reported in Table I. The chemical compositi<strong>on</strong>s <str<strong>on</strong>g>of</str<strong>on</strong>g> the studied mixes are reported in Table<br />
II.<br />
Table I. Chemical compositi<strong>on</strong> <str<strong>on</strong>g>of</str<strong>on</strong>g> the investigated base powders.<br />
Grade Ni* Mo Cr Cu Mn<br />
(%) (%) (%) (%) (%)<br />
Astaloy CrL - 0.2 1.5 - -<br />
D. DH - 1.5 - 2.0 -<br />
Astaloy A<br />
*Pre-alloyed<br />
1.9 0.55 - - 0.2<br />
Table II. Chemical compositi<strong>on</strong> <str<strong>on</strong>g>of</str<strong>on</strong>g> investigated mixes.<br />
Mix MPIF Designati<strong>on</strong> Grade Cu Graphite Lubricant Total metallic<br />
alloying<br />
elements<br />
(wt %) (wt%) (wt%) (%)<br />
1 - Astaloy CrL 1 0.75 0.60 2.7<br />
2 FLC-4908 D. DH - 0.75 0.60 3.5<br />
3 FL-4608 + 2%Cu Astaloy A 2 0.85 0.60 4.65<br />
Graphite Asbury 1651 (C 96 – 97% C) <str<strong>on</strong>g>and</str<strong>on</strong>g> Acu Powder copper -165 mesh were admixed with the base<br />
powder. Kenolube was used as lubricant.<br />
Each mix was pressed to green density 7.0g/cm³ in a manual TONI laboratory press. The test bars used<br />
were transverse rupture strength test bars (MPIF-41), tensile strength test bars (MPIF-10) <str<strong>on</strong>g>and</str<strong>on</strong>g> impact<br />
energy test bars (MPIF-40). The compacti<strong>on</strong> pressures required to reach 7.0g/cm³ are reported in table III.<br />
It is important to note that the compacti<strong>on</strong> pressure required to reach the desired density varied<br />
c<strong>on</strong>siderably with the base material selected.<br />
Table III: Compacti<strong>on</strong> pressure required to reach 7.0g/cm³.<br />
Mix tsi MPa<br />
1 44.7 617<br />
2 41.1 567<br />
3 46.5 641<br />
The reas<strong>on</strong> for the lower compressibility <str<strong>on</strong>g>of</str<strong>on</strong>g> mix 3 based <strong>on</strong> Astaloy A is the higher amount <str<strong>on</strong>g>of</str<strong>on</strong>g> pre-alloyed<br />
metallic elements, 4.65% in total. Mix 2 has a good compressibility since it is based <strong>on</strong> a powder where<br />
the molybdenum is pre-alloyed <str<strong>on</strong>g>and</str<strong>on</strong>g> the copper is diffusi<strong>on</strong> alloyed to the powder, 3.5% <str<strong>on</strong>g>of</str<strong>on</strong>g> metallic<br />
alloying elements in total. Mix 1, which is also a fully pre-alloyed powder, has a rather good<br />
compressibility due to the low level <str<strong>on</strong>g>of</str<strong>on</strong>g> metallic alloying elements, <strong>on</strong>ly 2.7% in total.<br />
Processing c<strong>on</strong>diti<strong>on</strong>s<br />
Each material was sintered at 2050°F (1121°C) in a 90% N2 / 10% H2 atmosphere without carb<strong>on</strong> c<strong>on</strong>trol.<br />
Sintering <str<strong>on</strong>g>time</str<strong>on</strong>g> <str<strong>on</strong>g>and</str<strong>on</strong>g> <str<strong>on</strong>g>cooling</str<strong>on</strong>g> <str<strong>on</strong>g>rate</str<strong>on</strong>g> were varied. Sintering <str<strong>on</strong>g>time</str<strong>on</strong>g>s were 10, 25 <str<strong>on</strong>g>and</str<strong>on</strong>g> 40 minutes. The <str<strong>on</strong>g>sintering</str<strong>on</strong>g><br />
was carried out in a laboratory furnace from ABOTT equipped with VARICOOL c<strong>on</strong>vecti<strong>on</strong> <str<strong>on</strong>g>cooling</str<strong>on</strong>g><br />
system to vary the <str<strong>on</strong>g>cooling</str<strong>on</strong>g> <str<strong>on</strong>g>rate</str<strong>on</strong>g>s <str<strong>on</strong>g>of</str<strong>on</strong>g> fan speeds from 5, 10 to 15 Hz. Temperature pr<str<strong>on</strong>g>of</str<strong>on</strong>g>iles were obtained<br />
for each c<strong>on</strong>diti<strong>on</strong> in order to verify the <str<strong>on</strong>g>sintering</str<strong>on</strong>g> <str<strong>on</strong>g>time</str<strong>on</strong>g>s <str<strong>on</strong>g>and</str<strong>on</strong>g> <str<strong>on</strong>g>cooling</str<strong>on</strong>g> <str<strong>on</strong>g>rate</str<strong>on</strong>g>s.<br />
After <str<strong>on</strong>g>sintering</str<strong>on</strong>g>, all <strong>materials</strong> were tempered for 60 minutes in air at 400°F (204°C) in order to stress<br />
relieve the martensite.<br />
2
Testing<br />
After the final tempering operati<strong>on</strong>, density, dimensi<strong>on</strong>al change, tensile <str<strong>on</strong>g>and</str<strong>on</strong>g> yield strength, el<strong>on</strong>gati<strong>on</strong>,<br />
transverse rupture strength, impact energy, hardness, <str<strong>on</strong>g>and</str<strong>on</strong>g> microstructure were evaluated for all bars<br />
cooled at 5 <str<strong>on</strong>g>and</str<strong>on</strong>g> 10Hz. The bars cooled at 15 Hz were <strong>on</strong>ly evaluated for hardness <str<strong>on</strong>g>and</str<strong>on</strong>g> metallography. The<br />
sintered carb<strong>on</strong> level was determined for all <strong>materials</strong>. Oxygen <str<strong>on</strong>g>and</str<strong>on</strong>g> nitrogen were also determined for<br />
material 1.<br />
Metallography<br />
Impact energy bars were prepared for metallographic analysis. Photomicrographs were taken <str<strong>on</strong>g>of</str<strong>on</strong>g> the<br />
structures after etching in a 50/50 mix <str<strong>on</strong>g>of</str<strong>on</strong>g> 1%Nital <str<strong>on</strong>g>and</str<strong>on</strong>g> Picral for mixes 1 <str<strong>on</strong>g>and</str<strong>on</strong>g> 2 <str<strong>on</strong>g>and</str<strong>on</strong>g> in 1%Nital for mix 3.<br />
The amount <str<strong>on</strong>g>of</str<strong>on</strong>g> martensite <str<strong>on</strong>g>and</str<strong>on</strong>g> bainite was determined by line analysis.<br />
RESULTS AND DISCUSSION<br />
Density <str<strong>on</strong>g>and</str<strong>on</strong>g> dimensi<strong>on</strong>al change<br />
Compacti<strong>on</strong> pressure <str<strong>on</strong>g>and</str<strong>on</strong>g> sintered densities after 10, 25 <str<strong>on</strong>g>and</str<strong>on</strong>g> 40 minutes <str<strong>on</strong>g>sintering</str<strong>on</strong>g> are reported in table IV.<br />
Table IV. Compacti<strong>on</strong> pressure <str<strong>on</strong>g>and</str<strong>on</strong>g> sintered density obtained after 10, 25 <str<strong>on</strong>g>and</str<strong>on</strong>g> 40 minutes <str<strong>on</strong>g>sintering</str<strong>on</strong>g>.<br />
Mix Pressure to reach<br />
7.0g/cm³<br />
tsi (MPa)<br />
10 min. <str<strong>on</strong>g>sintering</str<strong>on</strong>g><br />
(g/cm³)<br />
3<br />
25 min. <str<strong>on</strong>g>sintering</str<strong>on</strong>g><br />
(g/cm³)<br />
40 min. <str<strong>on</strong>g>sintering</str<strong>on</strong>g><br />
(g/cm³)<br />
1 44.7 (617) 6.97 6.97 6.98<br />
2 41.1 (567) 6.98 6.99 6.99<br />
3 46.5 (641) 6.95 6.95 6.96<br />
Dimensi<strong>on</strong>al change measured from die size to tempered TRS-bar is reported in figure 1.<br />
(%)<br />
0,450<br />
0,400<br />
0,350<br />
0,300<br />
0,250<br />
0,200<br />
0,150<br />
0,100<br />
0,050<br />
0,000<br />
DC after <str<strong>on</strong>g>sintering</str<strong>on</strong>g> at 10, 25 <str<strong>on</strong>g>and</str<strong>on</strong>g> 40 minutes<br />
SD 6.97 - 6.98g/cm³ SD 6.98 - 6.99g/cm³ SD 6.95 - 6.96g/cm³<br />
10 25 40 10 25 40 10 25 40<br />
Mix 1 Mix 2<br />
Mix 3<br />
Figure 1. Dimensi<strong>on</strong>al change (die to tempered) at different <str<strong>on</strong>g>sintering</str<strong>on</strong>g> <str<strong>on</strong>g>time</str<strong>on</strong>g>s <str<strong>on</strong>g>and</str<strong>on</strong>g> <str<strong>on</strong>g>cooling</str<strong>on</strong>g> <str<strong>on</strong>g>rate</str<strong>on</strong>g>s.<br />
The data in Figure 1 show that the dimensi<strong>on</strong>al change decreases slightly when the <str<strong>on</strong>g>sintering</str<strong>on</strong>g> <str<strong>on</strong>g>time</str<strong>on</strong>g> is<br />
increased <str<strong>on</strong>g>and</str<strong>on</strong>g> the <str<strong>on</strong>g>cooling</str<strong>on</strong>g> <str<strong>on</strong>g>rate</str<strong>on</strong>g> is kept c<strong>on</strong>stant, this is especially pr<strong>on</strong>ounced for mix 1. The differences in<br />
5 Hz<br />
10<br />
Hz
microstructure <str<strong>on</strong>g>and</str<strong>on</strong>g> dimensi<strong>on</strong>al change are not significant enough to be reflected in measured sintered<br />
density.<br />
Another observati<strong>on</strong> is that mix 1, with the lowest amount <str<strong>on</strong>g>of</str<strong>on</strong>g> copper, shows the least swelling. Thereafter<br />
come mixes 2 <str<strong>on</strong>g>and</str<strong>on</strong>g> 3, which both c<strong>on</strong>tain 2% copper, however mix 3 has a higher total amount <str<strong>on</strong>g>of</str<strong>on</strong>g> alloying<br />
elements. The higher level <str<strong>on</strong>g>of</str<strong>on</strong>g> swelling for mix 3 also explains the lower sintered density <str<strong>on</strong>g>of</str<strong>on</strong>g> that material.<br />
Mix 2 shows a rather high density even though it showed more growth during <str<strong>on</strong>g>sintering</str<strong>on</strong>g> compared to mix<br />
1. Part <str<strong>on</strong>g>of</str<strong>on</strong>g> the explanati<strong>on</strong> for this can be found in the microstructure. Mix 2 had more bainite than mix 1<br />
in the microstructure, <str<strong>on</strong>g>and</str<strong>on</strong>g> bainite has higher density than martensite. All <str<strong>on</strong>g>of</str<strong>on</strong>g> the tested mixes grow during<br />
<str<strong>on</strong>g>sintering</str<strong>on</strong>g> since they are alloyed with copper, which promotes growth.<br />
Hardness <str<strong>on</strong>g>and</str<strong>on</strong>g> Mechanical properties<br />
Hardness measured after <str<strong>on</strong>g>sintering</str<strong>on</strong>g> for 10, 25 <str<strong>on</strong>g>and</str<strong>on</strong>g> 40 minutes <str<strong>on</strong>g>and</str<strong>on</strong>g> <str<strong>on</strong>g>cooling</str<strong>on</strong>g> at 5, 10 <str<strong>on</strong>g>and</str<strong>on</strong>g> 15 Hz is reported in<br />
Figure 2. Hardness was measured as Rockwell C. Mix 1 showed a very good resp<strong>on</strong>se to increased<br />
<str<strong>on</strong>g>cooling</str<strong>on</strong>g> <str<strong>on</strong>g>rate</str<strong>on</strong>g> both at 10 <str<strong>on</strong>g>and</str<strong>on</strong>g> 25 minutes <str<strong>on</strong>g>sintering</str<strong>on</strong>g> <str<strong>on</strong>g>time</str<strong>on</strong>g>. Hardness above 30 HRC was achieved for all<br />
<str<strong>on</strong>g>sintering</str<strong>on</strong>g> <str<strong>on</strong>g>time</str<strong>on</strong>g>s when <str<strong>on</strong>g>cooling</str<strong>on</strong>g> at 10 <str<strong>on</strong>g>and</str<strong>on</strong>g> 15 Hz. The reas<strong>on</strong> for the slight drop in hardness when <str<strong>on</strong>g>sintering</str<strong>on</strong>g><br />
for 40 minutes is probably due to the higher degree <str<strong>on</strong>g>of</str<strong>on</strong>g> decarburizati<strong>on</strong> after 40 minutes compared to 25<br />
minutes <str<strong>on</strong>g>sintering</str<strong>on</strong>g> <str<strong>on</strong>g>time</str<strong>on</strong>g>. In order to reach hardness values above 30HRC with mix 2, either 15Hz <str<strong>on</strong>g>cooling</str<strong>on</strong>g><br />
<str<strong>on</strong>g>rate</str<strong>on</strong>g> or 40 minutes <str<strong>on</strong>g>sintering</str<strong>on</strong>g> <str<strong>on</strong>g>time</str<strong>on</strong>g> is needed. Mix 3, with the highest amount <str<strong>on</strong>g>of</str<strong>on</strong>g> metallic alloying elements,<br />
shows good hardness values; however the increase due to increased <str<strong>on</strong>g>cooling</str<strong>on</strong>g> <str<strong>on</strong>g>rate</str<strong>on</strong>g> is not as pr<strong>on</strong>ounced as<br />
for mixes 1 <str<strong>on</strong>g>and</str<strong>on</strong>g> 2. Bars sintered for 40 minutes showed an increased surface decarburizati<strong>on</strong> due to the<br />
lack <str<strong>on</strong>g>of</str<strong>on</strong>g> carb<strong>on</strong> c<strong>on</strong>trol <str<strong>on</strong>g>of</str<strong>on</strong>g> the <str<strong>on</strong>g>sintering</str<strong>on</strong>g> atmosphere.<br />
HRC<br />
40<br />
35<br />
30<br />
25<br />
20<br />
15<br />
HRC after <str<strong>on</strong>g>sintering</str<strong>on</strong>g> at 10, 25 <str<strong>on</strong>g>and</str<strong>on</strong>g> 40 minutes<br />
10 25 40 10 25 40 10 25 40<br />
Mix 1 Mix 2 Mix 3<br />
Figure 2. Hardness HRC at different <str<strong>on</strong>g>cooling</str<strong>on</strong>g> <str<strong>on</strong>g>rate</str<strong>on</strong>g>s <str<strong>on</strong>g>and</str<strong>on</strong>g> <str<strong>on</strong>g>sintering</str<strong>on</strong>g> <str<strong>on</strong>g>time</str<strong>on</strong>g>s.<br />
4<br />
5 Hz<br />
10 Hz<br />
15 Hz
Mix 1 shows very good results for the 0.2% <str<strong>on</strong>g>of</str<strong>on</strong>g>fset yield strength even at l<strong>on</strong>ger <str<strong>on</strong>g>sintering</str<strong>on</strong>g> <str<strong>on</strong>g>time</str<strong>on</strong>g>s, whereas<br />
the yield <str<strong>on</strong>g>of</str<strong>on</strong>g> mixes 2 <str<strong>on</strong>g>and</str<strong>on</strong>g> 3 dropped at l<strong>on</strong>ger <str<strong>on</strong>g>sintering</str<strong>on</strong>g> <str<strong>on</strong>g>time</str<strong>on</strong>g>s. The good yield strength in combinati<strong>on</strong> with<br />
the good hardness makes mix 1 an interesting material for sinter hardening.<br />
(ksi)<br />
130<br />
120<br />
110<br />
100<br />
90<br />
80<br />
70<br />
YS after <str<strong>on</strong>g>sintering</str<strong>on</strong>g> at 10, 25 <str<strong>on</strong>g>and</str<strong>on</strong>g> 40 minutes<br />
10 25 40 10 25 40 10 25 40<br />
Mix 1 Mix 2 Mix 3<br />
Figure 3. Yield strength at different <str<strong>on</strong>g>cooling</str<strong>on</strong>g> <str<strong>on</strong>g>rate</str<strong>on</strong>g>s <str<strong>on</strong>g>and</str<strong>on</strong>g> <str<strong>on</strong>g>sintering</str<strong>on</strong>g> <str<strong>on</strong>g>time</str<strong>on</strong>g>s.<br />
(ksi)<br />
150<br />
140<br />
130<br />
120<br />
110<br />
100<br />
TS after <str<strong>on</strong>g>sintering</str<strong>on</strong>g> at 10, 25 <str<strong>on</strong>g>and</str<strong>on</strong>g> 40 minutes<br />
10 25 40 10 25 40 10 25 40<br />
Mix 1 Mix 2 Mix 3<br />
Figure 4. Tensile strength at different <str<strong>on</strong>g>sintering</str<strong>on</strong>g> <str<strong>on</strong>g>time</str<strong>on</strong>g>s <str<strong>on</strong>g>and</str<strong>on</strong>g> <str<strong>on</strong>g>cooling</str<strong>on</strong>g> <str<strong>on</strong>g>rate</str<strong>on</strong>g>s.<br />
5<br />
5 Hz<br />
10 Hz<br />
5 Hz<br />
10 Hz<br />
In figure 4, where the ultimate tensile strength is shown, it can be seen that for <str<strong>on</strong>g>sintering</str<strong>on</strong>g> <str<strong>on</strong>g>time</str<strong>on</strong>g>s 10 <str<strong>on</strong>g>and</str<strong>on</strong>g> 25<br />
minutes an increased <str<strong>on</strong>g>cooling</str<strong>on</strong>g> <str<strong>on</strong>g>rate</str<strong>on</strong>g> results in higher strength. However, at 40 minutes <str<strong>on</strong>g>sintering</str<strong>on</strong>g> <str<strong>on</strong>g>time</str<strong>on</strong>g> the<br />
strength decreases or remains almost equal at the higher <str<strong>on</strong>g>cooling</str<strong>on</strong>g> <str<strong>on</strong>g>rate</str<strong>on</strong>g> for mixes 1 <str<strong>on</strong>g>and</str<strong>on</strong>g> 3. Two probable<br />
reas<strong>on</strong>s for this behavior are that the copper has had l<strong>on</strong>ger <str<strong>on</strong>g>time</str<strong>on</strong>g> to diffuse <str<strong>on</strong>g>and</str<strong>on</strong>g> the copper c<strong>on</strong>centrati<strong>on</strong><br />
has evened out <str<strong>on</strong>g>and</str<strong>on</strong>g>, as a result, the strengthening <str<strong>on</strong>g>effect</str<strong>on</strong>g> <str<strong>on</strong>g>of</str<strong>on</strong>g> locally higher copper c<strong>on</strong>centrati<strong>on</strong> has<br />
decreased. The sec<strong>on</strong>d possible reas<strong>on</strong> is that the l<strong>on</strong>g <str<strong>on</strong>g>sintering</str<strong>on</strong>g> <str<strong>on</strong>g>time</str<strong>on</strong>g> has enabled a grain growth <str<strong>on</strong>g>of</str<strong>on</strong>g> the<br />
austenitic grains, which during the rapid <str<strong>on</strong>g>cooling</str<strong>on</strong>g> results in a coarser <str<strong>on</strong>g>and</str<strong>on</strong>g> more brittle martensite. Mix 2<br />
shows the highest results for tensile strength for both 25 <str<strong>on</strong>g>and</str<strong>on</strong>g> 40 minutes <str<strong>on</strong>g>sintering</str<strong>on</strong>g> <str<strong>on</strong>g>time</str<strong>on</strong>g> when cooled at<br />
10Hz.
Table V: Mechanical properties after different <str<strong>on</strong>g>sintering</str<strong>on</strong>g> c<strong>on</strong>diti<strong>on</strong>s.<br />
Mix Cooling Sintering C TS YS A IE TRS<br />
<str<strong>on</strong>g>rate</str<strong>on</strong>g> <str<strong>on</strong>g>time</str<strong>on</strong>g> as-sint<br />
Hz minutes Wt% ksi (MPa) ksi (MPa) % Ft-lb (J) ksi (MPa)<br />
1 5 10 0.63 118 (811) 94 (646) 0.6 10 (14) 206 (1419)<br />
1 5 25 0.66 129 (887) 114 (789) 0.4 11 (15) 224 (1545)<br />
1 5 40 0.64 139 (961) 121 (832) 0.5 14 (19) 220 (1514)<br />
1 10 10 0.63 124 (855) 118 (815) 0.3 11 (15) 211 (1457)<br />
1 10 25 0.65 133 (918) 119 (817) 0.4 12 (16) 216 (1488)<br />
1 10 40 0.64 138 (951) 119 (819) 0.4 15 (20) 220 (1514)<br />
2 5 10 0.61 124 (854) 91 (625) 0.9 14 (19) 201 (1386)<br />
2 5 25 0.66 133 (919) 99 (682) 0.9 15 (20) 229 (1576)<br />
2 5 40 0.66 141 (975) 97 (670) 1.0 16 (21) 227 (1562)<br />
2 10 10 0.65 131 (901) 103 (707) 0.8 14 (19) 243 (1672)<br />
2 10 25 0.65 147 (1015) 95 (652) 0.8 16 (21) 244 (1673)<br />
2 10 40 0.67 147 (1016) 93 (639) 0.9 16 (21) 246 (1700)<br />
3 5 10 0.71 128 (880) 99 (682) 0.6 15 (20) 218 (1505)<br />
3 5 25 0.71 136 (940) 90 (621) 0.8 17 (23) 233 (1609)<br />
3 5 40 0.69 145 (1003) 84 (580) 0.8 15 (20) 234 (1616)<br />
3 10 10 0.70 135 (933) 105 (723) 0.6 14 (19) 228 (1572)<br />
3 10 25 0.70 142 (979) 88 (610) 0.8 15 (20) 239 (1645)<br />
3 10 40 0.69 136 (940) 89 (614) 0.7 16 (22) 240 (1654)<br />
In table V, where mechanical data are shown it can be seen that there is no significant difference in<br />
impact energy between 5 <str<strong>on</strong>g>and</str<strong>on</strong>g> 10Hz <str<strong>on</strong>g>cooling</str<strong>on</strong>g> <str<strong>on</strong>g>rate</str<strong>on</strong>g>.<br />
Regarding transverse rupture strength cooled at 10 Hz, it can be noted that mix 2 based <strong>on</strong> the diffusi<strong>on</strong>alloyed<br />
powder showed the highest values even though mix 3 has a c<strong>on</strong>siderably higher level <str<strong>on</strong>g>of</str<strong>on</strong>g> metallic<br />
alloying elements. This can be explained by the microstructure, which will be discussed later in this<br />
paper.<br />
Metallography<br />
A general comment regarding the 10 minutes <str<strong>on</strong>g>sintering</str<strong>on</strong>g> is that the <str<strong>on</strong>g>sintering</str<strong>on</strong>g> necks were not as well<br />
developed as for 25 <str<strong>on</strong>g>and</str<strong>on</strong>g> 40 minutes <str<strong>on</strong>g>sintering</str<strong>on</strong>g> <str<strong>on</strong>g>time</str<strong>on</strong>g>. Figures 5a-c show the difference in <str<strong>on</strong>g>sintering</str<strong>on</strong>g> necks<br />
between 10, 25 <str<strong>on</strong>g>and</str<strong>on</strong>g> 40 minutes <str<strong>on</strong>g>sintering</str<strong>on</strong>g> <str<strong>on</strong>g>time</str<strong>on</strong>g>.<br />
Figure 5a: Mix 1, 10 min at 10 Hz Figure 5b: Mix 1, 25 min at 10Hz Figure 5c: Mix 1, 40 min at 10Hz<br />
6
Tables VI - VIII show the phase analysis for the microstructures <str<strong>on</strong>g>of</str<strong>on</strong>g> <strong>materials</strong> 1, 2 <str<strong>on</strong>g>and</str<strong>on</strong>g> 3.<br />
Table VI: Phase analysis for material 1.<br />
Sintering <str<strong>on</strong>g>time</str<strong>on</strong>g> Cooling <str<strong>on</strong>g>rate</str<strong>on</strong>g> C as-sint M B<br />
(minutes) (Hz) (%) (%) (%)<br />
10 5 0.63 35 Bal.<br />
10 10 0.63 65 Bal.<br />
10 15 0.66 90 Bal.<br />
25 5 0.66 45 Bal.<br />
25 10 0.65 75 Bal.<br />
25 15 0.65 90 Bal.<br />
40 5 0.64 60 Bal.<br />
40 10 0.64 80 Bal.<br />
40 15 0.63 90 Bal.<br />
The copper c<strong>on</strong>tent was high in the grain boundaries <str<strong>on</strong>g>of</str<strong>on</strong>g> the bars sintered for 10 minutes. The reas<strong>on</strong> for<br />
the increased amount <str<strong>on</strong>g>of</str<strong>on</strong>g> martensite with increased <str<strong>on</strong>g>sintering</str<strong>on</strong>g> <str<strong>on</strong>g>time</str<strong>on</strong>g> is due to the l<strong>on</strong>ger diffusi<strong>on</strong> <str<strong>on</strong>g>time</str<strong>on</strong>g>.<br />
Figure 6a: Mix 1, 10 min at 15Hz Figure 6b: Mix 1, 25 min at 10Hz Figure 6c: Mix 1, 25 min at 15Hz<br />
Figure 6a shows the microstructure <str<strong>on</strong>g>of</str<strong>on</strong>g> mix 1 sintered for 10 minutes <str<strong>on</strong>g>and</str<strong>on</strong>g> cooled at 10Hz. The structure<br />
c<strong>on</strong>tains 90% martensite <str<strong>on</strong>g>and</str<strong>on</strong>g> the hardness was 36HRC. The darker border around the larger pores <str<strong>on</strong>g>and</str<strong>on</strong>g> in<br />
the grain boundaries indicates that the copper c<strong>on</strong>centrati<strong>on</strong> is high there due to the short <str<strong>on</strong>g>sintering</str<strong>on</strong>g> <str<strong>on</strong>g>time</str<strong>on</strong>g>.<br />
Figure 6b shows the microstructure <str<strong>on</strong>g>of</str<strong>on</strong>g> mix 1 sintered for 25 minutes <str<strong>on</strong>g>and</str<strong>on</strong>g> cooled at 10 Hz, which resulted<br />
in 75% martensite <str<strong>on</strong>g>and</str<strong>on</strong>g> hardness 35HRC. Figure 6c shows the same mix also sintered for 25 minutes but<br />
cooled at 15Hz. Here the microstructure was 90% martensite <str<strong>on</strong>g>and</str<strong>on</strong>g> the hardness had increased slightly to<br />
37HRC.<br />
7
Table VII: Phase analysis for material 2.<br />
Sintering <str<strong>on</strong>g>time</str<strong>on</strong>g> Cooling <str<strong>on</strong>g>rate</str<strong>on</strong>g> C as-sint M B<br />
(minutes) (Hz) (%) (%) (%)<br />
10 5 0.61 35 Bal.<br />
10 10 0.65 35 *Bal.<br />
10 15 0.68 60 Bal.<br />
25 5 0.66 35 Bal.<br />
25 10 0.65 60 Bal.<br />
25 15 0.67 75 Bal.<br />
40 5 0.66 45 Bal.<br />
40 10 0.67 65 Bal.<br />
40 15 0.67 80 Bal.<br />
*Finer bainite compared to 10 minutes <str<strong>on</strong>g>sintering</str<strong>on</strong>g> <str<strong>on</strong>g>time</str<strong>on</strong>g> cooled at 5 Hz.<br />
Figure 7a: Mix 2, 25 min at 15Hz Figure 7b: Mix 2, 40 min at 10Hz Figure 7c: Mix 2, 40 min at 15Hz<br />
Figure 7a shows mix 2 sintered for 25 minutes <str<strong>on</strong>g>and</str<strong>on</strong>g> cooled at 15Hz. The structure c<strong>on</strong>tains 75%<br />
martensite. The hardness was 36HRC. Figures 7b-c show the difference between 10 <str<strong>on</strong>g>and</str<strong>on</strong>g> 15 Hz <str<strong>on</strong>g>cooling</str<strong>on</strong>g><br />
<str<strong>on</strong>g>rate</str<strong>on</strong>g> when <str<strong>on</strong>g>sintering</str<strong>on</strong>g> for 40 minutes. After 10Hz <str<strong>on</strong>g>cooling</str<strong>on</strong>g> <str<strong>on</strong>g>rate</str<strong>on</strong>g>, the obtained structure c<strong>on</strong>tained 65%<br />
martensite <str<strong>on</strong>g>and</str<strong>on</strong>g> the hardness was 34HRC. After 15Hz the martensite c<strong>on</strong>tent had increased to 80% but the<br />
hardness remained at 34 HRC. The reas<strong>on</strong> for this is the decarburizati<strong>on</strong> <str<strong>on</strong>g>of</str<strong>on</strong>g> the surface during the 40<br />
minute <str<strong>on</strong>g>sintering</str<strong>on</strong>g>.<br />
Table VIII: Phase analysis for material 3.<br />
Sintering <str<strong>on</strong>g>time</str<strong>on</strong>g> Cooling <str<strong>on</strong>g>rate</str<strong>on</strong>g> C as-sint M B<br />
(minutes) (Hz) (%) (%) (%)<br />
10 5 0.71 85 Bal.<br />
10 10 0.70 90 Bal.<br />
10 15 0.71 95 Bal.<br />
25 5 0.71 90 Bal.<br />
25 10 0.70 95 Bal.<br />
25 15 0.70 96 Bal.<br />
40 5 0.69 90 Bal.<br />
40 10 0.69 98 Bal.<br />
40 15 0.70 99 Bal.<br />
8
Figure 8a: Mix 3, 25 min at 10Hz Figure 8b: Mix 3, 25 min at 15Hz Figure 8c: Mix 3, 40 min at 15Hz<br />
Figures 8a-b show the microstructure <str<strong>on</strong>g>of</str<strong>on</strong>g> mix 3 sintered for 25 minutes <str<strong>on</strong>g>and</str<strong>on</strong>g> cooled at 10 or 15Hz<br />
respectively. In figure 8a the structure c<strong>on</strong>tains 95% martensite <str<strong>on</strong>g>and</str<strong>on</strong>g> the hardness was 35HRC. In figure 8b<br />
the structure c<strong>on</strong>tains 96% martensite <str<strong>on</strong>g>and</str<strong>on</strong>g> the measured hardness was 38HRC. Figure 8c shows a<br />
structure with 98% martensite <str<strong>on</strong>g>and</str<strong>on</strong>g> hardness <str<strong>on</strong>g>of</str<strong>on</strong>g> almost 40HRC, which was achieved after <str<strong>on</strong>g>sintering</str<strong>on</strong>g> for 40<br />
minutes <str<strong>on</strong>g>and</str<strong>on</strong>g> <str<strong>on</strong>g>cooling</str<strong>on</strong>g> at a <str<strong>on</strong>g>rate</str<strong>on</strong>g> <str<strong>on</strong>g>of</str<strong>on</strong>g> 15Hz.<br />
Cooling <str<strong>on</strong>g>rate</str<strong>on</strong>g>s<br />
An interesting questi<strong>on</strong> that arises is what <str<strong>on</strong>g>cooling</str<strong>on</strong>g> <str<strong>on</strong>g>rate</str<strong>on</strong>g> settings <str<strong>on</strong>g>of</str<strong>on</strong>g> 5, 10 <str<strong>on</strong>g>and</str<strong>on</strong>g> 15 Hz corresp<strong>on</strong>d to in °F/sec<br />
(or °C/s). This questi<strong>on</strong> can be answered by comparing the actual phase amount analysis presented above<br />
in tables VI – VIII with available phase amount diagrams derived from CCT diagrams <str<strong>on</strong>g>and</str<strong>on</strong>g> analysis <str<strong>on</strong>g>of</str<strong>on</strong>g><br />
samples cooled at different <str<strong>on</strong>g>rate</str<strong>on</strong>g>s using a dilatometer. In figure 9 such a phase diagram for Astaloy A +<br />
2% Cu + 0.7% C is shown. At setting 5Hz <str<strong>on</strong>g>and</str<strong>on</strong>g> 25 minutes <str<strong>on</strong>g>sintering</str<strong>on</strong>g> <str<strong>on</strong>g>time</str<strong>on</strong>g> the microstructure c<strong>on</strong>tained<br />
90% martensite. By comparing that value to the diagram it can be c<strong>on</strong>cluded that the 5Hz setting<br />
corresp<strong>on</strong>ds to 1 - 1.5°C/s (1.8 - 2.7°F/s). At setting 10Hz, the amount <str<strong>on</strong>g>of</str<strong>on</strong>g> martensite was 95%, which<br />
indicates a <str<strong>on</strong>g>cooling</str<strong>on</strong>g> <str<strong>on</strong>g>rate</str<strong>on</strong>g> <str<strong>on</strong>g>of</str<strong>on</strong>g> 2 - 2.5°C/s (3.6 - 4.5°F/s). At the setting 15Hz the amount <str<strong>on</strong>g>of</str<strong>on</strong>g> martensite was<br />
96%, which indicates that the <str<strong>on</strong>g>cooling</str<strong>on</strong>g> <str<strong>on</strong>g>rate</str<strong>on</strong>g> was <strong>on</strong>ly somewhat faster than the setting 10Hz, ~3°C/s<br />
(5.4°F/s). However, as shown before in figure 2, there was an increase in hardness at setting 15Hz.<br />
Phases %<br />
100<br />
80<br />
60<br />
40<br />
20<br />
0<br />
Astaloy A + 2%Cu + 0.7%C<br />
Phase amount vs <str<strong>on</strong>g>cooling</str<strong>on</strong>g> <str<strong>on</strong>g>rate</str<strong>on</strong>g><br />
0,1 1 10 dT/dt (°C/s)<br />
B 5Hz 10Hz 15Hz<br />
M<br />
Figure 9. Effect <str<strong>on</strong>g>of</str<strong>on</strong>g> <str<strong>on</strong>g>cooling</str<strong>on</strong>g> <str<strong>on</strong>g>rate</str<strong>on</strong>g> <strong>on</strong> microstructure <str<strong>on</strong>g>of</str<strong>on</strong>g> Astaloy A + 2% Cu + 0.7% C.<br />
By studying figure 11, which shows the <str<strong>on</strong>g>cooling</str<strong>on</strong>g> <str<strong>on</strong>g>rate</str<strong>on</strong>g> for a 10 Hz <str<strong>on</strong>g>sintering</str<strong>on</strong>g>, it can be seen that the <str<strong>on</strong>g>cooling</str<strong>on</strong>g><br />
<str<strong>on</strong>g>rate</str<strong>on</strong>g> is different for different parts <str<strong>on</strong>g>of</str<strong>on</strong>g> the <str<strong>on</strong>g>cooling</str<strong>on</strong>g> cycle even though the fan speed was set to 10 Hz all the<br />
<str<strong>on</strong>g>time</str<strong>on</strong>g>. Comparing the <str<strong>on</strong>g>cooling</str<strong>on</strong>g> <str<strong>on</strong>g>rate</str<strong>on</strong>g> diagram in figure 11 to the CCT-diagram in figure 10, which shows the<br />
bainite noses <str<strong>on</strong>g>and</str<strong>on</strong>g> the start <str<strong>on</strong>g>of</str<strong>on</strong>g> martensite formati<strong>on</strong>. Bainite can be formed due to the lower <str<strong>on</strong>g>cooling</str<strong>on</strong>g> <str<strong>on</strong>g>rate</str<strong>on</strong>g><br />
between 300 – 200°C.<br />
9
10<br />
°C<br />
1200<br />
1000<br />
800<br />
600<br />
400<br />
200<br />
0<br />
Cooling at 10Hz<br />
45,00 47,00 49,00 51,00 53,00 55,00 57,00<br />
<str<strong>on</strong>g>time</str<strong>on</strong>g> (minutes)<br />
Figure 10. CCT-diagram for Astaloy A + 2%Cu + C Figure 11. Cooling <str<strong>on</strong>g>rate</str<strong>on</strong>g> at 10Hz setting.<br />
CONCLUSIONS<br />
• The hardness increase is primarily dependent <strong>on</strong> the microstructure, which is c<strong>on</strong>trolled<br />
by the <str<strong>on</strong>g>cooling</str<strong>on</strong>g> <str<strong>on</strong>g>rate</str<strong>on</strong>g>.<br />
• L<strong>on</strong>ger <str<strong>on</strong>g>sintering</str<strong>on</strong>g> <str<strong>on</strong>g>time</str<strong>on</strong>g> increases the hardenability.<br />
• Sintering <str<strong>on</strong>g>time</str<strong>on</strong>g> had the largest impact <strong>on</strong> strength. However, l<strong>on</strong>ger <str<strong>on</strong>g>sintering</str<strong>on</strong>g> <str<strong>on</strong>g>time</str<strong>on</strong>g> also<br />
resulted in increased surface decarburizati<strong>on</strong> <str<strong>on</strong>g>and</str<strong>on</strong>g> thereby lower hardness.<br />
• The <str<strong>on</strong>g>effect</str<strong>on</strong>g> <str<strong>on</strong>g>of</str<strong>on</strong>g> the process parameters is dependent <strong>on</strong> the material <str<strong>on</strong>g>and</str<strong>on</strong>g> alloying system.<br />
• Mix 1 (Astaloy CrL + 1% Cu + 0.75%C) with <strong>on</strong>ly 2.7% <str<strong>on</strong>g>of</str<strong>on</strong>g> metallic alloying elements<br />
showed hardness values equal to mix 3 (Astaloy A + 2% Cu + 0.85% C) with a total <str<strong>on</strong>g>of</str<strong>on</strong>g><br />
4.65% <str<strong>on</strong>g>of</str<strong>on</strong>g> metallic alloying elements. This proves the good hardenability <str<strong>on</strong>g>effect</str<strong>on</strong>g>s <str<strong>on</strong>g>of</str<strong>on</strong>g><br />
chromium. Usage <str<strong>on</strong>g>of</str<strong>on</strong>g> a mix with lower total alloying c<strong>on</strong>tent should be beneficial both<br />
regarding cost <str<strong>on</strong>g>and</str<strong>on</strong>g> envir<strong>on</strong>mentally.<br />
• Mix 1 (Astaloy CrL + 1% Cu + 0.75%C) with <strong>on</strong>ly 2.7% <str<strong>on</strong>g>of</str<strong>on</strong>g> metallic alloying elements<br />
showed the highest yield strength, which is an interesting combinati<strong>on</strong> with good<br />
hardenability.<br />
REFERENCES<br />
[1]Höganäs H<str<strong>on</strong>g>and</str<strong>on</strong>g>book for sintered comp<strong>on</strong>ents, 1999, Vol. 6<br />
[2] J. McLell<str<strong>on</strong>g>and</str<strong>on</strong>g>, O. Mårs, <str<strong>on</strong>g>and</str<strong>on</strong>g> T. Jesberger. “Sintering Furnace Cycle Influence <strong>on</strong> Sinter<br />
Hardened Part Parameters” Presented at PM 2 Tec 2001 in New Orleans <strong>on</strong> May 16, 2001.<br />
[3] U. Engström. Advances in Powder metallurgy & Particulate Materials, 2000, p 5-147 to 5-157