Annual Report 2010 - Höganäs AB
Annual Report 2010 - Höganäs AB
Annual Report 2010 - Höganäs AB
- TAGS
- annual
- www.hoganas.com

You also want an ePaper? Increase the reach of your titles
YUMPU automatically turns print PDFs into web optimized ePapers that Google loves.
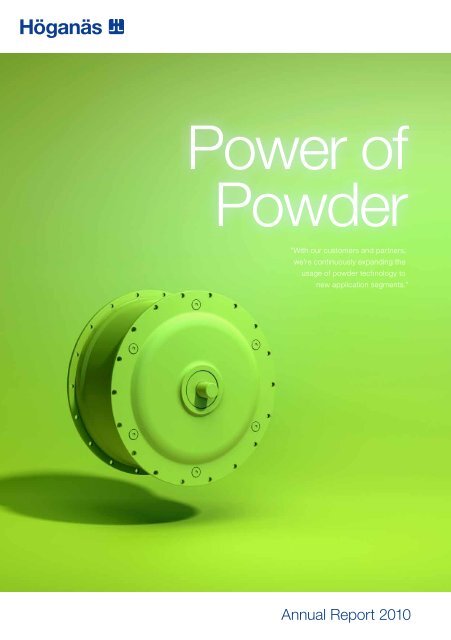
Power of<br />
Powder<br />
”With our customers and partners,<br />
we’re continuously expanding the<br />
usage of powder technology to<br />
new application segments.”<br />
<strong>Annual</strong> <strong>Report</strong> <strong>2010</strong>
T H E Y E A R I N B R I E F<br />
The year in brief<br />
• The best year ever in terms of sales volumes and<br />
earnings<br />
• High production rate end to end in the value chain<br />
• Improved margins thanks to cost focus and<br />
increased capacity utilisation<br />
• Strong cash flow despite metal price escalation<br />
and increased working capital tie-up<br />
• Launch of unique electric motor<br />
• Breakthrough for chrome material in connecting rods<br />
Group key ratios<br />
2008 2009 <strong>2010</strong><br />
Net sales, MSEK 6,103 4,571 6,671<br />
Operating margin, % 8.6 6.5 16.7<br />
Income before tax, MSEK 483 271 1,084<br />
Income after tax, MSEK 394 206 804<br />
Equity/assets ratio, % 42.6 51.8 57.2<br />
Return on capital employed, % 12.8 7.2 27.6<br />
Earnings per share, SEK 11.31 5.92 23.11<br />
Dividend, SEK 3.00 3.00 10.00<br />
Average number of employees 1,589 1,440 1,619<br />
The Power of Powder—from idea to reality<br />
BUSINESS<br />
INTELLIGENCE<br />
Turnover and sales volume<br />
UNDER STANDING<br />
NEEDS<br />
MSEK Tons<br />
7,500<br />
6,250<br />
5,000<br />
3,750<br />
2,500<br />
1,250<br />
0<br />
2006<br />
2007<br />
2008<br />
Turnover, MSEK Sales volume, tons<br />
2009<br />
<strong>2010</strong><br />
500,000<br />
375,000<br />
250,000<br />
125,000<br />
0<br />
APPLICATION IDEAS
<strong>Höganäs</strong> in 30 seconds<br />
O�ces/production Agents<br />
<strong>Höganäs</strong> is the world leader in metal<br />
powder, with in-depth application knowhow<br />
of utilising the unique qualities of<br />
powder to achieve cost benefits, superior<br />
performance and reduced environmental<br />
impact.<br />
We have achieved our status in the<br />
business by delivering products with<br />
high quality and consistency that satisfy<br />
customer-specific standards.<br />
We are continuously developing new<br />
application segments in partnership<br />
with customers and end-users. This<br />
enables us to ensure the continued positive<br />
growth of powder technology. We<br />
call the endless possibilities enabled by<br />
metal powder the "Power of Powder.”<br />
CUSTOMER<br />
COLL<strong>AB</strong>ORATIONS<br />
Sales by region<br />
2,493 MSEK<br />
2,006 MSEK<br />
Europe America Asia<br />
Division of consolidated turnover<br />
Components/Consumables<br />
24%<br />
Components Consumables<br />
2,172 MSEK<br />
76%<br />
CUSTOMER<br />
BENEFIT<br />
Contents<br />
H Ö G A N Ä S I N 3 0 S E C O N D S<br />
CEO’s statement 2<br />
Business intelligence 4<br />
Understanding needs 6<br />
Customer benefit 8<br />
Creating value 10<br />
Components business area 12<br />
Consumables business area 13<br />
Human resources 14<br />
Sustainable development 16<br />
Risk management 19<br />
The share 22<br />
Corporate governance 24<br />
Board of Directors 26<br />
Management 31<br />
Financial information 34<br />
Directors’ <strong>Report</strong> 35<br />
Appropriation of profits 39<br />
Accounts with<br />
comments and notes 40<br />
Audit <strong>Report</strong> 91<br />
Five-year summary, quarterly data<br />
and definitions 92<br />
Addresses 93<br />
Agents 93<br />
VALUE FOR<br />
HÖGANÄS<br />
H Ö G A N Ä S 2 0 1 0 1
C E O ’ S S TAT E M E N T<br />
An excellent year<br />
<strong>Höganäs</strong> achieved record levels of sales and earnings in <strong>2010</strong>. It was<br />
a year when we also benefited from market opportunities as product<br />
demand increased worldwide. This was the result of a continued recovery<br />
from the global financial crisis, and even more importantly, it is evidence<br />
that our new strategy is working. Our healthy earnings provide us with an<br />
opportunity to continue long-term product and organizational development<br />
to assure sustained long-term growth.<br />
2 H Ö G A N Ä S 2 0 1 0<br />
<strong>Höganäs</strong>’ strategy is to work the value<br />
chain. The more we find out about our<br />
customers and end-users, the better we<br />
get at developing products and services<br />
that they really need. Our global presence<br />
and application know-how mean<br />
that we can now partner our customers<br />
in creating a better future for the Powder<br />
Metal industry.<br />
Increased global demand<br />
The global financial crisis resulted in<br />
substantial shrinkage of metal powders<br />
in 2009. The recovery started in late-2009<br />
and continued through the first half-year<br />
<strong>2010</strong>. Demand then stabilised at a higher<br />
level in the second half, leading to record<br />
demand for <strong>Höganäs</strong>’ products.<br />
In 2008, just before the financial<br />
crisis broke out, <strong>Höganäs</strong> acquired<br />
Kobe Steel’s powder business in North<br />
America. Thanks to a demand increase<br />
in <strong>2010</strong>, it generated very positive<br />
volumes, further securing our status as<br />
number two on the North American<br />
market. Our other operations in North<br />
America, at Niagara Falls and Johnstown,<br />
encountered sharply increased<br />
demand.<br />
In South America, sales to the car<br />
industry remained brisk through the<br />
year. In the Consumables business area,<br />
sales rallied rapidly during the year.<br />
Demand also rose in Europe, but did not<br />
match the record levels of the first halfyear<br />
2008. One explanation was reduced<br />
car sales due to the cessation of scrapping<br />
premiums, in Germany for example.<br />
But the negative progress of car sales<br />
turned subsequently, thanks to increased<br />
exports to Asia.<br />
Asia, which became <strong>Höganäs</strong>’ biggest<br />
market in 2009, continued to perform<br />
strongly. Sales reached record levels,<br />
thanks primarily to a brisk upturn for<br />
the car industry. And this despite Japan<br />
not attaining the high levels of 2007.<br />
New applications<br />
We witnessed expanding customer<br />
ac tivities in new applications/segments.<br />
Components exposed to harsh environments,<br />
surface coatings with laser technology<br />
and component solutions for new<br />
electromagnetic applications attracted<br />
the most attention.<br />
We are proud to say that we now have<br />
a really good organisation and infrastructure<br />
to create and utilise innovation.<br />
The combination of the PoP Centre,<br />
where we work on customers’ processes,
our test centre for powder development<br />
where we can test and develop new<br />
powders quickly and cost-efficiently,<br />
and our Tech Centres across <strong>Höganäs</strong>’<br />
world, have enabled us to operate as an<br />
extension of our customers’ research and<br />
development efforts. We aspire to achieve<br />
this unique position, to nurture global<br />
market growth.<br />
A motor showcasing Somaloy ®<br />
Our revolutionary electric motor, developed<br />
on our technology based on SMCs<br />
(soft magnetic composites), Somaloy®,<br />
was launched in <strong>2010</strong>. This motor is designed<br />
for electric bicycles, but also offers<br />
the same weight, volume and efficiency<br />
benefits in fans, pumps and generators.<br />
This project has clearly demonstrated<br />
the importance of presenting finished<br />
concepts and solutions when we introduce<br />
all-new technologies. The interest<br />
and enthusiasm of our customers was far<br />
greater, and when prospective users were<br />
able to physically examine the motor and<br />
compare it to traditional alternatives, this<br />
resulted in really fast progress. When we<br />
moved forward from conceptual discussions<br />
to a well-designed product, the<br />
fantastic possibilities of SMC powders<br />
presented themselves. The launch of the<br />
Simulated Pole Motor has led a substantial<br />
increase in interest for our Somaloy®<br />
technology. To me, this represents an<br />
excellent example of how we are moving<br />
forward in the value chain.<br />
Launching gear-wheels for cars<br />
Gear-wheels for car gearboxes is another<br />
application that could accelerate the market<br />
growth of metal powder. <strong>Höganäs</strong> is<br />
working globally to develop and launch<br />
metal powder-based gear-wheels as an<br />
environmentally efficient and cost-<br />
effective alternative to traditional<br />
solutions.<br />
As an essential component of this<br />
progress, the gear-wheels need to be tested<br />
in demanding environments. Accordingly,<br />
in <strong>2010</strong>, <strong>Höganäs</strong> sponsored the<br />
Swedish “Ramona Karlsson” rally team.<br />
A number of gear-wheels in the gearbox<br />
of the <strong>2010</strong> team car were replaced with<br />
powder based components. At the end of<br />
the season, we could conclude that the<br />
powder-based gear-wheels exhibited less<br />
wear than their traditional counterparts.<br />
We will be extending our testing in 2011<br />
to include all gear-wheels.<br />
Our Simulated Pole Motor and rally<br />
gearbox are two great examples of living<br />
according to <strong>Höganäs</strong>’ vision of pushing<br />
the limits of metal powder. We will<br />
be continuing our efforts on this path in<br />
2011.<br />
With a large number of new development<br />
projects across our focus segments,<br />
I strongly believe we will be able to develop<br />
exciting new business for the future.<br />
Results of operations for the year<br />
Operating income for the year was<br />
MSEK 1,114 (298). The additional contribution<br />
from 40% higher sales volumes<br />
was substantial. Because we achieved the<br />
sales increase without significant new<br />
investment, our cost absorption was very<br />
positive. Our earnings comparison with<br />
2009 is also affected by a good rate of<br />
inventory turnover, especially in the first<br />
half-year <strong>2010</strong>, while it was much lower<br />
than normal in the first quarter of 2009,<br />
C E O ’ S S TAT E M E N T<br />
which was then charged with relatively<br />
high metal costs. The Swedish krona<br />
appreciated significantly in 2009, from<br />
a very weak level at the beginning of the<br />
year, and this appreciation continued in<br />
<strong>2010</strong>. Accordingly, exchange rates were<br />
less favourable in <strong>2010</strong> compared to the<br />
previous year.<br />
Market conditions were relatively<br />
stable and activity levels were high right<br />
through the value chain in the year. We<br />
think that demand conditions remain<br />
strong in South America and Asia, apart<br />
from Japan. It is reasonable to expect a<br />
gradual improvement in North America,<br />
while market progress in Europe is<br />
uncertain, depending upon the level of<br />
economic growth in heavily indebted<br />
countries.<br />
<strong>Höganäs</strong>, Sweden, 7 February 2011<br />
Alrik Danielson<br />
CEO and President<br />
H Ö G A N Ä S 2 0 1 0 3
B U S I N E S S I N T E L L I G E N C E<br />
4 H Ö G A N Ä S 2 0 1 0<br />
BRIC countries<br />
• GDP growth <strong>2010</strong>: 4–11%<br />
• 25% of the earth’s surface<br />
• 40% of the population<br />
• 25% of global GDP
Business intelligence…<br />
<strong>Höganäs</strong>’ long-term prospects of growth<br />
and profitability are controlled by our ability to<br />
adapt ourselves to major exogenous trends<br />
and exploit the new business opportunities<br />
that they create. Accordingly, we put a big<br />
emphasis on business intelligence.<br />
Each year, we conduct a thorough analysis<br />
of progress on our markets, as a part of the<br />
management and Board’s review of corporate<br />
strategies. Each region is responsible for<br />
examining key sectors, technology segments<br />
and other relevant drivers, and reporting them<br />
to management. We also conduct continuous<br />
business intelligence within the auspices of our<br />
close collaboration with customers.<br />
One of the major over-arching trends that we<br />
regard as central for our progress is the robust<br />
growth in many emerging economies, especially<br />
the BRIC countries—Brazil, Russia, India<br />
and China—where wealth is growing briskly<br />
and the middle class is burgeoning. This is creating<br />
new markets, and setting new standards<br />
in many sectors.<br />
B U S I N E S S I N T E L L I G E N C E<br />
It also adds emphasis to the demands for<br />
the more efficient consumption of resources<br />
and energy, as well as robust environmental<br />
and climate change measures. This applies to<br />
these markets, but also to other regions. Many<br />
environmental problems, especially CO 2 emissions,<br />
are global. Increased wealth, and the<br />
resulting higher consumption and energy use<br />
in a continent, affects needs and behaviour<br />
over the whole planet.<br />
Business intelligence illustrates the concrete<br />
needs that require new products and solutions.<br />
The usage of major metals and other elements<br />
is being optimised in many sectors. Growing<br />
economies need effective and more environmental<br />
transportation, especially in the big cities.<br />
An impending water shortage requires more<br />
effective water purification. New land, previously<br />
unusable, has to be utilised for homes<br />
or agriculture. The shortage of food and water<br />
are questions that are becoming more urgent<br />
to resolve from many perspectives, not merely<br />
environmental. Our prospects for continued<br />
global growth and the spread of prosperity<br />
depend on them.<br />
From…<br />
The world’s big cities are getting bigger, and traffic in<br />
them is growing. Access is poor, parking is impossible<br />
to find, and this is having a negative effect on<br />
the environment. Meanwhile a new urban generation<br />
is emerging, who want to balance an efficient and<br />
comfortable life with environmental awareness.<br />
H Ö G A N Ä S 2 0 1 0 5
U N D E R S TA N D I N G N E E D S<br />
…creates need insight and ideas…<br />
<strong>Höganäs</strong> has identified six segments where we<br />
see especially high potential to create cost efficiency<br />
and environmental benefits using powder<br />
technology. We have appointed specialist<br />
groups in each segment, whose assignment<br />
is to develop an understanding of needs for<br />
application ideas and customer collaborations.<br />
We call them our Global Development Teams.<br />
Powder metallurgy can make many components<br />
more efficient, lighter and more environmental.<br />
Gear-wheels in the automotive industry<br />
are one example. There is a long-term trend<br />
towards increased usage of powder metallurgical<br />
components.<br />
Surface coatings with powder generate lower<br />
costs and environmental impact for applications<br />
where wear resistance is important, such as<br />
propeller shafts and hydraulic cylinders. Unusual<br />
and costly metals with high resistance to<br />
abrasion and corrosion are then only used in<br />
this powder and applied to common, low-cost<br />
metals instead of the complete application being<br />
produced in the rare metal.<br />
Brazing with powder-based braze flux gives<br />
optimal results despite the powder having a<br />
…idea…<br />
Electric cycles are rapidly becoming<br />
more popular. They are environmentally<br />
efficient and can be used<br />
by anyone anywhere, unlike electric<br />
mopeds.<br />
6 H Ö G A N Ä S 2 0 1 0<br />
lower content of costly or un-environmental<br />
metals like nickel and copper than traditional<br />
equivalents. This results in greater strength, plus<br />
financial and environmental savings.<br />
Electromagnetic applications, such as<br />
electric motors produced from SMC powders,<br />
are lighter, more compact and cheaper than<br />
traditional motors with, simultaneously, higher<br />
efficiency. They are also easier to manufacture<br />
and recycle.<br />
Filters are cheaper and have better characteristics<br />
with metal powder. They withstand<br />
higher temperatures and are more efficient with<br />
longer useful lives. Key application segments<br />
are exhaust purification in diesel engines and<br />
water treatment in waterworks. Metal powder<br />
can also be used directly for decontaminating<br />
water or land.<br />
Injection moulded components are produced<br />
with the aid of a technology that offers<br />
the same benefits as pressed components,<br />
simultaneous with greater design flexibility. In<br />
the future, many forged or cast components<br />
should be suitable for injection moulding with<br />
powder.
…to…<br />
Unfortunately, these bicycles have<br />
poor range, and motors risk overheating<br />
on hills. Their motors are<br />
often unwieldy and heavy, which puts<br />
off some consumers.<br />
U N D E R S TA N D I N G N E E D S<br />
H Ö G A N Ä S 2 0 1 0 7
C U S T O M E R B E N E F I T<br />
We are developing products with<br />
our customers that create benefits…<br />
We base our product development from market<br />
needs. Our Global Development Teams (GDTs)<br />
identify needs in different customer segments.<br />
For example, our surface coatings team is<br />
looking at future development in sectors where<br />
applications are exposed to intense wear,<br />
resulting in high cost.<br />
The automotive industry is such a segment.<br />
Engines in all types of vehicles—cars, trucks,<br />
construction machinery and ships—contain<br />
valves that are exposed to intense wear. If these<br />
valves were not designed for maximum wear<br />
resistance, engines would have shorter useful<br />
lives, increased fuel consumption and worse<br />
environmental impact.<br />
The surface coating team has analysed the<br />
progress, and noted that alternative fuels are<br />
gaining more importance, setting new standards<br />
for surface coatings. The team has contacted<br />
car producers who have been offered<br />
a collaboration on developing new powders to<br />
satisfy these new standards. After identifying<br />
…reality.<br />
<strong>Höganäs</strong> has developed an electric motor from SMC<br />
metal powders. This powder’s three-dimensional magnetic<br />
characteristics make the motor smaller and lighter than<br />
traditional alternatives. It is also significantly more efficient,<br />
giving cycles superior range. The motor is now in tests<br />
with cycle producers in Europe, Asia and North America.<br />
8 H Ö G A N Ä S 2 0 1 0<br />
the strains, chemicals, liquids and similar that<br />
valves are exposed to, a requirement specification<br />
is formalised. <strong>Höganäs</strong> then tests and<br />
develops new powders in application environments<br />
at the PoP Centre.<br />
The result is a new powder optimised for maximum<br />
wear resistance, which saves fuel and<br />
the environment when vehicles are used. The<br />
production process is also more efficient thanks<br />
to <strong>Höganäs</strong>’ higher powder quality. Tests demonstrate<br />
that valve producers consume a lower<br />
volume of powder and less gas by utilising<br />
<strong>Höganäs</strong> powder than competitors’ offerings.<br />
The whole process is also significantly faster<br />
and cheaper.<br />
All GDTs work in a similar way on transforming<br />
an understanding of needs into concrete<br />
development projects. In some cases, we test<br />
and develop prototypes independently in the<br />
PoP Centre before contacting potential clients.<br />
Often, our GDTs approach end-customers directly,<br />
jointly with customers and partners.
+ H2 0<br />
Material losses<br />
More power<br />
Sterling generators can be made smaller and lighter<br />
by using SMC powders in components. Boilers fitted<br />
with this type of generator enable households to extract<br />
up to 1,000 W from the generator, for their own<br />
consumption or sale back to public networks.<br />
Cost of materials<br />
Using iron-based braze flux instead of nickel cuts<br />
material costs. Nickel is recommended for brazing<br />
in demanding applications in heat exchangers in the<br />
automotive and white goods industry, where good<br />
anti-corrosive properties are required. <strong>Höganäs</strong>’ recently<br />
developed iron powder-based braze flux offers<br />
a cost-efficient alternative to nickel brazing.<br />
O M V Ä R L D S A N A LY S<br />
- CO 2<br />
The Starmix Boost mix concept enables material<br />
losses to be cut by up to 95%. Thanks to <strong>Höganäs</strong>’<br />
new approach to processing powder during pressing,<br />
the need for post-processing components reduces. -95%<br />
+1 KW<br />
-10 - 30%<br />
H Ö G A N Ä S 2 0 1 0 9
C R E AT I N G V A L U E<br />
...and value for <strong>Höganäs</strong><br />
<strong>Höganäs</strong> is a leader in powder metallurgy. As<br />
the sector’s frontrunner, we work to drive<br />
development of powder metallurgy by finding<br />
new application segments for metal powder. In<br />
this way, we are extending the market and<br />
enabling continued market growth.<br />
By developing application know-how and<br />
creating close relations with our customers, we<br />
can also integrate forward in the value chain. In<br />
this way, we can offer our customers collaborations<br />
and services at several levels in the<br />
value chain and get more exposure to them.<br />
This is how we create sustainable profitable<br />
growth.<br />
Our financial goals are to grow by 6-8% per<br />
year on average over a business cycle, to<br />
achieve an operating margin of 15% and<br />
return on capital employed of 20%. Over the<br />
past five years, average growth has been<br />
consistent with our objective, until the financial<br />
crisis in late 2008. Then, the outlook was<br />
disrupted by a very sharp downturn, and<br />
10 H Ö G A N Ä S 2 0 1 0<br />
Power of Powder<br />
<strong>Höganäs</strong> strategy of working the value chain means<br />
we are pushing the limits of powder technology. Our<br />
solutions create value and measurable benefits for our<br />
customers and shareholders. Thanks to this strategy,<br />
we have been able to benefit from the global economic<br />
recovery in <strong>2010</strong>, and advance our market positioning.<br />
subsequently a significant recovery in <strong>2010</strong>.<br />
Since 2005, we have progressed from an<br />
operating margin of 10.0% to 16.7%, and from<br />
returns of 12.0% to 27.6%. This demonstrates<br />
that our strategy creates value for shareholders.<br />
There are also other indicators that clearly<br />
demonstrate that we are building value for the<br />
long term with a new market position and<br />
long-term customer relations. In <strong>2010</strong>, we<br />
started several development collaborations<br />
with customers, such as surface coatings on<br />
propeller shafts, brazing cooling systems and<br />
inductor material for energy systems. We<br />
introduced several new products that were<br />
unique on the market. For example, our GDTs<br />
introduced new powder with a lower content<br />
of costly alloy metals for high-strength components,<br />
and an effective, environmental lubricant<br />
for powder compacting.
O M V Ä R L D S A N A LY S<br />
+816 MSEK operating income<br />
Volume growth<br />
+40% sales volume<br />
Our objective is to grow by 6 to 8% on average over a<br />
business cycle. Over the past five years, our average<br />
growth has been in line with target, until the financial<br />
crisis in late-2008. The outlook was then disrupted by<br />
a very sharp downturn, and then, a significant recovery<br />
in <strong>2010</strong>.<br />
Operating margin<br />
Our goal is to achieve an operating margin of 15%.<br />
We beat this target in <strong>2010</strong> with an operating margin<br />
of 16.7%. We were very close to this goal in spring<br />
2008, prior to the financial crisis.<br />
Returns<br />
Our goal is to achieve a return on capital employed of<br />
20% over a business cycle. Since the financial crisis,<br />
we have exceeded this goal.<br />
Sales volume<br />
500<br />
400<br />
300<br />
200<br />
100<br />
0<br />
2006<br />
2007<br />
2008<br />
2009<br />
<strong>2010</strong><br />
-10<br />
-20<br />
-30<br />
Sales volume, 000 tons Volume growth, %<br />
Growth target, %<br />
Operating margin<br />
1,200<br />
900<br />
600<br />
300<br />
0<br />
2006<br />
2007<br />
2008<br />
2009<br />
<strong>2010</strong><br />
Operating income, MSEK Operating margin, %<br />
Margin target, %<br />
Return<br />
30<br />
25<br />
20<br />
15<br />
10<br />
5<br />
0<br />
2006<br />
2007<br />
2008<br />
2009<br />
Return on capital employed, %<br />
Target return, %<br />
<strong>2010</strong><br />
40<br />
30<br />
20<br />
10<br />
H Ö G A N Ä S 2 0 1 0 11<br />
0<br />
18<br />
15<br />
12<br />
9<br />
6<br />
3<br />
0
B U S I N E S S A R E A S<br />
Components<br />
Components makes up some 75% of <strong>Höganäs</strong>’ turnover and covers<br />
the production of all powder that is refined into components.<br />
Iron and metal powders with various alloys are delivered to component<br />
producers in the powder metallurgical industry. As part of<br />
our work on pushing the limits of powder metallurgy, we also market<br />
the benefits of metal powder to end-users.<br />
Metal powder is pressed and sintered<br />
into electrical or mechanical components<br />
that are delivered to product and system<br />
producers or directly to OEMs (Original<br />
Equipment Manufacturers). Many power<br />
transmission components in cars—like<br />
sprockets and synchromesh clutch hubs<br />
in gearboxes, shock absorber components<br />
and brakes—are made of powder<br />
components because they are lighter,<br />
reducing fuel consumption.<br />
Components today<br />
Using powder components instead of<br />
forged or cast materials avoids milling<br />
and grinding to produce finished components,<br />
reducing wastage. Reduced consumption<br />
of materials and higher yields<br />
cut the cost of materials for powder<br />
components, and fewer labour processes<br />
shorten processing times. Efficiency<br />
increases, and production costs reduce.<br />
Because the manufacturing process consumes<br />
less energy, environmental impact<br />
is also mitigated.<br />
Consistent powder quality, lubricants,<br />
mixing techniques and increased<br />
production rates for compacting are key<br />
development segments for an effective<br />
production process for component<br />
producers.<br />
Business area key ratios<br />
MSEK <strong>2010</strong> 2009<br />
Net sales 5,046 3,292<br />
Operating income 829 181<br />
Operating margin, % 16.4 5.5<br />
Assets 4,086 3,524<br />
Investments 231 193<br />
12 H Ö G A N Ä S 2 0 1 0<br />
Components tomorrow<br />
Long-term development work is focusing<br />
on new application segments to utilise<br />
the many benefits of metal powders to<br />
meet more stringent requirements for<br />
energy efficiency and reduced environmental<br />
impact. Hybrid engines and fuel<br />
cell engines are examples of tomorrow’s<br />
products and powder metallurgy is wellsuited<br />
to satisfy these needs.<br />
Long-term development work in Components<br />
is conducted in three primary segments;<br />
powder metallurgy, SMC components<br />
and injection-moulded components.<br />
Major advances in <strong>2010</strong><br />
We launched a new high-torque electric<br />
motor in the year that is smaller, lighter<br />
and cheaper than comparable offerings.<br />
Environmental impact is alleviated by<br />
producing the stator and rotor from<br />
scrap raw material; the usage of rare<br />
earth metals is reduced and the motor is<br />
easier to recycle. This motor can be used<br />
in electric vehicles like cycles and scooters,<br />
as well as fans and pumps.<br />
Other major launches in the year<br />
include a new powder with lower alloy<br />
content for high-strength components<br />
and powder with a new lubricant that has<br />
a lower environmental impact because it<br />
is burnt off during sintering.<br />
Ramona—the toughest test<br />
Germany’s Getrag—one of the world’s<br />
leading gearbox producers—has tested<br />
powder gear-wheels in real environments.<br />
Gear-wheels produced with<br />
<strong>Höganäs</strong> powder and technology satisfy<br />
Getrag’s requirements for gearboxes<br />
that last for at least 200,000 km.<br />
But <strong>Höganäs</strong> has chosen to put its gearwheels<br />
to an even tougher test. In <strong>2010</strong>,<br />
<strong>Höganäs</strong> sponsored Ramona Karlsson,<br />
one of Sweden’s leading rally drivers.<br />
Powder-based gear-wheels have been<br />
installed instead of traditional equivalents<br />
in the gearbox of her Mitsubishi Evo IX,<br />
which powerful engine develops 300 bhp.<br />
Rally cars at the top level are exposed<br />
to extreme stresses. Engines and drivetrains,<br />
including gearboxes, are stripped<br />
down every 1,000 km, and the most<br />
load-bearing components replaced.<br />
When Ramona’s engine and gearbox<br />
was stripped down at the end of the<br />
season, the gear-wheels produced from<br />
powder actually had less wear damage<br />
than the cast components.<br />
Market segments<br />
PM components<br />
SMC components<br />
Applications<br />
Synchromesh clutch hubs in<br />
manual gearboxes<br />
Gear-wheels in electric hand tools<br />
(Stator) components in electric motors<br />
Turnover and operating income, MSEK<br />
6,000<br />
4,000<br />
2,000<br />
0<br />
2006<br />
2007<br />
Turnover Operating income<br />
2008<br />
2009<br />
backmansfoto.se<br />
<strong>2010</strong><br />
900<br />
600<br />
300<br />
0
Consumables<br />
Consumables represents some 25% of <strong>Höganäs</strong>’ turnover and<br />
produces and sells metal powder and high-alloy metal powder used<br />
mainly in processes such as surface coating, welding and brazing.<br />
Different types of powder are also used in a raft of segments such as<br />
the chemical and metallurgical process industries, as filters for purifying<br />
water and exhaust, and as supplements in food and animal feed.<br />
<strong>Höganäs</strong> delivers powder to producers of<br />
welding materials, users of brazing and<br />
surface coating technologies, and to<br />
producers of food and animal feed. Its<br />
deliveries are primarily to OEMs, but<br />
also to their subcontractors.<br />
Consumables today<br />
Metal powder is hard wearing, withstands<br />
high temperatures and has good<br />
anti-corrosive qualities, so it is wellsuited<br />
to a raft of different applications.<br />
When iron powder is used in welding<br />
electrodes, welding characteristics and<br />
the quality of the welded product is<br />
enhanced. High area in relation to weight<br />
compared to ordinary plate, for example,<br />
means that powder is well suited for purifying<br />
exhaust and liquids. In the textile<br />
industry, polymer molecules are used to<br />
reduce process downtime and enhance<br />
the quality of fibres.<br />
Metal alloys that are hard wearing,<br />
withstand high temperatures and have<br />
good anti-corrosive qualities are used as<br />
surface coatings on materials and components<br />
exposed to severe wear.<br />
Metal powder can also be used for the<br />
direct decontamination of polluted land.<br />
Groundwater absorbs pollutants, and can<br />
quickly contaminate large areas. Water<br />
is purified by these pollutants binding to<br />
Business area key ratios<br />
MSEK <strong>2010</strong> 2009<br />
Net sales 1,625 1,279<br />
Operating income 285 77<br />
Operating margin, % 17.5 6.0<br />
Assets 1,517 1,483<br />
Investments 71 72<br />
metal powder particles.<br />
By adding very small and pure metal<br />
powder particles to food and animal<br />
feed, it is possible to combat iron deficiency,<br />
which is common. Powder is used<br />
in cereals, flour and pasta, and to extend<br />
the shelf lives of daily staple foods by<br />
absorbing oxygen in packaging.<br />
Consumables tomorrow<br />
Metal powders suit a raft of applications.<br />
Long-term development work is focused<br />
on new application segments to utilise<br />
the many qualities of metal powder. The<br />
three segments of the future are surface<br />
coatings, brazing and purification.<br />
Major advances in <strong>2010</strong><br />
In <strong>2010</strong>, we upscaled investments in our<br />
Tech Centre in Shanghai for the World<br />
Expo. Thanks to a sharper application<br />
focus, this attracted new business in surface<br />
coating and welding products.<br />
Sales volumes in South America more<br />
than doubled in <strong>2010</strong> in year-on-year<br />
terms. High sales volumes in the steel<br />
and casting industries were due to brisk<br />
progress in the building and construction<br />
industries, and infrastructure investments.<br />
Turnover and operating income, MSEK<br />
1,800<br />
1,200<br />
600<br />
0<br />
2006<br />
B U S I N E S S A R E A S<br />
Market segments<br />
Surface coating, friction materials, welding,<br />
brazing, filters, food and feed supplements<br />
Applications<br />
Coating of rollers, Brazing heat exchangers,<br />
Food supplements<br />
2007<br />
Turnover Operating income<br />
Arcos sets the standards<br />
Arcos Hydraulik produces hydraulic<br />
cylinders for especially demanding applications<br />
in the paper industry, mines, offshore<br />
and other segments. Arcos surface<br />
coats most hydraulic pistons with hard<br />
chrome plating to increase their wear<br />
strength and anti-corrosive qualities.<br />
Hard chrome plating cannot cope with<br />
the most challenging corrosive environments,<br />
and at present, there are no<br />
alternatives other than solid piston rods<br />
made of stainless steel or titanium or<br />
nickel alloys. Solid pistons have shorter<br />
durability and the material is costly.<br />
Arcos and <strong>Höganäs</strong> are now developing<br />
a material to satisfy the requirements<br />
for wear resistance and to withstand<br />
extremely corrosive environments in a<br />
joint project. <strong>Höganäs</strong> is contributing its<br />
strength in materials and processes, and<br />
Arcos its knowledge of the standards<br />
required of the coating.<br />
The environmental impact of hard<br />
chrome plating means that there is<br />
great interest in alternative coatings with<br />
equivalent wear resistance, extending to<br />
other hydraulic applications.<br />
2008<br />
2009<br />
<strong>2010</strong><br />
300<br />
200<br />
100<br />
H Ö G A N Ä S 2 0 1 0 13<br />
0
H U M A N R E S O U R C E S<br />
Human resources<br />
In <strong>2010</strong>, <strong>Höganäs</strong> continued its work on strengthening its organisation and taking its business<br />
forward. Internal corporate communication, training projects and collective processes are contributing<br />
to improved stakeholding and the prospects of its people’s development. <strong>Höganäs</strong> has<br />
introduced a profit sharing system for the entire Group, in total 1,647 (1,456) employees across<br />
15 countries at year-end <strong>2010</strong>. Of this total, 15% (15) were women, and 35% (34) were graduates.<br />
14 H Ö G A N Ä S 2 0 1 0<br />
New tools support development<br />
Over-arching HR work targeting a<br />
stronger organisation has now entered its<br />
next phase, with mapping transferring to<br />
execution. The previous focus was updating<br />
and securing policies to ensure that<br />
the organisation operated consistently<br />
in all parts of business. Now, collective<br />
templates and tools are in place, as are<br />
improved job descriptions and processes<br />
for annual appraisal interviews.<br />
The Group-wide templates set<br />
minimum levels, but are tailored to local<br />
conditions. These tools support managers<br />
in their ongoing work of identifying<br />
and rewarding good performance, but<br />
also in identifying people’s development<br />
potential. The objective of HR work is<br />
for <strong>Höganäs</strong> to be able to hire and retain<br />
valuable competence.<br />
<strong>Höganäs</strong> launched a profit share<br />
system for all employees in the year. The<br />
Board has initiated the program to make<br />
it clearer for everyone to understand<br />
entrepreneurship and the importance<br />
of making a profit. This contributes to<br />
motivation and stakeholding.<br />
High commitment in<br />
<strong>Höganäs</strong> Business Academy<br />
<strong>Höganäs</strong> Business Academy is a central<br />
initiative in the competence development<br />
segment. Over and above the initiatives<br />
conducted continuously throughout our<br />
business, this is a major training initiative<br />
to enhance our key people’s understanding<br />
of <strong>Höganäs</strong>’ strategic goals. It is also<br />
a vital forum to exchange best practice<br />
and create internal contact networks between<br />
employees from different segments<br />
and regions.<br />
Some 30 participants from different<br />
parts of the Group took this training in<br />
<strong>2010</strong>. Several members of Group management<br />
attended, contributing to the<br />
training in different ways.
Our people<br />
1,647 employees<br />
Some of the regular themes of <strong>Höganäs</strong><br />
Business Academy are;<br />
• <strong>Höganäs</strong>’ strategy and fundamental<br />
values<br />
• Goals and tactical considerations<br />
• Review of available resources in the<br />
form of support systems, processes<br />
and principles<br />
• Company basics such as capacity utilisation,<br />
capital tied-up and cash flow.<br />
Increased communication efforts<br />
<strong>Höganäs</strong> conducted its biennial employee<br />
satisfaction survey in <strong>2010</strong>. Despite<br />
<strong>Höganäs</strong>’ business being affected by the<br />
recession of 2009, employees’ confidence<br />
in the Company was unaffected, as was<br />
especially apparent in their opinions of<br />
job satisfaction and motivation. The<br />
employee satisfaction index often showed<br />
surprisingly similar results between countries,<br />
although some regional differences<br />
were apparent.<br />
Again in this survey, the results indicated<br />
that employees view information and<br />
35 % graduates<br />
corporate communication as an important<br />
segment. In response, corporate<br />
communication resources have been<br />
strengthened and new activities are being<br />
launched. One example is the updated<br />
staff magazine, published from the start<br />
of <strong>2010</strong>. Each issue covers an important<br />
theme, such as our key concepts of<br />
Active, Brave and Caring.<br />
<strong>Höganäs</strong> also decided on a new platform<br />
for a Group-wide intranet in the<br />
year. Its aims include making information<br />
more available to staff and offering<br />
more opportunities to leave feedback.<br />
The intranet should also encourage collaboration<br />
and the exchange of knowledge<br />
across regional and departmental<br />
boundaries.<br />
Code of Conduct and<br />
global working environment project<br />
<strong>Höganäs</strong> has had a Group-wide code of<br />
conduct in place since 2007, which deals<br />
with relationships with business partners,<br />
shareholders, employees and wider<br />
15 countries<br />
H U M A N R E S O U R C E S<br />
society. This Code applies to all staff and<br />
<strong>Höganäs</strong> managers have special responsibility<br />
to act in accordance with the<br />
code and keep their staff continuously<br />
informed about its principles. The Code,<br />
available on <strong>Höganäs</strong>’ website, has three<br />
main sections;<br />
• Business ethics<br />
• Social and human rights<br />
• The environment.<br />
In <strong>2010</strong>, <strong>Höganäs</strong> initiated an overall<br />
project to reinforce its global working<br />
environment efforts. Its goal is to analyse<br />
the conditions and results of different<br />
regions and enable good examples of<br />
processes and preventive measures to be<br />
highlighted.<br />
H Ö G A N Ä S 2 0 1 0 15
S U S TA I N A B L E D E V E L O P M E N T<br />
Continued work on<br />
sustainable development<br />
For <strong>Höganäs</strong>, sustainable development means economic sustainability goes hand in hand<br />
with environmental and socially sustainable development. <strong>Höganäs</strong>’ prime contribution to this<br />
process is our products and the improvements they contribute to, but also our ongoing work<br />
on reducing the environmental impact of production and processes.<br />
Continuously improved<br />
alternatives<br />
All development work should achieve<br />
reduced environmental impact compared<br />
to previous products or processes,<br />
and accordingly, an analysis of<br />
environmental impact is included in<br />
the supporting data of decision paths.<br />
For example, <strong>Höganäs</strong> offers<br />
chrome or silicon as an alloy element<br />
on certain products, which reduce<br />
their environmental impact compared<br />
to the alternatives of nickel, manganese,<br />
molybdenum or copper. The<br />
zinc-free material Intralube E can<br />
replace previous generations of lubricant<br />
in the compression moulding of<br />
metal powder.<br />
16 H Ö G A N Ä S 2 0 1 0<br />
<strong>Höganäs</strong> products have good prospects<br />
on the market with increased consciousness<br />
of environmental and climate issues,<br />
and the significance of the conservation<br />
of resources. With their unique qualities,<br />
components produced using metal<br />
powder technology can contribute to the<br />
development of new energy systems, such<br />
as the next generation of electric motors<br />
and designs for distributing renewable<br />
energy like solar and wind power generated<br />
electricity. In regions with limited<br />
access to water, specially developed powders<br />
can be used to purify groundwater<br />
from pollutants.<br />
Processes that save time,<br />
material and energy<br />
Often, production with powder technology<br />
offers superior overall finances<br />
right through the production chain,<br />
and for the customer. By producing<br />
components from metal powder,<br />
processes can be shortened through<br />
fewer production stages. In addition,<br />
metal powder components can be<br />
hardened immediately after sintering<br />
with a forced cooling process, which<br />
saves time and energy overall. Wastage<br />
can be virtually eliminated with<br />
powder technology, conferring more<br />
efficient utilisation of materials.<br />
<strong>Höganäs</strong>’ PoP Centre, a forum for stimulating<br />
innovation in partnership with the<br />
customer and the customer’s customer,<br />
is a vital platform for continued development.<br />
Through the conscious selection<br />
of materials, more intelligent application<br />
and process optimisation, products are<br />
developed with environmental consideration.<br />
New electromagnetic iron<br />
cores, that are lighter, stronger and more<br />
energy-efficient with higher torque than<br />
alternatives developed for new vehicle<br />
electric motors, are just such an example.<br />
On occasion, markets have to be created,<br />
and that’s why <strong>Höganäs</strong> intends to demonstrate<br />
the benefit of different compo-<br />
Approaches to sustainable development<br />
Product development and processes in <strong>Höganäs</strong> feature over-arching approaches that set a framework for its work.<br />
Conservation of resources<br />
and high performance<br />
<strong>Höganäs</strong>’ ambition is to keep optimising<br />
the utilisation of resources, with<br />
continued satisfactory or superior<br />
product performance. This requires<br />
continued development of new<br />
tech nology, e.g. the usage of modelling<br />
software to optimise components<br />
design. Calculations enable <strong>Höganäs</strong><br />
to identify rationalisation opportunities<br />
that do not compromise performance,<br />
but actually enhance it. To be able to<br />
optimise the kinetic energy of a gear-<br />
wheel, and thus its performance in a<br />
gearbox, for example, software models<br />
the optimal location of apertures that<br />
reduce weight and material consumption,<br />
without adversely affecting<br />
strength.
Reduced emissions<br />
-53% CO 2<br />
nents produced by its products in energy<br />
systems in demonstration projects.<br />
By driving its own and sector-wide<br />
research in powder metallurgy, <strong>Höganäs</strong><br />
is taking the development of application<br />
segments for metal powder forward.<br />
Strategic sustainability work<br />
moves forward<br />
<strong>Höganäs</strong> continued its work on environmental<br />
and sustainability issues in <strong>2010</strong>.<br />
Its Group-wide Corporate Competence<br />
Centre is responsible for coordinating<br />
this collective work. Based on a risk<br />
analysis of matters highly relevant to<br />
<strong>Höganäs</strong> from a sustainability perspective,<br />
a number of segments have been<br />
prioritised for this work; energy, supplier<br />
conditions, residual products and waste.<br />
Safety in the workplace is another<br />
priority running in parallel in HR work.<br />
Common key performance indicators<br />
linked to these segments were formulated<br />
in the year.<br />
-90% SO 2<br />
Energy strategy<br />
A Group energy strategy has been<br />
formulated, based on the results of the<br />
energy mapping conducted in Sweden in<br />
2009 and the US in <strong>2010</strong>. It is a key component<br />
in Group-wide work in priority<br />
segments. Selected components from the<br />
energy strategy:<br />
• Project handbook formalising product<br />
and process development to include a<br />
dedicated section on energy<br />
• All regions should have energy management<br />
systems<br />
• Each regional management team<br />
should have an energy manager<br />
• All regions should also prepare a<br />
three-year plan for energy work, reporting<br />
to Group management.<br />
In addition, a longer payback period for<br />
investments in energy efficiency measures<br />
was accepted, enabling more measures to<br />
be executed.<br />
Processes for suppliers<br />
Progress was also made in the priority<br />
segment of suppliers in the year. The<br />
S U S TA I N A B L E D E V E L O P M E N T<br />
-46% NO x<br />
Emissions per ton of material produced have gradually reduced since the mid-1980s. Nowadays, emissions are close to what is possible with<br />
current technology because iron and steel production is dependent on coal, which causes CO 2 emissions from the process.<br />
Emissions for 1985-1999<br />
are for the Swedish production<br />
facilities. Emissions<br />
from 2000 onwards are<br />
from the Group’s total<br />
operations.<br />
Emissions per produced ton<br />
CO 2 ton/ton prod<br />
1,6<br />
1,2<br />
0,8<br />
0,4<br />
0,0<br />
1985<br />
1990<br />
1995<br />
previous focus on quality, delivery and<br />
the environment was extended to include<br />
social responsibility and ethics. New<br />
routines and forms were developed for<br />
suppliers. They differ somewhat based<br />
on the category of the supplier, such as<br />
raw materials. A Key Commodity Team<br />
in purchasing will be visiting a number<br />
of suppliers in the year, starting in 2011.<br />
Work on preparing decision-support data<br />
for the suppliers to be prioritised in the<br />
first phase is ongoing.<br />
Systematic environmental work<br />
<strong>Höganäs</strong> works systematically to reduce<br />
the environmental impact of its own<br />
business in the short and long term. Its<br />
Environmental Policy is the Group’s<br />
collective control document for key environmental<br />
issues and states guidelines<br />
on energy, CO 2 emissions, the conservation<br />
of resources and wastage. Good<br />
environmental performance strengthens<br />
<strong>Höganäs</strong>’ offering and competitiveness,<br />
by identifying new opportunities and<br />
creating more cost-efficient production.<br />
All the Group’s production facilities<br />
2000<br />
CO 2 ton/ton prod SO 2 kg/ton prod NO x kg/ton prod<br />
2005<br />
<strong>2010</strong><br />
H Ö G A N Ä S 2 0 1 0 17
S U S TA I N A B L E D E V E L O P M E N T<br />
have ISO 14001-certified environmental<br />
management systems and are regularly<br />
audited by third parties. This sets standards<br />
for the continuous improvement of<br />
results. Training all employees on environmental<br />
issues is an important prerequisite<br />
for being able to realise improvements.<br />
<strong>Höganäs</strong> assesses its suppliers’<br />
environmental work and encourages the<br />
implementation of certified management<br />
systems in their operations.<br />
Efficient utilisation of resources<br />
<strong>Höganäs</strong> has good prospects of reducing<br />
its environmental impact through the<br />
efficient utilisation of resources. Some<br />
two-thirds of its input materials are<br />
recycled iron scrap. Pure iron ore is still<br />
required to be able to achieve the product<br />
characteristics and qualities customers<br />
want, and this constitutes the remainder<br />
of input materials.<br />
Powder production results in a small<br />
amount of oversize particles that are too<br />
large for common powder mixes. The<br />
way <strong>Höganäs</strong> Brasil Ltda has employed<br />
the qualities of this oversize powder as a<br />
basis for creating a series of high-value<br />
products for the aluminium industry<br />
serves as an example of the classic<br />
‘<strong>Höganäs</strong> way’ of solving a resource<br />
problem. Simultaneously, unnecessary resmelting<br />
of processed metals is avoided.<br />
The metal tablets, which somewhat<br />
resemble hockey pucks, have been a great<br />
success so far, and <strong>Höganäs</strong> Brasil has<br />
already secured over 50% of this local<br />
market. Continued expansion is expected,<br />
which has also created new jobs.<br />
Work on utilising excess heat from<br />
industrial processes to satisfy heating<br />
needs is an example of systematic environmental<br />
work at <strong>Höganäs</strong>’ Swedish<br />
facilities. When excess heat is<br />
utilised, it replaces oil and natural gas<br />
as energy sources, reducing emis-<br />
18 H Ö G A N Ä S 2 0 1 0<br />
Energy recycling<br />
Research and development for<br />
increased energy efficiency<br />
Research work is decisive for <strong>Höganäs</strong><br />
retaining its competitive edge, continuing<br />
to develop its knowledge of powder<br />
technology and how to utilise its environmental<br />
benefits. <strong>Höganäs</strong> conducts<br />
in-house and sector-wide research,<br />
through projects including the Swedish<br />
Steel Producers’ Association’s energy<br />
program. Projects are ongoing to develop<br />
and rationalise the energy consumption of<br />
arc furnaces when producing steel from<br />
iron sponge or scrap. Another Swedish<br />
Steel Producers’ Association project<br />
<strong>Höganäs</strong> is really interested in is intended<br />
to utilise and recycle slag, a residual<br />
product from smelting iron, as a raw<br />
material for construction.<br />
Conditions for operations<br />
<strong>Höganäs</strong>’ business is subject to regulatory<br />
permits in all countries where<br />
production is conducted. These permits<br />
mainly regulate production volumes, air<br />
and waterborne emissions, noise and<br />
waste. These permits may apply for a<br />
specified time or until further notice, but<br />
all <strong>Höganäs</strong> production plants have the<br />
necessary permits.<br />
Permit cases in the year<br />
<strong>Höganäs</strong> has applied to the regulator for<br />
an extension to continue the technical<br />
investigation to produce supporting data<br />
for remedial measures to improve the<br />
airborne environment.<br />
In-depth mapping of the incidence<br />
of land contamination is continuing at<br />
the Swedish plants, and <strong>Höganäs</strong> has<br />
extended its inspection programme.<br />
sions of greenhouse gases. Some<br />
excess heat is also delivered to district<br />
heating provider <strong>Höganäs</strong> Fjärrvärme<br />
<strong>AB</strong>. In <strong>2010</strong>, <strong>Höganäs</strong> delivered 45.2<br />
(28) GWh of energy, corresponding to<br />
a reduction of about 12,900 (8,000)<br />
tons of CO 2 emissions.<br />
The first step of the process to apply for<br />
new environmental permits for plants<br />
at <strong>Höganäs</strong> began in the year, and are<br />
scheduled for filing with the authorities<br />
in 2012.<br />
Trading in emission rights<br />
<strong>Höganäs</strong>’ plants at Halmstad and<br />
<strong>Höganäs</strong>, which generate some 90% of<br />
the Group’s total CO 2 emissions, are<br />
covered by the EU trading system for<br />
CO 2 emission rights. The trading system<br />
is based on the number of available<br />
rights gradually reducing, with the deficit<br />
driving rationalisation measures to<br />
reduce CO 2 emissions where this is most<br />
cost-effective.<br />
In the trading period of 2008-2012,<br />
energy-intensive industries receive free<br />
allocation of emission rights, to avoid<br />
impairing the global competitiveness<br />
of European businesses. Allocation is<br />
based on historical data of emissions and<br />
forecast needs.<br />
<strong>Höganäs</strong> regards its allocation for<br />
2008-2012 as sufficient for its operations.<br />
New regulations will alter the conditions<br />
for the trading period that begins in 2013<br />
and extends until 2020. Accordingly, in<br />
2011, <strong>Höganäs</strong> will be applying for allocation<br />
of free emission rights pursuant to<br />
the new regulations. Free emission rights<br />
will be allocated to businesses that compete<br />
on markets not covered by the trading<br />
system. <strong>Höganäs</strong> operates through<br />
European sector organisation EURO-<br />
FER so it can influence and participate<br />
in dialogue on the trading system.
Risk management<br />
<strong>Höganäs</strong>’ business is exposed to operational and financial risks. There are<br />
a number of strategies and policies to manage these risks and minimise<br />
earnings effects and disruptions.<br />
Risks in the Group’s operating<br />
activities<br />
The production of metal powder is a<br />
chain of processes, and accordingly, disruption<br />
in various steps can have major<br />
consequences. Production disruption due<br />
to transport problems or fire, explosions<br />
or other types of accident can be costly.<br />
To minimise any consequential effects,<br />
<strong>Höganäs</strong> maintains reserve stocks of raw<br />
materials and finished products.<br />
Production can also be relocated<br />
within the Group to reduce the risks of<br />
production downtime.<br />
In <strong>2010</strong>, <strong>Höganäs</strong> initiated a collaboration<br />
with its property and consequential<br />
loss insurer, FM Global, involving the<br />
extensive inspection of all production facilities.<br />
This resulted in an action-plan of<br />
improvements designed to further reduce<br />
the risks of production disruptions.<br />
Insurance risks relate to the expenses<br />
<strong>Höganäs</strong> may incur as a result<br />
of inadequate insurance cover. <strong>Höganäs</strong><br />
endeavours to arrange insurance cover<br />
that keeps its risks at an acceptable level.<br />
As part of this process, <strong>Höganäs</strong> conducted<br />
valuations of most of its production<br />
facilities in the year to ensure that<br />
accurate replacement values are reported<br />
to its insurer.<br />
Purchasing risks include delivery fulfilment,<br />
quality and prices of materials<br />
and energy. <strong>Höganäs</strong> aims to maintain at<br />
least two suppliers of selected strategic<br />
raw materials. The parent company is responsible<br />
for purchasing selected metals<br />
and co-ordinates other strategic materials,<br />
while other risks are managed locally<br />
at production facilities.<br />
<strong>Höganäs</strong> is exposed to the risk of not<br />
receiving payment for deliveries. To some<br />
degree, the risk of bad debt is mitigated<br />
by the Group’s sales being conducted in a<br />
high number of countries to a large customer<br />
base, limiting exposure. <strong>Höganäs</strong><br />
also arranges credit insurance to alleviate<br />
the risk of bad debt from US customers<br />
and export letters of credit for sales<br />
in some Asian markets. Credit checks<br />
are always run on new customers before<br />
sales. Receivables balances are also monitored<br />
continuously.<br />
<strong>Höganäs</strong>’ reputation can be damaged<br />
if its safety, environmental accountability<br />
and ethics come under question. These<br />
risks are managed systematically through<br />
approved management systems, and dealt<br />
with locally by the Group’s functional<br />
support. These questions are also highlighted<br />
in ongoing work through training<br />
and influencing attitudes.<br />
Prospects of attracting and retaining<br />
skilled staff are important for <strong>Höganäs</strong> to<br />
be able to operate with good profitability<br />
sustainably. Competence and leadership<br />
development are conducted through channels<br />
including <strong>Höganäs</strong> Business Academy.<br />
Some of the legal disputes and administrative<br />
processes that arise in operations<br />
can also be considered as risks. These<br />
include matters relating to environmental<br />
and health liability and intellectual<br />
property, for example, as well as disputes<br />
with suppliers, customers and other<br />
external parties, which may involve large<br />
amounts. Legal disputes are managed<br />
by <strong>Höganäs</strong>’ Corporate Legal function<br />
in consultation with external services<br />
providers.<br />
In a globalised and competitive operation,<br />
there is a risk that new products<br />
and processes are plagiarised. Intellectual<br />
property risks are managed by the<br />
Group’s R&D unit. <strong>Höganäs</strong> seeks to<br />
secure patent protection on technical innovations<br />
and processes developed by the<br />
Group, and monitors patent compliance.<br />
R I S K M A N A G E M E N T<br />
Exogenous risks<br />
<strong>Höganäs</strong>’ operations are affected by the<br />
global economy, through raw materials<br />
prices, supply and the market potential<br />
of the Group’s products. Risks related<br />
to changes in raw material prices are<br />
reviewed in the section on financial risks.<br />
Exposure to the automotive industry<br />
makes the Group especially sensitive to<br />
progress in this sector. Protection against<br />
these risks is problematic in the short<br />
term. In the longer perspective, <strong>Höganäs</strong><br />
achieves this by developing products<br />
with higher value-added, and by focusing<br />
on forward-looking segments. Many of<br />
<strong>Höganäs</strong>’ products are exposed to competition,<br />
and several major competitors<br />
have progressively improved the quality<br />
of their products in recent years. The PM<br />
industry is also subject to over- capacity.<br />
Through its strategy of being the technological,<br />
product and commercial leader<br />
in metal powder, <strong>Höganäs</strong> intends to<br />
retain and advance its positioning versus<br />
competitors.<br />
The Group’s financial risks<br />
<strong>Höganäs</strong> has applied a working method<br />
of raw material and currency hedging<br />
since 2008, designed to minimise<br />
the direct effects of fluctuations in raw<br />
material prices and exchange rates on the<br />
Group’s earnings. This working method<br />
means that price and currency risks<br />
related to purchasing and sales of metals<br />
are hedged more than previously, while<br />
currency risks resulting from various currency<br />
flows are hedged for a shorter term<br />
than before.<br />
The Finance Policy states how the different<br />
risks should be managed, and the<br />
risk mandates that have been granted.<br />
The Finance Policy covers financing,<br />
liquidity management, credit risks and<br />
H Ö G A N Ä S 2 0 1 0 19
R I S K M A N A G E M E N T<br />
managing all price risks that can be<br />
managed using derivatives, i.e. currencies,<br />
interest rates, certain raw materials<br />
and energy. The Board has appointed<br />
a Finance Committee whose duty is to<br />
monitor financing activities. <strong>Höganäs</strong>’<br />
finance unit is responsible for managing<br />
the Group’s financial risks and operates<br />
as an internal treasury. Currency, interest<br />
rate, metals and energy derivatives are<br />
used pursuant to mandates from the<br />
Board of Directors, Finance Committee<br />
and Group management.<br />
The Group purchases raw materials<br />
as metal and refines them, primarily into<br />
metal powder products. Purchase agreements<br />
stipulate pricing based on current<br />
market pricing with a predetermined<br />
time delay. The Group’s sales agreements<br />
also state that the price of metal powder<br />
includes a predetermined share of raw<br />
materials, whose pricing is based on current<br />
market prices with a predetermined<br />
time delay. To gain an accurate view of<br />
the Group’s raw material and currency<br />
risk, operations should be considered in<br />
two components. The first is purchases<br />
and sales of raw materials as metals, the<br />
second the industrial refining process of<br />
raw materials into metal powder products.<br />
Price risk arises when purchasing<br />
metal raw materials, usually in US<br />
dollars (USD) when the price of the purchase<br />
is determined. The price risk then<br />
exists from the day the price of the metal<br />
powder product that the raw material<br />
is included in is determined in accordance<br />
with the sales agreement. However,<br />
currency risk exists until the account<br />
receivable is settled.<br />
Raw material and currency risk can<br />
be limited by the counter value of the<br />
20 H Ö G A N Ä S 2 0 1 0<br />
Ni<br />
USD Mo<br />
Cu EUR<br />
total exposed values in the Group being<br />
bought or sold through forward contracts<br />
or other derivative instruments.<br />
The intention is to minimise the effect<br />
of price and exchange rate fluctuations<br />
in trading with raw materials over time,<br />
although not necessarily in a single<br />
quarter. The possibility of completely<br />
eliminating risks is limited by several factors.<br />
This would require access to perfect<br />
information on future transaction flows.<br />
Moreover, not all metals have functional<br />
market places, meaning that the cost of<br />
achieving effective price hedging on longterm<br />
contracts would be unreasonably<br />
high. In <strong>2010</strong>, metal derivative instruments<br />
were only used to hedge nickel,<br />
copper and molybdenum prices.<br />
Exposure in the industrial refinement<br />
process of raw materials into metal<br />
powder consists of the value-added.<br />
This value arises in several currencies<br />
within the Group, depending on where<br />
the product is refined and sold. The<br />
scale of the risk is also affected by the<br />
time interval when sales prices cannot<br />
be adjusted due to changes in valueadded.<br />
For a limited time, this risk can be<br />
minimised by the value of the exposure<br />
being bought or sold through forward<br />
contracts or other derivative instruments.<br />
The forecast accuracy of the Company’s<br />
transaction flow also limits the possibility<br />
of completely eliminating the risks.<br />
Using derivative instruments, <strong>Höganäs</strong><br />
can mitigate the effects of short-term<br />
exchange rate fluctuations. In the long<br />
term, <strong>Höganäs</strong> is always exposed to the<br />
effect of changed external conditions.<br />
<strong>Höganäs</strong> has selected a hedging strategy<br />
where forecast flows are hedged for up to<br />
15 months. For the long term, <strong>Höganäs</strong><br />
protects itself against currency risks by<br />
adapting operations to changing exogenous<br />
conditions.<br />
Readers should also note that a currency<br />
risk may be ‘direct’ or ‘indirect’.<br />
Direct exposure consists of contracted<br />
or forecast cash flow. However, indirect<br />
exposure consists of the exposure resulting<br />
from contract terms. The metal price<br />
surcharge model for customers is an<br />
example of this, where exchange rates are<br />
translated at a predetermined time before<br />
invoicing. Then, the indirect exposure is<br />
not immediately visible in the Group’s<br />
cash flow, but does affect earnings in the<br />
same way as if it had been.<br />
<strong>Höganäs</strong>’ reporting currency is the<br />
Swedish krona. Because a high share of<br />
<strong>Höganäs</strong>’ capital employed is denominated<br />
in foreign currencies, financing is<br />
arranged directly in these currencies to<br />
achieve the effective hedging of capital in<br />
convertible currencies.<br />
Finance risk is the risk associated with<br />
the Group’s financing needs resulting<br />
from loan agreements that expire and<br />
an increased need for working capital.<br />
Current credit facilities, which were<br />
MEUR 175 at year-end, were arranged<br />
with a syndicate of four banks in <strong>2010</strong><br />
and mature in spring 2013. In <strong>2010</strong>,<br />
<strong>Höganäs</strong> also used export funding provider<br />
Svensk Exportkredit (SEK) to arrange<br />
a short-term facility. The share of<br />
this facility drawn down at year-end and<br />
remaining volumes for other short-term<br />
credits are reported in Note 31. Interest<br />
swaps are used to manage interest risk.<br />
<strong>Höganäs</strong>’ finance policy stipulates that<br />
the basic strategy means that 40% of<br />
interest-bearing liabilities should have an<br />
interest-fixing period of over one year.
The permitted exemption mandates are<br />
stated in the policy, and divergences are<br />
reported back on a continuous basis.<br />
<strong>Höganäs</strong>’ hedging strategies in its<br />
Finance Policy:<br />
• Price and currency risks resulting from<br />
purchases and sales of raw materials<br />
are 90% hedged<br />
• Currency risks linked to the refining<br />
process are hedged at 90% for a horizon<br />
of up to 15 months<br />
• The net of outstanding accounts receivable<br />
and accounts payable is 100%<br />
hedged<br />
• Energy costs are hedged on an ongoing<br />
basis with a horizon of up to 18<br />
months.<br />
Price and currency risks when purchasing and selling metals<br />
Sensitivity analysis, financial risks<br />
An advance analysis stating the effect on<br />
Group earnings follows. The sensitivity<br />
analysis illustrates the effect of underlying<br />
exposure, i.e. the effect excluding<br />
hedging instruments. One exception is<br />
that interest risk is stated considering<br />
existing swaps. The analysis is based on<br />
forecast transaction volumes for 2011.<br />
Actual outcomes will be affected by the<br />
selection of the hedging level within the<br />
policy’s divergence mandates, the accuracy<br />
of forecasts and derivative instrument<br />
market conditions.<br />
Currency risks resulting from accounts<br />
payable and accounts receivable have not<br />
been factored into the sensitivity analysis<br />
because they are 100% hedged, and thus<br />
do not have any net effect on <strong>Höganäs</strong>’<br />
Income Statement and Balance Sheet in<br />
either the short or long term. Investments<br />
in foreign subsidiaries have also been<br />
1 Price volatility in <strong>2010</strong> was approx. 16% for copper, 31% for nickel and approx. 30% for molybdenum and scrap.<br />
2 Only a small share of annual volumes are exposed at any time.<br />
3 Price volatility in <strong>2010</strong> was 4-12%.<br />
4 Price volatility in <strong>2010</strong> was approx. 15% for oil/gas and 90% for electricity.<br />
5 Interest changes in <strong>2010</strong> were 0.6 percentage points.<br />
R I S K M A N A G E M E N T<br />
omitted. Currency effects of the revaluation<br />
of investments in foreign subsidiaries<br />
are offset by the currency effects from<br />
loans. Information on accounts receivable<br />
and investments in foreign subsidiaries is<br />
in Note 31.<br />
The tables below show the effect on the<br />
Company’s Income Statement that would<br />
arise from a given exchange rate or price<br />
change excluding hedging instruments.<br />
The timing of when the effect becomes<br />
visible in the Income Statement depends<br />
on <strong>Höganäs</strong>’ accounting principles.<br />
Gains or losses from hedging instruments<br />
are recognised first in the hedging<br />
provision in equity. They are then recognised<br />
at the time the hedge applies. Thus<br />
it is not possible to attain comprehensive<br />
matching between when effects from<br />
underlying exposure and hedging instruments<br />
are recognised in income.<br />
Metal Price and exchange rate fluctuation 1 Earnings effect of exposure, MSEK 2<br />
Copper +10% 1<br />
Nickel +10% 12<br />
Molybdenum +10% 2<br />
Scrap +10% -5<br />
Currency risks in the refinement process<br />
Currency Exchange rate fluctuation 3 Earnings effect of exposure, MSEK<br />
USD/SEK +10% 79<br />
EUR/SEK +10% 96<br />
JPY/SEK +10% 24<br />
Other +10% 24<br />
Total 223<br />
Energy prices<br />
Energy type Price and exchange rate fluctuation 4 Earnings effect of exposure, MSEK<br />
Electricity +10% -28<br />
Oil/gas +10% -14<br />
Interest risk (MSEK)<br />
Loan<br />
Interest rate change 5<br />
Earnings effect<br />
Earnings effect<br />
Earnings effect<br />
one-year horizon<br />
two-year horizon<br />
three-year horizon<br />
889 +1% -3 -7 -8<br />
H Ö G A N Ä S 2 0 1 0 21
T H E S H A R E<br />
The share<br />
<strong>Höganäs</strong> was listed on the Stockholm Stock Exchange back in 1903, when it was<br />
called <strong>Höganäs</strong> Billesholm. After a buy-out in 1987, the class B share was re-listed<br />
on the Stockholm stock exchange in 1994 and now trades on NASDAQ OMX Stockholm’s<br />
Mid Cap list. The share is a constituent of the Metals & Mining sub-index of the<br />
Materials sector.<br />
Type of shareholder<br />
Earnings per share and dividend<br />
24<br />
20<br />
16<br />
12<br />
8<br />
4<br />
0<br />
22%<br />
2006<br />
2007<br />
22 H Ö G A N Ä S 2 0 1 0<br />
2008<br />
2009<br />
26%<br />
23%<br />
29%<br />
Swedish institutions Swedish equity funds<br />
Swedish private investors Foreign shareholders<br />
<strong>2010</strong><br />
Dividend, SEK Earnings per share, SEK<br />
The closing price of <strong>Höganäs</strong>’ class B<br />
share in <strong>2010</strong> was SEK 263 (164), equivalent<br />
to market capitalisation of class B<br />
shares of MSEK 8,973 (5,595). The share<br />
price rose by 60% in <strong>2010</strong>, clearly above<br />
the sector index and the stock market<br />
overall. The NASDAQ OMX Stockholm<br />
rose by 23% and the Mid Cap index by<br />
12%, while the Materials sector index<br />
rose by 17% and the Metals & Mining<br />
sub-index by 22%. The <strong>Höganäs</strong> class B<br />
share set a high in the year of SEK 272<br />
on 21 and 23 December and a low of<br />
SEK 153 on 28 January.<br />
Share capital<br />
<strong>Höganäs</strong>’ share capital is<br />
SEK 175,494,660, divided between a total<br />
of 35,098,932 shares, of which 981,000<br />
are class A shares and 34,117,932 class B<br />
shares. Both share classes have a quotient<br />
value of SEK 5.00 per share and<br />
have equal rights to participation in the<br />
Company’s assets and earnings. Each class<br />
A share has ten votes and each class B<br />
share has one vote. Only the class B share<br />
is quoted on the stock market. A trading<br />
lot is one share.<br />
Share turnover<br />
With the introduction of the EU MiFiD<br />
directive, shares are now traded on<br />
marketplaces other than stock exchanges.<br />
Such marketplaces include Burgundy,<br />
Chi-X and Turquoise. Since introduction<br />
of the directive, trading in Swedish<br />
shares off NASDAQ OMX Stockholm<br />
has gradually increased. The <strong>Höganäs</strong><br />
share is listed on NASDAQ OMX<br />
Stockholm, and trading in Stockholm<br />
represented over 85% of total turnover<br />
of the share in <strong>2010</strong>. In 2009, the corresponding<br />
figure was 91%. A total of<br />
26.74 (12.67) million shares were traded<br />
in 86,793 (26,731) transactions, equivalent<br />
to a rate of turnover of 79% (37).<br />
The rate of turnover for the NASDAQ<br />
OMX Stockholm fell to 95% (119), while<br />
the rate of turnover for the Mid Cap list<br />
was unchanged at 66% (65).<br />
Share buy-backs<br />
The AGM of 26 April <strong>2010</strong> approved<br />
a re-purchase mandate of a maximum<br />
of 10% of class B shares in the period<br />
until the next AGM. <strong>Höganäs</strong> did<br />
not re-purchase any shares in <strong>2010</strong>.<br />
<strong>Höganäs</strong>’ holdings of treasury shares<br />
were unchanged at 293,800 class B shares<br />
at year-end <strong>2010</strong>, or 0.8% of the total<br />
number of class B shares.<br />
Ownership<br />
At year-end <strong>2010</strong>, <strong>Höganäs</strong> had 7,359<br />
(7,469) shareholders. At year-end <strong>2010</strong>,<br />
as at the previous year-end, the three<br />
largest shareholders in terms of capital<br />
were Lindéngruppen <strong>AB</strong>, <strong>AB</strong> Industrivärden<br />
and Didner & Gerge Fonder <strong>AB</strong><br />
with a total of 53.8% of the votes and<br />
41.7% of the capital.<br />
78.2% (82.4) of <strong>Höganäs</strong> <strong>AB</strong>’s share<br />
capital is held by Swedish investors<br />
and 21.8% (17.6) by foreign investors.<br />
Of the Swedish investors, it is mainly<br />
institutions that reduced their participating<br />
interests in the year, while foreign<br />
shareholders increased their participating<br />
interests. 25.9% (30.4) of Swedish-held<br />
<strong>Höganäs</strong> shares are held by institutions,<br />
23.4% (22.4) by mutual funds and 28.9%<br />
(29.6) by private individuals.
Swedish institutions and mutual funds<br />
increasing their holdings include<br />
DnB/Carlson fonder (8th) and AFA<br />
Försäkring (10th), which are new among<br />
<strong>Höganäs</strong>’ ten largest shareholders. Of<br />
foreign shareholders, Marathon Asset<br />
Management and the Norwegian<br />
Government increased their holdings.<br />
The largest foreign ownership is in the<br />
UK and US, holding 6.5% and 4.6% of<br />
capital respectively.<br />
Dividend<br />
The Board of Directors’ intention is to<br />
maintain annual dividend levels of some<br />
30-50% of income after tax. Dividends<br />
should reflect <strong>Höganäs</strong>’ profit levels, future<br />
prospects, cash flow and investment<br />
need and other relevant factors. <strong>Höganäs</strong><br />
also endeavours to maintain even growth<br />
of dividends.<br />
For the financial year <strong>2010</strong>, the Board<br />
of Directors is proposing a dividend of<br />
SEK 10, or 43% of income after tax,<br />
equivalent to a dividend yield of 3.8%<br />
per share, calculated on the closing price<br />
for the year. Since its initial public offering,<br />
<strong>Höganäs</strong> has had an average annual<br />
dividend yield of 2.9%.<br />
History of the share<br />
<strong>Höganäs</strong> was first listed on the Stockholm<br />
Stock Exchange back in 1903,<br />
when it was called <strong>Höganäs</strong> Billesholm.<br />
In 1987, Lindéngruppen <strong>AB</strong> acquired<br />
all the shares of the Company, resulting<br />
in a de-listing. The <strong>Höganäs</strong> share was<br />
re-listed on the then-Stockholm Stock<br />
Exchange in April 1994 and now trades<br />
on the Mid Cap list of NASDAQ OMX<br />
Stockholm. Lindéngruppen <strong>AB</strong> remains<br />
the Company’s largest shareholder.<br />
Investor relations<br />
<strong>Höganäs</strong> held a large number of meetings<br />
with representatives of financial<br />
institutions in <strong>Höganäs</strong>, Stockholm and<br />
London in <strong>2010</strong>. <strong>Höganäs</strong> arranges regular<br />
conference calls and presentations, as<br />
well as conducting investor conferences<br />
when publishing its interim and year-end<br />
reports.<br />
Largest shareholders<br />
Share price and turnover vs. index<br />
2006 2007 2008 2009 <strong>2010</strong><br />
T H E S H A R E<br />
Shareholder 30 Dec. <strong>2010</strong> % of votes * % of capital<br />
Lindéngruppen <strong>AB</strong> 7,650,000 37.8 21.8<br />
<strong>AB</strong> Industrivärden 3,550,000 8.1 10.1<br />
Didner & Gerge Fonder <strong>AB</strong> 3,448,486 7.9 9.8<br />
Marathon Asset Management 2,250,878 5.1 6.4<br />
Alecta 1,835,500 4.2 5.2<br />
Swedbank Robur fonder 1,069,959 2.5 3.0<br />
Lannebo fonder 1,066,000 2.4 3.0<br />
DnB/Carlson fonder 903,206 2.1 2.6<br />
Norwegian Government 795,802 1.8 2.3<br />
AFA Försäkring 757,690 1.7 2.2<br />
Total, ten largest shareholders 23,327,521 73.7 66.3<br />
*The 293,800 shares <strong>Höganäs</strong> re-purchased are not included in the stated vote percentages.<br />
Key indicators<br />
300<br />
250<br />
200<br />
150<br />
100<br />
50<br />
0<br />
2006 2007 2008 2009 <strong>2010</strong><br />
Earnings per share, SEK* 11.54 12.39 11.31 5.92 23.11<br />
Cash flow after investments per share, SEK* 12.30 9.00 6.30 18.00 11.80<br />
Equity per share, SEK* 75.40 79.50 69.10 76.20 93.05<br />
Dividend per share, SEK** 6.25 6.25 3.00 3.00 10.00<br />
Year-end share price * 179.50 136.75 70.00 164.00 263.00<br />
Dividend yield, %*** 3.5 4.6 4.3 1.8 3.8<br />
* According to definition on page 92<br />
** Board of Directors’ proposal for <strong>2010</strong><br />
*** Dividend as a percentage of year-end share price<br />
Financial analysts monitoring the <strong>Höganäs</strong> share<br />
Company Analyst<br />
<strong>AB</strong>G Sundal Collier Erik Pettersson<br />
Cheuvreux Björn Gustafsson<br />
Carnegie Investment Bank <strong>AB</strong> Andreas Koski<br />
Danske Bank Carl Holmqvist<br />
Handelsbanken Capital Markets Hampus Engellau<br />
Nordea Olof Krook<br />
SEB Enskilda Anders Trapp<br />
Swedbank Ola Södermark<br />
Ålandsbanken Anders Roslund<br />
Öhman Fondkommission David Jacobsson<br />
Share turnover, 000 <strong>Höganäs</strong> B NASDAQ OMX Stockholm Mid Cap SX Materials<br />
X<br />
M<br />
O<br />
Q<br />
A<br />
D<br />
S<br />
A<br />
N<br />
©<br />
5 000<br />
4 000<br />
3 000<br />
2 000<br />
1 000<br />
H Ö G A N Ä S 2 0 1 0 23<br />
0
C O R P O R AT E G O V E R N A N C E<br />
Corporate Governance <strong>Report</strong> <strong>2010</strong><br />
<strong>Höganäs</strong> applies the Swedish Code of Corporate Governance (“the Code”), and thus,<br />
in accordance with the stipulations of the Swedish <strong>Annual</strong> Accounts Act and the Code,<br />
hereby presents the Corporate Governance <strong>Report</strong> for <strong>2010</strong>.<br />
<strong>Höganäs</strong>’ corporate<br />
governance bodies<br />
<strong>Höganäs</strong> is a Swedish public limited<br />
company. <strong>Höganäs</strong>’ shareholders ultimately<br />
take decisions on the Company’s<br />
governance by appointing the Group’s<br />
Board of Directors, the Chairman of<br />
the Board and Auditors at the AGM. In<br />
turn, the Board of Directors is responsible<br />
for ongoing governance in the year<br />
and that this governance complies with<br />
laws and other external and internal<br />
governance instruments. The following<br />
<strong>Höganäs</strong>’ corporate governance bodies<br />
Nomination<br />
Committee<br />
Remuneration<br />
Committee<br />
24 H Ö G A N Ä S 2 0 1 0<br />
Board of Directors<br />
Goals, strategy<br />
and controls<br />
Information<br />
Election<br />
Audit<br />
Committee<br />
<strong>Report</strong>s<br />
and controls<br />
CEO and management<br />
Internal governance instruments<br />
Election<br />
Finance<br />
Committee<br />
Ethical Policy – the Group’s fundamental values<br />
on ethical issues<br />
Finance Policy – Instructions adopted by the<br />
Board that formalise the �nance function’s<br />
guidelines for �nance and currency risks, for<br />
example<br />
Communication Policy – the Group’s rules for<br />
external communication<br />
Insider Policy – formalises insider issues with<br />
instructions for insiders<br />
Environmental Policy – guidelines, limits and<br />
standards for the Group’s environmental activities<br />
model reviews how corporate governance<br />
is organised in <strong>Höganäs</strong>.<br />
Shareholders<br />
On 30 December <strong>2010</strong>, <strong>Höganäs</strong> had<br />
7,359 (7,469) shareholders. Lindéngruppen<br />
<strong>AB</strong> has been the Company’s main<br />
shareholder since the share was re-listed<br />
on the Stockholm Stock Exchange in<br />
1994. Otherwise, ownership is dominated<br />
by Swedish institutions and equity funds.<br />
At year-end <strong>2010</strong>, Swedish private inves-<br />
AGM<br />
Information<br />
Information<br />
Auditors<br />
Election<br />
Responsible for<br />
auditing the overall<br />
operation. <strong>Report</strong> to<br />
the Board and<br />
shareholders.<br />
External governance instruments<br />
The Swedish Companies Act,<br />
<strong>Annual</strong> Accounts Act,<br />
NASDAQ OMX Stockholm’s rules<br />
for issuers, other relevant laws<br />
and the Swedish Code of<br />
Corporate Governance.<br />
<strong>Höganäs</strong> is a Swedish public limited company. <strong>Höganäs</strong>’ shareholders ultimately take decisions on the Group’s<br />
governance by appointing the Group’s Board at the AGM, which in turn is the body responsible for ensuring compliance<br />
with laws and other external and internal governance instruments on a continuous basis in the year. The model<br />
reviews how corporate governance is organised in <strong>Höganäs</strong>.<br />
tors held 28.9% of the capital and 43.2%<br />
of the votes, directly or indirectly via<br />
companies. Foreign ownership was 21.8%<br />
of the capital and 17.4% of the vote at<br />
year-end. For more information on the<br />
<strong>Höganäs</strong> share and ownership structure,<br />
see pages 22–23.<br />
AGM<br />
<strong>Höganäs</strong>’ AGM <strong>2010</strong> was held on 26<br />
April in <strong>Höganäs</strong>, Sweden. All Board<br />
members attended the Meeting. Of the<br />
Company’s major shareholders, Lindéngruppen<br />
<strong>AB</strong>, <strong>AB</strong> Industrivärden, Alecta,<br />
Lannebo Fonder, If Skadeförsäkring <strong>AB</strong><br />
and SEB were represented at the Meeting.<br />
<strong>Höganäs</strong> conducts its AGM in Swedish.<br />
English-language documentation<br />
from the Meeting is available on order<br />
from the Company’s head office and<br />
from the Company’s website. All documentation<br />
from the AGM is available at<br />
<strong>Höganäs</strong>’ website, www.hoganas.com.<br />
A number of the most important resolutions<br />
of the AGM <strong>2010</strong> are reviewed<br />
below.<br />
Election of the Board of Directors<br />
and Chairman of the Board<br />
All Board members were re-elected, i.e.<br />
Anders G Carlberg, Alrik Danielson,<br />
Jenny Lindén Urnes, Bernt Magnusson,<br />
Bengt Kjell, Peter Gossas, Urban Jansson<br />
and Erik Urnes. Anders G Carlberg<br />
was re-elected as Chairman of the Board.<br />
Board and Audit fees<br />
The AGM resolved in accordance with<br />
the Nomination Committee’s proposal of<br />
unchanged fees totalling SEK 2,100,000<br />
to the Board of Directors, of which SEK<br />
450,000 to the Chairman of the Board,<br />
SEK 225,000 to each of the other members<br />
that are not employed by the Group<br />
and SEK 300,000 for committee work.<br />
Remuneration for committee work was
divided as SEK 50,000 each to external<br />
Board members of the Finance Committee<br />
and SEK 100,000 to the Chairman<br />
of the Audit Committee and SEK 50,000<br />
each to the two other external Board<br />
members on the Audit Committee. No<br />
fees would be payable for work on the<br />
Remuneration Committee.<br />
The AGM also resolved that audit<br />
fees would be payable according to open<br />
account.<br />
Remuneration to management<br />
The AGM resolved to adopt the Nomination<br />
Committee’s proposed guidelines for<br />
remunerating management. These guidelines<br />
are reproduced in full in the minutes<br />
of the meeting at www.hoganas.com.<br />
Dividend<br />
The AGM approved the Board’s proposal<br />
of an unchanged dividend of SEK<br />
3.00 per share. The dividend reflected<br />
continued prudence based on uncertainty<br />
on economic progress and <strong>Höganäs</strong>’<br />
continued stable financial position.<br />
Staff stock option plan<br />
The AGM approved the Board of Directors’<br />
proposal for a mandate for the Board<br />
to decide on the acquisition and transfer<br />
Read more at<br />
www.hoganas.com<br />
There is more information on corporate<br />
governance at <strong>Höganäs</strong> on the Internet,<br />
including<br />
• Corporate Governance <strong>Report</strong>s<br />
from 2005 onwards<br />
• Articles of Association<br />
• Policy documents<br />
• Information on the Nomination<br />
Committee<br />
• Information from previous AGMs,<br />
from 2004 onwards<br />
of class B shares with the intention of<br />
fulfilling and covering its commitments<br />
relating to the staff stock option plans of<br />
2007 and 2009.<br />
Other<br />
The AGM adopted principles of appointing<br />
a Nomination Committee ahead<br />
of the AGM 2011, which essentially<br />
corresponded to the principles applying<br />
since the AGM 2005.<br />
Nomination Committee<br />
Pursuant to a resolution at the AGM<br />
<strong>2010</strong>, <strong>Höganäs</strong>’ Nomination Committee<br />
for the AGM 2011 will consist<br />
of representatives of the four largest<br />
shareholders in terms of the vote on 31<br />
August <strong>2010</strong>, and the Chairman of the<br />
Board. For information on the composition<br />
of the Nomination Committee, see<br />
the Meeting documentation at <strong>Höganäs</strong>’<br />
website www.hoganas.com.<br />
Work of the Nomination Committee<br />
Ahead of the forthcoming AGM, the<br />
Nomination Committee’s duty is to prepare<br />
and submit proposals for electing<br />
the Chairman of the Meeting, election<br />
of the Chairman of the Board and other<br />
Board members, Directors’ fees and<br />
Ownership concentration<br />
Proportion of vote, %<br />
100<br />
80<br />
60<br />
40<br />
20<br />
0<br />
10 largest<br />
shareholders<br />
25 largest<br />
shareholders<br />
100 largest<br />
shareholders<br />
C O R P O R AT E G O V E R N A N C E<br />
remuneration to Auditors and Deputy<br />
Auditors (where applicable), and otherwise<br />
performing those duties incumbent<br />
on a Nomination Committee pursuant to<br />
the Code.<br />
The Nomination Committee held three<br />
meetings up to and including 31 December<br />
<strong>2010</strong>. The Nomination Committee<br />
appraises the work of the Board of<br />
Directors and its composition annually.<br />
This appraisal was conducted against the<br />
background of the Board of Directors<br />
having a suitable composition in terms<br />
of skills, experience and background<br />
considering <strong>Höganäs</strong>’ operations, and in<br />
accordance with the other criteria stated<br />
in the Code. The annual appraisal of the<br />
Board is the basis of the Nomination<br />
Committee’s proposals to the AGM.<br />
Work of the Board<br />
Chairman’s responsibilities<br />
The Chairman of the Board organizes<br />
and leads Board work so it is conducted<br />
in accordance with the Swedish Companies<br />
Act, other laws and ordinances,<br />
applicable rules for listed companies<br />
(including the Code) and the Board of<br />
Directors’ internal governance instruments.<br />
The Chairman monitors operations<br />
in dialogue with the CEO and is<br />
Attendance at AGMs<br />
Proportion of vote, % No. of shareholders<br />
80<br />
60<br />
40<br />
20<br />
0<br />
2006<br />
2007<br />
2008<br />
2009<br />
<strong>2010</strong><br />
300<br />
250<br />
200<br />
150<br />
100<br />
Proportion of vote, % No. of shareholders<br />
50<br />
H Ö G A N Ä S 2 0 1 0 25<br />
0
C O R P O R AT E G O V E R N A N C E<br />
Board of Directors<br />
Name Jenny Lindén Urnes Alrik Danielson Bernt Magnusson Anders G Carlberg Bengt Kjell Urban Jansson<br />
Elected in 2004 2005 1994 2009 2006 2007<br />
Position Board member and<br />
member of the Remuneration<br />
Committee<br />
26 H Ö G A N Ä S 2 0 1 0<br />
CEO and President<br />
of <strong>Höganäs</strong> <strong>AB</strong> and<br />
Chairman of the<br />
Finance Committee<br />
Board member and<br />
member of the Finance<br />
Committee<br />
Chairman of <strong>Höganäs</strong><br />
<strong>AB</strong>, Chairman of the<br />
Remuneration Committee<br />
and member of<br />
the Audit Committee<br />
Board member and<br />
Chairman of the Audit<br />
Committee and member<br />
of the Remuneration<br />
Committee<br />
Born 1971 1962 1941 1943 1954 1945<br />
Nationality Swedish Swedish Swedish Swedish Swedish Swedish<br />
Educational<br />
qualifications<br />
Other assignments Chairman and<br />
President of<br />
Lindéngruppen <strong>AB</strong><br />
Chairman of<br />
<strong>AB</strong> Wilh. Becker and<br />
Stiftelsen Färgfabriken.<br />
Board member of<br />
Moorbrook Textiles Ltd<br />
Background CEO and President<br />
of <strong>AB</strong> Wilh. Becker.<br />
Directorships in<br />
<strong>AB</strong> Wilh. Becker and<br />
subsidiaries<br />
Remuneration *<br />
Owner and<br />
related parties’<br />
shareholdings<br />
Attendance at Board<br />
meetings<br />
Attendance at<br />
Remuneration Committee<br />
meetings<br />
Attendance at Audit<br />
Committee meetings<br />
Attendance at<br />
Finance Committee<br />
meetings<br />
Affiliation/nonaffiliation<br />
**<br />
Board member and<br />
member of the<br />
Finance<br />
Committee<br />
B.A. (Phil.) B.Sc. (Econ.) M.Sc. (Pol. Sci.) B.Sc. (Econ.) B.Sc. (Econ.) Certified banking<br />
economist<br />
20,000 privately<br />
and 7,650,000 via<br />
company<br />
Board member of the<br />
Swedish Steel Producers’<br />
Association, EFG<br />
European Furniture<br />
Group <strong>AB</strong> and the<br />
Chamber of Commerce<br />
and Industry of<br />
Southern Sweden<br />
CEO of SKF do Brazil<br />
and Vice President<br />
of <strong>AB</strong> SKF’s Industrial<br />
Division<br />
Chairman of the Board<br />
of Kwintet <strong>AB</strong> and<br />
Pharmadule <strong>AB</strong>, Board<br />
member of Fare office<br />
<strong>AB</strong>, Coor Service<br />
Management <strong>AB</strong>, Net<br />
Insight <strong>AB</strong>, Nordia<br />
Innovation <strong>AB</strong>, STC<br />
Interfinans and Pricer<br />
<strong>AB</strong>.<br />
Chairman of Swedish<br />
Match <strong>AB</strong>, CEO and<br />
President of Nordstjernan<br />
<strong>AB</strong>, Chairman<br />
and President of NCC<br />
<strong>AB</strong>, Chairman of<br />
Nobel Industrier <strong>AB</strong>,<br />
Assi Domän <strong>AB</strong> and<br />
Skandia <strong>AB</strong>.<br />
Board member of Axel<br />
Johnson Inc.,<br />
Mekonomen <strong>AB</strong>,<br />
Svenskt Stål <strong>AB</strong><br />
(SS<strong>AB</strong>), Sapa <strong>AB</strong>,<br />
Säkl <strong>AB</strong>,<br />
Beijer Alma <strong>AB</strong> and<br />
Sweco <strong>AB</strong><br />
CEO of Axel<br />
Johnson Int. <strong>AB</strong>,<br />
Nobel Industries Sweden<br />
<strong>AB</strong>, J S Saba <strong>AB</strong>,<br />
SVP Svenskt Stål <strong>AB</strong><br />
(SS<strong>AB</strong>).<br />
CEO of <strong>AB</strong> Handel och<br />
Industri, Chairman of<br />
Indutrade <strong>AB</strong> and<br />
Hemfosa <strong>AB</strong>.<br />
Board member of<br />
Pandox <strong>AB</strong> and<br />
Helsingborgs Dagblad<br />
VP Industrivärden<br />
(Head of Investment).<br />
Head of Corporate<br />
Finance, Securum<br />
and Senior Partner of<br />
Navet <strong>AB</strong><br />
18,500 17,500 5,000 0 5,000<br />
9/9 9/9 9/9 9/9 7/9 9/9<br />
2/2 - - 2/2 2/2 -<br />
- 3/3 - 3/3 3/3 -<br />
- 2/2 2/2 - - 2/2<br />
Affiliated to major<br />
shareholders<br />
Affiliated to the<br />
company and<br />
management<br />
Chairman of Bergendahls,<br />
Rezidor<br />
Hotel Group, HMS<br />
Networks, Global<br />
Health Partner <strong>AB</strong>,<br />
Svedbergs, et al.<br />
Board member of<br />
<strong>AB</strong> Wilh. Becker,<br />
Clas Ohlson <strong>AB</strong>, SEB,<br />
et al.<br />
CEO of Ratos <strong>AB</strong> and<br />
senior positions within<br />
SEB and Incentive<br />
Group.<br />
Non-affiliated Non-affiliated Non-affiliated Non-affiliated
C O R P O R AT E G O V E R N A N C E<br />
Name Peter Gossas Erik Urnes Karl-Henry Boo Tony Petersson Gary Paulsson Ola Litström<br />
Elected in 2008 2009 1993 2006 2006 2008<br />
Position Board member Board member Union representative<br />
on the Board of<br />
Directors<br />
Union representative<br />
on the Board of<br />
Directors<br />
Union representative<br />
on the Board of<br />
Directors<br />
Born 1949 1971 1959 1966 1965 1969<br />
Nationality Swedish Norwegian Swedish Swedish Swedish Swedish<br />
Educational<br />
qualifications<br />
B.Sc. (Eng.) B. Eng. (Mechanical<br />
Engineering), MBA<br />
Other assignments CEO of the Sandvik<br />
Materials Technology<br />
business area,<br />
Chairman of the Swedish<br />
steel and metals<br />
employers’ conf.,<br />
Sandvik Heating Technology<br />
<strong>AB</strong>, Sandvik<br />
Process Systems <strong>AB</strong>,<br />
Sandvik Asia Ltd (India)<br />
and Sandvik<br />
South East Asia Ltd.<br />
Background Various positions with<br />
SS<strong>AB</strong>, Site Manager<br />
and various Divisional<br />
Manager positions in<br />
Avesta Sheffield.<br />
Remuneration *<br />
Owner and<br />
related parties’<br />
shareholdings<br />
Attendance at Board<br />
meetings<br />
Attendance at<br />
Remuneration<br />
Committee meetings<br />
Attendance at Audit<br />
Committee meetings<br />
Attendance at<br />
Finance Committee<br />
meetings<br />
Affiliation/<br />
non-affiliation **<br />
CEO of <strong>AB</strong> Wilh.<br />
Becker, Chairman<br />
of Becker Industrial<br />
Coatings Holding <strong>AB</strong>,<br />
and ColArt International<br />
Holdings Ltd.<br />
Board member of<br />
Lindéngruppen <strong>AB</strong><br />
and <strong>AB</strong> Wilh. Becker<br />
Strategy Consultant,<br />
Bain & Company,<br />
Investment Manager,<br />
Browallia Ltd. and<br />
Reuters Greenhouse<br />
Fund, CEO of ColArt<br />
International Holdings<br />
0 Related parties own<br />
20,000 shares privately<br />
and 7,650,000 shares<br />
through company<br />
Senior high school,<br />
engineering<br />
Representative of the<br />
Unionen trade union at<br />
<strong>Höganäs</strong> <strong>AB</strong><br />
Chairman of IF Metall<br />
at <strong>Höganäs</strong> <strong>AB</strong><br />
Member of IF Metall at<br />
<strong>Höganäs</strong> <strong>AB</strong><br />
0 0 0 0<br />
9/9 9/9 9/9 9/9 9/9 9/9<br />
- - - - - -<br />
- 3/3 1/1 - - -<br />
- - - - - -<br />
Non-affiliated Affiliated to major<br />
shareholder<br />
Union representative<br />
on the Board of<br />
Directors<br />
BSc. (Eng.) civil<br />
engineering,<br />
materials<br />
technology<br />
Member of Akademikerföreningen<br />
at<br />
<strong>Höganäs</strong> <strong>AB</strong><br />
Former application<br />
engineer at Lign<br />
Multiwood <strong>AB</strong><br />
* The AGM <strong>2010</strong> resolved on unchanged remuneration to the Board of Directors totalling SEK 2,100,000, with the Chairman of the Board receiving SEK 450,000 and other<br />
members elected by the AGM, but not employed by the Group receiving SEK 225,000 each. The remaining SEK 300,000 would be payable as fees for committee work, at<br />
SEK 50,000 each to two external members of the Company’s Finance Committee and SEK 100,000 to the Chairman of the Audit Committee, and SEK 50,000 each to two<br />
external members of the Audit Committee, while no fees would be payable for work on the Remuneration Committee. More information on remuneration to the Board of Directors<br />
in Note 25 on pages 80–81 of the <strong>Annual</strong> <strong>Report</strong>.<br />
** The judgment on the Board’s affiliation/non-affiliation has been conducted pursuant to the Code’s criteria for non-affiliation.<br />
H Ö G A N Ä S 2 0 1 0 27
C O R P O R AT E G O V E R N A N C E<br />
responsible for other Board members<br />
gaining the information necessary to perform<br />
the Board’s duties. The Chairman<br />
participates in appraisal and development<br />
issues regarding the Group’s senior<br />
managers. The Chairman represents the<br />
Company on ownership issues.<br />
Board of Directors’ responsibilities<br />
Each year, the Board adopts written rules<br />
of procedure that formalise the Board’s<br />
activities and its internal division of<br />
responsibilities including its Committees,<br />
decision-making processes within the<br />
Board, procedures for Board meetings<br />
and the Chairman’s duties. The Board<br />
also issues instructions for the Chief Executive<br />
Officer and instructions for financial<br />
reporting to the Board of Directors.<br />
The Board also adopted several other<br />
policies for the Group’s operations. The<br />
Board supervises the Chief Executive<br />
Officer’s work through the continuous<br />
monitoring of operations in the year.<br />
The Board is responsible for organizational<br />
resources, management and guidelines<br />
for administering the Company’s<br />
affairs being expediently structured, and<br />
that internal governance is satisfactory.<br />
The Board is also responsible for developing<br />
and monitoring the Company’s<br />
strategies through plans and objectives,<br />
decisions on acquisitions and divestments<br />
of operations, major investments<br />
and additions to, and replacements in,<br />
Composition of the Nomination Committee<br />
28 H Ö G A N Ä S 2 0 1 0<br />
the Group management. The Board<br />
presents the annual financial statement at<br />
the AGM.<br />
Work of the Board in <strong>2010</strong><br />
The current rules of procedure stipulate<br />
that the Board should meet on at<br />
least four scheduled occasions and one<br />
meeting following election each year.<br />
Moreover, separate meetings, chiefly by<br />
telephone in tandem with the issuance of<br />
quarterly reports, and additionally when<br />
the situation requires.<br />
Scheduled meetings take place in<br />
February, April, August/September and<br />
November/December.<br />
The Company’s Chief Financial Officer<br />
and Board Secretary Attorney-at-<br />
Law Ragnar Lindqvist also attend Board<br />
meetings. Other employees of the Company<br />
attend Board meetings to report on<br />
special issues, or when otherwise considered<br />
appropriate. The Chief Executive<br />
Officer ensures that the invitation to the<br />
Meeting, with an agenda and written<br />
information for meetings, is sent to each<br />
Board member a week before each Board<br />
meeting if possible.<br />
Nine Board meetings were held in<br />
<strong>2010</strong>. Regular business at each meeting<br />
includes a review of profit performance,<br />
financial position, reports from committees<br />
and investment decisions. The<br />
agendas of some scheduled meetings also<br />
consider the following matters:<br />
Name Representing Position<br />
• February – Year-end <strong>Report</strong>, Audit<br />
<strong>Report</strong>, annual financial statement,<br />
proposed appropriation of profit,<br />
draft <strong>Annual</strong> <strong>Report</strong> and Corporate<br />
Governance <strong>Report</strong>, annual statement<br />
on the <strong>Höganäs</strong> Group’s PRI pension<br />
fund, and matters requiring decisions<br />
or approval by the AGM.<br />
• April – investment update and market.<br />
• August/September – strategy.<br />
• November/December – earnings goals<br />
for the coming year, Audit <strong>Report</strong>,<br />
capital structure, evaluation of the<br />
need for internal audit, appraisal of<br />
the Chief Executive Officer’s work,<br />
appraisal of the Board’s work and appraisal<br />
of compliance with the Code.<br />
In <strong>2010</strong>, the work of the Board also<br />
focused on investments, Asia/China and<br />
a number of development projects.<br />
Appraisal of the work of the Board<br />
The Chairman is responsible for the<br />
Board continuously deepening its knowledge<br />
of the Company, and that Board<br />
activities are appraised, and the Nomination<br />
Committee receives this appraisal.<br />
The appraisal process is as follows:<br />
the Chairman of the Board conducts a<br />
questionnaire-based evaluation of the<br />
work of the Board among Board members<br />
after consulting the Nomination<br />
Committee. In addition to this questionnaire,<br />
the Chairman also discusses Board<br />
activities orally with all Board mem-<br />
Participating interest<br />
(votes) of <strong>Höganäs</strong>, % ¹<br />
Jenny Lindén Urnes Lindéngruppen <strong>AB</strong> CEO, Lindéngruppen 37.8<br />
Carl-Olof By <strong>AB</strong> Industrivärden Shareholders’ representative 8.1<br />
Henrik Didner Didner & Gerge Fonder <strong>AB</strong><br />
Fund Manager, Chairman of Didner<br />
& Gerge Fonder <strong>AB</strong><br />
7.7<br />
Ramsay Brufer Alecta Shareholders’ representative 5.1<br />
Anders G Carlberg - Chairman of the Board of <strong>Höganäs</strong> 0.0<br />
Total 58.7<br />
1 At the time of the Nomination Committee’s appointment.<br />
The composition of the Nomination Committee was reported in <strong>Höganäs</strong>’ Nine-month Interim <strong>Report</strong>, which was published on 22 October <strong>2010</strong>. Jenny Lindén Urnes is<br />
Chairman of the Nomination Committee. The Nomination Committee held three meetings after the AGM <strong>2010</strong>. There is no remuneration to the members of the Nomination<br />
Committee.
ers. The Chairman of the Board then<br />
submits the results of the appraisal to the<br />
Board and Nomination Committee.<br />
Board Committees<br />
The Board appoints members of Audit,<br />
Remuneration and Finance Committees<br />
internally at the Board meeting following<br />
election, held immediately after the AGM.<br />
The procedure for Committees is arranged<br />
so that each Committee Chairman is<br />
responsible for convening and agendas for<br />
Committee meetings. Minutes are taken<br />
at each meeting. After each meeting, the<br />
Committee makes a report to the Board<br />
regarding its work. All Board members<br />
and deputies receive copies of the minutes<br />
of Committee meetings.<br />
Audit Committee<br />
Composition<br />
Each year, the Board appoints an internal<br />
Audit Committee at the Board meeting<br />
following election after the AGM.<br />
The Board’s rules of procedure stipulate<br />
that this Committee will consist of at<br />
least three Board members. In <strong>2010</strong>, the<br />
Committee consisted of Chairman of the<br />
Board Anders G Carlberg, Bengt Kjell,<br />
appointed as Chairman of the Committee,<br />
and Erik Urnes.<br />
<strong>Höganäs</strong>’ Chief Financial Officer,<br />
Group Accounting Manager and external<br />
Auditors attend Committee meetings.<br />
SEK 100,000 of fees were paid to the<br />
Chairman of the Committee, and SEK<br />
50,000 each to the other members of the<br />
Committee.<br />
Duties<br />
The Committee’s activities are formalised<br />
through dedicated instructions adopted<br />
by the Board as part of its rules of procedure.<br />
The Committee’s duties are:<br />
• Ongoing discussion of the effectiveness<br />
of the Company’s reporting and financial<br />
controls with external Auditors<br />
and the Corporate Management, and<br />
considering potential recommendations<br />
to improve internal controls over<br />
financial reporting.<br />
• Ongoing discussion of the Company’s<br />
current risk outlook, risk exposure<br />
and measures taken or planned by<br />
the Corporate Management to limit,<br />
monitor or control such risks with the<br />
Corporate Management and external<br />
Auditors.<br />
• Participate in planning the audit<br />
process, monitoring the external audit<br />
and quality-assuring the Company’s<br />
financial communications.<br />
• Participate in the adoption of policies<br />
regarding financial matters.<br />
• Consult on matters regarding tendering<br />
for Auditors and remuneration to<br />
Auditors for the Board of Directors.<br />
• Monitor and appraise the work of the<br />
Auditors.<br />
• State guidelines and participate in<br />
decisions regarding tendering on non<br />
audit-related consulting services from<br />
external Auditors.<br />
Authorisation to make decisions<br />
No authorisation to make decisions on<br />
any individual issue has been delegated<br />
to the Audit Committee.<br />
Work in the year<br />
Committee work in the year was conducted<br />
pursuant to the instructions the<br />
Board adopted for Committee work.<br />
The Committee met on three occasions<br />
in <strong>2010</strong>, when all members attended. At<br />
all meetings, the Committee held reviews<br />
with, and received reports from, the<br />
Company’s external Auditors.<br />
Remuneration Committee<br />
Composition<br />
Each year, the Board appoints an internal<br />
Remuneration Committee at the<br />
Board meeting following election after<br />
the AGM. The rules of procedure of the<br />
Board stipulate that the Chairman of the<br />
Committee must be the same person as<br />
the Chairman of the Board. In <strong>2010</strong>, the<br />
Committee consisted of Chairman of the<br />
Board Anders G Carlberg, and members<br />
Jenny Lindén Urnes and Bengt Kjell.<br />
In addition, if it considers this appropriate,<br />
the Committee can co-opt<br />
other representatives of the Corporate<br />
Management or other suitable person to<br />
attend meetings. However, such individuals<br />
do not participate in matters relating<br />
to their own remuneration.<br />
No fees were paid for work on the<br />
Remuneration Committee.<br />
C O R P O R AT E G O V E R N A N C E<br />
Duties<br />
The Committee’s work is formalised<br />
through dedicated instructions adopted<br />
by the Board as a part of its rules of<br />
procedure. The Committee considers<br />
and consults on remuneration principles<br />
and remuneration matters affecting the<br />
Corporate Management, share-based<br />
incentive schemes and general profitrelated<br />
bonus schemes. The Committee<br />
also monitors and evaluates<br />
performance-related pay programmes<br />
for the Corporate Management, the application<br />
of remuneration principles and<br />
applicable remuneration structures and<br />
remuneration levels.<br />
The Board also assigns the Committee<br />
to take responsibility for submitting<br />
proposals for remuneration principles<br />
and other employment terms for the<br />
Corporate Management for approval by<br />
the AGM.<br />
Authorisation to make decisions<br />
No authorisation to make decisions on<br />
any individual issue has been delegated<br />
to the Remuneration Committee.<br />
Work in the year<br />
The Remuneration Committee held two<br />
meetings in <strong>2010</strong>, when all members<br />
attended. Committee work in the year<br />
was conducted in accordance with the<br />
instructions the Board adopted for Committee<br />
work.<br />
Finance Committee<br />
Composition<br />
Each year, the Board appoints an internal<br />
Finance Committee at the Board<br />
meeting following election after the<br />
AGM. The Board’s rules of procedure<br />
stipulate that the Committee will consist<br />
of three members, and the Company’s<br />
Chief Executive Officer will be its Chairman.<br />
In <strong>2010</strong>, the Committee consisted<br />
of Alrik Danielson, Chairman, and<br />
members Bernt Magnusson and Urban<br />
Jansson. <strong>Höganäs</strong>’ Chief Financial Officer,<br />
Treasury Manager and an external<br />
financial adviser also attend meetings.<br />
SEK 50,000 of fees were paid to each<br />
of the two external members of the<br />
Committee for <strong>2010</strong>.<br />
H Ö G A N Ä S 2 0 1 0 29
C O R P O R AT E G O V E R N A N C E<br />
Duties<br />
The Committee’s work is formalised by<br />
dedicated instructions adopted by the<br />
Board as part of its rules of procedure.<br />
The duty of the Finance Committee is to<br />
monitor, and within its delegated mandate,<br />
to reach decisions on affairs relating<br />
to financial risks and transactions, metal<br />
hedging and hedging electric power within<br />
the auspices of the company’s Finance<br />
Policy, which formalises management of<br />
the Group’s currency, metal and electricity<br />
exposure.<br />
Authorisation to make decisions<br />
No authorisation to make decisions on<br />
any individual issue has been delegated<br />
to the Finance Committee.<br />
Work in the year<br />
The Finance Committee held two meetings<br />
in <strong>2010</strong>, when all members attended.<br />
Linus Ericsson, AGL, has participated<br />
in the Committee as an external financial<br />
adviser since 2003.<br />
Chief Executive Officer’s<br />
responsibilities<br />
The Chief Executive Officer leads operations<br />
pursuant to the Swedish Companies<br />
Act, and within the limits decided by<br />
the Board of Directors. In consultation<br />
with the Chairman of the Board, the<br />
Chief Executive Officer prepares the necessary<br />
information and decision-support<br />
data ahead of Board meetings, presents<br />
issues and explains proposed decisions.<br />
Remuneration to senior managers in <strong>2010</strong> (MSEK)<br />
30 H Ö G A N Ä S 2 0 1 0<br />
Basic salary<br />
The Chief Executive Officer also keeps<br />
the Board informed of progress of the<br />
Company’s profits and operations on an<br />
ongoing basis between Board meetings.<br />
The CEO submits monthly reports to the<br />
Board of Directors. The Chief Executive<br />
Officer leads the Group management’s<br />
work and reaches decisions in consultation<br />
with other members of management.<br />
The corporate management<br />
conducts regular operational reviews led<br />
by the Chief Executive Officer.<br />
Guidelines for remuneration<br />
and other employment terms<br />
for Corporate Management<br />
The AGM <strong>2010</strong> approved the Board’s<br />
proposed guidelines for remuneration<br />
and other employment terms for<br />
corporate management. The principles<br />
were unchanged from those approved by<br />
the AGM 2009. The principles stipulate<br />
items including remuneration consisting<br />
of a basic and a performance-related<br />
component, and that the performancerelated<br />
component will not exceed the<br />
basic component, and normally not<br />
exceed six months’ salary.<br />
Pursuant to an AGM resolution, the<br />
Board of Directors is entitled to diverge<br />
from these principles in individual cases<br />
in special circumstances. The complete<br />
guidelines are included in the AGM documentation<br />
on <strong>Höganäs</strong>’ website, www.<br />
hoganas.com. Complete information on<br />
management remuneration is stated on<br />
pages 80–81 of the <strong>Annual</strong> <strong>Report</strong>.<br />
Performancerelated<br />
pay Other benefits Pension cost<br />
Auditors<br />
Elected Auditor<br />
The AGM 2007 elected KPMG Bohlins<br />
<strong>AB</strong> as Auditor until the AGM 2011. Alf<br />
Svensson was registered as Senior Auditor<br />
at the Meeting.<br />
Auditors’ work<br />
The Auditors follow an audit plan,<br />
incorporating views from the Board of<br />
Directors. The Auditors report their observations<br />
to the Board, partly during the<br />
audit process, and finally, coincident with<br />
adopting the <strong>Annual</strong> <strong>Report</strong>. The Auditors<br />
attend the AGM and make a report,<br />
stating an opinion on the audit process.<br />
In <strong>2010</strong>, the Auditors had consulting<br />
assignments relating to Group audit<br />
matters and tax advice. The Auditors are<br />
elected for the period until the end of the<br />
AGM 2011.<br />
Alf Svensson<br />
Senior Auditor<br />
Born: 1949<br />
<strong>Höganäs</strong>’ Auditor since: 2003<br />
Authorised Public Accountant since: 1979<br />
Main employment/assignments: auditing,<br />
consulting IFRS, due diligence and<br />
prospectuses.<br />
Other public companies: Peab <strong>AB</strong>, BE<br />
Group <strong>AB</strong>, Nederman <strong>AB</strong>, Midsona <strong>AB</strong><br />
and Nolato <strong>AB</strong>.<br />
Other: Partner of KPMG since 1984. Board<br />
member of KPMG <strong>AB</strong>.<br />
Share-based<br />
payment Total<br />
CEO 5.3 2.6 0.2 1.8 2.3 12.2<br />
SVP 1.7 0.5 0.1 0.5 0.8 3.6<br />
Other management 17.0 6.1 2.5 3.5 7.1 36.2<br />
Total 24.0 9.2 2.8 5.8 10.2 52.0<br />
Remuneration to Auditors (MSEK)<br />
Year Auditing Other Total<br />
2008 4.2 1.4 5.6<br />
2009 5.5 1.6 7.1<br />
<strong>2010</strong> 5.2 1.2 6.4
Management<br />
Standing left to right: Per Engdahl, Alrik Danielson, Ulf Holmqvist, Anders Andersson, Claudinei Reche<br />
Sitting left to right: Hans Söderhjelm, Carl Eklund, Sven Lindskog, Avinash Gore, Fredrik Emilson, Srini V Srinivasan<br />
Alrik Danielson<br />
CEO and President<br />
Employed since: 2005<br />
Born: 1962<br />
Educational qualifications: B.Sc. (Econ.)<br />
Previous positions: CEO of SKF do Brazil and<br />
Vice President of SKF’s Industrial Division<br />
Board member: the Swedish Steel Producers’<br />
Association, EFG European Furniture Group <strong>AB</strong><br />
and the Chamber of Commerce and Industry of<br />
Southern Sweden.<br />
<strong>Höganäs</strong> shareholdings: 18,500<br />
Option holdings: 36,720<br />
Ulf Holmqvist<br />
Senior Vice President<br />
Employed since: 1988<br />
Born: 1954<br />
Educational qualifications: B.Sc. (Eng.)<br />
Previous positions: positions in <strong>AB</strong>B Robotics<br />
<strong>Höganäs</strong> shareholdings: 7,500<br />
Option holdings: 13,219<br />
Anders Andersson<br />
Vice President, HR<br />
Employed since: 1977<br />
Born: 1951<br />
Educational qualifications: B. Sc.<br />
Previous positions: public sector<br />
<strong>Höganäs</strong> shareholdings: 0<br />
Option holdings: 13,219<br />
Sven Lindskog<br />
Chief Financial Officer<br />
Employed since: 2007<br />
Born: 1963<br />
Educational qualifications: B.Sc. (Econ.)<br />
Previous positions: CFO Sardus <strong>AB</strong>, Finance<br />
Director of Unilever Nordic and various positions<br />
in the Unilever Group.<br />
<strong>Höganäs</strong> shareholdings: 1,000<br />
Option holdings: 13,219<br />
Hans Söderhjelm<br />
Vice President, Marketing & Product Development<br />
Employed since: 1984<br />
Born: 1955<br />
Educational qualifications: M.Sc. (Met.)<br />
Previous positions: Research Assistant, RIT<br />
<strong>Höganäs</strong> shareholdings: 11,100<br />
Option holdings: 13,219<br />
Carl Eklund<br />
President, <strong>Höganäs</strong> Japan KK<br />
Employed since: 2004<br />
Born: 1953<br />
Educational qualifications: B.Sc. (Eng.)<br />
Previous positions: CEO of Volvo Nippon KK<br />
<strong>Höganäs</strong> shareholdings: 10,000<br />
Option holdings: 13,219<br />
Fredrik Emilson<br />
Vice President, Europe region<br />
Employed since: <strong>2010</strong><br />
Born: 1969<br />
Educational qualifications: B.Sc. (Econ.)<br />
Previous positions: CEO of Pergo Europe,<br />
CEO of Trelleborg Waterproofing<br />
<strong>Höganäs</strong> shareholdings: 0<br />
Option holdings: 9,000<br />
Per Engdahl<br />
Vice President, Asia region<br />
CEO of <strong>Höganäs</strong> (China) Co. Ltd.<br />
CEO of <strong>Höganäs</strong> Taiwan Ltd.<br />
CEO of <strong>Höganäs</strong> Korea Ltd.<br />
Employed since: 1985<br />
Born: 1958<br />
Educational qualifications: M.Sc. (Met.)<br />
Previous positions: Director of Sales and<br />
Business Development of <strong>Höganäs</strong> <strong>AB</strong>, SS<strong>AB</strong><br />
<strong>Höganäs</strong> shareholdings: 3,000<br />
Option holdings: 13,219<br />
C O R P O R AT E G O V E R N A N C E<br />
Avinash Gore<br />
Vice President, North America region<br />
President, North American <strong>Höganäs</strong>, Inc.<br />
Employed since: 2002<br />
Born: 1954<br />
Educational qualifications: B.Sc. (Eng.), M.B.A.<br />
Previous positions: Alfa Laval <strong>AB</strong> in India, Africa,<br />
Australia and Denmark<br />
<strong>Höganäs</strong> shareholdings: 0<br />
Option holdings: 13,219<br />
Claudinei Reche<br />
Vice President, South America region<br />
President of <strong>Höganäs</strong> Brasil Ltda<br />
Employed since: 2005<br />
Born: 1967<br />
Educational qualifications: B.Sc. (Econ)<br />
Previous positions: Sales Manager DaimlerChrysler<br />
and Sales Director at SKF<br />
<strong>Höganäs</strong> shareholdings: 0<br />
Option holdings: 13 219<br />
Srini V Srinivasan<br />
Vice President, India region<br />
CEO of <strong>Höganäs</strong> India Pvt Ltd.<br />
Employed since: 2008<br />
Born: 1955<br />
Educational qualifications: B. Tech (Metallurgy),<br />
M.B.A.<br />
Previous positions: President of GKN Sinter<br />
Metals Ltd., India<br />
<strong>Höganäs</strong> shareholdings: 0<br />
Option holdings: 13,219<br />
H Ö G A N Ä S 2 0 1 0 31
C O R P O R AT E G O V E R N A N C E<br />
Systems for internal control<br />
and risk management<br />
Pursuant to the Swedish Companies Act<br />
and the Code, the Board is responsible<br />
for internal control over financial reporting.<br />
This review has been prepared pursuant<br />
to the Swedish <strong>Annual</strong> Accounts<br />
Act and the Code, and is thus confined<br />
to internal control and risk management<br />
relating to financial reporting.<br />
In 2005, <strong>Höganäs</strong> decided to introduce<br />
the COSO framework for internal<br />
controls over financial reporting. The<br />
framework was launched in 1992 by the<br />
Committee of Sponsoring Organizations<br />
of the Treadway Commission (COSO).<br />
A review of the most important aspects<br />
of <strong>Höganäs</strong>’ systems for internal control<br />
and risk management relating to financial<br />
reporting follows.<br />
Control environment<br />
Effective work of the Board is the<br />
basis of good internal control and risk<br />
management. The Company’s Board<br />
of Directors has created clear working<br />
processes and procedures for its work<br />
and the Board’s Committees. Deciding a<br />
framework of internal governance to be<br />
applied in the Group and to formulate<br />
and approve a number of fundamental<br />
policies, guidelines and frameworks related<br />
to financial reporting is an important<br />
part of the work of the Board. These<br />
include a Code of Conduct, Risk Policy,<br />
reporting systems and Finance Policy.<br />
The Board evaluates the performance<br />
of operations and results of operations<br />
on an ongoing basis through an<br />
expedient package of reports including<br />
operational and profit outcomes, financial<br />
position, cash flow, rolling forecasts,<br />
analysis of key indicators and significant<br />
operational and financial information.<br />
32 H Ö G A N Ä S 2 0 1 0<br />
Risk Assessment<br />
The Board of Directors has decided that<br />
the Company will conduct a risk analysis<br />
of financial reporting on a yearly basis.<br />
Income Statement and Balance Sheet<br />
items subject to an increased risk of<br />
significant misstatement are identified in<br />
the risk assessment. In the Company’s<br />
operations, these risks mainly lie in fixed<br />
assets, financial instruments, inventories,<br />
accounts receivable, provisions, accrued<br />
expenses, tax and revenue recognition.<br />
Risk management is dependent on<br />
a series of points such as effects on<br />
financial reporting, the outcome of the<br />
Income Statement, business processes,<br />
external factors and the risk of fraud.<br />
The result of the risk analysis is a series<br />
of activities aimed at identifying control<br />
measures and issuing the necessary<br />
instructions and controls.<br />
Controlling<br />
The Company’s control documents for<br />
financial reporting are mainly policies<br />
and guidelines that are continuously<br />
updated and communicated through the<br />
appropriate channels. Pursuant to the<br />
rules of procedure for the Audit Committee,<br />
a review of the results of the risk<br />
assessment and the control measures<br />
taken is conducted yearly. The Chairman<br />
of the Audit Committee reports on the<br />
main principles in the assessment, and<br />
activities, to the rest of the Board of<br />
Directors.<br />
There is a clear policy stating the<br />
guidelines for how communication with<br />
external parties should be conducted.<br />
The purpose of the policy is to ensure<br />
that all communication responsibilities<br />
are fulfilled accurately and comprehensively.<br />
All staff are provided with this<br />
policy when taking up employment.<br />
Control and monitoring activities<br />
Control structures are designed to<br />
manage the risks the Board considers<br />
significant for the internal control over<br />
financial reporting. The control structure<br />
mainly consists of organizational resources<br />
with clear roles enabling effective,<br />
and from an internal control perspective,<br />
appropriate division of responsibilities,<br />
and of specific control activities intended<br />
to discover the risk of misstatements in<br />
reporting, or to prevent them in time.<br />
Based on the yearly risk assessment, control<br />
measures are analysed in each unit,<br />
with measures taken to reduce the risks<br />
in financial reporting.<br />
Monitoring<br />
Monitoring the effective structure and<br />
implementation of internal governance is<br />
conducted through a combination of selfassessment,<br />
independent testing and verification<br />
by external parties. The independent<br />
tests are conducted with the aid of<br />
external consultants and the Company’s<br />
Auditors to ensure the high-quality and<br />
effective design of controls. The results of<br />
the assessment are reported continuously<br />
to the Corporate Management and Audit<br />
Committee.<br />
Subsequently, the Audit Committee<br />
ensures that appropriate measures are<br />
taken in those cases where improvements<br />
are necessary. After consideration by the<br />
Audit Committee, the Board of Directors<br />
receives and evaluates the routines<br />
for auditing and financial reporting, and<br />
updates and evaluates external auditors’<br />
work, qualifications and independence.<br />
Internal audit<br />
<strong>Höganäs</strong> has not established a dedicated<br />
internal audit function. The opinion of<br />
the Board, which considers the need for
this annually, is that the extra cost of a<br />
dedicated internal audit function could<br />
not be considered reasonable in relation<br />
to the Group’s size. Moreover, the<br />
Board considers that the Group accounting<br />
function, which is responsible for<br />
updating and monitoring internal audit<br />
matters, is a satisfactory alternative.<br />
The Group accounting function reports<br />
its observations and actions taken on<br />
internal governance directly to the Audit<br />
Committee.<br />
Compliance with the Code<br />
The Company complies with all the rules<br />
of the Code apart from Board member<br />
<strong>Höganäs</strong>, Sweden, 7 February 2011<br />
Anders G Carlberg<br />
Chairman<br />
<strong>Höganäs</strong>, Sweden, 16 March 2011.<br />
KPMG <strong>AB</strong><br />
Alf Svensson<br />
Authorised Public Accountant<br />
C O R P O R AT E G O V E R N A N C E<br />
Jenny Lindén Urnes being appointed as<br />
Chairman of the Company’s Nomination<br />
Committee. The reason for this is<br />
that it is considered most expedient for<br />
the work of the Nomination Committee<br />
that the main representative of the<br />
Company’s main shareholder has this<br />
assignment.<br />
Peter Gossas Urban Jansson Bengt Kjell<br />
Jenny Lindén Urnes Bernt Magnusson Erik Urnes<br />
Karl-Henry Boo<br />
Union Representative<br />
Alrik Danielson<br />
Chief Executive Officer<br />
Auditor’s Statement on Corporate Governance <strong>Report</strong><br />
To the <strong>Annual</strong> General Meeting of <strong>Höganäs</strong> <strong>AB</strong> (publ), corporate identity number 556005-0121<br />
The Board of Directors and Chief<br />
Executive Officer are responsible for the<br />
Corporate Governance <strong>Report</strong> for <strong>2010</strong><br />
on pages 24-33 and the <strong>Report</strong> being<br />
prepared in accordance with the Swedish<br />
<strong>Annual</strong> Accounts Act. As the basis for<br />
our statement that the Corporate Go-<br />
vernance <strong>Report</strong> has been prepared, and<br />
is consistent with, the <strong>Annual</strong> Accounts<br />
and Consolidated Accounts, we have<br />
read the Corporate Governance <strong>Report</strong><br />
and judged its statutory content based on<br />
our knowledge of the company.<br />
Tony Petersson<br />
Union Representative<br />
We consider that a Corporate Governance<br />
<strong>Report</strong> has been prepared and that<br />
its statutory information is consistent<br />
with the <strong>Annual</strong> Accounts and Consolidated<br />
Accounts.<br />
H Ö G A N Ä S 2 0 1 0 33
F I N A N C I A L I N F O R M AT I O N<br />
Financial information<br />
Directors’ <strong>Report</strong> 35<br />
Appropriation of profits 39<br />
Consolidated Income Statement and<br />
Consolidated Statement of Comprehensive Income 40<br />
Consolidated Statement of Financial Position 41<br />
Consolidated Statement of Changes<br />
in Shareholders’ Equity 42<br />
Consolidated Statement of Cash Flows 43<br />
Parent Company Income Statement and<br />
Parent Company Statement of Comprehensive Income 44<br />
Parent Company Balance Sheet 45<br />
Parent Company Statement of Changes<br />
in Shareholders’ Equity 47<br />
Parent Company Cash Flow Statement 48<br />
Note<br />
1 Significant accounting principles 49<br />
2 Operating segments 56<br />
3 Other operating income 58<br />
4 Other operating expenses 58<br />
5 Employees and personnel expenses 59<br />
6 Auditors’ fees and reimbursement expenses 60<br />
7 Operating expenses by cost type 60<br />
8 Net financial income/expense 61<br />
9 Tax 61<br />
10 Appropriations 65<br />
11 Intangible assets 65<br />
12 Property, plant and equipment 68<br />
13 Operating leases 70<br />
14 Group companies 71<br />
15 Receivables from Group companies 72<br />
16 Long-term receivables 72<br />
17 Inventories 73<br />
18 Accounts receivable—trade/credit risk 73<br />
19 Prepaid expenses and accrued income 74<br />
20 Cash and cash equivalents 74<br />
21 Shareholders’ equity 75<br />
22 Untaxed reserves 76<br />
23 Interest-bearing liabilities 77<br />
24 Other long-term liabilities 77<br />
25 Employee benefits 78<br />
26 Provisions 82<br />
27 Liabilities to credit institutions 82<br />
28 Accrued expenses and deferred income 83<br />
29 Pledged assets, contingent liabilities and<br />
contingent assets 83<br />
30 Rates of exchange 83<br />
31 Financial risks and finance policy 84<br />
32 Related parties 89<br />
33 Significant estimates and judgments 90<br />
34 Information on the Parent Company 90<br />
34 H Ö G A N Ä S 2 0 1 0
F I N A N C I A L I N F O R M AT I O N<br />
Directors’ <strong>Report</strong><br />
The Board of Directors and Chief Executive Officer of <strong>Höganäs</strong> <strong>AB</strong> (publ), corporate identity number<br />
556005-0121, with registered office in <strong>Höganäs</strong>, Sweden, hereby present the annual accounts for the<br />
financial year <strong>2010</strong>.<br />
The results of operations in the year and the Parent Company’s and Group’s financial position are<br />
stated in the Directors’ <strong>Report</strong>, the following Income Statement, Statement of Comprehensive Income<br />
and Statement of Financial Position, and the Parent Company’s Income Statement, Statement of<br />
Comprehensive Income and Balance Sheet, the Notes and comments.<br />
Operations—general<br />
<strong>Höganäs</strong> <strong>AB</strong> is the world’s leading producer of iron and metal<br />
powder. Based on a clear vision of the possibilities of powder<br />
to improve efficiency, the consumption of resources and<br />
environmental impact across a raft of segments, the Company<br />
has accumulated in-depth application competence. Thus, in<br />
partnership with its customers, <strong>Höganäs</strong> helps create, as examples,<br />
the car components, white goods and water and exhaust<br />
treatment of the future.<br />
As a step towards an increasing market focus, <strong>Höganäs</strong> has<br />
opted to monitor and report on operations from a market perspective.<br />
The part of the metal powder market that <strong>Höganäs</strong><br />
is active on can be divided into two main areas of application:<br />
Components and Consumables.<br />
Components comprises all powder that is refined into<br />
components. Consumables comprises powders that are used<br />
in processes, for example, to produce metals, as an additive<br />
in chemical processes, surface coating or food supplements.<br />
Components represents some three-quarters of Group sales<br />
and Consumables the remainder.<br />
Progress of the Group’s operating activities, results of<br />
operations and financial position<br />
Consolidated net sales in the year were MSEK 6,671 (4,571),<br />
up 46% on the previous year. Sales volumes increased by 40%<br />
while the appreciation of the Swedish krona had a negative<br />
currency effect of 5%. Rising metal prices meant that metal<br />
price surcharges were noticeably higher in <strong>2010</strong> than in the<br />
previous year. The price increases over and above metal price<br />
surcharges that occurred in the year were mainly on iron orebased<br />
products.<br />
Market conditions were relatively stable and activity levels<br />
were high right through the value chain in the year. In Asia,<br />
stimulus packages to promote domestic demand gradually<br />
tapered off, which progressively affected the progress of<br />
volumes. However, in China and India, the second half-year<br />
was stronger than the first half-year. In Europe, the effect of<br />
discontinued cars scrapping premiums was offset by increased<br />
demand from major export markets. European car production<br />
gradually levelled off in the year, while component producers<br />
and other subcontractors enjoyed continued positive export<br />
volumes. In North America, activity levels increased gradually,<br />
albeit slowly, in the year. <strong>Höganäs</strong> regards the volume reduction<br />
in the second half-year as seasonal. In South America,<br />
demand conditions were consistently very positive due to<br />
economic growth and a strong business cycle.<br />
Gross income was MSEK 1,841 (960). The additional<br />
contribution from higher sales volumes was some MSEK 850.<br />
Because continued sales gains were achievable without significant<br />
new investments, cost absorption was very positive.<br />
Rising metal prices resulted in a loss from metal hedging of<br />
MSEK -16 (-37), although this was compensated by inventory<br />
gains. In 2009, metal prices rose sharply during the summer<br />
half-year, and the loss from metal hedges was MSEK -37 for<br />
the full year 2009.<br />
The income comparison with 2009 was also affected by a<br />
good rate of inventory turnover, especially in the first half-year<br />
<strong>2010</strong>, while it was much lower than normal in the first quarter<br />
of 2009, which was then charged with relatively high metal costs.<br />
The Swedish krona appreciated significantly in 2009, from a<br />
very weak level at the beginning of the year, and this appreciation<br />
continued in <strong>2010</strong>. Accordingly, exchange rates were less<br />
favourable in <strong>2010</strong> than the previous year.<br />
The krona appreciation implied that the income effect from<br />
forward contracts on currencies intended to hedge balance<br />
sheet positions in foreign currencies was positive at MSEK 25.<br />
However, this was offset by negative revaluation differences.<br />
Forward contracts intended to hedge payment flows also<br />
produced positive earnings of MSEK 74, thanks to appreciation<br />
of the Swedish krona. The currency effect on ongoing<br />
payment flows was negative. <strong>Höganäs</strong> estimates that the total<br />
currency effect, i.e. on gross income and other operating items,<br />
improved income by some MSEK 50 year on year.<br />
Other operating income and operating costs were MSEK -11<br />
(-61). The figure for 2009 includes MSEK 40 from sales of CO 2<br />
emission rights, and significant losses on long euro contracts<br />
(from 2005).<br />
Operating income was MSEK 1,114 (298). The operating<br />
margin was 16.7% (6.5) for the year. Income before tax was<br />
MSEK 1,084 (271). Income after tax was MSEK 804 (206).<br />
Return on capital employed for the past 12 months was<br />
27.6% (7.2). Returns improved despite capital tied-up increasing<br />
as a result of higher metal prices. The income improvement<br />
had a sharp positive impact on returns.<br />
H Ö G A N Ä S 2 0 1 0 35
F I N A N C I A L I N F O R M AT I O N<br />
The equity/assets ratio at year-end was 57.2%, against 51.8%<br />
at year-end 2009. Equity per share was SEK 93.05 against<br />
SEK 76.20 at the beginning of the financial year.<br />
Consolidated net indebtedness was MSEK 792 at year-end,<br />
down by MSEK 357 since the previous year-end. The debt/<br />
equity ratio at year-end was a multiple of 0.24, compared to<br />
0.43 at the beginning of the financial year.<br />
Net financial income/expenses were MSEK -30 (-27).<br />
<strong>Höganäs</strong>’ interest expenses increased from June <strong>2010</strong> onwards<br />
due to the expiry of a five-year credit facility, and the arrangement<br />
of a new three-year facility at a higher cost.<br />
Cash and cash equivalents were MSEK 106, against<br />
MSEK 130 at the beginning of the financial year. Unutilised<br />
credit facilities of MSEK 2,051 (excluding overdraft facilities)<br />
were additional, of which MSEK 1,290 consists of a threeyear<br />
credit facility applying from June <strong>2010</strong> onwards.<br />
Cash flow from operating activities was MSEK 698 (855).<br />
The change in working capital had a negative effect of<br />
MSEK 474 on cash flow in the year as a result of higher sales<br />
volumes and rising metal prices.<br />
Financing activities had a MSEK -429 (-712) effect on cash<br />
flow. Utilisation of confirmed credit facilities reduced by<br />
MSEK 238 in the year. A cash dividend of MSEK 104 was<br />
implemented.<br />
Consolidated net investments in fixed assets were MSEK 288<br />
(229). Depreciation and amortisation of fixed assets was<br />
MSEK 293 (290).<br />
Ownership structure<br />
Lindéngruppen <strong>AB</strong>, with 21.8% of the share capital and 37.8%<br />
of the vote, is the principal shareholder. Lindéngruppen <strong>AB</strong> is<br />
represented on the Board by Jenny Lindén Urnes and Erik<br />
Urnes.<br />
The <strong>Höganäs</strong> share<br />
The <strong>Höganäs</strong> share is quoted on the NASDAQ OMX<br />
Stockholm on the list of Mid Cap companies. The share is a<br />
constituent of the Metals & Mining sub-sector index in the<br />
Materials sector.<br />
<strong>Höganäs</strong>’ share capital is SEK 175,494,660, divided between<br />
a total of 35,098,932 shares, of which 981,000 are class A<br />
shares and 34,117,932 are class B shares. Both share classes<br />
have a quotient value of SEK 5.00 per share and equal entitlement<br />
to participation in the Company’s capital and earnings.<br />
Each class A share confers ten votes and each class B share one<br />
vote. Only the class B share is listed on the stock exchange. A<br />
trading lot amounts to one share. There are no limitations to<br />
rights of transfer due to stipulations of law or the Articles of<br />
Association.<br />
As stated above, the direct or indirect shareholdings in the<br />
Company representing at least one-tenth of the votes for all shares<br />
in the Company are held by Lindéngruppen <strong>AB</strong> with 21.8% of<br />
the share capital and 37.8% of the votes and <strong>AB</strong> Industrivärden<br />
with 10.1% of the share capital and 8.1% of the votes.<br />
36 H Ö G A N Ä S 2 0 1 0<br />
There were no employee shareholdings through pension funds.<br />
There are no limitations in terms of how many votes a shareholder<br />
can poll at an <strong>Annual</strong> General Meeting (AGM). Nor<br />
are there any known agreements between shareholders that<br />
might imply limitations to the right to transfer shares.<br />
The Articles of Association state that Board members are<br />
elected by AGMs for the period until the end of the first AGM<br />
held the year after the Board member was appointed. Regarding<br />
amendments to the Articles of Association, the Articles of<br />
Association state that invitations to AGMs that are to consider<br />
amendments of the Articles of Association will be issued at<br />
the earliest six weeks and the latest four weeks prior to such<br />
meeting.<br />
The AGM <strong>2010</strong> resolved to authorise the Board to decide<br />
on acquisitions of treasury shares in the period until the next<br />
AGM, subject to a maximum of class B shares of the Company<br />
so that after each acquisition the Company holds a maximum<br />
of 10% of the total number of shares of the Company.<br />
The purpose of this authorisation to decide on the acquisition<br />
of treasury shares is to give the Board the possibility to cover<br />
the Company’s commitments pursuant to the terms of the<br />
Company’s performance-related staff stock option plans.<br />
<strong>Höganäs</strong> did not re-purchase any shares in <strong>2010</strong>.<br />
There are no agreements between the Company and Board<br />
members or employees stipulating remuneration if their<br />
employment ceases as a result of a public offering to acquire<br />
shares in the Company. Coincident with termination initiated<br />
by the Company, the Chief Executive Officer is entitled to<br />
severance pay of two years’ salary including pension benefits.<br />
Coincident with termination initiated by the Company,<br />
another 19 managers are entitled to severance pay of up to 12<br />
months’ salary and severance pay of up to one year’s salary,<br />
including pension benefits. No severance pay is due coincident<br />
with termination initiated by the employees.<br />
Significant events in the financial year or<br />
subsequent events<br />
Renewed credit facilities<br />
In January <strong>2010</strong>, <strong>Höganäs</strong> <strong>AB</strong> arranged four new loan agreements<br />
of a total of MEUR 175 with four different lenders. These<br />
agreements have a three-year term, starting from June <strong>2010</strong>, and<br />
are subject to covenants. The loans may become due in advance<br />
if these covenants are not satisfied, as stated in Note 31.<br />
New applications for <strong>Höganäs</strong>’ surface coating powder<br />
In the year, <strong>Höganäs</strong> delivered stainless metal powder for<br />
laser coating to Roussakis SA, which completed the successful<br />
renovation of an 11 m long, 26 ton propeller axle with<br />
the powder in <strong>2010</strong>. The joint laser surface coating project<br />
demonstrates the strength of this new technology, and thus<br />
paves the way for new applications segments for <strong>Höganäs</strong>’<br />
surface coating powders, for propeller axles, crankshafts and<br />
other segments.
Launch of a unique electric motor for bicycles<br />
In early-May <strong>2010</strong>, <strong>Höganäs</strong> launched a new generation of<br />
electric motors specially developed for electric cycles and light<br />
vehicles. Thanks to these motors being produced from metal<br />
powder, they have a unique combination of reduced weight,<br />
more compact design and high performance. The launch was<br />
at the World Expo in Shanghai, because the market for electric<br />
cycles is growing fastest in China and other Asian countries.<br />
The electric bicycle motor is a highly efficient and compact<br />
motor for direct transmission without a gearbox. By combining<br />
high power and low weight with a modular design, the<br />
motor is suitable for a wide array of applications apart from<br />
electric cycles, such as mopeds, scooters, other light vehicles,<br />
pumps, fans and generators.<br />
New member of group management and Vice President<br />
of Europe Region<br />
On 15 May <strong>2010</strong>, Fredrik Emilson became Vice President of<br />
<strong>Höganäs</strong>’ European operation, and will thus be a member of<br />
<strong>Höganäs</strong>’ group management.<br />
Breakthrough in Asia for <strong>Höganäs</strong>’ chrome material<br />
in connecting rods<br />
The production of powder-forged connecting rods started<br />
in South Korea in the fourth quarter <strong>2010</strong> based on a unique<br />
chrome-alloy Astaloy ® material from <strong>Höganäs</strong>. These connecting<br />
rods are produced by Sinteron, which is the second-largest<br />
producer of powder-based components in South Korea.<br />
Production mainly addresses the car industry, with Hyundai as<br />
a key customer.<br />
For a number of years, powder-forged connecting rods<br />
have been produced by several component manufacturers,<br />
primarily in the US, Japan and South Korea. What is new is<br />
that in close partnership with <strong>Höganäs</strong> and end-user Hyundai<br />
Motors, Sinteron has developed a connecting rod that uses<br />
the new generation of chrome-alloy material for the first time.<br />
These connecting rods will be used in Hyundai’s new highperformance<br />
engine. Compared to other metals, chrome is a<br />
cost-efficient alloy element gaining more widespread usage in<br />
the powder metallurgical industry and <strong>Höganäs</strong> has developed<br />
several materials based on a unique production process. By<br />
using <strong>Höganäs</strong>’ chrome alloy material in connecting rods,<br />
powder forging becomes more competitive than comparable<br />
technologies. The estimated volume of the market for connecting<br />
rods is over 150,000 tons annually, of which at present, a<br />
quarter is produced by powder forging.<br />
Division of Parent Company operations<br />
As of 1 January <strong>2010</strong>, the operating activities of the Parent<br />
Company were transferred to <strong>Höganäs</strong> Sweden <strong>AB</strong>. The<br />
operations of the Parent Company then consists of delivery<br />
of group-wide services such as IT, research and development,<br />
marketing and similar central staff functions.<br />
F I N A N C I A L I N F O R M AT I O N<br />
Research and development<br />
<strong>Höganäs</strong> conducts proprietary and sector-wide research in<br />
powder metallurgy to continue developing technology and<br />
potential applications that utilise the qualities of metal<br />
powder. Consequently, <strong>Höganäs</strong> has identified six specially<br />
attractive segments were it sees high potential to create cost,<br />
efficiency and environmental benefits with the aid of powder<br />
technology:<br />
• Powder metallurgy • Electromagnetic applications<br />
• Surface coating • Filters<br />
• Brazing • Injection moulded components<br />
A significant part of research in these segments is in collaboration<br />
with subcontractors, customers, end-users, universities<br />
and research institutions. By creating a Power of Powder<br />
Centre (PoP Centre), <strong>Höganäs</strong> has become a driving force in<br />
the development of new powder applications, and to further<br />
enhance the existing ones. Including customer service and tech<br />
support, as well as <strong>Höganäs</strong>’ internal process re-engineering,<br />
the Group’s total R&D amounts to just over 2% of turnover,<br />
or 3% of total operating expenses. <strong>Höganäs</strong> already operates<br />
Tech Centres in Sweden, the US and China.<br />
Financial instruments and risk management<br />
The Group’s and Parent Company’s significant risk and<br />
uncertainty factors include business risks in the form of high<br />
exposure to the automotive industry. Financial risks, primarily<br />
currency and metal price risks, are additional. <strong>Höganäs</strong>’<br />
Finance Policy, controlled and monitored by the Board of<br />
Directors, states the framework for the management of financing<br />
and other types of financial risk. The Policy defines the<br />
risk exposure to which operations are conducted. For more<br />
information, see Note 31.<br />
Environmental information<br />
<strong>Höganäs</strong> conducts operations that are subject to permits and<br />
reporting. In all the countries where <strong>Höganäs</strong> has production,<br />
regulatory permits are necessary to produce metal powder.<br />
These permits mainly regulate production volumes, air and<br />
waterborne emissions, noise and waste. The permits are issued<br />
for a finite period or until further notice and are in place for all<br />
production facilities. For more information, see page 18.<br />
<strong>Höganäs</strong> applied to the regulatory authority for a further<br />
extension to continue a technical survey to produce supporting<br />
data for remedial measures for the airborne environment. An<br />
in-depth survey of the incidence of land contamination is continuing<br />
at the Swedish facilities, and <strong>Höganäs</strong> has expanded its<br />
inspection program. The first stage of the process to apply for<br />
a new environmental permit for the plants at <strong>Höganäs</strong> began<br />
in the year, and is scheduled for filing with the authorities in<br />
2012.<br />
H Ö G A N Ä S 2 0 1 0 37
F I N A N C I A L I N F O R M AT I O N<br />
Human resources<br />
In <strong>2010</strong>, <strong>Höganäs</strong> continued its work on strengthening its<br />
organization. Internal corporate communication, training<br />
projects and collective routines contribute to creating increased<br />
stakeholding and the prospects for employees to progress.<br />
<strong>Höganäs</strong> has introduced a profit share system for all staff of<br />
the group, a total of 1,647 (1,456) employees in 15 countries at<br />
year-end <strong>2010</strong>. This program runs for the period <strong>2010</strong>-2012. Entitlement<br />
to profit sharing starts when the group’s income after<br />
tax exceeds MSEK 344, and the full allocation is when income<br />
exceeds MSEK 482. The maximum allocation in the group for<br />
the profit share program <strong>2010</strong> is MSEK 24.1. Full provisioning<br />
has been made for the financial year <strong>2010</strong>.<br />
Acquisitions, transfers and holdings of treasury shares<br />
At the beginning of <strong>2010</strong>, <strong>Höganäs</strong> had 293,800 treasury<br />
shares, or 0.8% of the total number of shares. <strong>Höganäs</strong> did not<br />
re-purchase or transfer any shares in <strong>2010</strong>. The quotient value<br />
per share is SEK 5.00.<br />
Statement on the work of the Board in the year/<br />
corporate governance<br />
The Board’s activities are reviewed in the Corporate Governance<br />
<strong>Report</strong> on page 24–33. More information on how long<br />
each Board member has been on <strong>Höganäs</strong>’ Board of Directors,<br />
other assignments and main employment are stated on<br />
the Board’s presentation on page 26–27 and the Company’s<br />
website, www.hoganas.com.<br />
Incentive schemes<br />
The AGMs 2007–2009 resolved on the introduction of a<br />
performance-related staff stock option plan with the aim of<br />
offering key staff of the Group the opportunity of future<br />
stakeholding in the Company, thus increasing their interest in,<br />
and commitment to, the Company’s operations. This plan was<br />
for the years 2007–2009 and covered the Chief Executive Officer<br />
and other members of the Group management, as well as another<br />
35 or so key staff of the Group, totalling some 50 people.<br />
These individuals were granted options depending on how the<br />
Group progressed in relation to goals set by the Board of Directors.<br />
The term of the staff stock options is a minimum of two<br />
and a maximum of four years from the grant date.<br />
A total of 111,580 options were granted to participants in<br />
the 2007 plan, which after re-statement as a result of the share<br />
redemption procedure conducted in 2008, entitled the holders<br />
to receive a total of 123,854 class B shares. After restatement<br />
as a result of the share redemption procedure conducted in<br />
2008, the exercise price for options granted in the 2007 plan is<br />
SEK 221.50 per share. No granting was made to participants<br />
in the 2008 plan. In <strong>2010</strong>, a total of 226,000 options were<br />
granted to participants in the 2009 plan, which entitle the<br />
holders to subscribe for an equal number of class B shares. The<br />
exercise price for the 2009 plan is SEK 114.20 per share.<br />
To be able to implement the staff stock option plan, the<br />
38 H Ö G A N Ä S 2 0 1 0<br />
Board of Directors has been authorised to decide on the<br />
acquisition and transfer of class B treasury shares.<br />
Expectations of future progress<br />
Demand conditions were strong in South America and Asia,<br />
apart from Japan. <strong>Höganäs</strong>’ view is that demand will continue<br />
to improve gradually in North America, but the rate of the recovery<br />
remains uncertain. <strong>Höganäs</strong>’ judgement is that underlying<br />
European market conditions are still weak, and will<br />
remain so as long as consumption levels in heavily indebted<br />
countries remain low. Metal prices and exchange rates are expected<br />
to stay volatile, which will affect earnings performance.<br />
Parent Company’s results of operations and financial<br />
position<br />
As of 1 January <strong>2010</strong>, the operating activities of the Parent<br />
Company were transferred to <strong>Höganäs</strong> Sweden <strong>AB</strong>. This<br />
intra-group transfer was conducted at taxable values and<br />
involved operating receivable/liabilities and fixed assets. An<br />
intragroup capital loss of MSEK 562 arose. Subsequently, the<br />
Parent Company’s operations primarily consist of the supply<br />
of group-wide services such as IT, research and development,<br />
marketing and similar central functions. Invoicing of groupwide<br />
services for the year was MSEK 138. Dividends received<br />
from subsidiaries were MSEK 44.<br />
Remuneration guidelines for senior managers<br />
Fees are payable to the Chairman of the Board and Board<br />
members, for work on the Board of Directors and Committees<br />
in accordance with AGM resolution. The AGM resolved on<br />
the following guidelines for remunerating management.<br />
Remuneration to the Chief Executive Officer and other<br />
senior managers consists of basic salary, performance-related<br />
pay, other benefits, pensions and financial instruments, etc.<br />
Other senior managers means the ten people that comprised the<br />
Group management in <strong>2010</strong> jointly with the Chief Executive<br />
Officer.<br />
The division between basic salary and performance-related<br />
pay will be proportional to the executive’s responsibilities and<br />
authority. The maximum performance-related pay is 50% of<br />
basic salary. Performance-related pay is based on outcomes in<br />
relation to individual targets.<br />
Pension benefits and benefits in the form of financial instruments<br />
etc., as well as other benefits to the Chief Executive<br />
Officer and other senior managers will be payable as a part of<br />
total remuneration.<br />
The corporate management and other key staff will be eligible<br />
for staff stock option plans. This entitlement shall relate to the<br />
Company’s progress, with granting determined by balancing<br />
predetermined target figures for volume and earnings growth,<br />
and return on capital employed, as determined by the Board of<br />
Directors.<br />
The Board of Directors’ proposed remuneration guidelines<br />
for senior managers for 2011 are unchanged.
Appropriation of profits<br />
Proposed appropriation of profits<br />
The Board of Directors proposes that the funds at<br />
the disposal of the <strong>Annual</strong> General Meeting of<br />
SEK 1,407,193,175 are appropriated as follows:<br />
Dividends, 34,805,132 * SEK 10.00 348,051,320<br />
Carried forward 1,059,141,855<br />
Total 1,407,193,175<br />
The Board of Directors’ view is that the proposed dividend<br />
will not prevent the Company from fulfilling its commitments<br />
in the short and long-term, nor from completing necessary investments.<br />
Accordingly, the proposed dividend is justifiable in<br />
terms of the stipulations of the Swedish Companies Act, chap.<br />
17 §3 paragraphs 2-3 (the principle of prudence). The proposed<br />
dividend increases the Group’s debt/equity ratio to 39%.<br />
The Board of Directors judges that liquidity of the Group will<br />
be maintainable at a satisfactory level.<br />
The Board of Directors and Chief Executive Officer certify<br />
that the consolidated accounts have been prepared in accordance<br />
with IFRS (International Financial <strong>Report</strong>ing Stand-<br />
<strong>Höganäs</strong>, Sweden, 7 February 2011<br />
Anders G Carlberg<br />
Chairman<br />
F I N A N C I A L I N F O R M AT I O N<br />
ards) as endorsed by the EU and give a true and fair view of<br />
the Group’s financial position and results of operations.The<br />
annual accounts have been prepared in accordance with generally<br />
accepted accounting principles in Sweden and give a true<br />
and fair view of the Parent Company’s financial position and<br />
results of operations.<br />
The Directors’ <strong>Report</strong> for the Group and Parent Company<br />
give a true and fair view of the progress of the Group’s and<br />
Parent Company’s operations, financial position and results<br />
of operations and review the significant risks and uncertainty<br />
factors facing the Parent Company and Group companies.<br />
As stated above, the annual accounts and consolidated accounts<br />
were approved for issuance by the Board of Directors<br />
and Chief Executive Officer on 7 February 2011. The Consolidated<br />
Income Statement, Consolidated Statement of Comprehensive<br />
Income and Consolidated Statement of Financial<br />
Position and the Parent Company Income Statement, Parent<br />
Company Statement of Comprehensive Income and Parent<br />
Company Balance Sheet will be subject to adoption by the<br />
AGM on 2 May 2011.<br />
Peter Gossas Urban Jansson Bengt Kjell<br />
Jenny Lindén Urnes Bernt Magnusson Erik Urnes<br />
Karl-Henry Boo<br />
Union representative<br />
Alrik Danielson<br />
Chief Executive Officer<br />
Tony Petersson<br />
Union representative<br />
H Ö G A N Ä S 2 0 1 0 39
F I N A N C I A L I N F O R M AT I O N<br />
Consolidated Income Statement<br />
1 January – 31 December<br />
MSEK Note <strong>2010</strong> 2009<br />
Net sales 2 6,671 4,571<br />
Cost of goods sold -4,830 -3,611<br />
Gross profit 1,841 960<br />
Selling expenses -248 -225<br />
Administrative expenses -323 -277<br />
Research and development costs -145 -99<br />
Other operating income 3 79 69<br />
Other operating expenses 4 -90 -130<br />
Operating income 2, 5, 6, 7,13, 25 1,114 298<br />
Financial income 11 5<br />
Financial expenses -41 -32<br />
Net financial income/expense 8 -30 -27<br />
Income before tax 1,084 271<br />
Tax 9 -280 -65<br />
Net income 804 206<br />
Net income attributable to:<br />
Parent Company shareholders 804 206<br />
Non-controlling interests - -<br />
Net income 804 206<br />
Earnings per share:<br />
Before dilution (SEK) 21 23.11 5.92<br />
After dilution (SEK) 23.11 5.92<br />
Consolidated Statement of Comprehensive Income<br />
1 January – 31 December<br />
MSEK Note <strong>2010</strong> 2009<br />
Net income 21 804 206<br />
Other comprehensive income<br />
Translation differences for the year -209 -164<br />
Hedging of currency risk in foreign operations 156 225<br />
Cash flow hedges 85 196<br />
Tax attributable to other comprehensive income -146 -110<br />
Other comprehensive income for the year -114 147<br />
Comprehensive income for the year 690 353<br />
Comprehensive income for the year attributable to:<br />
Parent Company shareholders 690 353<br />
Non-controlling interests - -<br />
Comprehensive income for the year 690 353<br />
40 H Ö G A N Ä S 2 0 1 0
Consolidated Statement of Financial Position<br />
As of 31 December<br />
F I N A N C I A L I N F O R M AT I O N<br />
MSEK Note <strong>2010</strong> 2009<br />
ASSETS<br />
Intangible assets 11 297 291<br />
Property, plant and equipment 12 2,374 2,458<br />
Long-term receivables 16 104 92<br />
Deferred tax assets 9 50 89<br />
Total fixed assets 2,825 2,930<br />
Inventories 17 1,581 1,152<br />
Tax assets 14 23<br />
Accounts receivable—trade 18 889 707<br />
Prepaid expenses and accrued income 19 41 56<br />
Other receivables 211 120<br />
Cash and cash equivalents 20 106 130<br />
Total current assets 2,842 2,188<br />
TOTAL ASSETS 5,667 5,118<br />
SHAREHOLDER’S EQUITY AND LI<strong>AB</strong>ILITIES<br />
Shareholders’ equity 21<br />
Share capital 175 175<br />
Provisions -59 55<br />
Profit brought forward including net income 3,123 2,423<br />
Shareholders’ equity attributable to Parent Company shareholders 3,239 2,653<br />
Non-controlling interests - -<br />
Total shareholders’ equity 3,239 2,653<br />
Liabilities<br />
Long-term interest-bearing liabilities 23, 31 814 1,130<br />
Other long-term liabilities 24 52 56<br />
Provisions for pensions 25 9 12<br />
Other provisions 26 20 25<br />
Deferred tax liabilities 9 380 297<br />
Total long-term liabilities 1,275 1,520<br />
Current interest-bearing liabilities 23 75 137<br />
Advances from customers 4 2<br />
Accounts payable 553 441<br />
Tax liabilities 119 53<br />
Other liabilities 50 59<br />
Accrued expenses and deferred income 28 322 219<br />
Other provisions 26 30 34<br />
Total current liabilities 1,153 945<br />
Total liabilities 2,428 2,465<br />
TOTAL SHAREHOLDERS’ EQUITY AND LI<strong>AB</strong>ILITIES 5,667 5,118<br />
Pledged assets and contingent liabilities for the Group<br />
MSEK Note <strong>2010</strong> 2009<br />
Pledged assets 29 42 47<br />
Contingent liabilities 29 84 81<br />
H Ö G A N Ä S 2 0 1 0 41
F I N A N C I A L I N F O R M AT I O N<br />
Consolidated Statement of Changes in Shareholders’ Equity<br />
MSEK<br />
42 H Ö G A N Ä S 2 0 1 0<br />
Note<br />
21<br />
Shareholders’ equity attributable to Parent Company’s shareholders<br />
Share<br />
capital<br />
Translation<br />
provision<br />
Hedging<br />
provision<br />
Profit brought<br />
forward incl.<br />
net income Total<br />
Noncontrolling<br />
interests<br />
Total shareholders’<br />
equity<br />
Opening shareholders’ equity, 1 Jan. 2009 175 51 -143 2,321 2,404 2 2,406<br />
Comprehensive income for the year<br />
Net income - - - 206 206 - 206<br />
Other comprehensive income for the year - 2 145 - 147 - 147<br />
Comprehensive income for the year - 2 145 206 353 - 353<br />
Transactions with the Group’s owners<br />
Dividends paid - - - -104 -104 - -104<br />
Acquisitions of non-controlling interests, already<br />
controlling interests - - - - - -2 -2<br />
Closing shareholders’ equity, 31 Dec. 2009 175 53 2 2,423 2,653 - 2,653<br />
Opening shareholders’ equity, 1 Jan. <strong>2010</strong> 175 53 2 2,423 2,653 - 2,653<br />
Comprehensive income for the year<br />
Net income - - - 804 804 - 804<br />
Other comprehensive income for the year - -177 63 - -114 - -114<br />
Comprehensive income for the year - -177 63 804 690 - 690<br />
Transactions with the Group’s owners<br />
Dividends paid - - - -104 -104 - -104<br />
Closing shareholders’ equity, 31 Dec. <strong>2010</strong> 175 -124 65 3,123 3,239 - 3,239
Consolidated Statement of Cash Flows<br />
1 January - 31 December<br />
F I N A N C I A L I N F O R M AT I O N<br />
MSEK Note <strong>2010</strong> 2009<br />
Operating activities<br />
Operating income 1,114 298<br />
Adjustments for non-cash items<br />
Depreciation and amortisation 11,12 293 290<br />
Impairment losses - 29<br />
Unrealised exchange rate differences -13 -63<br />
Capital gain on divestment 10 -39<br />
Other items -9 -51<br />
Interest received 3 5<br />
Interest paid -32 -33<br />
Realised exchange rate differences 32 100<br />
Other financial costs -1 -1<br />
Income tax paid -225 -65<br />
Cash flow from operating activities before changes in working capital 1,172 470<br />
Cash flow from changes in working capital<br />
Increase (-)/decrease (+) in inventories -480 297<br />
Increase (-)/decrease (+) in operating receivables -217 22<br />
Increase (+)/decrease (-) in operating liabilities 223 66<br />
Cash flow from operating activities 698 855<br />
Investing activities<br />
Acquisitions of business operations - -3<br />
Acquisition of intangible assets 11 -42 -42<br />
Divestment of intangible assets 17 26<br />
Acquisition of property, plant and equipment 12 -260 -223<br />
Divestment of property, plant and equipment 6 5<br />
Acquisitions of financial fixed assets -9 -<br />
Divestment of financial fixed assets - 8<br />
Cash flow from investing activities -288 -229<br />
Financing activities<br />
Borrowings 36 79<br />
Amortisation of loans -361 -687<br />
Dividend paid -104 -104<br />
Cash flow from financing activities -429 -712<br />
Cash flow for the year -19 -86<br />
Cash and cash equivalents at beginning of year 130 220<br />
Exchange rate differences in cash and cash equivalents -5 -4<br />
Cash and cash equivalents at end of year 20 106 130<br />
H Ö G A N Ä S 2 0 1 0 43
F I N A N C I A L I N F O R M AT I O N<br />
Parent Company Income Statement<br />
1 January – 31 December<br />
MSEK Note <strong>2010</strong> 2009<br />
Net sales 2 146 2,411<br />
Cost of goods sold - -1,899<br />
Gross profit 146 512<br />
Selling expenses -75 -104<br />
Administration expenses -158 -132<br />
Research and development costs -137 -91<br />
Other operating income 3 8 53<br />
Other operating expenses 4 -566 -86<br />
Operating income 5, 6, 13 -782 152<br />
Profit from financial items:<br />
Earnings on participations in Group companies 8 44 20<br />
Interest income and similar items 8 225 71<br />
Interest expenses and similar items 8 -41 -43<br />
Profit after financial items -554 200<br />
Appropriations 10 637 215<br />
Income before tax 83 415<br />
Tax 9 -21 -105<br />
Net income 62 310<br />
Parent Company Statement of Comprehensive Income<br />
1 January – 31 December<br />
MSEK <strong>2010</strong> 2009<br />
Net income 62 310<br />
Other comprehensive income<br />
Cash flow hedges -14 191<br />
Tax attributable to other comprehensive income 4 -50<br />
Other comprehensive income for the year -10 141<br />
Comprehensive income for the year 52 451<br />
44 H Ö G A N Ä S 2 0 1 0
Parent Company Balance Sheet<br />
As of 31 December<br />
F I N A N C I A L I N F O R M AT I O N<br />
MSEK Note <strong>2010</strong> 2009<br />
ASSETS<br />
Fixed assets<br />
Intangible assets 11 77 120<br />
Property, plant and equipment 12 84 1,164<br />
Financial fixed assets<br />
Shares in Group companies 14 3,412 1,229<br />
Receivables from Group companies 15 235 1,039<br />
Other long-term receivables 16 7 2<br />
Deferred tax assets 9 - 6<br />
Total financial fixed assets 3,654 2,276<br />
Total fixed assets 3,815 3,560<br />
Current assets<br />
Inventories, etc. 17 - 495<br />
Current receivables<br />
Accounts receivable—trade 18 - 279<br />
Receivables from Group companies 88 98<br />
Tax assets - -<br />
Other receivables 80 105<br />
Prepaid expenses and accrued income 19 17 46<br />
Total current receivables 185 528<br />
Cash and bank balances 20 3 19<br />
Total current assets 188 1,042<br />
TOTAL ASSETS 4,003 4,602<br />
H Ö G A N Ä S 2 0 1 0 45
F I N A N C I A L I N F O R M AT I O N<br />
Parent Company Balance Sheet, cont.<br />
As of 31 December<br />
MSEK Note <strong>2010</strong> 2009<br />
SHAREHOLDERS’ EQUITY AND LI<strong>AB</strong>ILITIES<br />
Shareholders’ equity 21<br />
Restricted equity<br />
Share capital (981,000 class A shares and 34,117,932 class B shares) 175 175<br />
Statutory reserve 39 39<br />
Non-restricted equity<br />
Fair value reserve -51 -41<br />
Profit brought forward 1,396 698<br />
Net income 62 310<br />
Total shareholders’ equity 1,621 1,181<br />
Untaxed reserves 22 58 695<br />
Provisions<br />
Provisions for pensions 3 5<br />
Provisions for tax 9 8 -<br />
Other provisions 26 - 16<br />
Total provisions 11 21<br />
Long-term liabilities<br />
Liabilities to credit institutions 27 800 1,100<br />
Liabilities to Group companies 959 844<br />
Other long-term liabilities 24 15 44<br />
Total long-term liabilities 1,774 1,988<br />
Current liabilities<br />
Liabilities to credit institutions 27 8 79<br />
Advance payments from customers - 1<br />
Accounts payable—trade 20 318<br />
Liabilities to Group companies 330 70<br />
Current tax liabilities 90 30<br />
Other liabilities 18 35<br />
Accrued expenses and deferred income 28 73 150<br />
Other provisions 26 - 34<br />
Total current liabilities 539 717<br />
TOTAL SHAREHOLDERS’ EQUITY AND LI<strong>AB</strong>ILITIES 4,003 4,602<br />
Parent Company pledged assets and contingent liabilities<br />
MSEK Note <strong>2010</strong> 2009<br />
Pledged assets 29 10 10<br />
Contingent liabilities 29 281 337<br />
46 H Ö G A N Ä S 2 0 1 0
F I N A N C I A L I N F O R M AT I O N<br />
Parent Company Statement of Changes in Shareholders’ Equity<br />
MSEK Note 21<br />
RESTRICTED EQUITY NON-RESTRICTED EQUITY<br />
Share<br />
capital<br />
Statutory<br />
reserve<br />
Fair value<br />
reserve<br />
Profit brought<br />
forward<br />
Total shareholders’<br />
equity<br />
Opening shareholders’ equity, 1 Jan. 2009 175 39 -182 857 889<br />
Comprehensive income for the year<br />
Net income - - - 310 310<br />
Other comprehensive income for the year - - 141 - 141<br />
Comprehensive income for the year - - 141 310 451<br />
Group contribution paid - - - -75 -75<br />
Group contribution received - - - 2 2<br />
Tax attributable to items reported directly<br />
to shareholders’ equity - - - 18 18<br />
Total changes in net worth reported directly to shareholders’<br />
equity, excl. transactions with the company’s shareholders - - 141 255 396<br />
Dividends - - - -104 -104<br />
Closing shareholders’ equity, 31 Dec. 2009 175 39 -41 1,008 1,181<br />
Opening shareholders’ equity, 1 Jan. <strong>2010</strong> 175 39 -41 1,008 1,181<br />
Comprehensive income for the year<br />
Net income - - - 62 62<br />
Other comprehensive income for the year - - -10 - -10<br />
Comprehensive income for the year - - -10 62 52<br />
Group contribution paid - - - -73 -73<br />
Group contribution received - - - 741 741<br />
Tax attributable to items reported directly<br />
to shareholders’ equity - - - -176 -176<br />
Total changes in net worth reported directly to shareholders’<br />
equity, excl. transactions with the company’s shareholders - - -10 554 544<br />
Dividends - - - -104 -104<br />
Closing shareholders’ equity, 31 Dec. <strong>2010</strong> 175 39 -51 1,458 1,621<br />
H Ö G A N Ä S 2 0 1 0 47
F I N A N C I A L I N F O R M AT I O N<br />
Parent Company Cash Flow Statement<br />
1 January – 31 December<br />
MSEK Note <strong>2010</strong> 2009<br />
Operating activities<br />
Operating income -782 152<br />
Adjustments for non-cash items<br />
Depreciation and amortisation 11, 12 26 147<br />
Impairment losses - 29<br />
Unrealised exchange rate differences -56 -2<br />
Capital gain, intragroup transfer 562 -<br />
Other items -8 -82<br />
Dividends received 44 20<br />
Interest received 4 24<br />
Interest paid -32 -29<br />
Realised exchange rate differences 158 24<br />
Income tax paid -119 -6<br />
Cash flow from operating activities before changes in working capital -203 277<br />
Cash flow from changes in working capital<br />
Increase (-)/decrease (+) in inventories - 55<br />
Increase (-)/decrease (+) in operating receivables 48 -37<br />
Increase (+)/decrease (-) in operating liabilities 85 100<br />
Cash flow from operating activities -70 395<br />
Investing activities<br />
Acquisition of subsidiary, net liquidity effect 14 - -4<br />
Disposal of assets and liabilities, net intragroup liquidity effect -12 -<br />
Amortisation from/lending to subsidiaries 532 302<br />
Acquisition of intangible assets 11 -24 -28<br />
Divestment of intangible assets - 26<br />
Acquisition of property, plant and equipment 12 -16 -127<br />
Divestment of property, plant and equipment 1 1<br />
Divestment of financial fixed assets - 1<br />
Cash flow from investing activities 481 171<br />
Financing activities<br />
Borrowing - 79<br />
Amortisation of loans -323 -610<br />
Dividend paid -104 -104<br />
Cash flow from financing activities -427 -635<br />
Cash flow for the year -16 -69<br />
Cash and cash equivalents at beginning of year 19 88<br />
Cash and cash equivalents at end of year 20 3 19<br />
48 H Ö G A N Ä S 2 0 1 0
Notes on the financial statements<br />
NOTE 1 SIGNIFICANT ACCOUNTING PRINCIPLES<br />
(a) Consistency with standards and laws<br />
The consolidated accounts have been prepared pursuant to International<br />
Financial <strong>Report</strong>ing Standards (IFRS) issued by the IASB (International<br />
Accounting Standards Board) and interpretation statements from the<br />
International Financial <strong>Report</strong>ing Interpretations Committee (IFRIC) as<br />
endorsed by the EU. RFR 1 (issued by Rådet för finansiell rapportering,<br />
the Swedish Financial <strong>Report</strong>ing Board), Supplementary Accounting Rules<br />
for Groups, has also been applied.<br />
The Parent Company applies the same accounting principles as the<br />
Group apart from those cases stated below in the ‘Parent Company’s<br />
accounting principles’ section.<br />
The Board of Directors and Chief Executive Officer adopted the<br />
annual accounts and consolidated accounts on 7 February 2011. The<br />
Consolidated Income Statement, Comprehensive Income and Statement<br />
of Financial Position and the Parent Company Income Statement,<br />
Comprehensive Income and Balance Sheet will be subject to adoption by<br />
the <strong>Annual</strong> General Meeting on 2 May 2011.<br />
(b) Basis of valuation for the financial statements<br />
Assets and liabilities are reported at historical cost, apart from certain<br />
financial assets and liabilities, which are measured at fair value. The<br />
financial assets and liabilities measured at fair value consist of derivative<br />
instruments, financial assets classified as financial assets measured at fair<br />
value via income, or as saleable financial assets.<br />
(c) Functional currency and reporting currency<br />
The Parent Company’s functional currency is the Swedish krona, which<br />
is also the presentation currency of the Parent Company and Group. This<br />
means that the financial statements are presented in Swedish kronor. All<br />
amounts are in millions of Swedish kronor (MSEK) unless otherwise stated.<br />
(d) Judgements and estimates in the financial statements<br />
Preparing financial statements pursuant to IFRS requires the management<br />
to make judgements and estimates, and assumptions that influence the<br />
adoption of the accounting principles and the reported values of assets,<br />
liabilities, income and expenses. Actual outcomes may diverge from these<br />
estimates and judgements.<br />
The estimates and assumptions are reviewed regularly. Changed<br />
estimates are reported in the period the change is made if the change only<br />
affects this period, or in the period the change is made and future periods,<br />
if the change affects both current and future periods.<br />
Judgements made by management when adopting IFRS, which have<br />
a significant influence on the financial statements and estimates that may<br />
result in significant adjustments in the subsequent year’s financial statements,<br />
are reviewed in more detail in Note 33.<br />
(e) Significant accounting principles applied<br />
With the exception of the cases detailed, the following accounting principles<br />
have been consistently applied for all periods published in the consolidated<br />
accounts. The Group’s accounting principles have been consistently<br />
applied by Group companies.<br />
(f) Amended accounting principles<br />
(i) Amended accounting principles caused by new or revised IFRS<br />
The following reviews those amended accounting principles the Group is<br />
applying from 1 January <strong>2010</strong> onwards. Other amendments of IFRS with<br />
application from <strong>2010</strong> onwards did not have any material effect on the<br />
Group’s accounting.<br />
Business combinations and consolidated accounts<br />
From 1 January <strong>2010</strong> onwards, the Group applies the revised IFRS 3<br />
Business Combinations and Amended IAS 27 Consolidated and Separate<br />
Financial Statements. These revised accounting principles have<br />
implications including: the definition of an operation changes, transaction<br />
expenditure in business combinations is expensed, conditional purchase<br />
prices are measured at the value on the acquisition date and the effects<br />
of restating liabilities related to conditional purchase prices are recognised<br />
as a revenue or expense in net income. Other new developments include<br />
there being two alternative ways to report non-controlling interests and<br />
goodwill, either at fair value, i.e. goodwill is included in the non-controlling<br />
F I N A N C I A L I N F O R M AT I O N<br />
interest, or alternatively, that the non-controlling interest becomes a part<br />
of net assets. The choice between these two methods is made individually<br />
for each business combination. Moreover, additional acquisitions that<br />
occur after controlling influence is obtained will be considered as transactions<br />
with owners and recognised directly in equity, which is a change to<br />
the Group’s previous principle, which was to report excess amounts as<br />
goodwill.<br />
The changed accounting principles did not have any retroactive effect<br />
on <strong>Höganäs</strong>’ financial statements. Amendments of standards did imply<br />
some changes to the disclosure requirements relating to business combinations.<br />
<strong>Höganäs</strong> did not conduct any business combinations in <strong>2010</strong>.<br />
Hedges of a Net Investment in a Foreign Operation<br />
IFRIC 16 Hedges of a Net Investment in a Foreign Operation states items<br />
including how only the risk in the functional currencies of the Parent<br />
Company and each foreign operation should be hedged. According to this<br />
interpretation statement, some of the hedging relations that <strong>Höganäs</strong> previously<br />
classified as hedges of net investment cannot constitute hedges.<br />
Hedge accounting for these hedges was discontinued from 1 January<br />
<strong>2010</strong>, without any material effect on the consolidated accounts.<br />
(g) New IFRS and interpretations that have yet to be applied<br />
A number of new or revised IFRS and interpretation statements do not<br />
come into effect until following financial years and have not been applied<br />
prospectively when preparing these financial statements. No prospective<br />
application of new or amended standards with future application is<br />
planned.<br />
IFRS 9 Financial Instruments is intended to replace IAS 39 Financial<br />
Instruments: Recognition and Measurement from 2013 onwards at the<br />
latest. IASB has published the first of at least three parts, which together,<br />
will comprise IFRS 9. This first part considers the classification and<br />
measurement of financial assets. The categories of financial assets stated<br />
in IAS 39 will be replaced by two categories, with measurement at fair<br />
value or amortised cost. Amortised cost is used for instruments contained<br />
in a business model whose goal is to secure contracted cash flows;<br />
which will be made up of payments of principal and interest on principal<br />
at specified dates. Other financial assets are recognised at fair value and<br />
the possibility of applying the fair value option as in IAS 39 is retained.<br />
Changes in fair value should be recognised in income, with the exception<br />
of value changes on equity instruments that are not held for trading, and<br />
for which initial choices are made to report value changes in other comprehensive<br />
income. Value changes on derivatives in hedge accounting are<br />
not affected by this part of IFRS 9, but for the present, will be recognised<br />
pursuant to IAS 39. IFRS 9 has not yet been endorsed by the EU. When<br />
this occurs, <strong>Höganäs</strong> will decide whether to apply the new principles<br />
prospectively or from 2013 onwards.<br />
<strong>Höganäs</strong> judges that none of the above changes to standards or new<br />
interpretation statements adopted from the financial year 2011 onwards<br />
or later will have any material effect on the consolidated accounts.<br />
(h) Classification, etc.<br />
Essentially, fixed assets and long-term liabilities comprise amounts<br />
expected to be recovered or paid after more than 12 months from the<br />
reporting date. Essentially, current assets and current liabilities exclusively<br />
comprise amounts expected to be recovered or paid within 12 months of<br />
the reporting date.<br />
(i) Operating segment reporting<br />
An operating segment is a part of the Group that conducts operations<br />
from which it can generate revenues and incur expenses and for which<br />
there is independent financial information available. The earnings of the<br />
operating segment are also followed up by the Company’s chief operating<br />
decision-maker to evaluate results of operations and to allocate resources<br />
to the operating segment. <strong>Höganäs</strong>’ operating segments are Components<br />
and Consumables. See Note 2 for more information on the division and<br />
presentation of operating segments.<br />
H Ö G A N Ä S 2 0 1 0 49<br />
1<br />
2<br />
3<br />
4<br />
5<br />
6<br />
7<br />
8<br />
9<br />
10<br />
11<br />
12<br />
13<br />
14<br />
15<br />
16<br />
17<br />
18<br />
19<br />
20<br />
21<br />
22<br />
23<br />
24<br />
25<br />
26<br />
27<br />
28<br />
29<br />
30<br />
31<br />
32<br />
33<br />
34
F I N A N C I A L I N F O R M AT I O N<br />
(j) Consolidation principles<br />
(i) Subsidiaries<br />
Subsidiaries are companies that <strong>Höganäs</strong> <strong>AB</strong> exerts a controlling influence<br />
over, which means a direct or indirect right to formulate a company’s<br />
financial and operational strategy with the purpose of receiving economic<br />
rewards. Judgements whether a controlling influence exists, consider<br />
potential shares conferring votes, which can be used or converted immediately.<br />
Subsidiary financial statements are consolidated from the acquisition<br />
date until the date the controlling influence ceases.<br />
If the subsidiary’s accounting principles are not consistent with the<br />
group’s accounting principles, re-statements have been made for the<br />
group’s accounting principles.<br />
Losses attributable to non-controlling interests are allocated to noncontrolling<br />
interests despite non-controlling interests being reported as a<br />
debit item under shareholders’ equity.<br />
Acquisitions on 1 January <strong>2010</strong> or later<br />
Subsidiaries are reported according to the purchase method. This method<br />
means that the acquisition of a subsidiary is treated as a transaction<br />
whereby the group indirectly acquires the subsidiary’s assets and takes<br />
over its liabilities. The fair value of acquired identifiable assets and liabilities<br />
taken over, and potential non-controlling interests on the acquisition date<br />
is determined in the acquisition analysis. Transaction expenses, apart<br />
from transaction expenses attributable to the issue of equity instruments<br />
or debt instruments that arise are recognised directly in net income.<br />
In business combinations where payments made, potential non-controlling<br />
interests and the fair value of previously held participations (in step<br />
acquisitions) exceed the fair value of the acquired assets and liabilities<br />
taken over are reported separately, the difference is reported as goodwill.<br />
When negative, the difference is recognised directly in net income.<br />
Payments made in tandem with acquisitions do not include payments<br />
relating to the settlement or previous business relations. This type of settlement<br />
is recognized in income.<br />
Conditional purchase prices are recognised at fair value at the acquisition<br />
date. In cases where the conditional purchase price is classified as<br />
an equity instrument, there is no re-statement if the settlement is taken in<br />
shareholders’ equity. Other conditional purchase prices are re-stated at<br />
each reporting date, and the change is recognised in net income.<br />
In those cases the acquisition does not relate to 100% of the subsidiary,<br />
a non-controlling interest arises. There are two alternatives for<br />
reporting non-controlling interests. These two alternatives are to report<br />
the non-controlling interest’s share of proportional net assets, or that the<br />
non-controlling interest is reported at fair value, which means that noncontrolling<br />
interests hold a participation in goodwill. The choice between<br />
these two alternatives for reporting non-controlling interests can be made<br />
acquisition by acquisition.<br />
In step acquisitions, goodwill is determined on the day the controlling<br />
influence is obtained. Previous holdings are measured at fair value and the<br />
value change is recognised in net income.<br />
For disposals resulting in the loss of controlling influence but where<br />
there is a remaining interest, this interest is reported at fair value and the<br />
value change is recognised in net income.<br />
Acquisitions conducted between 1 January 2004 and 31 December 2009<br />
Acquisitions conducted between 1 January 2004 and 31 December 2009<br />
where the cost exceeds the fair value of acquired assets and liabilities taken<br />
over and contingent liabilities taken over that are reported separately,<br />
the difference is reported as goodwill. When the difference is negative, this<br />
is recognised directly in net income.<br />
Transaction expenses, apart from transaction expenses attributable to<br />
the issue of equity instruments or debt instruments that arise, have been<br />
included in cost.<br />
Acquisitions conducted before 1 January 2004 (adoption date of IFRS)<br />
For acquisitions that occurred before 1 January 2004, goodwill, after impairment<br />
testing, is reported at cost corresponding to the carrying amount<br />
according to previous accounting principles.<br />
The classification and accounting treatment of business combinations<br />
that occurred before 1 January 2004 have not been reconsidered according<br />
to IFRS3 when preparing the Consolidated opening balance according<br />
to IFRS as of 1 January 2004.<br />
Acquisitions of non-controlling interests<br />
Acquisitions from non-controlling interests are reported as a transaction in<br />
shareholders’ equity, i.e. between the Parent Company’s owners (in profit<br />
50 H Ö G A N Ä S 2 0 1 0<br />
brought forward) and non-controlling interest. Accordingly, goodwill does<br />
not arise in these transactions. The change in non-controlling interests is<br />
based on their proportional share of net assets.<br />
Sales to non-controlling interests<br />
Sales to non-controlling interests, where controlling interest is retained,<br />
are reported as a transaction in shareholders’ equity, i.e. between the<br />
shareholders of the Parent Company and non-controlling interest. The difference<br />
between the proceeds received and the non-controlling interest’s<br />
proportional share of the acquired net assets is recognised under profit<br />
brought forward.<br />
(ii) Transactions eliminated at consolidation<br />
Intragroup receivables and liabilities, income or expenses and unrealised<br />
gains or losses arising from intragroup transactions between Group companies<br />
are eliminated fully when the consolidated accounts are prepared.<br />
(k) Foreign currency<br />
(i) Foreign currency transactions<br />
Foreign currency transactions are translated to the functional currency at<br />
the rate of exchange ruling on the transaction date. The functional currency<br />
is the currency in the primary economic environments the companies<br />
conduct business. Foreign currency monetary assets and liabilities<br />
are translated to the functional currency at the rate of exchange ruling on<br />
the reporting date. Exchange rate differences arising upon translation are<br />
recognised in net income. Non-monetary assets and liabilities recognised<br />
at historical cost are translated at the rate of exchange ruling at the time of<br />
the transaction. Non-monetary assets and liabilities recognised at fair value<br />
are translated to the functional currency at the rate of exchange ruling at<br />
the time of measurement at fair value.<br />
(ii) The financial statements of foreign operations<br />
Assets and liabilities of foreign operations, including goodwill and other<br />
consolidated surplus values and deficits, are translated from the functional<br />
currency of the foreign operations to the Group’s presentation currency,<br />
Swedish kronor, at the rate of exchange ruling on the reporting date.<br />
Income and expenses of foreign operations are translated to Swedish<br />
kronor at an average rate of exchange, which is an approximation of the<br />
rates of exchange ruling at each transaction date.<br />
Translation differences arising coincident with currency translation of<br />
foreign operations are recognised in other comprehensive income and are<br />
accumulated in a separate component of equity, termed the translation<br />
reserve. When divesting a foreign operation, the accumulated translation<br />
differences attributable to the operation are realised, whereupon they are<br />
reclassified from the translation reserve in equity to net income. Since 1<br />
January 2004, i.e. the adoption date of IFRS, translation differences have<br />
been recognised in the translation reserve.<br />
(iii) Net investment in a foreign operation<br />
In practice, long-term monetary receivables/liabilities of a foreign operation,<br />
for which settlement is not planned and is unlikely to occur in the<br />
foreseeable future are part of <strong>Höganäs</strong>’ net investment in foreign operations.<br />
An exchange rate difference arising on the long-term monetary<br />
receivable/liability is recognised in other comprehensive income and<br />
accumulated in a separate component of equity, termed the translation<br />
reserve. When divesting a foreign operation, the accumulated exchange<br />
rate differences attributable to the long-term monetary receivables/liabilities<br />
are included in the accumulated translation differences that are reclassified<br />
from the translation reserve in equity to net income.<br />
(l) Income<br />
(i) Sales of goods<br />
Income from the sale of goods is recognised in net income when the<br />
significant risks and rewards associated with ownership of the goods has<br />
been transferred to the buyer. Income is not recognised if it is likely that<br />
the economic rewards will not arise for the Group. If there is significant<br />
uncertainty regarding payment, associated costs or risks of returns,<br />
and if the seller retains a commitment to ongoing administration usually<br />
associated with ownership, there is no revenue recognition. Income is<br />
recognised at fair value of what is received, or is expected to be received,<br />
less deductions for discounting.<br />
(ii) Government subsidies<br />
Government subsidies are reported in the Statement of Financial Position<br />
as accrued income when there is reasonable certainty that the subsidy<br />
will be received and the Group will satisfy the terms associated with the
subsidy. The subsidy should be subject to systematic allocation in net<br />
income in the same way, and in the same periods, as the expenses the<br />
subsidy is intended to compensate. Central government subsidies related<br />
to assets are reported in the Statement of Financial Position as deferred<br />
income and allocated as other operating income over the useful life of the<br />
asset.<br />
(m) Leases<br />
(i) Operating leases<br />
Expenses relating to operating leases are recognised in net income on<br />
a straight-line basis over the lease term. Benefits received coincident<br />
with signing a contract are recognised in net income as a reduction in<br />
lease charges on a straight-line basis over the term of the lease. Variable<br />
charges are expensed in the periods they arise.<br />
(ii) Finance leases<br />
Minimum lease payments are divided between interest expenses and<br />
amortisation of the outstanding liability. Interest expenses are allocated<br />
over the lease term so each accounting period is subject to an amount<br />
corresponding to a fixed interest rate for the liability reported in the relevant<br />
period. Variable expenses are expensed for the periods they arise.<br />
(n) Financial income and expenses<br />
Financial income comprises interest income on invested funds, dividend<br />
income, profit arising from value changes on financial assets measured at<br />
fair value via income as well as gains from hedging instruments that are<br />
recognised to net income.<br />
Interest income from financial instruments is recognised pursuant to<br />
the effective interest method (see below). Dividend income is recognised<br />
when the rights to receive dividends are determined. Income from the sale<br />
of a financial instrument is recognised when the risks and rewards associated<br />
with ownership of the instrument have been transferred to the buyer<br />
and the Group no longer exerts control over the instrument.<br />
Financial expenses comprise interest costs on borrowings, the effect<br />
of redemption and present value calculations of provisions, losses caused<br />
by value changes on financial assets measured at fair value via income,<br />
impairment losses on financial assets and such losses on hedging instruments<br />
that are recognised in net income. Borrowing costs are recognised<br />
in income by applying the effective interest method, apart from to the<br />
extent they are directly attributable to purchases, construction or production<br />
of assets that require a significant time to complete for intended use<br />
or sale, in which case they are included in the cost of assets.<br />
Exchange gains and losses are reported net. Effective interest is the<br />
interest that discounts the estimated future payments received and made<br />
during the expected term of a financial instrument at the reported net<br />
value of the financial asset or liability. The calculation encompasses all<br />
charges received or paid by the contract parties that comprise a part of<br />
the effective interest, transaction expenses and all other discounts and<br />
premiums.<br />
o) Tax<br />
Income tax consists of current and deferred tax. Income tax is recognised<br />
in net income apart from when the underlying transaction is recognised<br />
in other comprehensive income or equity, whereupon the associated tax<br />
effect is recognised in other comprehensive income or equity. Current tax<br />
is tax to be paid or received for the current year, by applying those tax<br />
rates that are enacted or substantively enacted as of the reporting date.<br />
Current tax also includes adjustments of current tax attributable to previous<br />
periods.<br />
Deferred tax is calculated pursuant to the balance sheet method<br />
proceeding from temporary differences between carrying amounts and<br />
assessed values of assets and liabilities.<br />
Temporary differences are not considered in consolidated goodwill,<br />
nor for the difference arising in the first reporting of goodwill, nor for the<br />
first reporting of assets and liabilities that are not business combinations,<br />
which at the time of the transaction, affect neither reported nor taxable<br />
income. Nor are temporary differences attributable to participations in<br />
subsidiaries that are not expected to be reversed within the foreseeable<br />
future considered. The measurement of deferred tax is based on how<br />
the underlying assets or liabilities are expected to be realised or settled.<br />
Deferred tax is calculated using those tax rates and tax rules that are<br />
enacted or substantively enacted on the reporting date.<br />
Deferred tax assets relating to deductible temporary differences and<br />
loss carry-forwards are only recognised to the extent that it is likely that it<br />
will be possible to utilise them. The value of deferred tax assets is reduced<br />
when it is no longer considered probable that they can be utilised.<br />
F I N A N C I A L I N F O R M AT I O N<br />
Potential additional income tax arising from dividends is recognised at<br />
the same time as the dividend is reported as a liability.<br />
(p) Financial instruments<br />
Financial instruments reported in the statement of financial position include<br />
cash and cash equivalents, debt receivables, accounts receivable, financial<br />
investments and derivatives on the asset side. Accounts payable, loan<br />
liabilities and derivatives are reported on the liabilities side.<br />
(i) Recognition and de-recognition in the statement of financial position<br />
A financial asset or financial liability is reported in the statement of financial<br />
position when the Company becomes party to the instrument’s contracted<br />
terms. Accounts receivable are recognised in the statement of financial<br />
position when the invoice has been sent. Liabilities are recognised<br />
when the counterparty has performed, and there is a contracted payment<br />
liability, even if no invoice has been received as yet. Accounts payable are<br />
recognised when invoices are received.<br />
Financial assets are de-recognised from the statement of financial<br />
position when the contracted rights are realised, mature, or the Company<br />
relinquishes control over them. The same applies to parts of a financial<br />
asset. A financial liability is de-recognised from the statement of financial<br />
position when the contracted commitments are fulfilled or extinguished in<br />
some other way. The same applies to parts of a financial liability.<br />
A financial asset and a financial liability are offset and reported at a net<br />
amount in the statement of financial position only when a legal right to<br />
offset the amounts is present and the intention is to settle the items at a<br />
net amount or to simultaneously realise the asset and settle the liability.<br />
Acquisitions and divestments of financial assets are reported on the<br />
transaction date, which is the date the Company undertakes to buy or sell<br />
the asset.<br />
(ii) Classification and valuation<br />
Non-derivative financial instruments are initially recognised at cost corresponding<br />
to the fair value of the instrument plus transaction expenses for<br />
all financial instruments apart from those categorised as financial assets<br />
recognised at fair value via income, which are recognised at fair value<br />
excluding transaction expenses. On first reporting, a financial instrument<br />
is recorded on the basis of factors including the purpose of the acquisition<br />
of the instrument. The classification determines how the financial instrument<br />
is measured after first reporting, as stated below. Initially, derivative<br />
instruments are recognised at fair value, meaning that transaction<br />
expenses are charged to income for the period. After first reporting, the<br />
derivative instrument is reported as stated below.<br />
If the derivative instrument is used for hedge accounting, and to the extent<br />
this is effective, value changes on the derivative instrument are reported<br />
on the same line in net income as the hedged item. Even if hedge accounting<br />
is not applied, value increases and value decreases on the derivative<br />
are recognised as revenue and costs respectively in operating income,<br />
or in net financial income/expense based on the purpose of usage of the<br />
derivative instrument, and whether the usage relates to an operating item or<br />
a financial item. In hedge accounting, the ineffective part is reported in the<br />
same way as value changes on derivatives not used for hedge accounting.<br />
If hedge accounting is not applied when using interest swaps, the interest<br />
coupon is reported as interest and other value changes of the interest swap<br />
are reported as other financial income or other financial expense.<br />
Cash and cash equivalents consist of cash funds and immediately<br />
available balances with banks and corresponding institutions, and shortterm<br />
liquid investments with maturities of less than three months from<br />
acquisition date, which are exposed to only an insignificant risk of value<br />
fluctuations.<br />
Financial assets measured at fair value via income<br />
This category comprises two sub-categories: financial assets held for trading<br />
and other financial assets that the Company initially chose to classify<br />
in this category (according to the fair value option). Financial instruments<br />
in this category are measured at fair value on an ongoing basis with value<br />
changes recognised in net income. Derivatives with positive fair values are<br />
included in the first sub-category, apart from derivatives that are an identified<br />
and effective hedging instrument.<br />
Loans receivable and accounts receivable<br />
Loans receivable and accounts receivable are financial assets that are<br />
not derivatives with fixed payments or payments that can be determined,<br />
and that are not listed on a recognised marketplace. These assets are<br />
measured at accrued cost. Accrued cost is determined on the basis of<br />
effective interest calculated at acquisition date. Accounts receivable—trade<br />
H Ö G A N Ä S 2 0 1 0 51<br />
1<br />
2<br />
3<br />
4<br />
5<br />
6<br />
7<br />
8<br />
9<br />
10<br />
11<br />
12<br />
13<br />
14<br />
15<br />
16<br />
17<br />
18<br />
19<br />
20<br />
21<br />
22<br />
23<br />
24<br />
25<br />
26<br />
27<br />
28<br />
29<br />
30<br />
31<br />
32<br />
33<br />
34
F I N A N C I A L I N F O R M AT I O N<br />
are reported at the amount expected to be received, i.e. after deducting<br />
for doubtful debt.<br />
Other financial liabilities<br />
Loans and other financial liabilities such as accounts payable—trade are<br />
included in this category. Liabilities are measured at accrued cost.<br />
The category in which financial assets and liabilities are classed is<br />
stated in Note 31. The reporting of financial income and costs is also<br />
considered under principle (n) above.<br />
(q) Derivatives and hedge accounting<br />
The Group’s derivative instruments have been acquired to financially<br />
hedge the risks of interest rate, raw materials and currency exposure the<br />
Group is exposed to. Embedded derivatives are disclosed separately if<br />
not closely related to the host contract. On first reporting, derivatives are<br />
measured at fair value, implying that transaction expenses are charged to<br />
net income. After first reporting, derivative instruments are measured at<br />
fair value and value changes are reported as stated below.<br />
To satisfy the requirements for hedge accounting pursuant to IAS 39,<br />
there must be a clear link to the hedged item. The hedge must also effectively<br />
protect the hedged item, hedging documentation must be prepared<br />
and its effectiveness must be measurable. Gains and losses on hedges<br />
are recognised in net income at the same time as gains and losses are<br />
reported for the hedged items.<br />
Hedge accounting is applied in the following segments:<br />
• For currency derivatives used to hedge future payments denominated in<br />
foreign currency (hedging of cash flows)<br />
• For raw materials and currency derivatives used for hedging purchases<br />
and sales of raw materials (hedging of cash flows)<br />
• For interest swaps where variable interest in funding is converted to<br />
fixed interest (hedging of cash flows)<br />
• For foreign net investments in subsidiaries where loans and currency<br />
derivatives are used as hedging instruments and restated in shareholders’<br />
equity.<br />
(i) Foreign currency receivables and liabilities<br />
Currency forwards are used for hedging assets or liabilities against currency<br />
risk. Hedge accounting is not applied for hedging against currency<br />
risk because a financial hedge is reflected in reporting by the underlying<br />
receivable or liability and the hedging instrument being reported at<br />
the rate of exchange ruling on the reporting date and exchange rate<br />
fluctuations being recognised in net income. Exchange rate fluctuations<br />
on trading receivables and liabilities are recognised in operating income,<br />
while exchange rate fluctuations on financial receivables and liabilities are<br />
recognised in financial income/expenses.<br />
(ii) Cash flow hedging of uncertainty and forecast foreign currency sales<br />
The currency forwards used for hedging very likely forecast sales in<br />
foreign currency are reported in the Statement of Financial Position at fair<br />
value. Value changes in the period are recognised in other comprehensive<br />
income and accumulated value changes in a special component of<br />
shareholders’ equity (the hedging provision) until the hedged flow affects<br />
net income, whereupon the accumulated value changes of the hedging<br />
instrument are reclassified as net income coincident with the hedged item<br />
(sales revenue) affecting net income.<br />
(iii) Cash flow hedging interest risk<br />
Interest swaps are used to hedge the uncertainty in very likely forecast<br />
interest flows for variable-interest borrowings, whereby the Company receives<br />
variable interest and pays fixed interest. Interest swaps are reported<br />
at fair value in the Statement of Financial Position. The interest coupon<br />
portion is reported on an ongoing basis in net income as part of interest<br />
expenses. Unrealised changes in the fair value of interest swaps are recognised<br />
in other comprehensive income and are included as a part of the<br />
hedging provision until the hedged item affects net income and as long as<br />
the criteria for hedge accounting and effectiveness are satisfied. The gain<br />
or loss attributable to the ineffective portion of unrealised value changes of<br />
interest swaps is recognised in net income.<br />
(iv) Hedging of fair value interest risk<br />
Interest swaps are used as hedging instruments for hedging the risk of<br />
changes in the fair value of funding with fixed interest. Therefore, in accounting,<br />
hedging of fair value is applied, and the hedged item is restated<br />
at fair value in terms of the hedged risk (the risk-free interest) and value<br />
52 H Ö G A N Ä S 2 0 1 0<br />
changes are recognised in net income in the same way as the hedging<br />
instrument.<br />
(v) Hedging of currency risk in foreign net investments<br />
To some extent, investments in foreign subsidiaries (net assets including<br />
goodwill) have been hedged by raising foreign currency loans or forward<br />
contracts, which are translated using the rate of exchange ruling on the<br />
reporting date.<br />
Translation differences for the period on financial instruments used as<br />
hedging instruments in a hedge of a net investment in a group company<br />
are recognised in other comprehensive income and the accumulated<br />
changes in a special component of shareholders’ equity (the translation<br />
reserve) to the extent the hedge is effective. The aim is to neutralise the<br />
translation differences that affect other comprehensive income when<br />
group companies are consolidated.<br />
(vi) Hedging raw material risk and price risk on electricity<br />
Hedging is effected with standard financial derivatives quoted daily on the<br />
London Metal Exchange (LME). For metals not quoted on the LME, hedging<br />
can be effected through physical fixed-fee contracts with suppliers. Price<br />
hedging on electricity is effected with standard forward contracts quoted on<br />
the Nordpool exchange. The value changes are recognised in other comprehensive<br />
income in the hedging provision until the hedged flow is realised,<br />
whereupon the accumulated value changes of the hedging instrument<br />
are transferred to the Income Statement, to meet and match the earnings<br />
effect of the hedged transaction. The hedged flows may be contracted and<br />
forecast transactions.<br />
(r) Property, plant and equipment<br />
(i) Owned assets<br />
Property, plant and equipment are reported in the Group at cost after<br />
deducting for accumulated depreciation and potential impairment. The<br />
cost includes the purchase price and expenses directly attributable to<br />
the asset to bring it to the place and condition for use pursuant to the<br />
purpose of the acquisition. Examples of directly related expenses included<br />
in costs are expenses for delivery and processing, installation, registration,<br />
consulting and legal services. Borrowing costs directly related to purchasing,<br />
construction or production of an asset that require a significant time<br />
to complete for intended use or sale are included in cost. The accounting<br />
principles of impairment losses are stated below.<br />
The cost of fixed assets produced by the Company includes expenditure<br />
for materials, expenditure for employee benefits, and if applicable,<br />
other production overheads considered directly attributable to the fixed<br />
asset, and estimated expenditure for the disassembly and removal of the<br />
assets, and restoration of the location or area where they were located.<br />
Property, plant and equipment that comprise components with differing<br />
useful lives are considered as separate components of property, plant and<br />
equipment.<br />
The carrying amount of property, plant and equipment is removed<br />
from the Balance Sheet upon disposal or divestment, or where no future<br />
economic rewards are expected from the use or disposal/divestment of<br />
the asset. Gains or losses arising from the divestment or the disposal of<br />
an asset comprise the difference between the selling price and the asset’s<br />
carrying amount less direct selling expenses. Gains and losses are recognised<br />
as other operating income/expense.<br />
(ii) Leased assets<br />
Leases are classified as either finance or operating leases. Finance leases<br />
occur when essentially, the economic risks and rewards associated with<br />
ownership are transferred to the lessee. When this is not the case, the<br />
arrangement is an operating lease.<br />
Assets held through finance leases are reported as fixed assets in the<br />
Statement of Financial Position and are initially valued at the lower of<br />
the leased item’s fair value and the present value of the minimum lease<br />
payments at the time of entering into the arrangement. The obligation to<br />
pay future lease charges is reported as long-term and current liabilities.<br />
Leased assets are depreciated over the relevant asset’s useful life, while<br />
lease payments are reported as interest and amortisation of the liabilities.<br />
As a rule, assets held through operating leases are not reported as<br />
assets in the Statement of Financial Position. Nor do operating lease arrangements<br />
give rise to a liability.<br />
Assets let through finance lease arrangements are not reported as tangible<br />
assets because the risks associated with ownership are transferred<br />
to the lessee. Instead, a financial receivable is reported regarding the<br />
future minimum lease payments.
(iii) Additional expenditure<br />
Additional expenditure is added to cost only if it is considered likely that<br />
the future economic rewards associated with the asset will accrue for the<br />
Company and the cost can be measured reliably. Any other additional<br />
expenditure is reported as a cost in the period it arises.<br />
An additional expenditure item is added to cost if the expenditure relates<br />
to the change of identified components, or parts of them. In cases where<br />
a new component has been added, the expenditure is also added to the<br />
cost. Any un-depreciated carrying amounts of exchanged components,<br />
or parts of components, are disposed of and written off in connection with<br />
the exchange. Repairs are expensed as they arise.<br />
(iv) Borrowing costs<br />
Borrowing costs attributable to the construction of what are termed<br />
qualifying assets are capitalised as a part of the qualifying asset’s cost. A<br />
qualifying asset is an asset that requires a significant time to complete of<br />
necessity. Firstly, borrowing costs are capitalised that arise on loans that<br />
are specific to the qualifying asset. Secondly, borrowing costs arising on<br />
general loans, that are not specific to any qualifying asset, are capitalised.<br />
Capitalisation of borrowing costs for the Group primarily relates to the<br />
Group’s own construction of warehouse and production buildings, and<br />
furnaces.<br />
(v) Depreciation principles<br />
Depreciation is on a straight-line basis over the estimated useful life of an<br />
asset; land is not depreciated. Leased assets are also depreciated over<br />
estimated useful life, or if shorter, the contracted lease term. The Group<br />
utilises component depreciation, which means that the estimated useful<br />
lives of components are the basis for depreciation.<br />
Estimated useful lives:<br />
• Buildings: real estate used in business operations 20–33 years<br />
• Machinery and other plant 5–15 years<br />
• Equipment, tools fixtures and fittings 3–5 years<br />
Machinery and other plant comprises a number of components with differing<br />
useful lives mainly between 5 and 15 years. The majority of these<br />
components comprise operating units in production processes with an<br />
estimated useful life of 10 years. Annealing furnaces and tunnel kilns are<br />
considered as key assets, with useful lives assessed at 15-30 years. The<br />
residual value and useful life of an asset are estimated annually.<br />
(s) Intangible assets<br />
(i) Goodwill<br />
Goodwill is valued at cost less potential accumulated impairment losses.<br />
Goodwill is allocated to cash-generating units and is subject to impairment<br />
tests at least annually (see accounting principles (u)).<br />
For goodwill in acquisitions that occurred before 1 Dec. 2004, at the<br />
adoption of IFRS, the Group did not adopt IFRS retroactively, and the<br />
carrying amount reported as of that date will remain the Group’s cost after<br />
impairment testing.<br />
At business combinations, where acquisition cost is less than the net<br />
value of the acquired assets and liabilities taken over, and contingent liabilities,<br />
the difference is recognised directly in net income.<br />
(ii) Research and development<br />
Expenditure for research intended to secure new scientific or technical<br />
knowledge is expensed on an ongoing basis.<br />
Expenditure for development, where research results or other knowledge<br />
are used to achieve new or improved products or processes, is<br />
reported as an asset in the Statement of Financial Position, if the product<br />
or process is technically and commercially usable and the Company has<br />
sufficient resources to complete development, and subsequently use or<br />
sell the intangible asset. The carrying amount includes all directly attributable<br />
expenditure, for example for materials, services, employee benefits,<br />
registration of a legal right, amortisation of patents, licenses and borrowing<br />
costs pursuant to IAS 23. Other expenditure for development is recognised<br />
in net income as an expense when it arises. Development expenditure is<br />
reported in the Statement of Financial Position at cost less accumulated<br />
depreciation and potential impairment losses.<br />
A high proportion of <strong>Höganäs</strong>’ development expenses relate to specific<br />
customer projects. Development projects are capitalised when it is considered<br />
very likely that they will give rise to future economic rewards. The<br />
timing of commencing depreciation starts when the product is complete<br />
and has been brought into general use.<br />
F I N A N C I A L I N F O R M AT I O N<br />
The useful life for each project is estimated and determined by management,<br />
which in the normal case is around 10 years. The evaluation of each<br />
project’s useful life and impairment are tested yearly. The year’s capitalised<br />
expenditure for development was MSEK 17 (19) compared to the year’s<br />
research and development expenses recognised in income of MSEK 145<br />
(99).<br />
(iii) Other intangible assets<br />
Other intangible assets acquired by the Group are reported at cost less<br />
accumulated depreciation (see below) and impairment losses (see Accounting<br />
principles, (u)).<br />
Incurred expenses for internally generated goodwill and internally generated<br />
brands are recognised in net income when the expense arises.<br />
(iv) Additional expenditure<br />
Additional expenditure for capitalised intangible assets is reported as an<br />
asset in the Statement of Financial Position only when it increases the<br />
future economic rewards for the specific asset to which it is attributable. All<br />
other expenditure is expensed as it arises.<br />
(v) Borrowing costs<br />
Borrowing costs attributable to the construction of what are termed<br />
qualifying assets are capitalised as a part of the qualifying asset’s cost. A<br />
qualifying asset is an asset that requires a significant time to complete of<br />
necessity. Firstly, borrowing costs are capitalised that arise on loans that<br />
are specific to the qualifying asset. Secondly, borrowing costs arising on<br />
general loans, that are not specific to any qualifying asset, are capitalised.<br />
Capitalisation of borrowing costs for the Group primarily relates to capitalised<br />
development expenditure for developing new computer systems.<br />
(vi) Amortisation principles<br />
Amortisation is recognised in net income on a straight-line basis over the<br />
estimated useful lives of intangible assets, providing such useful lives are<br />
not indefinite. Goodwill and intangible assets with indefinite useful lives are<br />
subject to impairment tests annually, and moreover, as soon as there are<br />
indications that the asset’s value is impaired. Amortisable intangible assets<br />
are amortised from the date when they become available for use.<br />
Estimated useful lives:<br />
• Patents and brands 10–20 years<br />
• Capitalised development expenditure 10 years<br />
Useful lives are tested every year.<br />
(vii) Emission rights<br />
The allocation of CO 2 emission rights for the year has been reported as<br />
an intangible asset and deferred income, and valued at cost based on the<br />
first official quotation in the year. Used rights are reported at cost as cost<br />
of goods sold and provisions respectively. The corresponding contribution<br />
has reduced cost of goods sold and deferred income. Emission<br />
rights sold in the year were included in the item other operating income.<br />
Un-consumed emission rights have been reported at market value on the<br />
reporting date.<br />
(t) Inventories<br />
Inventories are valued at the lower of cost and net selling price. The cost<br />
of inventories is calculated by using the FIFO (first in first out) method and<br />
includes expenditure arising at the acquisition of the inventory items, and<br />
their transportation to their current location and condition. The cost of<br />
produced goods and work in progress includes the cost of labour and a<br />
reasonable proportion of indirect expenses based on normal capacity.<br />
The net selling price is the estimated selling price in operating activities,<br />
less estimated expenses for completing and achieving a sale.<br />
The cost of semi-finished and finished goods produced by the Company<br />
consists of direct production costs and a reasonable portion of indirect<br />
production costs. Measurement considers normal capacity utilisation.<br />
(u) Impairment losses<br />
The carrying amounts of the Group’s assets are subject to impairment<br />
tests at each reporting date. IAS 36 is applied for impairment of assets<br />
other than financial assets, which are reported pursuant to IAS 39, inventories,<br />
plan assets used to finance employee benefits and deferred tax<br />
assets. For assets subject to the above exemption, valuations are tested<br />
pursuant to the relevant standards.<br />
H Ö G A N Ä S 2 0 1 0 53<br />
1<br />
2<br />
3<br />
4<br />
5<br />
6<br />
7<br />
8<br />
9<br />
10<br />
11<br />
12<br />
13<br />
14<br />
15<br />
16<br />
17<br />
18<br />
19<br />
20<br />
21<br />
22<br />
23<br />
24<br />
25<br />
26<br />
27<br />
28<br />
29<br />
30<br />
31<br />
32<br />
33<br />
34
F I N A N C I A L I N F O R M AT I O N<br />
(i) Impairment of tangible and intangible assets<br />
If there is an indication of impairment, the asset’s recoverable value is<br />
measured (see below). Recoverable values of goodwill, other intangible<br />
assets with indefinite useful lives and intangible assets not yet ready for<br />
use are also calculated annually. If it is impossible to determine significant<br />
independent cash flows of an individual asset, and its value less selling<br />
expenses cannot be used, when conducting impairment tests, assets<br />
are grouped at the lowest level it is possible to determine significant independent<br />
cash flows, a cash-generating unit.<br />
An impairment loss is reported when an asset’s or cash-generating<br />
unit’s (group of units’) carrying amount exceeds recoverable value. An impairment<br />
loss is reported as an expense in net income. When impairment<br />
has been identified for a cash-generating unit (group of units), the impairment<br />
amount is allocated firstly to goodwill. Subsequently, proportional<br />
impairment losses of other assets included in the unit (group of units) are<br />
effected.<br />
The recoverable amount is the greater of fair value less selling expenses<br />
and value in use. When calculating the value in use, future cash flows are<br />
discounted at a discount factor that considers risk-free interest, and the<br />
risk associated with the specific asset.<br />
(ii) Impairment of financial assets<br />
The Company tests for objective evidence that a financial asset or group<br />
of assets is impaired at each reporting date. Objective evidence consists<br />
partly of observable circumstances that have occurred and that have a<br />
negative effect on the prospects of recovering the cost, and partly of significant<br />
or lasting reduction of the fair value of an investment in a financial<br />
asset classified as a financial asset held for sale.<br />
The Company classifies accounts receivable as doubtful when they<br />
have become 60 days overdue for payment. The impairment of receivables<br />
is determined on the basis of historical experience of bad debts of similar<br />
receivables. Accounts receivable that are impaired are reported at the<br />
present value of expected future cash flows. However, receivables with<br />
short maturities are not discounted.<br />
(iii) Reversal of impairment losses<br />
Impairment of an asset lying within the area of application of IAS 36 is<br />
reversed if there is an indication that both the need for impairment no<br />
longer applies and the assumptions that form the basis of measuring<br />
the recoverable value have changed. However, goodwill impairment is<br />
never reversed. Reversals are only effected to the extent that the asset’s<br />
carrying amount after the reversal does not exceed the carrying amount<br />
that would have been reported, with a deduction for depreciation where<br />
relevant, if no impairment had been effected.<br />
Impairment losses of loans receivable and accounts receivable reported<br />
at accrued cost are reversed if the previous reasons for impairment<br />
no longer apply and full payment from the customer is expected to be<br />
received.<br />
(v) Payments of capital to owners<br />
(i) Re-purchase of treasury shares<br />
Acquisitions of treasury shares are reported as a reduction in shareholders’<br />
equity. Payment from divesting such equity instruments is reported<br />
as an increase in shareholders’ equity. Potential transaction expenses are<br />
reported directly in shareholders’ equity.<br />
(ii) Dividends<br />
Dividends are reported as a liability after the AGM has approved the<br />
dividend.<br />
(x) Earnings per share<br />
Calculations of earnings per share are based on net income in the Group<br />
attributable to Parent Company shareholders, and on a weighted average<br />
number of outstanding shares in the year. When calculating diluted<br />
earnings per share income and the average number of shares is adjusted<br />
to consider the diluting effect of potential ordinary shares, which during<br />
reporting periods, stem from options issued to employees. Dilution from<br />
options only affects the number of shares and only arises when the<br />
exercise price is lower than the share price and is greater the larger the<br />
difference is between the exercise price and the share price. The exercise<br />
price is adjusted by supplementing the value of future services linked to the<br />
equity-settled staff stock option plan recognised as share-based payment<br />
pursuant to IFRS 2.<br />
54 H Ö G A N Ä S 2 0 1 0<br />
(y) Employee benefits<br />
(i) Defined contribution plans<br />
Plans where the Company’s obligation is limited to the fees the Company<br />
incurs to pay are classified as defined contribution pension plans. In such<br />
case, the size of the employee’s pension depends on the charges the<br />
Company deposits in the plan, or to the insurance company, and the<br />
return the charges achieve. Consequently, the employee bears the actuarial<br />
risk (that remuneration is lower than expected) and the investment<br />
risk (that the invested assets prove insufficient to generate the expected<br />
benefits). The Company’s obligation for charges in defined contribution<br />
plans are reported as an expense in net income as they accrue through<br />
the employee rendering services to the Company for a period.<br />
(ii) Defined benefit plans<br />
Apart from in Sweden, <strong>Höganäs</strong> has defined benefit plans in the US,<br />
Taiwan, Belgium, Germany, India and Italy. These defined benefit plans are<br />
unit-linked and traditionally assured. When plans are unit linked, assets<br />
are separated, mainly in pension funds. These plan assets can only be<br />
used to pay remuneration pursuant to pension agreements.<br />
The Group’s net commitments regarding defined benefit plans are<br />
calculated separately for each plan by estimating the future benefits the<br />
employee would have accrued through his/her service in current and<br />
previous periods; these benefits are discounted to present value. The<br />
discount rate is the yield at year-end of an investment grade corporate<br />
bond with a maturity corresponding to the Group’s pension commitments.<br />
When there is no recognised market for such corporate bonds, the<br />
market yield on government bonds with a corresponding maturity is used<br />
instead. The calculation is conducted by a qualified actuary using the<br />
projected unit credit method. The fair value of potential plan assets is also<br />
measured at the reporting date.<br />
When determining the present value of obligations on the fair value of<br />
plan assets, actuarial gains and losses may arise. They arise either through<br />
fair value differing from the previous assumptions, or through assumptions<br />
changing. For actuarial gains and losses, the corridor rule is applied. The<br />
rule means that the portion of the accumulated actuarial gains and losses<br />
exceeding 10% of the greater of the present value of the commitments<br />
and the fair value of plan assets is reported over the expected average<br />
remaining length of service of those employees covered by the plan. Otherwise,<br />
actuarial gains and losses are not considered.<br />
In the statement of financial position, the carrying amount of pensions<br />
and similar obligations correspond to the present value of the obligations<br />
at year-end, less a deduction for the fair value of plan assets, unreported<br />
actuarial gains or losses and unreported expenses relating to service<br />
rendered during previous periods.<br />
When the calculation results in an asset for the Group, the carrying<br />
amount of the asset is limited to the net of the un-disclosed actuarial<br />
gains or losses, un-disclosed expenses for service in previous periods and<br />
the present value of future re-payments from the plan or reduced future<br />
contributions to the plan. When the benefits of a plan improve, the share of<br />
the increased benefits attributable to employee service in previous periods<br />
is reported as an expense in net income allocated on a straight-line basis<br />
over the average period until benefits are fully accrued. If benefits are fully<br />
accrued, the whole expense is reported directly in net income.<br />
When there is a difference between how pension expenses are determined<br />
in a legal entity and the Group, a provision or receivable regarding<br />
the special employers’ contribution based on this difference is reported.<br />
The present value of the provision or receivable is not calculated.<br />
All the constituent components of the expense for the period of a<br />
defined benefit plan are recognised in operating income.<br />
(iii) Remuneration on termination<br />
An expense for remuneration coincident with notices of redundancy issued<br />
to staff is only reported if the Company has a proven obligation, without<br />
any realistic possibility of withdrawal, for a formal, detailed plan to conclude<br />
employment before the normal time. When remuneration is paid as an<br />
offer to encourage voluntary redundancy, an expense is recognised if it is<br />
likely that the offer will be accepted and the number of employees that will<br />
accept the offer can be reliably estimated.<br />
(iv) Share-based payment<br />
The AGM 2007 resolved on a stock option plan, which enables some<br />
employees and the CEO to acquire shares in the Company. The contracted<br />
terms of the staff stock option plan confer these employees with<br />
the opportunity to choose whether settlement will be in cash or through<br />
equity instruments, and thus the plan is reported pursuant to the rules
for share-based payments, which is settled in cash. The main terms and<br />
conditions of the plan are stated in Note 25.<br />
The staff stock option plan gives rise to a commitment to employees,<br />
measured at fair value and reported as a personnel expense with a corresponding<br />
increase of liabilities. Fair value is initially calculated at the grant<br />
date and allocated over the vesting period. The commitment is re-valued<br />
at each reporting date from the time of settlement. Potential value changes<br />
are recognised in the Income Statement. The fair value of the cash-settled<br />
options is calculated using the Black-Scholes model, and considers the<br />
plan’s terms and conditions that applied at the grant date.<br />
Social security expenses relating to equity instruments issued to employees<br />
as remuneration for purchased services are expensed, allocated<br />
over the periods when the services are rendered. The provision for social<br />
security expenses is based on the fair value of options at the reporting<br />
date. Fair value is calculated using the same valuation model as when the<br />
options were issued.<br />
(z) Provisions<br />
A provision differs from other liabilities because of uncertainty prevailing<br />
regarding the timing of payment or the scale of the amount to settle the<br />
provision. A provision is reported in the statement of financial position<br />
when there is an existing legal or informal commitment as a result of<br />
an event that has occurred, and it is likely that an outflow of economic<br />
resources will be necessary to settle the commitment and a reliable estimate<br />
of the amount can be made.<br />
Provisions are made at an amount that is the best estimate of what is<br />
necessary to settle the existing commitment on the reporting date. When<br />
the effect of when in time payment occurs is significant, provisions are<br />
measured through discounting expected future cash flows using an interest<br />
rate before tax that reflects current market estimates of the time value<br />
of money, and if applicable, the risks associated with the liability.<br />
(i) Emission rights<br />
Used and sold CO 2 emission rights are reported in short-term provisions in<br />
the statement of financial position. A description of the accounting principles<br />
governing emission rights is stated in point (s) (vii).<br />
(ii) Restoration of land<br />
Pursuant to the Group’s published environmental principles and applicable<br />
legal standards, a provision for restoring landfill sites has been reported.<br />
(aa) Contingent liabilities<br />
A contingent liability is reported when there is a possible commitment arising<br />
from events that have occurred, and whose incidence is confirmed only<br />
by one or more uncertain future events, or when there is a commitment<br />
that is not recognised as a liability or a provision because it is unlikely that<br />
an outflow of resources will be necessary.<br />
Parent Company accounting principles<br />
The Parent Company has prepared its annual accounts pursuant to the<br />
Swedish <strong>Annual</strong> Accounts Act (1995:1554) and RFR 2 (Rådet för finansiell<br />
rapportering, the Swedish Financial <strong>Report</strong>ing Board), Accounting for Legal<br />
Entities. Statements made by RFR relating to listed companies are also<br />
applied. RFR 2 means that in its annual accounts for the legal entity, the<br />
Parent Company shall apply all the IFRS and statements endorsed by the<br />
EU, if this is possible within the framework of the <strong>Annual</strong> Accounts Act, the<br />
Swedish Pension Obligations Vesting Act (Tryggandelagen) and considering<br />
the relationship between accounting and taxation. The recommendation<br />
states the exemptions from, and supplements to, IFRS.<br />
Amended accounting principles<br />
Unless stated otherwise below, the Parent Company’s accounting principles<br />
in <strong>2010</strong> have been altered in accordance with what is stated above<br />
for the Group.<br />
RFR 2 Accounting for Legal Entities states that the amended IAS 1,<br />
Presentation of Financial Statements should also be applied to the Parent<br />
Company, with a few exceptions. One effect of this, compared to previous<br />
reporting, is the addition of a statement of comprehensive income after<br />
the income statement. Another effect is that the statement of changes<br />
in shareholders’ equity has gained content resembling the Group’s, i.e.<br />
excluding the revenue and expenses previously recognised directly in<br />
shareholders’ equity, but now recognised in other comprehensive income<br />
in the statement of comprehensive income.<br />
The amended accounting principles for the revised IFRS 3 business<br />
F I N A N C I A L I N F O R M AT I O N<br />
combinations and amended IAS 27, Consolidated and Separate Financial<br />
Statements applied in the group do not result in the same amendments to<br />
the accounting principles of the Parent Company in respect of transaction<br />
expenditure and conditional purchase prices, see below in the ‘subsidiaries’<br />
section (ii).<br />
Differences between the Group’s and Parent Company’s<br />
accounting principles<br />
Differences between the Group’s and the Parent Company’s accounting<br />
principles are stated below. The accounting principles for the Parent Company<br />
stated below have been applied consistently for all periods presented<br />
in the Parent Company’s financial statements.<br />
(i) Classification and Presentation<br />
The Parent Company uses the terms balance sheet and cash flow statement<br />
respectively for those reports, which in the Group, are entitled statement<br />
of financial position and statement of cash flows. The income statement<br />
and balance sheet of the Parent Company are presented according<br />
to the format of the Swedish <strong>Annual</strong> Accounts Act, while the statement<br />
of comprehensive income, statement of changes in shareholders’ equity<br />
and cash flow statement are based on IAS 1 Presentation of Financial<br />
Statements and IAS 7 Statement of Cash Flows, respectively. The differences<br />
with the Group’s statements that apply to the Parent Company’s<br />
income statement and balance sheet primarily relate to the recognition of<br />
financial income and expenses, fixed assets, shareholders’ equity and the<br />
incidence of provisions as an independent heading in the balance sheet.<br />
(ii) Subsidiaries<br />
In the Parent Company, participations in subsidiaries are reported pursuant<br />
to acquisition accounting. This means that transaction expenditure<br />
is included in the carrying amount of participations in subsidiaries. In the<br />
consolidated accounts, transaction expenses are recognised directly in<br />
income as they arise.<br />
Conditional purchase prices are measured on the likelihood that the purchase<br />
price will be payable. Potential changes of the conditional purchase<br />
price are added to/deducted from cost. In the consolidated accounts,<br />
conditional purchase prices are recognised at fair value with value changes<br />
recognised in income.<br />
Bargain purchases that correspond to future expected losses and expenses<br />
are dissolved over the expected periods the losses and expenses<br />
arise. Bargain purchases that occur for other reasons are reported as a<br />
provision to the extent they do not exceed the fair value of purchased identifiable<br />
non-monetary assets. That portion that exceeds this value is recognised<br />
as revenue directly. That portion that does not exceed the fair value<br />
of purchased identifiable non-monetary assets is recognised systematically<br />
over a period estimated as the remaining weighted average useful life of<br />
the acquired identifiable assets that can be depreciated or amortised. In<br />
the consolidated accounts, bargain purchases are recognised directly in<br />
income.<br />
(iii) Long-term monetary dealings<br />
Long-term monetary dealings between the Parent Company and independent<br />
foreign operations that represent an extension or reduction of<br />
the Parent Company’s investment in foreign operations are measured at<br />
historical rates of exchange in the Parent Company.<br />
(iv) Property, plant and equipment<br />
In the Parent Company, property, plant and equipment are reported at<br />
cost less deductions for accumulated depreciation and potential impairment<br />
losses in the same manner as the Group but with a supplement for<br />
potential revaluations.<br />
(v) Leased assets<br />
In the Parent Company, all leases are reported pursuant to the rules for<br />
operating leases.<br />
(vi) Research and development<br />
In the Parent Company, all expenditure for development is reported as a<br />
cost in the Income Statement.<br />
H Ö G A N Ä S 2 0 1 0 55<br />
1<br />
2<br />
3<br />
4<br />
5<br />
6<br />
7<br />
8<br />
9<br />
10<br />
11<br />
12<br />
13<br />
14<br />
15<br />
16<br />
17<br />
18<br />
19<br />
20<br />
21<br />
22<br />
23<br />
24<br />
25<br />
26<br />
27<br />
28<br />
29<br />
30<br />
31<br />
32<br />
33<br />
34
F I N A N C I A L I N F O R M AT I O N<br />
(vii) Employee benefits<br />
Defined benefit plans<br />
The Parent Company uses a different basis for calculating defined benefit<br />
plans than stipulated by IAS 19. The Parent Company follows the stipulations<br />
of the Swedish Pension Obligations Vesting Act (Tryggandelagen)<br />
and the Swedish Financial Supervisory Authority’s instructions, because<br />
this is a prerequisite for tax deductions. The most significant differences<br />
compared to IAS 19 are determining the discount rate, calculating the defined<br />
benefit commitment on the basis of current salary levels without any<br />
assumptions of future pay increases, and that all actuarial gains and losses<br />
are reported in the Income Statement when they arise.<br />
(viii) Tax<br />
In the Parent Company, untaxed provisions are reported in the Balance<br />
Sheet without any division between shareholders’ equity and deferred tax<br />
liability, unlike in the Group. Correspondingly, in the Income Statement<br />
of the Parent Company, there is no division of part of appropriations to<br />
deferred tax costs.<br />
NOTE 2 OPERATING SEGMENTS<br />
The Group’s operating activities are divided into operating segments<br />
based on what part of operating activities the company’s chief operating<br />
decision-maker is monitoring, known as the ‘management approach.’<br />
The Group’s operating activities are organised so that Group management<br />
monitors the results, returns and cash flow the Group’s various<br />
goods generate. Because Group management monitors the results of<br />
operations and decides on the allocation of resources on the basis of the<br />
goods the Group manufactures and sells, these constitute the Group’s<br />
operating segments.<br />
Accordingly, the Group’s internal reporting is structured so that Group<br />
management can monitor the performance and results of all goods. The<br />
Group’s segments have been identified on the basis of this internal reporting.<br />
Segments’ investments in property, plant and equipment and intangible<br />
assets include all investments apart from investments in expendable<br />
equipment and equipment of lesser value.<br />
Internal pricing between the Group’s various segments is determined<br />
on the basis of the principle of ‘arm’s length’, that is between parties that<br />
are mutually independent, well-informed and with an interest in conducting<br />
the transactions.<br />
The following operating segments have been identified:<br />
• Components<br />
• Consumables<br />
56 H Ö G A N Ä S 2 0 1 0<br />
(ix) Government subsidies<br />
In the Parent Company, all government subsidies received for research<br />
and development are recognised as other operating income in the Income<br />
Statement, i.e. even such subsidies that are reported in the Consolidated<br />
Statement of Financial Position.<br />
(x) Group contributions and shareholders’ contributions for legal entities<br />
The Company reports Group contributions and shareholders’ contributions<br />
pursuant to the statement from RFR (UFR 2). Shareholders’ contributions<br />
are reported directly against the recipient’s shareholders’ equity and<br />
are capitalised in shares and participations of the issuer, to the extent no<br />
impairment loss is necessary. Group contributions are reported according<br />
to their economic substance, which means that Group contributions made<br />
and received with the aim of minimising the Group’s total tax are reported<br />
directly against profit brought forward after deductions for their current tax<br />
effect.<br />
Components comprises all powder that is refined into components. Consumables<br />
comprises powders that are used in processes, for example<br />
to produce metals, as an additive in chemical processes, surface coating<br />
or food supplements. Components represents 76% of Group sales and<br />
Consumables the remainder.<br />
Segment earnings, assets and liabilities include directly attributable<br />
items and items that can be allocated between segments in a reasonable<br />
and reliable manner. Non-allocated items comprise earnings from the sale<br />
of emission rights, financial income, financial expenses and tax expenses.<br />
Assets and liabilities that have not been allocated by segment are<br />
deferred tax assets, income taxes recoverable, deferred tax liabilities,<br />
interest-bearing liabilities and current tax liabilities.<br />
The Group’s operating segments are divided into the following geographical<br />
regions: Europe, America and Asia. America means North and<br />
South America. All geographical regions include operations conducted for<br />
Components and Consumables.<br />
The information presented regarding the segment’s income relates<br />
to the geographical regions grouped according to where customers are<br />
located. The group has no single customer representing more than 10%<br />
of total revenues.<br />
Information regarding the segments’ assets and investments in property,<br />
plant and equipment and intangible assets in the period are based on<br />
geographical regions grouped according to where the assets are located.
CONT. NOTE 2 OPERATING SEGMENTS<br />
Group<br />
OPERATING SEGMENTS<br />
F I N A N C I A L I N F O R M AT I O N<br />
Components Consumables Eliminations Total<br />
MSEK <strong>2010</strong> 2009 <strong>2010</strong> 2009 <strong>2010</strong> 2009 <strong>2010</strong> 2009<br />
Income<br />
External sales 5,046 3,292 1,625 1,279 6,671 4,571<br />
Internal sales 1,440 801 482 238 -1,922 -1,039 - -<br />
Total income 6,486 4,093 2,107 1,517 -1,922 -1,039 6,671 4,571<br />
Earnings<br />
Operating income 829 181 285 77 1,114 258<br />
Group items - - - - - 40 - 40<br />
Adjusted operating income 829 181 285 77 - 40 1,114 298<br />
Financial income 11 5<br />
Financial expenses -41 -32<br />
Tax -280 -65<br />
Net income 804 206<br />
Assets<br />
Assets 4,086 3,524 1,517 1,483 5,603 5,007<br />
Unallocated assets 64 111<br />
Total assets 5,667 5,118<br />
Liabilities<br />
Liabilities 739 548 285 277 1,024 825<br />
Unallocated liabilities 1,404 1,640<br />
Total liabilities 2,428 2,465<br />
Other information<br />
Investments 231 193 71 72 302 265<br />
Depreciation -227 -215 -66 -75 -293 -290<br />
Impairment - -23 - -6 - -29<br />
Parent Company<br />
Components Consumables Total<br />
MSEK <strong>2010</strong> 2009 <strong>2010</strong> 2009 <strong>2010</strong> 2009<br />
Income<br />
External sales - 1,988 - 423 - 2,411<br />
H Ö G A N Ä S 2 0 1 0 57<br />
1<br />
2<br />
3<br />
4<br />
5<br />
6<br />
7<br />
8<br />
9<br />
10<br />
11<br />
12<br />
13<br />
14<br />
15<br />
16<br />
17<br />
18<br />
19<br />
20<br />
21<br />
22<br />
23<br />
24<br />
25<br />
26<br />
27<br />
28<br />
29<br />
30<br />
31<br />
32<br />
33<br />
34
F I N A N C I A L I N F O R M AT I O N<br />
CONT. NOTE 2 OPERATING SEGMENTS<br />
GEOGRAPHICAL REGIONS<br />
Group<br />
58 H Ö G A N Ä S 2 0 1 0<br />
Income from<br />
external customers Assets Fixed assets<br />
<strong>2010</strong> 2009 <strong>2010</strong> 2009 <strong>2010</strong> 2009<br />
Sweden 39 43 2,606 2,284 1,390 1,347<br />
Europe 2,133 1,507 549 511 168 208<br />
America 2,006 1,349 1,681 1,555 985 1,056<br />
Asia 2,493 1,672 767 657 226 230<br />
Total 6,671 4,571 5,603 5,007 2,769 2,841<br />
Parent Company<br />
Income from<br />
external customers<br />
<strong>2010</strong> 2009<br />
Europe - 1,215<br />
America - 223<br />
Asia - 973<br />
Total - 2,411<br />
NOTE 3 OTHER OPERATING INCOME<br />
Group<br />
MSEK <strong>2010</strong> 2009<br />
Exchange gains on receivables/liabilities relating to operations 73 21<br />
Emission rights - 40<br />
Capital gain from sale of property in <strong>Höganäs</strong> 1 3<br />
Capital gain from sale of machinery in <strong>Höganäs</strong> 3 -<br />
Capital gain from sale of machinery in Brazil - 2<br />
Government subsidy 2 -<br />
Other - 3<br />
Total 79 69<br />
Parent Company<br />
MSEK <strong>2010</strong> 2009<br />
Exchange gains on receivables/liabilities relating to operations - 10<br />
Emission rights - 40<br />
Government subsidy 7 -<br />
Capital gain from sale of property in <strong>Höganäs</strong> 1 3<br />
Total 8 53<br />
NOTE 4 OTHER OPERATING EXPENSES<br />
Group Parent Company<br />
MSEK <strong>2010</strong> 2009 <strong>2010</strong> 2009<br />
Exchange losses on receivables/liabilities relating to operations 84 33 1 21<br />
Income, currency hedges - 29 - -<br />
Income, cash flow hedges 5 65 - 65<br />
Capital gain on intragroup transfer of assets and liabilities - - 562 -<br />
Other 1 3 3 -<br />
Total 90 130 566 86
NOTE 5 EMPLOYEES AND PERSONNEL EXPENSES<br />
Expenses for employee benefits<br />
Group<br />
MSEK <strong>2010</strong> 2009<br />
Salaries and benefits, etc.<br />
Pension costs, defined benefit plans<br />
626 563<br />
(see Note 25)<br />
9 18<br />
Pension costs, defined contribution plans 43 37<br />
Social security expenses 212 181<br />
Total 890 799<br />
Salaries, other benefits and social security expenses<br />
Parent Company<br />
MSEK <strong>2010</strong> 2009<br />
Salaries and benefits 85 281<br />
Social security expenses 63 133<br />
(of which pension costs)* (29) (41)<br />
Total 148 414<br />
* Of Parent Company pension costs, MSEK 2.3 (2.2) relates to the Board of Directors, CEO<br />
and SVP. The Company’s outstanding pension commitments to these executives is MSEK<br />
10.1 (6.0).<br />
Average no. of employees<br />
Of which<br />
Of which<br />
<strong>2010</strong> men, % 2009 men, %<br />
Parent Company in<br />
Sweden 154 76 637 84<br />
Subsidiaries<br />
Sweden 561 85 - -<br />
Belgium 134 90 133 90<br />
Brazil 149 86 121 85<br />
France 5 40 5 40<br />
India 82 96 75 95<br />
Italy 5 40 5 40<br />
Japan 30 83 27 85<br />
China 76 74 68 75<br />
Korea 7 57 6 50<br />
Russia 5 20 - -<br />
Spain 3 33 4 50<br />
UK 26 77 24 79<br />
Taiwan 8 38 7 43<br />
Germany 10 50 10 50<br />
USA 364 92 318 92<br />
Total in subsidiaries 1,465 86 803 87<br />
Group total 1,619 85 1,440 85<br />
F I N A N C I A L I N F O R M AT I O N<br />
Salaries and other benefits by country and between Board members,<br />
etc. and other employees<br />
<strong>2010</strong> 2009<br />
MSEK<br />
The Board,<br />
CEO &<br />
SVP<br />
Other employees<br />
The Board,<br />
CEO & Other em-<br />
SVP ployees<br />
Parent Company in<br />
Sweden 11 74 11 271<br />
(of which bonuses etc.) (2) (2) (2) (1)<br />
Parent Company total 11 74 11 271<br />
Subsidiaries<br />
Sweden - 226 - -<br />
Belgium - 46 - 50<br />
Brazil 2 23 1 21<br />
France - 3 - 3<br />
India 2 9 1 8<br />
Italy - 3 - 4<br />
Japan 5 23 4 19<br />
China 1 9 - 8<br />
Korea 2 2 1 2<br />
Russia 1 1 - -<br />
Spain 1 1 2 1<br />
UK - 9 - 8<br />
Taiwan 1 2 1 3<br />
Germany 2 6 2 6<br />
USA 4 157 3 134<br />
Total in subsidiaries 21 520 15 267<br />
(of which bonuses etc.) (2) (-) (1) (-)<br />
Group total 32 594 26 538<br />
Of the salaries and benefits paid to other employees of the Group, MSEK 23.1 (22.0)<br />
relates to senior managers other than the Board of Directors, CEO and SVP.<br />
Profit share system<br />
<strong>Höganäs</strong> introduced a profit share system for all staff of the group in the year. This program<br />
runs for the period <strong>2010</strong>-2012. Entitlement to profit sharing starts when the group’s income<br />
after tax exceeds MSEK 344, and the full allocation is when income exceeds MSEK 482.<br />
The maximum allocation in the group for the profit share program <strong>2010</strong> is MSEK 24.1. This<br />
has been fully provisioned in the financial year <strong>2010</strong>.<br />
Sickness absence, %<br />
Parent Company<br />
<strong>2010</strong> 2009<br />
Total sickness absence as a share of<br />
scheduled working-hours<br />
Share of total sickness absence that is con-<br />
2.5 3.3<br />
tinuous sickness absence of 60 days or more<br />
Sickness absence as a share of each group’s<br />
scheduled working-hours<br />
Sickness absence by gender:<br />
53.1 35.4<br />
Men 2.0 3.2<br />
Women 3.9 3.7<br />
Sickness absence by age group:<br />
Up to age 29 1.4 3.9<br />
Age 30-49 1.8 2.7<br />
Age 50 or above 3.9 4.1<br />
H Ö G A N Ä S 2 0 1 0 59<br />
1<br />
2<br />
3<br />
4<br />
5<br />
6<br />
7<br />
8<br />
9<br />
10<br />
11<br />
12<br />
13<br />
14<br />
15<br />
16<br />
17<br />
18<br />
19<br />
20<br />
21<br />
22<br />
23<br />
24<br />
25<br />
26<br />
27<br />
28<br />
29<br />
30<br />
31<br />
32<br />
33<br />
34
F I N A N C I A L I N F O R M AT I O N<br />
CONT. NOTE 5 EMPLOYEES AND PERSONNEL EXPENSES<br />
Gender division of management, %<br />
Group<br />
NOTE 6 AUDITORS ’ FEES AND REIMBURSEMENT EXPENSES<br />
60 H Ö G A N Ä S 2 0 1 0<br />
<strong>2010</strong> 2009<br />
Percentage Percentage<br />
women women<br />
The Board 1 1<br />
Other senior managers 0 0<br />
Group Parent Company<br />
MSEK <strong>2010</strong> 2009 <strong>2010</strong> 2009<br />
KPMG<br />
Auditing 5.2 5.5 0.8 2.2<br />
Auditing in addition<br />
to audit assignment - - - -<br />
Tax consultancy 0.4 1.0 0.4 1.0<br />
Other 0.8 0.6 0.8 0.5<br />
Other auditors - - - -<br />
NOTE 7 OPERATING EXPENSES BY COST TYPE<br />
Depreciation and cost of goods sold recognised in the Income Statement<br />
Group<br />
Parent Company<br />
<strong>2010</strong> 2009<br />
Percentage Percentage<br />
women women<br />
The Board 10 10<br />
Other senior managers 0 0<br />
Auditing means auditing of annual accounts and accounting records and<br />
the Board of Directors’ and Chief Executive Officer’s administration and<br />
other tasks incumbent on the Company’s auditors (including summary<br />
reviews of interim reports).<br />
MSEK Note <strong>2010</strong> 2009<br />
Included in cost of goods sold<br />
Amortisation of intangible assets 11 6 8<br />
Depreciation of property, plant and equipment 12 235 243<br />
Impairment of property, plant and equipment - 29<br />
Other expenses for goods production/consumption 4,589 3,331<br />
Included in selling expenses<br />
Amortisation of intangible assets 11 1 1<br />
Depreciation of property, plant and equipment 12 9 8<br />
Included in administration expenses<br />
Amortisation of intangible assets 11 16 6<br />
Depreciation of property, plant and equipment 12 12 12<br />
Personnel expenses 5<br />
Salaries and benefits 626 563<br />
Share-based payment - -<br />
Social security expenses 212 181<br />
Pension costs 52 55<br />
Total 890 799<br />
Research and development costs<br />
The Consolidated Income Statement reports MSEK 145 (99) as research and development costs, of which amortisation comprises MSEK 14 (12).<br />
Direct production-related expenses in the form of amortisation of licences and capitalised development expenses of MSEK 6 (8) and selling expenses<br />
of MSEK 1 (1) respectively were charged to cost of goods sold.
NOTE 8 NET FINANCIAL INCOME /EXPENSE<br />
Group<br />
MSEK <strong>2010</strong> 2009<br />
Interest income on bank balances 4 5<br />
Net exchange rate differences 7 -<br />
Financial income 11 5<br />
Interest expenses on loans measured at<br />
amortised cost -25 -21<br />
Interest expenses attributable to interest<br />
swaps -16 -8<br />
Net exchange rate differences - -3<br />
Financial expenses -41 -32<br />
Net financial income/expense -30 -27<br />
Income from participations in group companies<br />
Parent Company<br />
MSEK <strong>2010</strong> 2009<br />
Dividend 44 20<br />
Total 44 20<br />
Interest income and similar items<br />
MSEK <strong>2010</strong> 2009<br />
Interest income, Group companies 4 23<br />
Interest income, other 2 1<br />
Income, cash flow hedges 105 -<br />
Net exchange rate differences 114 47<br />
Total 225 71<br />
Interest expenses and similar items<br />
MSEK <strong>2010</strong> 2009<br />
Interest expenses, Group companies -3 -<br />
Interest expenses, other -38 -25<br />
Income, cash flow hedges - -18<br />
Net exchange rate differences - -<br />
Total -41 -43<br />
NOTE 9 TAX<br />
<strong>Report</strong>ed in the Income Statement<br />
Group<br />
F I N A N C I A L I N F O R M AT I O N<br />
MSEK <strong>2010</strong> 2009<br />
Current tax expense (-) /tax income (+)<br />
Tax expense for the period -267 -134<br />
Adjustment of tax attributable to previous year -3 -1<br />
-270 -135<br />
Deferred tax expense (-) /tax income (+)<br />
Deferred tax relating to temporary differences 31 65<br />
Deferred tax income in taxable value of loss<br />
carry-forwards capitalised in the year - 10<br />
Deferred tax expense in utilisation of previously<br />
capitalised taxable value of loss carry-forwards -48 -1<br />
Adjustment of deferred tax attributable to<br />
previous year 7 -4<br />
-10 70<br />
Total reported tax expense in the Group -280 -65<br />
Parent Company<br />
MSEK <strong>2010</strong> 2009<br />
Current tax expense (-) /tax income (+)<br />
Tax expense for the period -5 -105<br />
Adjustment of tax attributable to previous year - -<br />
-5 -105<br />
Deferred tax expense (-) /tax income (+)<br />
Deferred tax relating to temporary differences -16 -<br />
-16 -<br />
Total reported tax expense in<br />
Parent Company -21 -105<br />
H Ö G A N Ä S 2 0 1 0 61<br />
1<br />
5<br />
6<br />
7<br />
8<br />
9<br />
10<br />
11<br />
12<br />
13<br />
14<br />
15<br />
16<br />
17<br />
18<br />
19<br />
20<br />
21<br />
22<br />
23<br />
24<br />
25<br />
26<br />
27<br />
28<br />
29<br />
30<br />
31<br />
32<br />
33<br />
34
F I N A N C I A L I N F O R M AT I O N<br />
CONT. NOTE 9 TAX<br />
Reconciliation of effective tax<br />
Group<br />
MSEK <strong>2010</strong> 2009<br />
Income before tax 1,084 271<br />
Tax at current tax rate for Parent Company 26.3% -285 26.3 % -71<br />
Effect of other tax rates for foreign subsidiaries 4.4% -48 4.4 % -12<br />
Non-deductible costs 0.4% -4 1.1 % -3<br />
Non-taxable income -4.8% 52 -10.3 % 28<br />
Utilisation of previously un-capitalised loss carry-forwards and temporary differences -0.5% 5 - -<br />
Tax attributable to previous year - - 2.2 % -6<br />
Standard interest on tax allocation reserve - - 0.4 % -1<br />
<strong>Report</strong>ed effective tax 25.8% -280 24.1% -65<br />
Parent Company<br />
MSEK <strong>2010</strong> 2009<br />
Income before tax 83 415<br />
Tax at current tax rate for Parent Company 26.3% -22 26.3% -109<br />
Non-deductible costs 1.2% -1 0.2% -1<br />
Non-taxable income -14.4% 12 -1.4% 6<br />
Other taxes 12.0% -10 - -<br />
Standard interest on tax allocation reserve - - 0.2% -1<br />
<strong>Report</strong>ed effective tax 25.1% -21 25.3% -105<br />
Tax items reported in other comprehensive income<br />
Group<br />
MSEK <strong>2010</strong> 2009<br />
Current tax attributable to hedging currency risk in foreign operation -20 -35<br />
Deferred tax attributable to hedging currency risk in foreign operation -21 -23<br />
Deferred tax attributable to cash flow hedges -22 -52<br />
Deferred tax attributable to exchange rate difference -75 -21<br />
Current tax attributable to exchange rate difference -8 21<br />
Total -146 -110<br />
Parent Company<br />
MSEK <strong>2010</strong> 2009<br />
Current tax attributable to hedging currency risk in foreign operation 1 1<br />
Deferred tax attributable to hedging 3 -51<br />
Total 4 -50<br />
Tax items reported directly against shareholders’ equity<br />
Parent Company<br />
MSEK <strong>2010</strong> 2009<br />
Current tax in Group contributions paid 19 20<br />
Current tax in Group contributions received -195 -1<br />
Total -176 19<br />
62 H Ö G A N Ä S 2 0 1 0
CONT. NOTE 9 TAX<br />
Deferred tax assets and liabilities reported in the Statement of Financial Position<br />
Group<br />
Deferred tax asset Deferred tax liability Net<br />
F I N A N C I A L I N F O R M AT I O N<br />
MSEK 31 Dec. <strong>2010</strong> 31 Dec. 2009 31 Dec. <strong>2010</strong> 31 Dec. 2009 31 Dec. <strong>2010</strong> 31 Dec. 2009<br />
Intangible assets - - 12 13 -12 -13<br />
Property, plant and equipment - - 342 363 -342 -363<br />
Financial assets - - 11 8 -11 -8<br />
Inventories 14 11 - - 14 11<br />
Accounts receivable—trade 4 8 - - 4 8<br />
Pension provisions 7 8 - - 7 8<br />
Interest-bearing liabilities - - 104 10 -104 -10<br />
Financial instruments - - 25 3 -25 -3<br />
Tax allocation reserves - - - 21 - -21<br />
Other 7 - - 3 7 -3<br />
Loss carry-forwards 132 186 - - 132 186<br />
Tax assets/liabilities 164 213 494 421 -330 -208<br />
Set-off -114 -124 -114 -124 - -<br />
Tax assets/liabilities, net 50 89 380 297 -330 -208<br />
Parent Company<br />
Deferred tax asset Deferred tax liability Net<br />
MSEK 31 Dec. <strong>2010</strong> 31 Dec. 2009 31 Dec. <strong>2010</strong> 31 Dec. 2009 31 Dec. <strong>2010</strong> 31 Dec. 2009<br />
Accounts receivable—trade - 5 - - - 5<br />
Financial instruments - - 12 3 -12 -3<br />
Pension provisions 4 4 - - 4 4<br />
Tax assets/liabilities 4 9 12 3 -8 6<br />
Set-off -4 -3 -4 -3 - -<br />
Tax assets/liabilities, net - 6 8 - -8 6<br />
Un-reported deferred tax assets<br />
Deductible temporary differences and loss carry-forwards for which deferred tax assets have not been reported in the Income Statement and<br />
Statement of Financial Position.<br />
Group<br />
MSEK 31 Dec. <strong>2010</strong> 31 Dec. 2009<br />
Deductible temporary differences, China - 2<br />
Deductible deficits (State tax), US 27 31<br />
Total 27 33<br />
H Ö G A N Ä S 2 0 1 0 63<br />
1<br />
2<br />
3<br />
4<br />
5<br />
6<br />
7<br />
8<br />
9<br />
10<br />
11<br />
12<br />
13<br />
14<br />
15<br />
16<br />
17<br />
18<br />
19<br />
20<br />
21<br />
22<br />
23<br />
24<br />
25<br />
26<br />
27<br />
28<br />
29<br />
30<br />
31<br />
32<br />
33<br />
34
F I N A N C I A L I N F O R M AT I O N<br />
CONT. NOTE 9 TAX<br />
Change in deferred tax in temporary differences and loss carry-forwards<br />
Group<br />
64 H Ö G A N Ä S 2 0 1 0<br />
Balance as of <strong>Report</strong>ed in <strong>Report</strong>ed in Balance as of<br />
MSEK 1 Jan. 2009 Income Statement Other Comprehensive Income 31 Dec. 2009<br />
Intangible assets -14 1 - -13<br />
Property, plant and equipment -400 27 10 -363<br />
Financial assets -8 - - -8<br />
Inventories 17 -6 - 11<br />
Accounts receivable—trade 4 4 - 8<br />
Pension provisions - 8 - 8<br />
Interest-bearing liabilities 11 23 -44 -10<br />
Financial instruments 51 -3 -51 -3<br />
Tax allocation reserves -60 39 - -21<br />
Other 34 -35 -2 -3<br />
Loss carry-forwards 185 12 -11 186<br />
Total -180 70 -98 -208<br />
Balance as of <strong>Report</strong>ed in <strong>Report</strong>ed in Balance as of<br />
MSEK 1 Jan. <strong>2010</strong> Income Statement Other Comprehensive Income 31 Dec. <strong>2010</strong><br />
Intangible assets -13 1 - -12<br />
Property, plant and equipment -363 7 14 -342<br />
Financial assets -8 -3 - -11<br />
Inventories 11 3 - 14<br />
Accounts receivable—trade 8 -4 - 4<br />
Pension provisions 8 - -1 7<br />
Interest-bearing liabilities -10 2 -96 -104<br />
Financial instruments -3 - -22 -25<br />
Tax allocation reserves -21 21 - -<br />
Other -3 10 - 7<br />
Loss carry-forwards 186 -47 -7 132<br />
Total -208 -10 -112 -330<br />
Parent Company<br />
Balance as of <strong>Report</strong>ed in <strong>Report</strong>ed in Balance as of<br />
MSEK 1 Jan. 2009 Income Statement Other Comprehensive Income 31 Dec. 2009<br />
Accounts receivable—trade 1 4 - 5<br />
Financial instruments 51 -3 -51 -3<br />
Other 2 -2 - -<br />
Pension provisions 3 1 - 4<br />
Total 57 - -51 6<br />
Balance as of <strong>Report</strong>ed in <strong>Report</strong>ed in Balance as of<br />
MSEK 1 Jan. <strong>2010</strong> Income Statement Other Comprehensive Income 31 Dec. <strong>2010</strong><br />
Accounts receivable—trade 5 -5 - -<br />
Financial instruments -3 -12 3 -12<br />
Pension provisions 4 - - 4<br />
Total 6 -17 3 -8
NOTE 10 APPROPRIATIONS<br />
Parent Company<br />
F I N A N C I A L I N F O R M AT I O N<br />
MSEK <strong>2010</strong> 2009<br />
Difference between reported depreciation and depreciation according to plan:<br />
Buildings and land 83 1<br />
Machinery and other technical installations 474 67<br />
Tax allocation reserve, net 80 147<br />
Total 637 215<br />
NOTE 11 INTANGIBLE ASSETS<br />
Group<br />
MSEK Goodwill<br />
Capitalised<br />
development<br />
expenses<br />
Patents and<br />
similar rights<br />
Advances,<br />
intangible assets Total<br />
Cumulative cost<br />
Opening balance, 1 January 2009 134 26 165 42 367<br />
Internally developed assets - 13 - - 13<br />
Other investments 1 - 54 29 84<br />
Sales and disposals - - -27 - -27<br />
Other changes - 6 43 -49 -<br />
Exchange rate differences for the year -6 - -1 - -7<br />
Closing balance, 31 December 2009 129 45 234 22 430<br />
Opening balance, 1 January <strong>2010</strong> 129 45 234 22 430<br />
Internally developed assets - - - - -<br />
Other investments - - 46 40 86<br />
Sales and disposals - - -56 - -56<br />
Other changes - 2 44 -39 7<br />
Exchange rate differences for the year -5 - -5 - -10<br />
Closing balance, 31 December <strong>2010</strong> 124 47 263 23 457<br />
Accumulated amortisation and<br />
impairment losses<br />
Opening balance, 1 January 2009 -34 -17 -68 - -119<br />
Amortisation for the year - -5 -15 - -20<br />
Other changes - -3 3 - -<br />
Exchange rate differences for the year 1 - -1 - -<br />
Closing balance, 31 December 2009 -33 -25 -81 - -139<br />
Opening balance, 1 January <strong>2010</strong> -33 -25 -81 - -139<br />
Amortisation for the year - -5 -24 - -29<br />
Other changes - - 7 - 7<br />
Exchange rate differences for the year - - 1 - 1<br />
Closing balance, 31 December <strong>2010</strong> -33 -30 -97 - -160<br />
Carrying amounts<br />
As of 1 January 2009 100 9 97 42 248<br />
As of 31 December 2009 96 20 153 22 291<br />
As of 1 January <strong>2010</strong> 96 20 153 22 291<br />
As of 31 December <strong>2010</strong> 91 17 166 23 297<br />
H Ö G A N Ä S 2 0 1 0 65<br />
1<br />
2<br />
3<br />
4<br />
5<br />
6<br />
7<br />
8<br />
9<br />
10<br />
11<br />
12<br />
13<br />
14<br />
15<br />
16<br />
17<br />
18<br />
19<br />
20<br />
21<br />
22<br />
23<br />
24<br />
25<br />
26<br />
27<br />
28<br />
29<br />
30<br />
31<br />
32<br />
33<br />
34
F I N A N C I A L I N F O R M AT I O N<br />
CONT. NOTE 11 INTANGIBLE ASSETS<br />
Impairment tests of intangible assets<br />
Impairment tests are conducted yearly for goodwill and other intangible<br />
assets that are not yet ready for use. The impairment test proceeds from<br />
the lowest level where the company internally allocates and monitors<br />
goodwill.<br />
Group<br />
Goodwill 31 Dec <strong>2010</strong> 31 Dec 2009<br />
<strong>Höganäs</strong> Belgium S.A. 4 4<br />
North American <strong>Höganäs</strong>, Inc. 6 6<br />
North American <strong>Höganäs</strong> High<br />
Alloys LLC 50 54<br />
<strong>Höganäs</strong> Brasil Ltda 10 10<br />
<strong>Höganäs</strong> India Pvt Ltd 21 22<br />
Total 91 96<br />
For each cash-generating unit, recoverable amounts are determined<br />
on the basis of measurements of value in use. These measurements<br />
are based on an internal forecast over the next five years, based on the<br />
company’s annually updated strategic plan, and thereafter, an assumed<br />
growth rate of between 3 and 10% per year for the different cash-generating<br />
units, based on the conditions applying on each market, for the<br />
following 15 years. Expected future cash flows according to these forecasts<br />
are the basis of measurement. In this context, the need for capital<br />
investment for retained capacity is also considered. A weighted average<br />
cost of capital (WACC) has been applied to each cash-generating unit<br />
proceeding from local market conditions for calculating the present value<br />
of future cash flows. Essentially, the change in the year relates to progress<br />
in India, where inflationary pressures affected general interest-rate conditions,<br />
and thus, primarily contributed to increased WACC compared to<br />
previous years.<br />
66 H Ö G A N Ä S 2 0 1 0<br />
Discount rate (before tax), % <strong>2010</strong> 2009<br />
Cash-generating units<br />
<strong>Höganäs</strong> Belgium S.A. 9.5 9.5<br />
North American <strong>Höganäs</strong>, Inc. 12.1 12.4<br />
North American <strong>Höganäs</strong> High<br />
Alloys LLC 12.5 12.4<br />
<strong>Höganäs</strong> Brasil Ltda 10.4 10.4<br />
<strong>Höganäs</strong> India Pvt Ltd 17.9 11.6<br />
Other assumptions and comments<br />
Average growth for units of the group of 6-8% are assumed for the<br />
next five years. Units in Asia and South America lie in the upper interval,<br />
while those located in Europe and Japan are somewhat lower, and are<br />
essentially unchanged on the previous year’s assumptions. For the North<br />
American units, a somewhat improved growth rate is assumed, as a<br />
consequence of the recovery of the car industry. The growth rate in India<br />
is assumed to increase, and lies somewhat above the group’s average<br />
growth rate because this market is relatively young. Good market growth<br />
is assumed mainly in South America and Asia, apart from Japan.<br />
Raw materials prices are judged on current price levels.<br />
The forecast of personnel expenses is based on expected inflation,<br />
some real pay increases and planned rationalisations.<br />
Exchange rate forecasts are based on relevant quoted exchange<br />
rates and quoted forward rates, and are consistent with external forecast<br />
sources. Existing currency hedges have been considered.<br />
Management judges that reasonable changes in the key assumptions<br />
would not have such a substantial effect that each of them should imply<br />
the recoverable amounts being at a value less than the carrying amount<br />
for each cash-generating unit.
CONT. NOTE 11 INTANGIBLE ASSETS<br />
Parent Company<br />
MSEK Goodwill<br />
Capitalised<br />
development<br />
expenses<br />
Patents and<br />
similar rights<br />
F I N A N C I A L I N F O R M AT I O N<br />
Advances,<br />
intangible assets Total<br />
Cumulative cost<br />
Opening balance, 1 January 2009 - - 28 42 70<br />
Other investments - - 54 29 83<br />
Other changes - - 49 -49 -<br />
Sales and disposals - - -20 - -20<br />
Closing balance, 31 December 2009 - - 111 22 133<br />
Opening balance, 1 January <strong>2010</strong> - - 111 22 133<br />
Other investments - - - 24 24<br />
Other changes - - 42 -42 -<br />
Sales and disposals - - -57 - -57<br />
Closing balance, 31 December <strong>2010</strong> - - 96 4 100<br />
Accumulated amortisation<br />
Opening balance, 1 January 2009 - - -6 - -6<br />
Amortisation for the year - - -7 - -7<br />
Closing balance, 31 December 2009 - - -13 - -13<br />
Opening balance, 1 January <strong>2010</strong> - - -13 - -13<br />
Sales and disposals - - 6 - 6<br />
Amortisation for the year - - -16 - -16<br />
Closing balance, 31 December <strong>2010</strong> - - -23 - -23<br />
Carrying amounts<br />
As of 1 January 2009 - - 22 42 64<br />
As of 31 December 2009 - - 98 22 120<br />
As of 1 January <strong>2010</strong> - - 98 22 120<br />
As of 31 December <strong>2010</strong> - - 73 4 77<br />
Amortisation and impairment are allocated to the following lines in the Income Statement<br />
Parent Company<br />
Amortisation Impairment<br />
MSEK <strong>2010</strong> 2009 <strong>2010</strong> 2009<br />
Cost of goods sold - 1 - -<br />
Selling expenses - - - -<br />
Administration expenses 16 6 - -<br />
Research and development costs - - - -<br />
Total 16 7 - -<br />
Government and EU-funded research and development projects<br />
Government subsidies received by the Group in the year were MSEK 7,<br />
of which MSEK 5 was capitalised. This relates mainly to the development<br />
of the direct-drive Electrical SMC Traction Motor. By using SMC materials,<br />
electric motors can be made lighter and smaller, while energy losses are<br />
reduced. The SMC material being developed by <strong>Höganäs</strong> is unique and<br />
is the foundation for achieving a compact and energy-efficient electric<br />
motor. This project is being run jointly with universities and industrial<br />
participants.<br />
<strong>Höganäs</strong> is also conducting an EU-funded research project into<br />
fuel cells with industrial participants and research organizations from<br />
Italy, France, Spain, Norway and Sweden. The aim is to produce an<br />
SOFC (Solid Oxide Fuel Cell). This fuel cell is ideally suited to generating<br />
electricity in household equipment, household heating, and for remote<br />
areas where there is no access to electric power, such as ski resorts etc.<br />
<strong>Höganäs</strong>’ contribution to this project is to develop porous metallic plates<br />
to which electrodes and electrolyte can then be applied.<br />
Borrowing costs<br />
The Group has not capitalised any borrowing costs directly attributable to<br />
qualifying assets, because there are no such costs.<br />
H Ö G A N Ä S 2 0 1 0 67<br />
1<br />
2<br />
3<br />
4<br />
5<br />
6<br />
7<br />
8<br />
9<br />
10<br />
11<br />
12<br />
13<br />
14<br />
15<br />
16<br />
17<br />
18<br />
19<br />
20<br />
21<br />
22<br />
23<br />
24<br />
25<br />
26<br />
27<br />
28<br />
29<br />
30<br />
31<br />
32<br />
33<br />
34
F I N A N C I A L I N F O R M AT I O N<br />
NOTE 12 PROPERTY, PLANT AND EQUIPMENT<br />
Group<br />
MSEK<br />
68 H Ö G A N Ä S 2 0 1 0<br />
Buildings<br />
and land<br />
Machinery and<br />
other technical<br />
installations<br />
Equipment, tools,<br />
fixtures and fittings<br />
Construction in<br />
progress Total<br />
Cumulative cost<br />
Opening balance, 1 January 2009 1,206 3,721 288 225 5,440<br />
Investments for the year 8 59 6 155 228<br />
Sales and disposals -16 -101 -21 - -138<br />
Other changes 25 143 13 -181 -<br />
Exchange rate differences for the year -19 -45 -3 -5 -72<br />
Closing balance, 31 December 2009 1,204 3,777 283 194 5,458<br />
Opening balance, 1 January <strong>2010</strong> 1,204 3,777 283 194 5,458<br />
Investments for the year 2 39 4 219 264<br />
Sales and disposals -2 -89 -8 - -99<br />
Other changes 28 158 14 -207 -7<br />
Exchange rate differences for the year -29 -93 -8 -6 -136<br />
Closing balance, 31 December <strong>2010</strong> 1,203 3,792 285 200 5,480<br />
Accumulated depreciation<br />
Opening balance, 1 January 2009 -436 -2,174 -206 - -2,816<br />
Sales and disposals 14 84 20 - 118<br />
Depreciation for the year -36 -213 -21 - -270<br />
Exchange rate differences for the year 10 35 1 - 46<br />
Closing balance, 31 December 2009 -448 -2,266 -206 - -2,920<br />
Opening balance, 1 January <strong>2010</strong> -448 -2,266 -206 - -2,920<br />
Sales and disposals 2 62 8 - 72<br />
Other changes - -4 4 - -<br />
Depreciation for the year -37 -212 -15 - -264<br />
Exchange rate differences for the year 9 50 8 - 67<br />
Closing balance, 31 December <strong>2010</strong> -474 -2,370 -201 - -3,045<br />
Accumulated impairment losses<br />
Opening balance, 1 January 2009 -7 -45 - - -52<br />
Impairment loss for the year - -29 - - -29<br />
Exchange rate differences for the year 1 - - - 1<br />
Closing balance, 31 December 2009 -6 -74 - - -80<br />
Opening balance, 1 January <strong>2010</strong> -6 -74 - - -80<br />
Impairment loss for the year - - - - -<br />
Sales and disposals - 18 - - 18<br />
Exchange rate differences for the year - 1 - - 1<br />
Closing balance, 31 December <strong>2010</strong> -6 -55 - - -61<br />
Carrying amounts<br />
As of 1 January 2009 763 1,502 82 225 2,572<br />
As of 31 December 2009 750 1,437 77 194 2,458<br />
As of 1 January <strong>2010</strong> 750 1,437 77 194 2,458<br />
As of 31 December <strong>2010</strong> 723 1,367 84 200 2,374
CONT. NOTE 12 PROPERTY, PLANT AND EQUIPMENT<br />
Parent Company<br />
MSEK<br />
Buildings<br />
and land<br />
Machinery and<br />
other technical<br />
installations<br />
Equipment, tools,<br />
fixtures and fittings<br />
F I N A N C I A L I N F O R M AT I O N<br />
Construction in<br />
progress Total<br />
Cumulative cost<br />
Opening balance, 1 January 2009 558 2,149 153 147 3,007<br />
Investments for the year - - - 127 127<br />
Sales and disposals -5 -65 -13 - -83<br />
Other changes 4 91 11 -106 -<br />
Closing balance, 31 December 2009 557 2,175 151 168 3,051<br />
Opening balance, 1 January <strong>2010</strong> 557 2,175 151 168 3,051<br />
Investments for the year - - - 16 16<br />
Sales and disposals -525 -2,087 -114 -155 -2,881<br />
Other changes - 7 3 -10 -<br />
Closing balance, 31 December <strong>2010</strong> 32 95 40 19 186<br />
Accumulated revaluation<br />
Opening balance, 1 January 2009 30 - - - 30<br />
Closing balance, 31 December 2009 30 - - - 30<br />
Opening balance, 1 January <strong>2010</strong> 30 - - - 30<br />
Sales and disposals -30 - - - -30<br />
Closing balance, 31 December <strong>2010</strong> - - - - -<br />
Accumulated depreciation<br />
Opening balance, 1 January 2009 -257 -1,430 -128 - -1,815<br />
Depreciation for the year -15 -119 -6 - -140<br />
Sales and disposals 4 51 12 - 67<br />
Closing balance, 31 December 2009 -268 -1,498 -122 - -1,888<br />
Opening balance, 1 January <strong>2010</strong> -268 -1,498 -122 - -1,888<br />
Depreciation for the year -1 -7 -2 - -10<br />
Sales and disposals 248 1,458 90 - 1,796<br />
Closing balance, 31 December <strong>2010</strong> -21 -47 -34 - -102<br />
Accumulated impairment loss<br />
Opening balance, 1 January 2009 - - - - -<br />
Impairment loss for the year - -29 - - -29<br />
Sales and disposals - - - - -<br />
Closing balance, 31 December 2009 - -29 - - -29<br />
Opening balance, 1 January <strong>2010</strong> - -29 - - -29<br />
Impairment loss for the year - - - - -<br />
Sales and disposals - 29 - - 29<br />
Closing balance, 31 December <strong>2010</strong> - - - - -<br />
Carrying amounts<br />
As of 1 January 2009 331 719 25 147 1,222<br />
As of 31 December 2009 319 648 29 168 1,164<br />
As of 1 January <strong>2010</strong> 319 648 29 168 1,164<br />
As of 31 December <strong>2010</strong> 11 48 6 19 84<br />
Intra-group transfer of assets and liabilities<br />
As of 1 January <strong>2010</strong>, the operating activities of the parent company were transferred to <strong>Höganäs</strong> Sweden <strong>AB</strong>. This intragroup transfer was conducted<br />
at taxable values and involved operating receivables/liabilities and fixed assets. An intra-group capital loss of MSEK 562 arose. Subsequently, the parent<br />
company’s operations consist of the delivery of group-wide services, such as IT, research and development, marketing and similar central functions.<br />
H Ö G A N Ä S 2 0 1 0 69<br />
1<br />
2<br />
3<br />
4<br />
5<br />
6<br />
7<br />
8<br />
9<br />
10<br />
11<br />
12<br />
13<br />
14<br />
15<br />
16<br />
17<br />
18<br />
19<br />
20<br />
21<br />
22<br />
23<br />
24<br />
25<br />
26<br />
27<br />
28<br />
29<br />
30<br />
31<br />
32<br />
33<br />
34
F I N A N C I A L I N F O R M AT I O N<br />
CONT. NOTE 12 PROPERTY, PLANT AND EQUIPMENT<br />
Assessed values<br />
Group<br />
31 Dec. <strong>2010</strong> 31 Dec. 2009<br />
Assessed values, buildings (in Sweden) 316 323<br />
Assessed values, land (in Sweden) 106 111<br />
Carrying amounts, buildings 171 281<br />
Carrying amounts, land 73 38<br />
Parent Company<br />
31 Dec. <strong>2010</strong> 31 Dec. 2009<br />
Assessed values, buildings (in Sweden) 24 323<br />
Assessed values, land (in Sweden) 10 111<br />
Carrying amounts, buildings 10 281<br />
Carrying amounts, land 1 38<br />
Depreciation and impairment losses are allocated to the following<br />
lines of the Income Statement<br />
Parent Company<br />
Depreciation Impairment<br />
MSEK <strong>2010</strong> 2009 <strong>2010</strong> 2009<br />
Cost of goods sold - 129 - 29<br />
Selling expenses - 1 - -<br />
Administrative expenses 3 4 - -<br />
Research and<br />
development costs 7 6 - -<br />
Total 10 140 - 29<br />
NOTE 13 OPERATING LEASES<br />
Leases where the Company is lessee<br />
Irrevocable lease payments amount to:<br />
70 H Ö G A N Ä S 2 0 1 0<br />
Information on government support to the Group/Parent Company<br />
In 2005, <strong>Höganäs</strong> entered an agreement to supply heating to <strong>Höganäs</strong><br />
Fjärrvärme <strong>AB</strong> (district heating) for the period 2006 - 2025. <strong>Höganäs</strong><br />
<strong>AB</strong> was initially required to make an investment to be able to connect to<br />
<strong>Höganäs</strong> Fjärrvärme’s network. For this purpose, the Parent Company<br />
received a MSEK 25 subsidy from the Municipality of <strong>Höganäs</strong> to cover<br />
the investment.<br />
In 2008, a supplementary agreement was signed to extend delivery<br />
capacity of excess heat. To deliver on this extension, <strong>Höganäs</strong> <strong>AB</strong> conducted<br />
an expansion investment, partly funded by <strong>Höganäs</strong> Fjärrvärme<br />
<strong>AB</strong>, by paying a connection charge of MSEK 14. This investment was<br />
completed in 2009. In tandem with the intragroup transfer of assets and<br />
liabilities in <strong>2010</strong>, the part-funded equipment and associated support was<br />
transferred from <strong>Höganäs</strong> <strong>AB</strong> to <strong>Höganäs</strong> Sweden <strong>AB</strong>.<br />
The recognised deferred income at the end of the year for government<br />
subsidies received corresponds to 83% of the cost for the period of the<br />
assets the support is intended to cover. The deferred subsidy is recognised<br />
as revenue as the contract term continues, and is recognised in the<br />
other operating income item.<br />
Borrowing costs<br />
The Group has not capitalised any borrowing costs directly attributable to<br />
qualifying assets, because there are no such costs.<br />
Group Parent Company<br />
MSEK <strong>2010</strong> 2009 <strong>2010</strong> 2009<br />
Within one year 11 9 1 4<br />
Between one and five years 19 19 1 14<br />
Longer than five years 7 10 - -<br />
Total 37 38 2 18<br />
Lease costs for assets held through operating leases are rented property, machinery and major computer and office equipment and are reported under<br />
operating expenses, and amount to MSEK 11 (11) for the Group and MSEK 1 (5) for the Parent Company. The constituent variable payments are not<br />
significant amounts.<br />
Operating leases do not have indexation clauses or such terms as assign the right to extend or acquire the leased items. However, limitations apply<br />
to rights of disposal.
NOTE 14 GROUP COMPANIES<br />
Parent Company<br />
F I N A N C I A L I N F O R M AT I O N<br />
Participating interest, %<br />
Holding in subsidiaries Subsidiary registered office, country 31 Dec. <strong>2010</strong> 31 Dec. 2009<br />
<strong>Höganäs</strong> Hamnbyggnads <strong>AB</strong>, 556000-8301 <strong>Höganäs</strong>, Sweden 94 94<br />
<strong>Höganäs</strong> Sweden <strong>AB</strong>, 556204-9691 <strong>Höganäs</strong>, Sweden 100 100<br />
<strong>Höganäs</strong> Saltglaserat <strong>AB</strong>, 556054-5922 <strong>Höganäs</strong>, Sweden 100 100<br />
<strong>Höganäs</strong> HOGAP <strong>AB</strong>, 556324-0760 <strong>Höganäs</strong>, Sweden 100 100<br />
<strong>Höganäs</strong> Belgium S.A. Ath, Belgium 100 100<br />
<strong>Höganäs</strong> (GB) Ltd Kent, UK 100 100<br />
<strong>Höganäs</strong> Japan K.K. Tokyo, Japan 100 100<br />
<strong>Höganäs</strong> France S.A.S. Villefranche, France 100 100<br />
<strong>Höganäs</strong> GmbH Düsseldorf, Germany 100 100<br />
<strong>Höganäs</strong> Italia S.r.l. Rapallo, Italy 100 100<br />
<strong>Höganäs</strong> India Pvt Ltd Pune, India 100 100<br />
<strong>Höganäs</strong> East Europe LLC St. Petersburg, Russia 100 100<br />
<strong>Höganäs</strong> Ibérica S.A. Madrid, Spain 100 100<br />
<strong>Höganäs</strong> Taiwan Ltd Taipei, Taiwan 100 100<br />
<strong>Höganäs</strong> Korea Ltd Seoul, Korea 100 100<br />
<strong>Höganäs</strong> (China) Co., Ltd Shanghai, China 100 100<br />
North American <strong>Höganäs</strong> Holdings, Inc. Hollsopple, US 100 100<br />
North American <strong>Höganäs</strong>, Inc. Hollsopple, USA 100 100<br />
NAH Financial Services, Inc. Wilmington, USA 100 100<br />
North American <strong>Höganäs</strong> High Alloys LLC Hollsopple, USA 100 100<br />
NAH Finance Holding <strong>AB</strong>, 556662-4572 <strong>Höganäs</strong>, Sweden 100 100<br />
KHTech Inc. Wilmington, US 67 67<br />
<strong>Höganäs</strong> Brasil Ltda Mogi das Cruzes, Brazil 100 100<br />
Parent Company<br />
MSEK 31 Dec. <strong>2010</strong> 31 Dec. 2009<br />
Cumulative cost<br />
At beginning of year 1,315 996<br />
Capital contribution, <strong>Höganäs</strong> Belgium S.A. 2,183 -<br />
Acquisition, <strong>Höganäs</strong> (GB) Ltd. - 315<br />
Capital contribution, <strong>Höganäs</strong> East Europe LLC - 4<br />
Closing balance, 31 Dec. 3,498 1,315<br />
Cumulative impairment losses<br />
At beginning of year -86 -86<br />
Closing balance, 31 Dec. -86 -86<br />
Carrying amount in subsidiaries 3,412 1,229<br />
H Ö G A N Ä S 2 0 1 0 71<br />
1<br />
2<br />
3<br />
4<br />
5<br />
6<br />
7<br />
8<br />
9<br />
10<br />
11<br />
12<br />
13<br />
14<br />
15<br />
16<br />
17<br />
18<br />
19<br />
20<br />
21<br />
22<br />
23<br />
24<br />
25<br />
26<br />
27<br />
28<br />
29<br />
30<br />
31<br />
32<br />
33<br />
34
F I N A N C I A L I N F O R M AT I O N<br />
CONT. NOTE 14 GROUP COMPANIES<br />
Parent Company<br />
Specification of Parent Company direct holdings of participations in subsidiaries<br />
MSEK No. of shares<br />
72 H Ö G A N Ä S 2 0 1 0<br />
Share of<br />
equity, %<br />
Carrying amount<br />
31 Dec. <strong>2010</strong><br />
Carrying amount<br />
31 Dec. 2009<br />
<strong>Höganäs</strong> Hamnbyggnads <strong>AB</strong> 4,240 94 1 1<br />
<strong>Höganäs</strong> Sweden <strong>AB</strong> 24,000 100 2 2<br />
<strong>Höganäs</strong> Saltglaserat <strong>AB</strong> 1,000 100 - -<br />
<strong>Höganäs</strong> HOGAP <strong>AB</strong> 1,100 100 - -<br />
<strong>Höganäs</strong> Belgium S.A. 20,000 100 2,236 53<br />
<strong>Höganäs</strong> (GB) Ltd 139,999 100 315 315<br />
<strong>Höganäs</strong> Japan K.K. 6,000 100 15 15<br />
<strong>Höganäs</strong> France S.A. 700 100 2 2<br />
<strong>Höganäs</strong> GmbH 100 100 - -<br />
<strong>Höganäs</strong> Italia S.r.l. 60,000 100 - -<br />
<strong>Höganäs</strong> India Pvt Ltd 5,242,558 100 72 72<br />
<strong>Höganäs</strong> East Europe LLC 1 100 4 4<br />
<strong>Höganäs</strong> Ibérica S.A. 4,000 100 - -<br />
<strong>Höganäs</strong> Taiwan Ltd 5,000 100 1 1<br />
<strong>Höganäs</strong> Korea Ltd 40,000 100 2 2<br />
<strong>Höganäs</strong> (China) Co., Ltd - 100 100 100<br />
North American <strong>Höganäs</strong> Holdings, Inc. 1,000 100 580 580<br />
<strong>Höganäs</strong> Brasil Ltda 18,170,000 100 82 82<br />
Total 3,412 1,229<br />
NOTE 15 RECEIV<strong>AB</strong>LES FROM GROUP COMPANIES<br />
Parent Company<br />
MSEK 31 Dec. <strong>2010</strong> 31 Dec. 2009<br />
At beginning of year 1,039 1,476<br />
Additional receivables 225 1<br />
Settled receivables -1,020 -357<br />
Exchange rate differences for the year -9 -81<br />
Closing balance, 31 Dec. 235 1,039<br />
NOTE 16 LONG-TERM RECEIV<strong>AB</strong>LES<br />
Group<br />
MSEK 31 Dec. <strong>2010</strong> 31 Dec. 2009<br />
Plan assets, pensions 50 34<br />
Deposit 38 48<br />
Investment loan issued 8 8<br />
Derivatives held for hedging 6 1<br />
Other 2 1<br />
Total 104 92<br />
Parent Company<br />
MSEK 31 Dec. <strong>2010</strong> 31 Dec. 2009<br />
At beginning of year 2 -<br />
Increase - 2<br />
Change in fair value 5 -<br />
Closing balance, 31 Dec. 7 2<br />
Of the parent company’s long-term receivables, MSEK 6 (1) are derivatives that are held for hedging.
NOTE 17 INVENTORIES<br />
Group<br />
MSEK 31 Dec. <strong>2010</strong> 31 Dec. 2009<br />
Raw materials and consumables 592 365<br />
Products in process 303 246<br />
Finished goods and goods for resale 686 541<br />
Total 1,581 1,152<br />
Increase (+) / decrease (-) in<br />
obsolescence provision reported in:<br />
Income Statement 2 -11<br />
Total 2 -11<br />
NOTE 18 ACCOUNTS RECEIV<strong>AB</strong>LE—TRADE/CREDIT RISK<br />
Parent Company<br />
F I N A N C I A L I N F O R M AT I O N<br />
MSEK 31 Dec. <strong>2010</strong> 31 Dec. 2009<br />
Raw materials and consumables - 210<br />
Products in process - 140<br />
Finished goods and goods for resale - 145<br />
Total - 495<br />
Increase (+) / decrease (-) in<br />
obsolescence provision reported in:<br />
Income Statement -8 -8<br />
Total -8 -8<br />
Credit risk<br />
Credit risk can be divided into a commercial and a financial counterparty risk. The commercial counterparty risk is the risk that the Group’s customers<br />
become insolvent, and that sales forecasts or hedged flows cannot be realised.<br />
To some extent, <strong>Höganäs</strong>’ credit risk for customers is limited by sales being conducted in a high number of countries and to a large customer base,<br />
thus diversification of risk is achieved. <strong>Höganäs</strong> has credit insurance of MUSD 5 (10) intended to reduce credit risk from customers in the US. <strong>Höganäs</strong><br />
also uses export letters of credit when selling on certain markets.<br />
At the reporting date, the single biggest credit exposure was MSEK 16 (23). To further limit credit risk, the Group’s credit policy stipulates that all sales<br />
to new customers must be preceded by credit checks. Bad debt for <strong>2010</strong> was MSEK 8 (11), which is 0.12% of consolidated net sales.<br />
Financial counterparty risk is the risk of a counterparty the Finance function has entered an agreement with becoming insolvent and an investment<br />
and/or an unrealised gain not being re-paid.<br />
Age analysis, overdue, un-impaired accounts receivable<br />
Group<br />
MSEK, 31 Dec. <strong>2010</strong><br />
Carrying amount unimpaired<br />
receivable Collateral<br />
Non-overdue accounts receivable 717 -<br />
Overdue accounts receivable > 0-30 days 128 31<br />
Overdue accounts receivable > 30-90 days 34 3<br />
Overdue accounts receivable > 90-180 days 8 -<br />
Overdue accounts receivable > 180-360 days - -<br />
Overdue receivables > 360 days 2 -<br />
Total 889 34<br />
MSEK, 31 Dec. 2009<br />
Carrying amount unimpaired<br />
receivable Collateral<br />
Non-overdue accounts receivable 571 51<br />
Overdue accounts receivable > 0-30 days 109 14<br />
Overdue accounts receivable > 30-90 days 16 1<br />
Overdue accounts receivable > 90-180 days 10 -<br />
Overdue accounts receivable > 180-360 days 1 1<br />
Overdue receivables > 360 days - -<br />
Total 707 67<br />
Accounts receivable are reported considering the bad debt arising in the year. The provision for doubtful debts for the Group was MSEK 15 (31) at yearend.<br />
For the Parent Company, the provision for doubtful debt amounted to MSEK 0 (18).<br />
H Ö G A N Ä S 2 0 1 0 73<br />
1<br />
2<br />
3<br />
4<br />
5<br />
6<br />
7<br />
8<br />
9<br />
10<br />
11<br />
12<br />
13<br />
14<br />
15<br />
16<br />
17<br />
18<br />
19<br />
20<br />
21<br />
22<br />
23<br />
24<br />
25<br />
26<br />
27<br />
28<br />
29<br />
30<br />
31<br />
32<br />
33<br />
34
F I N A N C I A L I N F O R M AT I O N<br />
CONT. NOTE 18 ACCOUNTS RECEIV<strong>AB</strong>LE—TRADE/CREDIT RISK<br />
Concentration of credit risk in accounts receivable—trade<br />
Group<br />
31 Dec. <strong>2010</strong> No. of customers<br />
% of total number<br />
of customers % share of value<br />
Exposure < MSEK 1 1,416 87 23<br />
Exposure MSEK 1-50 217 13 77<br />
Exposure > MSEK 50 - - -<br />
Total 1,633 100 100<br />
<strong>Höganäs</strong> judges that the credit quality of financial assets that have neither become overdue for payment nor are subject to impairment is high and that<br />
there is no need for impairment losses.<br />
Provision account, bad debt<br />
Group Parent Company<br />
MSEK <strong>2010</strong> 2009 <strong>2010</strong> 2009<br />
At beginning of year 31 14 18 5<br />
Reversal of previous impairment -25 -11 -18 -<br />
Impairment loss for the year 9 28 - 13<br />
Closing balance 31 Dec. 15 31 - 18<br />
NOTE 19 PREPAID EXPENSES AND ACCRUED INCOME<br />
Group Parent Company<br />
MSEK 31 Dec. <strong>2010</strong> 31 Dec. 2009 31 Dec. <strong>2010</strong> 31 Dec. 2009<br />
Prepaid interest expense 3 1 12 -<br />
Prepaid insurance premiums 3 1 - -<br />
Emission rights sold 17 38 - 38<br />
Insurance compensation 1 1 - -<br />
Other items 17 15 5 8<br />
Total 41 56 17 46<br />
NOTE 20 CASH AND CASH EQUIVALENTS<br />
Group<br />
MSEK<br />
Cash and cash equivalents include the following components:<br />
31 Dec. <strong>2010</strong> 31 Dec. 2009<br />
Cash and bank balances 106 130<br />
Total 106 130<br />
Parent Company<br />
MSEK<br />
Cash and cash equivalents include the following components:<br />
31 Dec. <strong>2010</strong> 31 Dec. 2009<br />
Cash and bank balances 3 19<br />
Total 3 19<br />
Short-term investments have been classified as cash and cash equivalents because:<br />
• They have insignificant risk of value fluctuations<br />
• They can be readily converted to cash<br />
• They have a maximum maturity of three months from acquisition date<br />
74 H Ö G A N Ä S 2 0 1 0
NOTE 21 SHAREHOLDERS’ EQUITY<br />
Group<br />
MSEK<br />
Specification of provisions in shareholders’ equity<br />
F I N A N C I A L I N F O R M AT I O N<br />
Translation provision 31 Dec. <strong>2010</strong> 31 Dec. 2009<br />
Opening translation provision 53 51<br />
Translation differences for the year -292 -164<br />
Less hedging of currency risk in foreign operation 115 166<br />
Closing translation provision -124 53<br />
Hedging provision 31 Dec. <strong>2010</strong> 31 Dec. 2009<br />
Opening hedging provision 2 -143<br />
Cash flow hedges:<br />
Change in fair value for the year 34 308<br />
Transferred to net income 51 -112<br />
Tax attributable to hedges for the year -22 -51<br />
Closing hedging provision 65 2<br />
Dissolved against Income Statement 31 Dec. <strong>2010</strong> 31 Dec. 2009<br />
Cost of goods sold 67 -39<br />
Other operating expenses - -65<br />
Net financial income/expense -16 -8<br />
Total 51 -112<br />
Total provisions 31 Dec. <strong>2010</strong> 31 Dec. 2009<br />
Opening provisions 55 -92<br />
Change in provisions for the year:<br />
Translation provision -177 2<br />
Hedging provision 63 145<br />
Closing provisions -59 55<br />
Share capital and number of shares<br />
No. of shares Share capital<br />
MSEK 31 Dec. <strong>2010</strong> 31 Dec. 2009 31 Dec. <strong>2010</strong> 31 Dec. 2009<br />
Class A shares 981,000 981,000 5 5<br />
Class B shares 34,117,932 34,117,932 170 170<br />
Total 35,098,932 35,098,932 175 175<br />
The shares have a quotient value of SEK 5. Holders of ordinary shares are entitled to dividends progressively, and shareholdings have the following<br />
entitlements at <strong>Annual</strong> General Meetings: ten votes per class A share and one vote per class B share. All shares have equal entitlement to the Parent<br />
Company’s remaining net assets. Regarding treasury shares (see below), all rights cease until these shares are re-issued.<br />
Re-purchased treasury shares included in the shareholders’ equity item profit brought forward including net income<br />
MSEK 31 Dec. <strong>2010</strong> 31 Dec. 2009<br />
Opening re-purchased treasury shares 26 26<br />
Sales in the year - -<br />
Closing re-purchased treasury shares 26 26<br />
Number<br />
Opening re-purchased treasury shares 293,800 293,800<br />
Sales in the year - -<br />
Closing re-purchased treasury shares 293,800 293,800<br />
Provisions<br />
Translation provision<br />
The translation provision encompasses all exchange rate differences that<br />
arise when translating financial statements of foreign operations that have<br />
prepared financial statements in a currency other than the presentation<br />
currency of the consolidated accounts. The Parent Company and Group<br />
present their financial statements in Swedish kronor. Additionally, the<br />
translation provision comprises exchange rate differences arising from<br />
revaluing liabilities reported as hedging instrument of a net investment in<br />
a foreign operation.<br />
H Ö G A N Ä S 2 0 1 0 75<br />
1<br />
2<br />
3<br />
4<br />
5<br />
6<br />
7<br />
8<br />
9<br />
10<br />
11<br />
12<br />
13<br />
14<br />
15<br />
16<br />
17<br />
18<br />
19<br />
20<br />
21<br />
22<br />
23<br />
24<br />
25<br />
26<br />
27<br />
28<br />
29<br />
30<br />
31<br />
32<br />
33<br />
34
F I N A N C I A L I N F O R M AT I O N<br />
CONT. NOTE 21 SHAREHOLDERS ’ EQUITY<br />
Hedging provision<br />
The hedging provision covers the effective portion of the cumulative net<br />
change of fair value on cash flow hedging instruments attributable to<br />
hedged transactions that have not yet occurred.<br />
Profit brought forward including net income<br />
Profit brought forward including net income includes accrued profits of the<br />
Parent Company and its subsidiaries. Previous provisions to the statutory<br />
reserve are included in this shareholders’ equity item.<br />
Re-purchased shares<br />
Re-purchased shares include the acquisition cost of treasury shares held<br />
by the Parent Company.<br />
Dividend<br />
The Board of Directors proposed the following dividend after the reporting<br />
date. The dividends will be subject to approval by the AGM on 2 May<br />
2011.<br />
MSEK <strong>2010</strong> 2009<br />
SEK 10.00 (3.00) per share 348 104<br />
<strong>Report</strong>ed dividend per share, SEK 10.00 3.00<br />
Parent Company<br />
Changes in Parent Company’s shareholders’ equity are stated in the<br />
Statement of Changes in Parent Company Shareholders’ Equity on page<br />
47.<br />
Restricted reserves<br />
Restricted reserves may not be reduced through dividends.<br />
Statutory reserves<br />
The purpose of the statutory reserve is to save a portion of net income<br />
that cannot be used to cover losses brought forward.<br />
NOTE 22 UNTAXED RESERVES<br />
Parent Company<br />
76 H Ö G A N Ä S 2 0 1 0<br />
Non-restricted equity<br />
Fair value reserve<br />
The Company applies the regulations stipulated in the <strong>Annual</strong> Accounts<br />
Act governing the measurement of financial instruments at fair value in<br />
accordance with Chap. 4 § 14a-e. Amounts are reported directly to the<br />
fair value reserve when the value change relates to a hedging instrument<br />
and the applied principles governing hedge accounting allow that all or<br />
a part of the value change is recognised in shareholders’ equity. A value<br />
change that is caused by an exchange rate change of a monetary item<br />
that comprises part of the Company’s net investment in a foreign unit is<br />
reported to shareholders’ equity in accordance with the <strong>Annual</strong> Accounts<br />
Act Chap. 4 § 14f.<br />
Profit brought forward<br />
Profit brought forward comprises previous year’s non-restricted equity<br />
after potential provisions for statutory reserves, and after paying potential<br />
dividends. Alongside net income for the year and fair value reserve it comprises<br />
total non-restricted equity, i.e. the amounts available for dividends<br />
to shareholders.<br />
Earnings per share 31 Dec. <strong>2010</strong> 31 Dec. 2009<br />
Earnings per share before dilution (SEK) 23.11 5.92<br />
Earnings per share after dilution (SEK) 23.11 5.92<br />
Calculated here with the<br />
following components:<br />
Earnings attributable to<br />
Parent Company’s shareholders 804 206<br />
Weighted average number of shares,<br />
before dilution (’000) 34,805 34,805<br />
Weighted average number of shares,<br />
after dilution (’000) 34,805 34,805<br />
MSEK <strong>2010</strong> 2009<br />
Accumulated depreciation and amortisation in addition to plan:<br />
Intangible fixed assets<br />
Opening balance, 1 January - -<br />
Amortisation for the year in addition to plan 9 -<br />
Other changes 5 -<br />
Closing balance, 31 December 14 -<br />
Real estate used in business operations<br />
Opening balance, 1 January 89 90<br />
Depreciation for the year in addition to plan - -1<br />
Sales and disposals -83 -<br />
Closing balance, 31 December 6 89<br />
Machinery and equipment<br />
Opening balance, 1 January 526 593<br />
Depreciation for the year in addition to plan -3 -67<br />
Sales and disposals -480 -<br />
Other changes -5 -<br />
Closing balance, 31 December 38 526<br />
Tax allocation reserves<br />
Year of assessment 2009 - 80<br />
Closing balance, 31 December - 80<br />
Total untaxed reserves 58 695
NOTE 23 INTEREST-BEARING LI<strong>AB</strong>ILITIES<br />
Group<br />
F I N A N C I A L I N F O R M AT I O N<br />
MSEK 31 Dec. <strong>2010</strong> 31 Dec. 2009<br />
Long-term liabilities<br />
Credit facilities 797 1,111<br />
Finance lease liabilities 17 19<br />
Total 814 1,130<br />
Current liabilities<br />
Overdraft facilities 55 135<br />
Short-term bank loans 17 -<br />
Short-term portion of finance lease liabilities 3 2<br />
Total 75 137<br />
Covenants and repayment periods<br />
Current confirmed credit facilities were arranged by a syndicate of four banks in <strong>2010</strong>, and this facility matures in January 2013. At year-end these<br />
facilities amounted to MEUR 175, of which MEUR 32 (106) had been utilised. All confirmed credit facilities are conditional on two covenants. <strong>Höganäs</strong>’<br />
debt/equity ratio may not exceed 1.5. At year-end this was 0.24 (0.43). <strong>Höganäs</strong>’ interest coverage ratio adjusted for depreciation and amortisation<br />
may not be less than 4.0. At year-end, it was 34.6 (18.5). Additionally, unconfirmed credits were MSEK 1,957 (585), of which MSEK 569 (127) had been<br />
utilised at year-end.<br />
Finance lease liabilities<br />
Finance lease liabilities become due for payment as follows:<br />
Group<br />
MSEK<br />
Minimum lease<br />
payments<br />
<strong>2010</strong><br />
Interest<br />
<strong>2010</strong><br />
Principal<br />
<strong>2010</strong><br />
Minimum lease<br />
payments<br />
2009<br />
Interest<br />
2009<br />
Within one year 5 1 4 7 1 6<br />
Between one and five years 8 2 6 22 2 20<br />
Longer than five years 8 2 6 11 3 8<br />
NOTE 24 OTHER LONG-TERM LI<strong>AB</strong>ILITIES<br />
Group<br />
Principal<br />
2009<br />
MSEK 31 Dec. <strong>2010</strong> 31 Dec. 2009<br />
Other long-term liabilities<br />
Derivative instruments for hedging 15 12<br />
Government subsidy, district heating facility 30 32<br />
Other 7 12<br />
Total 52 56<br />
Liabilities that become due for payment after more than five years from the reporting date<br />
Government subsidy, district heating facility 22 24<br />
Parent Company<br />
MSEK 31 Dec. <strong>2010</strong> 31 Dec. 2009<br />
Other long-term liabilities<br />
Derivative instruments for hedging 15 12<br />
Government subsidy, district heating facility - 32<br />
Total 15 44<br />
Liabilities that become due for payment after more than five years from the reporting date<br />
Government subsidy, district heating facility - 24<br />
H Ö G A N Ä S 2 0 1 0 77<br />
1<br />
2<br />
3<br />
4<br />
5<br />
6<br />
7<br />
8<br />
9<br />
10<br />
11<br />
12<br />
13<br />
14<br />
15<br />
16<br />
17<br />
18<br />
19<br />
20<br />
21<br />
22<br />
23<br />
24<br />
25<br />
26<br />
27<br />
28<br />
29<br />
30<br />
31<br />
32<br />
33<br />
34
F I N A N C I A L I N F O R M AT I O N<br />
NOTE 25 EMPLOYEE BENEFITS<br />
Defined benefit plans<br />
Group<br />
MSEK 31 Dec. <strong>2010</strong> 31 Dec. 2009<br />
Present value of wholly or partly unit-linked commitments 374 372<br />
Fair value of plan assets -321 -303<br />
Net wholly or partly unit-linked commitments 53 69<br />
Present value of traditional assurance commitments 1 2<br />
Present value of net commitments 54 71<br />
Unreported actuarial gains (+) and losses (-) -95 -93<br />
Net reported for defined benefit plans (see below) -41 -22<br />
The net amount is reported in the following items in the Statement of Financial Position:<br />
Long-term receivables -50 -34<br />
Provisions for pensions 9 12<br />
Net amount in Statement of Financial Position -41 -22<br />
Summary of defined benefit plans<br />
<strong>Höganäs</strong> has defined benefit plans in Sweden, Belgium, the US, Germany, Taiwan, India and Italy. These are based on the benefits and length of service<br />
employees have at or near retirement. Plan assets are in Sweden, Belgium, the US, Germany, Taiwan and India.<br />
Change in reported net commitments for defined benefit plans<br />
Group<br />
MSEK 31 Dec. <strong>2010</strong> 31 Dec. 2009<br />
Net commitment for defined benefit plans at beginning of year -22 -16<br />
Benefits paid -17 -14<br />
Deposited contributions -10 -9<br />
Expense reported in Income Statement 9 18<br />
Exchange rate differences -1 -1<br />
Net commitment for defined benefit plans at year-end -41 -22<br />
Expense reported in the Income Statement<br />
Group<br />
MSEK <strong>2010</strong> 2009<br />
Expenses for service in current period 6 6<br />
<strong>Report</strong>ed actuarial losses 3 4<br />
Interest expense on the commitment 16 16<br />
Expenses for service in previous periods 1 7<br />
Expected yield on plan assets -17 -15<br />
Total net expenses in Income Statement 9 18<br />
The expense is reported in the following Income Statement lines:<br />
Group<br />
MSEK <strong>2010</strong> 2009<br />
Cost of goods sold 2 6<br />
Selling expenses 2 4<br />
Administrative expenses 3 5<br />
Research and development costs 2 3<br />
Total net expense in Income Statement 9 18<br />
Actual yield on plan assets 22 35<br />
78 H Ö G A N Ä S 2 0 1 0
CONT. NOTE 25 EMPLOYEE BENEFITS<br />
Assumptions for defined benefit commitments<br />
The most significant actuarial assumptions as of the reporting date (expressed as weighted averages)<br />
Group<br />
F I N A N C I A L I N F O R M AT I O N<br />
<strong>2010</strong> 2009<br />
Discount rate as of 31 Dec., % 4.3 4.4<br />
Expected yield on plan assets as of 31 Dec. , % 5.7 5.8<br />
Future salary increase , % 3.1 3.0<br />
Future increase of pensions, % 2.0 2.0<br />
Change in commitment for defined benefit plan<br />
Group<br />
MSEK 31 Dec. <strong>2010</strong> 31 Dec. 2009<br />
Commitments for defined benefit plans at beginning of year 374 366<br />
Expense for service in current year 6 6<br />
Interest expense 16 16<br />
Expense for service in previous periods - 1 7<br />
Actuarial gain (-) or loss (+) 10 9<br />
Effect of reductions and settlements - -2<br />
Disbursed pensions -24 -21<br />
Exchange rate differences -8 -7<br />
Commitments for defined benefit plans at end of year 375 374<br />
Change of fair value of plan assets<br />
Group<br />
MSEK 31 Dec. <strong>2010</strong> 31 Dec. 2009<br />
Fair value of plan assets at beginning of year 303 270<br />
Expected yield on plan assets 17 15<br />
Deposited contributions 10 7<br />
Actuarial gain (-) or loss (+) 5 23<br />
Disbursed pensions -7 -7<br />
Exchange rate differences -7 -5<br />
Fair value of plan assets at end of year 321 303<br />
Historical information<br />
Group<br />
MSEK <strong>2010</strong> 2009 2008 2007 2006<br />
Present value of defined benefit commitments -375 -374 -366 -333 -315<br />
Fair value of plan assets 321 303 270 309 319<br />
Surplus/deficit in plan -54 -71 -96 -24 4<br />
H Ö G A N Ä S 2 0 1 0 79<br />
1<br />
2<br />
3<br />
4<br />
5<br />
6<br />
7<br />
8<br />
9<br />
10<br />
11<br />
12<br />
13<br />
14<br />
15<br />
16<br />
17<br />
18<br />
19<br />
20<br />
21<br />
22<br />
23<br />
24<br />
25<br />
26<br />
27<br />
28<br />
29<br />
30<br />
31<br />
32<br />
33<br />
34
F I N A N C I A L I N F O R M AT I O N<br />
CONT. NOTE 25 EMPLOYEE BENEFITS<br />
Parent Company’s pension commitments<br />
Defined benefit plans<br />
The commitments for retirement pensions for the majority of salaried employees<br />
in Sweden are assured through provisions to a PRI liability. These<br />
funds are assured through transfer to pension funds. Other salaried employees<br />
have chosen alternative defined contribution pension solutions.<br />
Net liability in Balance Sheet<br />
Parent Company<br />
MSEK 31 Dec. <strong>2010</strong> 31 Dec. 2009<br />
Present value of commitment,<br />
unit-linked pension plans 179 219<br />
Fair value of plan assets (pension fund) -196 -224<br />
Surplus in pension fund (-)/net<br />
commitment (+) -17 -5<br />
Present value of commitment, traditional<br />
assurance pension plans 3 5<br />
Un-reported surplus in pension fund 17 5<br />
<strong>Report</strong>ed net liability 3 5<br />
REMUNERATION AND OTHER BENEFITS TO<br />
SENIOR MANAGERS, <strong>2010</strong><br />
Principles for remunerating senior managers<br />
The Board of Directors has an internal Remuneration Committee comprising<br />
Chairman of the Board Anders G Carlberg, Jenny Lindén Urnes and<br />
Bengt Kjell. In addition, if the Committee considers it appropriate, the<br />
committee may co-opt another representative from management or other<br />
suitable person to participate in its meetings. However, such person<br />
may not participate in consideration of their own remuneration. Committee<br />
work is formalised by special instructions adopted by the Board of<br />
Directors as part of its rules of procedure. The Committee considers and<br />
consults on remuneration issues relating to management, share-based<br />
incentive schemes and general profit-related bonus schemes. On assignment<br />
from the Board, the Committee is also responsible for producing<br />
proposals for remuneration and other employment terms for the CEO and<br />
other senior managers, for approval by the AGM. The principles of remuneration<br />
and other employment terms are unchanged on the previous<br />
year. No right to make decisions on any single issue has been delegated<br />
to the Remuneration Committee.<br />
Performance-related pay<br />
The Chief Executive Officer’s bonus is determined as follows: 50% on<br />
consolidated profit after financial items, 25% on the companies’ market<br />
shares in tons and 25% on the companies’ operating income for high<br />
alloy metal powder. The maximum bonus is 50% of basic salary. Other<br />
members of the Group management receive bonuses related to achieving<br />
targets and income after tax at up to six months’ salary.<br />
80 H Ö G A N Ä S 2 0 1 0<br />
Defined contribution plans<br />
In Sweden, the Group has defined contribution pension plans for employees,<br />
for which the companies meet all costs. There are also defined<br />
contribution plans for those salaried employees that have chosen alternative<br />
defined contribution pension solutions. There are defined contribution<br />
plans in foreign countries, which are partly funded by subsidiaries, and<br />
partly covered through contributions paid by employees. Payments to<br />
these plans are on an ongoing basis, according to the rules of each plan.<br />
Group<br />
MSEK <strong>2010</strong> 2009<br />
Expense for defined contribution plans 43 37<br />
Parent Company<br />
MSEK <strong>2010</strong> 2009<br />
Expense for defined contribution plans 17 18<br />
Benefits<br />
The Chief Executive Officer and other senior managers’ benefits relate<br />
mainly to company cars.<br />
Pensions<br />
<strong>Höganäs</strong>’ pension agreements with senior managers for pensions from<br />
age 65 onwards are defined contribution. This means that <strong>Höganäs</strong> does<br />
not guarantee senior managers any pre-determined pension level, but<br />
future pensions are exclusively dependent on the returns generated by<br />
asset managers.<br />
For the Chief Executive Officer’s pension after age 60, each month,<br />
35% of fixed monthly salary is allocated to an occupational pension policy.<br />
Other members of the Group management are covered by pension plans<br />
where the Company pays up to 30% of basic monthly salary as premiums<br />
or according to a regular ITP (supplementary pensions for salaried employees)<br />
plan.
CONT. NOTE 25 EMPLOYEE BENEFITS<br />
<strong>2010</strong><br />
MSEK<br />
Basic salary,<br />
Directors’<br />
fees<br />
Shareholdings<br />
Senior executives’ shareholdings are stated on pages 26–27 and 31.<br />
Severance pay<br />
Coincident with termination initiated by the Company, the Chief Executive<br />
Officer is entitled to 12 months’ dismissal pay and severance pay of<br />
one year’s salary, including pension benefits. Coincident with termination<br />
initiated by the Company, another 19 executives are entitled to up to<br />
12 months’ dismissal pay and severance pay of up to one year’s salary,<br />
including pension benefits. No severance pay is due coincident with<br />
termination initiated by the employee.<br />
Performancerelated<br />
pay<br />
Incentive schemes<br />
The <strong>Annual</strong> General Meetings (AGM) 2007 - 2009 resolved on the introduction<br />
of a performance-related staff stock option plan with the aim of<br />
offering key staff of the Group the opportunity of future stakeholding in<br />
the Company, thus increasing their interest in, and commitment to, the<br />
Company’s operations. This plan covered the years 2007 - 2009, with the<br />
Chief Executive Officer and other members of the Group management<br />
eligible, as well as another 35 or so key staff of the Group, totalling some<br />
50 people. These individuals were granted options depending on how the<br />
Group performed in relation to target figures set by the Board of Directors.<br />
Other<br />
benefits<br />
Pension<br />
expense<br />
F I N A N C I A L I N F O R M AT I O N<br />
Share-based<br />
payment Total<br />
Pension<br />
commitments<br />
Chairman of the Board, Anders G Carlberg 0.5 - - - - 0.5 -<br />
Board member, Urban Jansson 0.3 - - - - 0.3 -<br />
Board member, Bengt Kjell 0.3 - - - - 0.3 -<br />
Board member, Peter Gossas 0.2 - - - - 0.2 -<br />
Board member, Jenny Lindén Urnes 0.2 - - - - 0.2 -<br />
Board member, Bernt Magnusson 0.3 - - - - 0.3 -<br />
Board member, Erik Urnes 0.3 - - - - 0.3 -<br />
Chief Executive Officer, Alrik Danielson 5.3 2.6 0.2 1.8 2.3 12.2 9.7<br />
Senior Vice President, Ulf Holmqvist 1.7 0.5 0.1 0.5 0.8 3.6 0.4<br />
Other senior managers (9 people) 17.0 6.1 2.5 3.5 7.1 36.2 1.0<br />
Total 26.1 9.2 2.8 5.8 10.2 54.1 11.1<br />
2009<br />
MSEK<br />
Basic salary,<br />
Directors’<br />
fees<br />
Performancerelated<br />
pay<br />
Other<br />
benefits<br />
Pension<br />
expense<br />
Share-based<br />
payment Total<br />
Pension<br />
commitments<br />
Chairman of the Board, Anders G Carlberg 0.3 - - - - 0.3 -<br />
Former Chairman of the Board, Per Molin 0.3 - - - - 0.3 -<br />
Board member, Peter Gossas 0.2 - - - - 0.2 -<br />
Board member, Urban Jansson 0.3 - - - - 0.3 -<br />
Board member, Bengt Kjell 0.3 - - - - 0.3 -<br />
Former Board member, Oystein Krogen 0.1 - - - - 0.1 -<br />
Board member, Jenny Lindén Urnes 0.2 - - - - 0.2 -<br />
Board member, Bernt Magnusson 0.3 - - - - 0.3 -<br />
Board member, Erik Urnes 0.1 - - - - 0.1 -<br />
Chief Executive Officer, Alrik Danielson 4.8 1.5 0.2 1.7 0.3 8.5 5.7<br />
Senior Vice President, Ulf Holmqvist 1.7 0.4 0.1 0.4 0.1 2.7 0.3<br />
Other senior managers (9 people) 18.9 3.1 1.9 4.1 1.0 29.0 1.0<br />
Total 27.5 5.0 2.2 6.2 1.4 42.3 7.0<br />
The Board of Directors, Chief Executive Officer and Senior Vice President received remuneration from the Parent Company only for the current and<br />
previous year.<br />
Granting is conditional on remaining in employment at the end of the<br />
term. The minimum term of the staff stock options is two years, and the<br />
maximum is four years, from the grant date, whereby half of the options<br />
are exercisable two years after granting and the remainder three years<br />
after granting. Against this background, the average remaining time to exercise<br />
for outstanding options at the reporting date is nine months for the<br />
option plan 2007 and 30 months to the option plan 2009. The estimated<br />
value of the group’s staff stock option plans was MSEK 46 at the end of<br />
the financial year.<br />
A total of 111,580 options were granted to participants in the 2007<br />
plan, which after re-statement as a result of the share redemption procedure<br />
conducted in 2008, entitled the holders to receive a total of 123,854<br />
class B shares. After restatement as a result of the share redemption<br />
procedure conducted in 2008, the exercise price for options granted<br />
in the 2007 plan is SEK 221.50 per share. No granting was made to<br />
participants in the 2008 plan. In <strong>2010</strong>, 226,000 options were granted to<br />
participants in the 2009 plan, which entitle the holders to subscribe for an<br />
equal number of class B shares. The exercise price for the 2009 plan is<br />
SEK 114.20 per share.<br />
To be able to conduct the staff stock option plan, the Board of Directors<br />
has been authorised to decide on the acquisition and transfer of<br />
class B treasury shares.<br />
H Ö G A N Ä S 2 0 1 0 81<br />
1<br />
2<br />
3<br />
4<br />
5<br />
6<br />
7<br />
8<br />
9<br />
10<br />
11<br />
12<br />
13<br />
14<br />
15<br />
16<br />
17<br />
18<br />
19<br />
20<br />
21<br />
22<br />
23<br />
24<br />
25<br />
26<br />
27<br />
28<br />
29<br />
30<br />
31<br />
32<br />
33<br />
34
F I N A N C I A L I N F O R M AT I O N<br />
NOTE 26 PROVISIONS<br />
Group<br />
82 H Ö G A N Ä S 2 0 1 0<br />
Reinstatement<br />
expenses<br />
Adapting<br />
personnel<br />
Emission<br />
rights<br />
Other<br />
provisions Total<br />
MSEK <strong>2010</strong> 2009 <strong>2010</strong> 2009 <strong>2010</strong> 2009 <strong>2010</strong> 2009 <strong>2010</strong> 2009<br />
Carrying amount at beginning of period 16 16 - 19 34 - 9 1 59 36<br />
Provisions in the period 1 - - - 60 34 3 8 80 42<br />
Amount utilised in the period - - - -19 -64 - -9 - -89 -19<br />
Carrying amount at end of period 17 16 - - 30 34 3 9 50 59<br />
Of which total long-term portion<br />
of provisions 17 16 - - - - 3 9 20 25<br />
Of which total short-term portion<br />
of provisions - - - - 30 34 - - 30 34<br />
Parent Company<br />
Carrying amount at beginning of period 16 16 - 18 34 - - - 50 34<br />
Provisions in the period - - - - - 34 - - - 34<br />
Intragroup transfer -16 - -34 - - - -50 -<br />
Amount utilised in the period - - - -18 - - - - - -18<br />
Carrying amount at end of period - 16 - - - 34 - - - 50<br />
Of which total long-term portion<br />
of provisions - 16 - - - - - - - 16<br />
Of which total short-term portion<br />
of provisions - - - - - 34 - - - 34<br />
Reinstatement expenses<br />
The provision for reinstating a damming area for landfill was MSEK 16 at<br />
the beginning of the year. Estimated provisioning for the remaining commitments<br />
is MSEK 17. Because of the long-term nature of this liability, the<br />
biggest uncertainty is to estimate the provision for those expenses that<br />
will arise. On the basis of estimated future production volumes, the useful<br />
life is estimated at 23 years.<br />
NOTE 27 LI<strong>AB</strong>ILITIES TO CREDIT INSTITUTIONS<br />
Parent Company<br />
Emission rights<br />
Emission rights for CO 2 were received at the beginning of the year at a<br />
market value of MSEK 44. Utilised rights are reported at cost, as cost of<br />
goods sold and provisions. More information in accounting principles s (vii)<br />
on page 53.<br />
Other provisions<br />
Legal disputes largely relate to current legal proceedings regarding employment<br />
and tax in Brazil.<br />
MSEK 31 Dec. <strong>2010</strong> 31 Dec. 2009<br />
Long-term liabilities<br />
Bank loans 800 1,100<br />
Current liabilities<br />
Overdraft facility 8 79<br />
Liabilities that become due for payment more than five years after the reporting date<br />
Bank loans - -<br />
Approved overdraft facilities amount to MSEK 400 (250).
NOTE 28 ACCRUED EXPENSES AND DEFERRED INCOME<br />
Group Parent Company<br />
F I N A N C I A L I N F O R M AT I O N<br />
MSEK 31 Dec. <strong>2010</strong> 31 Dec. 2009 31 Dec. <strong>2010</strong> 31 Dec. 2009<br />
Vacation pay liability 83 75 20 57<br />
Social security expenses 47 34 19 31<br />
Bonuses to customers 28 25 - 24<br />
Staff stock option plans 22 3 11 -<br />
Invoices not received 15 18 2 8<br />
Staff bonuses 47 11 13 7<br />
Interest 5 - 5 -<br />
Government subsidies 7 2 - 2<br />
Other items 68 51 3 21<br />
Total 322 219 73 150<br />
NOTE 29 PLEDGED ASSETS, CONTINGENT LI<strong>AB</strong>ILITIES AND CONTINGENT ASSETS<br />
Group Parent Company<br />
MSEK 31 Dec. <strong>2010</strong> 31 Dec. 2009 31 Dec. <strong>2010</strong> 31 Dec. 2009<br />
Pledged assets<br />
In the form of pledged assets for<br />
own liabilities and provisions<br />
Property mortgages 20 22 10 10<br />
Assets with ownership reservations 22 25 - -<br />
Total pledged assets 42 47 10 10<br />
Contingent liabilities<br />
Pension commitments 17 17 17 17<br />
Guarantees in favour of subsidiaries - - 254 258<br />
Guarantees, other 67 64 10 62<br />
Total contingent liabilities 84 81 281 337<br />
NOTE 30 RATES OF EXCHANGE<br />
Country Local currency 31 Dec. <strong>2010</strong> 31 Dec. 2009 Jan.-Dec. <strong>2010</strong> Jan.-Dec. 2009<br />
Brazil BRL 4.0560 4.1375 4.0925 3.8444<br />
China CNY 1.0300 1.0600 1.0643 1.1192<br />
Denmark DKK* 120.7500 139.1500 128.1273 142.6426<br />
EMU EUR 9.0020 10.3530 9.5413 10.6213<br />
India INR* 15.1500 15.4400 15.7528 15.7794<br />
Japan JPY* 8.3450 7.8450 8.2210 8.1784<br />
Korea KRW* 0.6005 0.6200 0.6232 0.5994<br />
Norway NOK* 115.2000 124.3000 119.1577 121.6225<br />
Russia RUB* 22.3100 23.8600 23.7263 24.0632<br />
Taiwan TWD 0.2342 0.2247 0.2293 0.2323<br />
UK GBP 10.5475 11.4850 11.1256 11.9260<br />
US USD 6.8025 7.2125 7.2049 7.6457<br />
*Rates of exchange in 100 units<br />
Year-end rates of exchange Average rates of exchange<br />
H Ö G A N Ä S 2 0 1 0 83<br />
1<br />
2<br />
3<br />
4<br />
5<br />
6<br />
7<br />
8<br />
9<br />
10<br />
11<br />
12<br />
13<br />
14<br />
15<br />
16<br />
17<br />
18<br />
19<br />
20<br />
21<br />
22<br />
23<br />
24<br />
25<br />
26<br />
27<br />
28<br />
29<br />
30<br />
31<br />
32<br />
33<br />
34
F I N A N C I A L I N F O R M AT I O N<br />
NOTE 31 FINANCIAL RISKS AND FINANCE POLICY<br />
A review of the Group’s financing activities and financial risks, with a<br />
sensitivity analysis, is on pages 19–21. Operations are conducted on the<br />
basis of a Finance Policy adopted by the Board of Directors, which states<br />
rules and guidelines for managing various financial risks. The Finance<br />
Policy identifies the following three significant risks - financing risk, market<br />
risk and credit risk. Currency, interest, metal and energy derivatives are<br />
used as hedging instruments pursuant to the guidelines stated by the<br />
Board of Directors and Finance Committee.<br />
Market risk<br />
Market risk is the risk arising through commercial flows in foreign currency<br />
operations that arise in operations (transaction exposure), financing working<br />
capital (interest risk), investments in foreign countries (translation risk),<br />
as well as energy and raw materials risk.<br />
(a) Currency risk<br />
(i) Transaction exposure<br />
The main exposure relates to the Group’s sales and purchasing in different<br />
currencies. These currency risks partly comprise the risk of fluctuations<br />
in the value of financial instruments, accounts receivable—trade and accounts<br />
payable—trade, and partly the currency risk in relation to expected<br />
Outstanding hedges of currency flows<br />
31 December <strong>2010</strong><br />
84 H Ö G A N Ä S 2 0 1 0<br />
Volume 1<br />
EUR/SEK USD/SEK JPY/SEK GBP/SEK<br />
Rate of<br />
exchange 2 Volume 1<br />
Rate of<br />
exchange 2 Volume 1<br />
Rate of<br />
exchange 2 Volume 1<br />
Rate of<br />
exchange 2<br />
Q1, 2011 19.2 9.78 20.4 7.08 525 0.079 0.18 10.96<br />
Q2, 2011 19.2 9.58 20.4 7.39 525 0.082 0.18 10.99<br />
Q3, 2011 19.2 9.41 20.4 6.89 525 0.084 0.18 11.01<br />
Q4, 2011 18.05 9.34 20.4 7.14 525 0.084 0.18 10.95<br />
Total 75.65 9.53 81.6 7.14 2,100 0.082 0.72 10.97<br />
(53.1) (10.5) (51) (7.26) (1,800) (0.084) (0) (0)<br />
Rate of exchange ruling on reporting date,<br />
31 December <strong>2010</strong> 9.002 6.8025 0.08345 10.5475<br />
Value change (MSEK) 3 reported in hedging<br />
provision, 31 December <strong>2010</strong> 35 23 -2.3 0,3<br />
1 Volumes are expressed in millions of local currency.<br />
2 Average forward rate.<br />
3 Change in fair value reported in the hedging provision in shareholders’ equity on cash flow hedges, where hedge accounting is applied. This item relates to value changes on derivative<br />
instruments relating to future cash flows.<br />
In addition to the above hedging, <strong>Höganäs</strong> has currency hedging for the<br />
net of outstanding accounts receivable—trade and accounts payable—<br />
trade denominated in the following currencies: EUR/SEK, JPY/SEK,<br />
USD/SEK, USD/EUR, GBP/EUR, JPY/EUR, USD/GBP and EUR/GBP.<br />
The Finance Policy states that this exposure should be 100% hedged.<br />
Contract terms are one month. Both the underlying receivable or liability<br />
and the hedging instruments are reported at rates of exchange at the<br />
reporting date, and exchange rate fluctuations are reported in the Income<br />
Statement.<br />
and contracted payment flows.<br />
99% (99) of <strong>Höganäs</strong>’ sales were to countries outside Sweden in <strong>2010</strong>.<br />
Total net revenues in foreign currencies in <strong>2010</strong> were some MSEK 6,667<br />
(4,567). The largest flow currencies were EUR, JPY and USD.<br />
The objective of <strong>Höganäs</strong>’ currency hedging is to hedge a determined<br />
portion of the Group’s net foreign currency exposure in the short and<br />
medium term. The purpose of hedging currency exposure is to even<br />
out profit fluctuations. The Consolidated Income Statement includes<br />
exchange rate differences of MSEK -45 (-13) in operating income and<br />
MSEK 7 (-3) in net financial income/expense.<br />
At year-end <strong>2010</strong>, the Group had the following currency hedges for<br />
expected payment flows in EUR, JPY, USD and GBP for 2011. The main<br />
derivatives used are forward contracts. Contract volumes are stated in<br />
nominal terms below. Contracts are reported at fair value in the Balance<br />
Sheet, and the accumulated value change is recognised in shareholders’<br />
equity via other comprehensive income.<br />
When the contract is realised, the accumulated value change is<br />
reported to the Income Statement. The effect of currency derivatives on<br />
operating income in <strong>2010</strong> was MSEK 74 (-94).<br />
The value of outstanding contracts not recognised as income is stated<br />
in the following table.
CONT. NOTE 31 FINANCIAL RISKS AND FINANCE POLICY<br />
(ii) Translation exposure<br />
Currency risks also exist in the translation of the foreign subsidiary’s assets,<br />
liabilities and earnings to the Parent Company’s functional currency,<br />
termed translation exposure. In recent years, <strong>Höganäs</strong> has significantly<br />
increased its conversion exposure through acquisitions and investments<br />
in fixed assets. The Group’s presentation currency is Swedish kronor.<br />
Considering <strong>Höganäs</strong> has a significant portion of its capital employed<br />
in foreign currencies, funding is primarily arranged in these currencies<br />
directly. Because hedge accounting for net investments in subsidiaries is<br />
applied on this funding, restatement is effected in the hedging reserve in<br />
shareholders’ equity via other comprehensive income.<br />
<strong>Höganäs</strong>’ policy is that net investment in the form of lending and<br />
shareholders’ equity in foreign convertible currencies should be hedged<br />
through external borrowings in the same currency. All borrowing should<br />
be arranged in the occurrences in which the group has its net investments.<br />
If net investment exceed external borrowings, there is no requirement<br />
for the excess portion to be hedged with currency forwards. The<br />
translation provision for net investments in subsidiaries was MSEK 44 (43)<br />
at year-end. The translation difference is reported in Note 21 Shareholders’<br />
Equity.<br />
Hedged portion of net assets by currency<br />
MSEK 31 Dec. <strong>2010</strong> % 31 Dec. 2009 %<br />
USD 1,257 30 1,258 103<br />
EUR 459 49 352 94<br />
JPY 261 87 280 101<br />
GBP 53 80 57 110<br />
Total 2,030 1,947<br />
(b) Interest risk<br />
Interest risk is a risk that the Group’s net interest income/expense deteriorates<br />
when market interest rates change. <strong>Höganäs</strong> is a net borrower, and<br />
accordingly, the Group is exposed to a risk for deteriorated net interest<br />
income/expense when market interest rates rise.<br />
At year-end, interest-bearing liabilities were MSEK 889 (1,267) and<br />
the average fixed interest period on these liabilities was some 1.47 (0.91)<br />
years including interest swaps and some 0.2 (0.1) years excluding interest<br />
swaps. Short-term investments and cash and cash equivalents were<br />
MSEK 106 (130) and the average fixed interest period on these assets<br />
was 0 (0) months.<br />
<strong>Höganäs</strong>’ funding facilities are usually arranged with maturities of three<br />
months. Interest fixings are then controlled with the aid of interest swaps.<br />
Interest fixings including interest swaps and maturity dates<br />
31 Dec. <strong>2010</strong> Total 1 2011 2012 2013 2014 2015<br />
EUR 25 - 25 - - -<br />
GBP 4 4 - - - -<br />
USD 55 20 - 25 10 -<br />
JPY 1,895 895 1,000 - - -<br />
31 Dec. 2009 Total 1 <strong>2010</strong> 2011 2012 2013 2014<br />
EUR 35 10 - 25 - -<br />
GBP 4 4 - - - -<br />
USD 75 20 20 - 25 10<br />
JPY 1,895 895 - 1,000 - -<br />
1 Amounts expressed in millions of local currency.<br />
F I N A N C I A L I N F O R M AT I O N<br />
The company had interest swaps with a nominal value of MSEK 683<br />
(842) on the reporting date, which have been reported against shareholders’<br />
equity. On the reporting date, the fair value of the swaps was MSEK<br />
-10 (-12). Effective interest excluding interest swaps at year-end was<br />
1.15% (0.58).<br />
(c) Energy and raw material risk<br />
A significant portion of <strong>Höganäs</strong>’ operations consist of buying and selling<br />
metals. The Group buys metals and sells metal powder products,<br />
where sales prices are adjusted for the price of the metals included in the<br />
product. Refining metals into metal powder is energy intensive. <strong>Höganäs</strong>’<br />
raw materials risk mainly arises in copper, nickel, electricity and oil. Value<br />
changes from raw materials derivatives are reported in the hedging provision<br />
in shareholders’ equity via other comprehensive income. An overview<br />
of how <strong>Höganäs</strong> manages energy and raw materials risk is provided in the<br />
risk management section on pages 19–21.<br />
(i) Electricity and gas/oil<br />
<strong>Höganäs</strong>’ production consumes a substantial amount of energy. The<br />
Group’s procurement of electricity, oil and natural gas corresponded to<br />
MSEK 420 (302) in <strong>2010</strong>.<br />
Outstanding hedges on electricity<br />
31 December <strong>2010</strong> Volume 1 Price 2<br />
Maturing 2011 196 417<br />
Maturing 2012 105 426<br />
Total 301<br />
Spot price, 31 December <strong>2010</strong> 771<br />
Value change (MSEK)3 reported in hedging provision,<br />
31 December <strong>2010</strong> 47<br />
1 Volume is expressed in GWh (electricity)<br />
2 Average forward price in SEK (electricity)<br />
3 Change in fair value reported in the hedging provision in shareholders’ equity on cash<br />
flow hedges, where hedge accounting is applied. This item relates to value changes on<br />
derivative instruments relating to future energy purchases.<br />
H Ö G A N Ä S 2 0 1 0 85<br />
1<br />
2<br />
3<br />
4<br />
5<br />
6<br />
7<br />
8<br />
9<br />
10<br />
11<br />
12<br />
13<br />
14<br />
15<br />
16<br />
17<br />
18<br />
19<br />
20<br />
21<br />
22<br />
23<br />
24<br />
25<br />
26<br />
27<br />
28<br />
29<br />
30<br />
31<br />
32<br />
33<br />
34
F I N A N C I A L I N F O R M AT I O N<br />
CONT. NOTE 31 FINANCIAL RISKS AND FINANCE POLICY<br />
(ii) Copper, nickel and molybdenum<br />
Metal derivatives are used to alleviate exposure to changes in raw materials<br />
prices. At present, the price risk of nickel, copper and molybdenum<br />
is hedged. Hedging is effected with standard financial derivatives quoted<br />
Outstanding hedges on copper, nickel and molybdenum<br />
86 H Ö G A N Ä S 2 0 1 0<br />
Copper Nickel Molybdenum<br />
31 December <strong>2010</strong> Volume 1 Price 2 Volume 1 Price 2 Volume 1 Price 2<br />
January 2011 50 9,180 726 24,097 10 33,830<br />
February 2011 - - - - 9 34,110<br />
March 2011 - - - - 11 33,921<br />
April 2011 - - - - 10 34,943<br />
May 2011 - - - - 6 35,825<br />
Total 50 9,180 726 24,097 46 34,409<br />
Spot price, 31 December <strong>2010</strong> 9,739 24,960 35,560<br />
Value change (MSEK) 3 reported in hedging provision,<br />
31 December <strong>2010</strong> -0.1 -3 -1.1<br />
1 Volume is expressed in tons<br />
2 Average forward price in USD<br />
3 Change in fair value reported in the hedging provision in shareholders’ equity on cash flow hedges, where hedge accounting is applied.<br />
This item relates to value changes on derivative instruments relating to changes in raw materials prices.<br />
Financing risk<br />
Financing risk is the risk that the Group encounters problems accessing<br />
borrowed capital. The objective is that at any time, the Group will have<br />
access to confirmed long-term credit facilities that cover the needs of<br />
operations with a satisfactory margin.<br />
Current confirmed credit facilities were arranged by a syndicate of four<br />
banks in <strong>2010</strong>, and this facility matures in January 2013. At year-end,<br />
these facilities amounted to MEUR 175, of which MEUR 32 (106) had<br />
been utilised. All credits are conditional on <strong>Höganäs</strong>’ debt/equity ratio not<br />
exceeding 1.5. At year-end, this ratio was 0.24 (0.43). <strong>Höganäs</strong>’ interest<br />
coverage ratio adjusted for depreciation and amortisation may not be less<br />
than 4.0. At year-end, it was 34.6 (18.5).<br />
Additionally, unconfirmed credits were MSEK 1,957 (585), of which<br />
MSEK 569 (127) had been utilised at year-end.<br />
Firstly, surplus liquidity should be used to amortise interest-bearing<br />
liabilities. Secondly, the Treasury function should invest the group’s surplus<br />
liquidity.<br />
At year-end, consolidated financial liabilities were MSEK 1,471 (1,744)<br />
and the maturity structure of borrowings is as stated in the following table:<br />
Financial liabilities 31 Dec. <strong>2010</strong> 31 Dec. 2009<br />
Maturity < 1 yr. 1-5 yr. > 5 yr. < 1 yr. 1-5 yr. > 5 yr.<br />
Credit facilities - 797 - - 1,111 -<br />
Other credits 75 17 - 137 19 -<br />
Accounts payable<br />
—trade 553 - - 441 - -<br />
Derivatives 14 15 - 24 12 -<br />
Total 642 829 - 602 1,142 -<br />
The parent company serves as financier to subsidiaries. Subsidiaries<br />
have local overdraft facilities, which have been approved by the parent<br />
company.<br />
Credit risk<br />
Credit risk can be divided into commercial and financial counterparty risk.<br />
Commercial counterparty risk is the risk of one of the Group’s customers<br />
becoming insolvent and that prepared sales forecasts or hedged flows<br />
cannot be delivered.<br />
To some extent, <strong>Höganäs</strong>’ credit risk for customers is limited through<br />
sales being conducted in a high number of countries, to a wide range of<br />
customers, thus achieving risk diversification. There is a credit insurance<br />
of MUSD 5 (10) intended to reduce the credit risk of customers in the<br />
US. Moreover, <strong>Höganäs</strong> uses export letters of credit for sales on certain<br />
daily on the London Metal Exchange (LME). For metals not quoted on<br />
the LME, price hedging can be effected through fixed-fee contracts with<br />
suppliers.<br />
markets. At year-end, the single largest credit exposure was MSEK 16<br />
(23). The Group’s Credit Policy stipulates that credit checks precede all<br />
sales to new customers, to further limit credit risk. Bad debt for <strong>2010</strong> was<br />
MSEK 8 (11) of consolidated net sales.<br />
The financial counterparty risk is the risk of a counterparty the finance<br />
division has entered a contract with becoming insolvent and that an<br />
investment and/or unrealised gain cannot be re-paid.<br />
For derivative instruments, <strong>Höganäs</strong> primarily uses banks where the<br />
Group has a confirmed credit facility.<br />
<strong>Höganäs</strong>’ credit risk exposure at year-end is stated in the following<br />
table. Also see Note 18 Accounts receivable—trade/credit risk.<br />
Credit risk exposure 31 Dec. <strong>2010</strong> 31 Dec. 2009<br />
Accounts receivable—trade 889 707<br />
Cash and bank balances 106 130<br />
Derivatives 124 42<br />
Total 1,119 879<br />
Fair value and carrying amount of financial assets and financial<br />
liabilities are reported in the Consolidated Balance Sheet<br />
The carrying amounts of interest-bearing assets and liabilities in the<br />
Balance Sheet may differ from fair value, for reasons including changes<br />
in market interest rates. To measure the fair value of financial assets and<br />
liabilities, official quoted rates have been used for the assets and liabilities<br />
traded on an active marketplace.<br />
In those cases where no reliable market quotes are available, a fair<br />
value has been measured by discounting future payment flows using<br />
current market interest rates, which are then translated to Swedish kronor<br />
using the current rate of exchange.<br />
Because interest-bearing financial assets have very short fixed interest<br />
periods, the fair value is judged to correspond to carrying amount. For<br />
financial instruments like accounts receivable—trade, accounts payable—<br />
trade and other non-interest-bearing financial assets and liabilities, which<br />
are reported at accrued cost less potential impairment, the fair value is<br />
judged to be the same as the carrying amount.<br />
The following table states fair values and carrying amounts of financial<br />
assets and financial liabilities reported in the Consolidated Statement of<br />
Financial Position.
CONT. NOTE 31 FINANCIAL RISKS AND FINANCE POLICY<br />
31 Dec. <strong>2010</strong><br />
Financial assets<br />
& financial<br />
liabilities<br />
measured at fair<br />
value via Income<br />
Statement 1<br />
Derivatives<br />
used in hedge<br />
accounting<br />
Loans receivable<br />
and accounts<br />
receivable<br />
Financial<br />
liabilities<br />
reported at<br />
accrued cost<br />
F I N A N C I A L I N F O R M AT I O N<br />
Total carrying<br />
amount Total fair value<br />
Long-term receivables - 6 - - 6 6<br />
Accounts receivable—<br />
trade - - 889 - 889 889<br />
Other receivables 2 116 - - 118 118<br />
Cash and cash equivalents<br />
- - 106 - 106 106<br />
Total 2 122 995 - 1,119 1,119<br />
Long-term interest-<br />
bearing liabilities - - - 814 814 814<br />
Other long-term liabilities - 15 - - 15 15<br />
Current interest-bearing<br />
liabilities - - - 75 75 75<br />
Accounts payable—trade - - - 553 553 553<br />
Other liabilities - 14 - - 14 14<br />
Total - 29 - 1,442 1,471 1,471<br />
31 Dec. 2009<br />
Long-term receivables - 1 - - 1 1<br />
Accounts receivable—<br />
trade - - 707 - 707 707<br />
Other receivables 3 38 - - 41 41<br />
Cash and cash equivalents<br />
- - 130 - 130 130<br />
Total 3 39 837 - 879 879<br />
Long-term interest-<br />
bearing liabilities - - - 1,130 1,130 1,131<br />
Other long-term liabilities - 12 - - 12 12<br />
Current interest-bearing<br />
liabilities - - - 137 137 137<br />
Accounts payable—trade - - - 441 441 441<br />
Other liabilities 2 22 - - 24 24<br />
Total 2 34 - 1,708 1,744 1,745<br />
1 Fair value option is not applied.<br />
The above table also reflects the Parent Company’s allocation apart from electricity derivatives that are held by other group companies. Electricity<br />
derivatives comprised an asset item of MSEK 46 as of 31 Dec. <strong>2010</strong> and are included in the ‘Derivatives used in hedge accounting’ category in ‘Other<br />
receivables’ in the above table.<br />
H Ö G A N Ä S 2 0 1 0 87<br />
1<br />
2<br />
3<br />
4<br />
5<br />
6<br />
7<br />
8<br />
9<br />
10<br />
11<br />
12<br />
13<br />
14<br />
15<br />
16<br />
17<br />
18<br />
19<br />
20<br />
21<br />
22<br />
23<br />
24<br />
25<br />
26<br />
27<br />
28<br />
29<br />
30<br />
31<br />
32<br />
33<br />
34
F I N A N C I A L I N F O R M AT I O N<br />
CONT. NOTE 31 FINANCIAL RISKS AND FINANCE POLICY<br />
Valuation hierarchy<br />
All financial instruments measured at fair value in the Statement of<br />
Financial Position should be assigned to one of three tiers in the fair value<br />
hierarchy that consists of the following tiers:<br />
Tier 1<br />
Financial instruments whose fair value is measured according to prices<br />
quoted on an active marketplace of the same instrument, such as<br />
exchange-traded standard derivatives for electricity and metals.<br />
88 H Ö G A N Ä S 2 0 1 0<br />
Tier 2<br />
Financial instruments whose fair value is measured on the basis of either<br />
directly (as price) or indirectly (has its origin in price) observable market<br />
data that are not included in tier 1. For example, certain OTC-traded<br />
products such as interest swaps and currency forwards.<br />
Tier 3<br />
Financial instruments whose fair value is measured from input data that is<br />
not observable on the market.<br />
Tier 1 Tier 2 Tier 3<br />
MSEK 31 Dec. <strong>2010</strong> 31 Dec. 2009 31 Dec. <strong>2010</strong> 31 Dec. 2009 31 Dec. <strong>2010</strong> 31 Dec. 2009<br />
Long-term receivables - - 6 1 - -<br />
Accounts receivable—trade - - - - - -<br />
Other receivables 47 3 71 38 - -<br />
Cash and cash equivalents - - - - - -<br />
Total 47 3 77 39 - -<br />
Long-term interest-bearing liabilities - - - - - -<br />
Other long-term liabilities - - 15 12 - -<br />
Current interest-bearing liabilities - - - - - -<br />
Accounts payable—trade - - - - - -<br />
Other liabilities 4 11 10 13 - -<br />
Total 4 11 25 25 - -<br />
Insurable risks<br />
<strong>Höganäs</strong> <strong>AB</strong> has a centralised non-life and professional indemnity cover.<br />
Although local insurance cover is necessary in some countries, in those<br />
cases where such cover does not satisfy the Group’s minimum standards,<br />
coverage is achieved through umbrella coverage using <strong>Höganäs</strong> <strong>AB</strong>’s<br />
Master Insurance Policy.<br />
Capital management<br />
The group’s objective is to have a favourable capital structure and financial<br />
stability. This is an important basis for continued development of business<br />
operations. Capital is defined as total shareholders’ equity including<br />
non-controlling interests.<br />
Capital 31 Dec. <strong>2010</strong> 31 Dec. 2009<br />
Share capital 175 175<br />
Translation reserve -124 53<br />
Hedging reserve 65 2<br />
Profit brought forward incl. net income 3,123 2,423<br />
Non-controlling interests - -<br />
Total 3,239 2,653<br />
The Board of Directors’ ambition is to maintain a balance between high<br />
returns that are enabled through higher borrowings and the benefits<br />
and security that a sound capital structure offers. The Group’s goal is to<br />
achieve a return on capital employed of 20%. Returns for the year were<br />
27.6% (7.2). Calculated as return on equity, the figure was 27.3% (8.1). As<br />
a comparison, the effective interest for the loan portfolio based on average<br />
borrowings for the year was 1.15% (0.6).<br />
The Board of Directors’ intention is to have an annual dividend level of<br />
some 30-50% of net income. The proposed dividend for the year of SEK<br />
10.00 (3.00), corresponds to 43% (50) of income. Dividend levels should<br />
be adapted to <strong>Höganäs</strong>’ income level and future prospects, cash flow,<br />
investment need and other relevant factors. In the past five-year period,<br />
average dividends correspond to 50% of net income.<br />
The Board of Directors’ objective is to increase employees’ shareholdings<br />
of the group. As a result, a performance-based staff stock option<br />
plan for the CEO and key staff of the Group was introduced in the previous<br />
year. The scope and terms are stated in Note 25.<br />
The group’s Board of Directors has a mandate from the AGM <strong>2010</strong><br />
to re-purchase up to 10% of <strong>Höganäs</strong>’ shares with the aim of covering<br />
commitments relating to the staff stock option plans of 2007 and 2009.<br />
The Group has re-purchased shares on several occasions, although no<br />
re-purchases were made in <strong>2010</strong>. To some extent, the timing of these<br />
transactions was determined by the share price. The re-purchased<br />
treasury shares are mainly intended for the Group’s option plans. There<br />
is no formal re-purchasing plan, but rather, purchase and sales decisions<br />
regarding the Group’s shares are taken by the Board of Directors. For<br />
the AGM 2011, the Board of Directors is proposing that the shareholders<br />
resolve on re-purchasing treasury shares.<br />
No change to the group’s capital management occurred in the year.<br />
All the parent company’s credits are associated with capital adequacy<br />
requirements, stated in Note 23. Otherwise, there are no express external<br />
capital adequacy requirements on the group.
NOTE 32 RELATED PARTIES<br />
F I N A N C I A L I N F O R M AT I O N<br />
The Parent Company exerts a controlling influence over its subsidiaries, see Note 14. Business terms and market pricing apply to the supply of services<br />
and products between Group companies. Intragroup transactions and dealings between subsidiaries are stated below. The Group’s transactions with<br />
senior managers comprise salaries and other remuneration, benefits, pensions and agreements on severance pay to the Board and CEO, are stated in<br />
Note 25. Jenny Lindén Urnes controls 37.8% of the votes of <strong>Höganäs</strong> <strong>AB</strong> through Lindéngruppen <strong>AB</strong>.<br />
Parent Company<br />
Related parties Year<br />
Sales of<br />
goods to<br />
related party<br />
Purchases of<br />
goods from<br />
related party<br />
Other<br />
(interest,<br />
dividend)<br />
Liabilities to<br />
related party as<br />
of 31 Dec.<br />
Receivable from<br />
related party as<br />
of 31 Dec.<br />
<strong>Höganäs</strong> Hamnbyggnads <strong>AB</strong> <strong>2010</strong> - - - - 9<br />
2009 - 2 - 1 13<br />
<strong>Höganäs</strong> Sweden <strong>AB</strong> <strong>2010</strong> - - 2 231 252<br />
2009 - - - 3 -<br />
<strong>Höganäs</strong> HOGAP <strong>AB</strong> <strong>2010</strong> - - - 1 -<br />
2009 - - - 2 -<br />
<strong>Höganäs</strong> Belgium S.A. <strong>2010</strong> - - -3 238 4<br />
2009 4 5 3 222 4<br />
<strong>Höganäs</strong> (GB) Ltd <strong>2010</strong> - - - 72 1<br />
2009 - - - 50 1<br />
<strong>Höganäs</strong> Japan K.K. <strong>2010</strong> - - 18 - 3<br />
2009 298 - 1 - 75<br />
<strong>Höganäs</strong> France S.A.S. <strong>2010</strong> - - - 2 -<br />
2009 - - - 1 -<br />
<strong>Höganäs</strong> GmbH <strong>2010</strong> - - 3 24 -<br />
2009 - - - - -<br />
<strong>Höganäs</strong> Italia S.r.l. <strong>2010</strong> - - 6 - -<br />
2009 - - - 1 -<br />
<strong>Höganäs</strong> India Pvt Ltd <strong>2010</strong> - - - - 3<br />
2009 28 14 - 1 3<br />
<strong>Höganäs</strong> East Europe LLC <strong>2010</strong> - - - - -<br />
2009 - - - - -<br />
<strong>Höganäs</strong> Ibérica S.A. <strong>2010</strong> - - - 6 -<br />
2009 - - 2 - -<br />
<strong>Höganäs</strong> Taiwan Ltd <strong>2010</strong> - - 6 - -<br />
2009 26 - 13 - 1<br />
<strong>Höganäs</strong> Korea Ltd <strong>2010</strong> - - 4 - -<br />
2009 7 - 6 - -<br />
<strong>Höganäs</strong> (China) Col, Ltd <strong>2010</strong> - - 10 - 7<br />
2009 108 - - - 33<br />
NAH Holdings, Inc. <strong>2010</strong> - - 2 - -<br />
2009 - - - - 788<br />
North American <strong>Höganäs</strong>, Inc. <strong>2010</strong> - - - 23 15<br />
2009 138 36 12 14 23<br />
NAH Financial Holding <strong>AB</strong> <strong>2010</strong> - - - 692 -<br />
2009 - - - 619 -<br />
<strong>Höganäs</strong> Brasil Ltda <strong>2010</strong> - - 1 - 29<br />
2009 70 - 6 - 196<br />
Total <strong>2010</strong> - - 49 1,289 323<br />
2009 679 57 43 914 1,137<br />
The Parent Company has guarantees in favour of subsidiaries of MSEK 254 (258). The Parent Company has received dividends from subsidiaries of<br />
MSEK 44 (20).<br />
H Ö G A N Ä S 2 0 1 0 89<br />
1<br />
2<br />
3<br />
4<br />
5<br />
6<br />
7<br />
8<br />
9<br />
10<br />
11<br />
12<br />
13<br />
14<br />
15<br />
16<br />
17<br />
18<br />
19<br />
20<br />
21<br />
22<br />
23<br />
24<br />
25<br />
26<br />
27<br />
28<br />
29<br />
30<br />
31<br />
32<br />
33<br />
34
F I N A N C I A L I N F O R M AT I O N<br />
NOTE 33 SIGNIFICANT ESTIMATES AND JUDGMENTS<br />
Group management and the Board of Directors make judgements and<br />
estimates regarding the future. These judgements and estimates affect<br />
the accounts and other financial information presented, including contingent<br />
liabilities. These judgements are based on historical experience and<br />
the various estimates considered reasonable in prevailing circumstances.<br />
Conclusions thereby drawn form the basis for decisions regarding carrying<br />
amounts of assets and liabilities in cases where they cannot be<br />
measured through other information. Actual outcomes may vary from<br />
these estimates and other judgements being made or other circumstances<br />
arising. Segments including such estimates and judgements that may<br />
have a material effect on the group’s results of operations and financial<br />
position are, for example:<br />
Impairment testing of goodwill and other assets<br />
At the end of the year, consolidated goodwill was MSEK 91 (96), the<br />
majority allocated to <strong>Höganäs</strong>’ operation in the USA. Impairment is<br />
tested annually in tandem with the annual financial statement, or as soon<br />
as altered circumstances indicate impairment, for example a changed<br />
business climate or a decision on the sale or closure of an operation.<br />
Impairment is conducted if the estimated recoverable value is an amount<br />
less than the carrying amount of the cash-generating unit. A statement on<br />
impairment tests in the year is provided in Note 11.<br />
Other tangible and intangible fixed assets are reported that cost less<br />
accumulated depreciation and amortisation and potential impairment.<br />
Depreciation and impairment is over estimated useful lives down to an<br />
estimated residual value. The residual value of the group’s fixed assets is<br />
tested as soon as altered circumstances indicate impairment. Value in use<br />
is measured as the expected future discounted cash flow primarily from<br />
the cash-generating unit to which the asset belongs, but in specific cases,<br />
also to individual assets.<br />
NOTE 34 INFORMATION ON THE PARENT COMPANY<br />
<strong>Höganäs</strong> <strong>AB</strong> (publ), Corporate Identity No. 556005-0121, is a Swedishregistered<br />
limited company with its registered office in the municipality<br />
of <strong>Höganäs</strong>, Sweden. <strong>Höganäs</strong>’ class B shares are quoted on the Mid<br />
Cap list on NASDAQ OMX Stockholm. The address of the head office is<br />
<strong>Höganäs</strong> <strong>AB</strong>, SE-263 83 <strong>Höganäs</strong>, Sweden.<br />
90 H Ö G A N Ä S 2 0 1 0<br />
Testing of the carrying amount of an asset is also relevant to decisions on<br />
closure. Assets are recognised at the lower of the carrying amount and<br />
fair value after deducting selling expenses.<br />
Measurement of current and deferred tax assets and liabilities<br />
Judgements are made to determine current and deferred tax assets or<br />
liabilities, especially for deferred tax assets. In this context, the likelihood<br />
that the deferred tax assets will be utilised for deduction against future<br />
taxable profits is estimated. The fair value of these future taxable profits<br />
may differ in terms of future business conditions and earnings ability or<br />
changed rules on taxation. Loss carry-forwards of MSEK 132 have been<br />
reported in the group, based on a judgement that they will probably be<br />
usable and result in lower tax payments in the future. The majority of the<br />
capitalised loss carry-forwards relate to <strong>Höganäs</strong>’ operations in the USA.<br />
Measurement of employee benefits<br />
The net commitment for defined-benefit plans was MSEK -41 (-22) at the<br />
end of the year. The value of pension commitments for defined benefit<br />
pension plans are based on actuarial computations from assumptions regarding<br />
discount rates, future salary increases, inflation and demographic<br />
conditions. The majority of the net commitment is attributable to defined<br />
benefit plans in Sweden. A statement of the most significant actuarial<br />
assumptions and historical information is in Note 25. The applicable<br />
accounting principles permit actuarial gains and losses in defined benefit<br />
pension plans to be recognised as income only to the extent they exceed<br />
or are less than 10% of the greater the present value of the fair value of<br />
the defined benefit pension commitment or the fair value of plan assets.<br />
The net of un-reported actuarial losses was MSEK 95 (93) at year-end.<br />
The consolidated accounts for <strong>2010</strong> comprise the Parent Company<br />
and its subsidiaries, collectively termed the Group.
Audit <strong>Report</strong><br />
To the <strong>Annual</strong> General Meeting of shareholders of <strong>Höganäs</strong> <strong>AB</strong> (publ)<br />
Corporate Identity No. 556005-0121<br />
We have audited the annual accounts and consolidated accounts, the accounting records<br />
and the administration of the Board of Directors and the Chief Executive Officer of<br />
<strong>Höganäs</strong> <strong>AB</strong> (Publ) for the year <strong>2010</strong>. The annual accounts and consolidated accounts<br />
of the Company are included in the printed version of this document on pages 35–90.<br />
These accounts and the administration of the Company, and the application of the<br />
Swedish <strong>Annual</strong> Accounts Act when preparing the annual accounts, and the application<br />
of IFRS (International Financial <strong>Report</strong>ing Standards) as endorsed by the EU and<br />
the Swedish <strong>Annual</strong> Accounts Act when preparing the consolidated accounts, are the<br />
responsibility of the Board of Directors and the Chief Executive Officer. Our responsibility<br />
is to express an opinion on the annual accounts and the consolidated accounts, as<br />
well as the administration based on our audit.<br />
We conducted our audit in accordance with generally accepted accounting principles<br />
in Sweden. Those standards require that we plan and perform the audit to obtain<br />
reasonable assurance that the annual accounts and consolidated accounts are free of<br />
material misstatement. An audit includes examining, on a test basis, evidence supporting<br />
the amounts and disclosures in the accounts. An audit also includes assessing the accounting<br />
principles used and their application by the Board of Directors and the Chief<br />
Executive Officer and significant estimates made by the Board of Directors and the<br />
Chief Executive Officer when preparing the annual accounts and consolidated accounts<br />
as well as evaluating the overall presentation of information in the annual accounts and<br />
consolidated accounts. As a basis for our opinion concerning discharge from liability, we<br />
examined significant decisions, actions taken and circumstances of the Company in order<br />
to be able to determine the liability, if any, to the Company of any Board member or<br />
the Chief Executive Officer. We also examined whether any Board member or the Chief<br />
Executive Officer has, in any other way, acted in contravention of the Swedish Companies<br />
Act, the Swedish <strong>Annual</strong> Accounts Act or the Articles of Association. We believe<br />
that our audit provides a reasonable basis for our opinion set out below.<br />
The annual accounts have been prepared in accordance with the Swedish <strong>Annual</strong> Accounts<br />
Act and give a true and fair view of the Company’s financial position and results<br />
of operations in accordance with generally accepted accounting principles in Sweden.<br />
The consolidated accounts have been prepared in accordance with IFRS as endorsed<br />
by the EU and the Swedish <strong>Annual</strong> Accounts Act and give a true and fair view of the<br />
Group’s financial position and results of operations. The statutory administration report<br />
is consistent with the other parts of the annual accounts and consolidated accounts.<br />
We recommend to the <strong>Annual</strong> General Meeting that the Income Statement and Balance<br />
Sheet for the Parent Company and the Income Statement and Statement of Financial<br />
Position for the Group be adopted, that the profit of the Parent Company be dealt<br />
with in accordance with the proposal in the statutory administration report and that the<br />
members of the Board of Directors and the Chief Executive Officer be discharged from<br />
liability for the financial year.<br />
<strong>Höganäs</strong>, Sweden, 16 March 2011<br />
KPMG <strong>AB</strong><br />
Alf Svensson<br />
Authorised Public Accountant<br />
F I N A N C I A L I N F O R M AT I O N<br />
H Ö G A N Ä S 2 0 1 0 91<br />
1<br />
2<br />
3<br />
4<br />
5<br />
6<br />
7<br />
8<br />
9<br />
10<br />
11<br />
12<br />
13<br />
14<br />
15<br />
16<br />
17<br />
18<br />
19<br />
20<br />
21<br />
22<br />
23<br />
24<br />
25<br />
26<br />
27<br />
28<br />
29<br />
30<br />
31<br />
32<br />
33<br />
34
F I N A N C I A L I N F O R M AT I O N<br />
Five-year overview and quarterly data<br />
FIVE-YEAR OVERVIEW<br />
MSEK 2006 2007 2008 2009 <strong>2010</strong><br />
Net sales 5,123 5,838 6,103 4,571 6,671<br />
Operating income 602 607 527 298 1,114<br />
Net financial income and expenses -77 -45 -44 -27 -30<br />
Income before tax 525 562 483 271 1,084<br />
Net income 402 431 394 206 804<br />
Operating margin, % 11.8 10.4 8.6 6.5 16.7<br />
Net margin, % 10.2 9.6 7.9 5.9 16.2<br />
Total assets 5,099 5,191 5,642 5,118 5,667<br />
Shareholders’ equity 2,625 2,766 2,406 2,653 3,239<br />
Capital employed 3,736 3,880 4,370 3,932 4,137<br />
Return on capital employed, % 15.5 15.9 12.8 7.2 27.6<br />
Return on equity, % 15.5 16.0 15.2 8.1 27.3<br />
Equity/assets ratio, % 51.5 53.3 42.6 51.8 57.2<br />
Net indebtedness 1,032 903 1,743 1,149 792<br />
Debt/equity ratio, multiple 0.39 0.33 0.72 0.43 0.24<br />
Risk capital/assets, % 59.9 61.0 48.0 57.6 63.9<br />
Interest coverage ratio, multiple 7.8 13.5 12.0 11.0 37.1<br />
Rate of capital turnover, multiple 1.32 1.53 1.48 1.10 1.65<br />
Operating cash flow 429 314 217 629 410<br />
Cash flow after investments 429 314 220 626 410<br />
Investments 219 176 375 265 302<br />
Average number of employees 1,579 1,563 1,589 1,440 1,619<br />
Net sales per employee 3.29 3.67 3.84 3.17 4.12<br />
QUARTERLY DATA Q1 Q2 Q3 Q4 Q1 Q2 Q3 Q4<br />
MSEK 2009 2009 2009 2009 <strong>2010</strong> <strong>2010</strong> <strong>2010</strong> <strong>2010</strong><br />
Net sales 916 1,098 1,193 1,364 1,548 1,783 1,728 1,612<br />
Operating income -111 54 142 213 282 333 261 238<br />
Operating margin, % -12.1 4.9 11.9 15.6 18.2 18.7 15.1 14.8<br />
Income before tax -119 49 135 206 274 327 250 233<br />
Net income -90 37 102 157 207 246 189 162<br />
Earnings per share, SEK -2.58 1.05 2.94 4.50 5.94 7.07 5.43 4.66<br />
Definitions<br />
Capital employed<br />
Total assets less non-interest-bearing liabilities, deferred tax liabilities and other provisions.<br />
Cash flow after investments, SEK/share<br />
Cash flow net of investments in relation to average number of shares adjusted for share<br />
buy-backs.<br />
Debt/equity ratio<br />
Interest-bearing debt less cash and cash equivalents and other interest-bearing<br />
receivables in relation to shareholders’ equity.<br />
Earnings per share, SEK<br />
Net income in relation to average number of shares, adjusted for share buy-backs<br />
pursuant to IAS 33.<br />
Equity/assets ratio<br />
Total shareholders’ equity in relation to total assets.<br />
Net indebtedness<br />
Long-term and current interest-bearing liabilities and provisions for pensions less cash and<br />
cash equivalents.<br />
Interest coverage ratio<br />
Income before tax plus net interest income/expenses and exchange rate differences on<br />
financial loans in relation to net interest income/expenses.<br />
Investments<br />
Investments in fixed assets excluding acquisitions.<br />
92 H Ö G A N Ä S 2 0 1 0<br />
Net margin<br />
Income before tax in relation to net sales.<br />
Operating cash flow<br />
Cash flow after investments but before acquisitions or divestments of companies/operations.<br />
Operating margin<br />
Operating income in relation to net sales.<br />
Rate of capital turnover<br />
Net sales divided by average capital employed.<br />
Return on capital employed<br />
Income before tax plus net interest income/expenses and exchange rate differences on<br />
financial loans in relation to average capital employed.<br />
Return on equity<br />
Net income in relation to average shareholders’ equity.<br />
Risk capital/assets<br />
Total shareholders’ equity and deferred tax liability in relation to total assets.<br />
Shareholders’ equity per share, SEK<br />
Shareholders’ equity in relation to the number of shares at year-end adjusted for share<br />
buy-backs.
Addresses<br />
HEAD OFFICE<br />
SWEDEN<br />
<strong>Höganäs</strong> <strong>AB</strong><br />
SE-263 83 <strong>Höganäs</strong><br />
Tel +46 42 33 80 00<br />
Fax +46 42 33 81 50<br />
CEO and President: Alrik Danielson<br />
www.hoganas.com<br />
OFFICES<br />
BELGIUM<br />
<strong>Höganäs</strong> Belgium S.A.<br />
Ruelle Gros Pierre 10<br />
B-7800 Ath<br />
Tel +32 68 26 89 89<br />
Fax +32 68 28 57 75<br />
Managing Director:<br />
Vincent Rasneur<br />
BRAZIL<br />
<strong>Höganäs</strong> Brasil Ltda<br />
Av. Ricieri José Marcatto, 110<br />
Vila Suissa – Cep 08810-020<br />
BR-Mogi das Cruzes - SP<br />
Tel +55 11 4793 7711<br />
Fax +55 11 4793 7708<br />
hoganas.br@hoganas.com<br />
Managing Director:<br />
Claudinei Reche<br />
CHINA<br />
<strong>Höganäs</strong> (China) Co. Ltd<br />
5646 Wai Qing Song Road<br />
Qingpu<br />
CN-Shanghai 201700<br />
Tel +86 21 692 101 12<br />
Fax +86 21 692 131 94<br />
china@hoganas.com<br />
Managing Director: Per Engdahl<br />
Kontor/produktion Agenter<br />
Agents<br />
ARGENTINA<br />
Ferromet S.A.<br />
Von Wernicke 3038, B1642GKB<br />
San Isidro<br />
AR-Buenos Aires<br />
Tel +54 11 47 35 – 3000<br />
Fax +54 11 47 35 7291<br />
info@ferromet.com.ar<br />
Sudametal S.A.<br />
Av. Leandro N. Alem 690,<br />
18th Floor<br />
AR-Buenos Aires<br />
Tel +54 11 4312 3071<br />
Fax +54 11 4313 2536<br />
sudametal@sudametal.com<br />
AUSTRALIA<br />
S. Weir Enterprises Pty Ltd<br />
32 Carrington Road<br />
P.O. Box 477<br />
AU-Guildford<br />
2161 New South Wales<br />
Tel +61-2 9681 6155<br />
Fax +61-2 9681 6092<br />
sweir@metalpowders.com.au<br />
BULGARIA<br />
Balkan International Ltd<br />
P O Box 952<br />
145-B, Racovska Str.<br />
BGN-1000 Sofia<br />
Tel +359-2980 3852<br />
Fax +359-2980 4248<br />
bil@fog-bg.net<br />
CHILE & ARGENTINA<br />
Hascor Metals S/A. de C.V.<br />
Diego Diaz de Berlanga nr. 203<br />
Col. Nogalar C.P. 66480 S.N.G<br />
Metro Area Monterrey, N.L., Mexico<br />
Tel +52 81 8142 30555<br />
Fax +52 81 8142-3050<br />
tfl@hascor.com<br />
FRANCE<br />
<strong>Höganäs</strong> France S.A.S.<br />
1117, Avenue Edouard Herriot<br />
B.P. 30117<br />
FR-69654 Villefranche-sur-Saône<br />
Cedex<br />
Tel +33 474 02 97 50<br />
Fax +33 474 60 63 61<br />
france@hoganas.com<br />
Sales Manager: Thierry Calmes<br />
GERMANY<br />
<strong>Höganäs</strong> GmbH<br />
Grafenberger Allee 56<br />
DE-40237 Düsseldorf<br />
Tel +49 211 99 17 80<br />
Fax +49 211 991 78 35<br />
germany@hoganas.com<br />
Managing Director: Michael Rehnig<br />
INDIA<br />
<strong>Höganäs</strong> India Pvt Ltd<br />
Ganga Commerce<br />
4, North Main Road<br />
Koregaon Park<br />
IN-Pune 411 001<br />
Tel +91 20 660 301 71<br />
Tel +91 20 664 446 00<br />
Fax +91 20 660 301 88<br />
india@hoganas.com<br />
Managing Director:<br />
Srini V Srinivasan<br />
ITALY<br />
<strong>Höganäs</strong> Italia S.r.l.<br />
Via Marsala 55/2<br />
IT-16035 RAPALLO (GE)<br />
Tel +39 0185 23 00 33<br />
Fax +39 0185 27 04 77<br />
italy@hoganas.com<br />
Sales Manager: Riccardo Crosa<br />
CHINA<br />
Wel Trading Co., Ltd<br />
2/F, No 38 Cuiyuan First Street<br />
Henan, Jiangmen<br />
CN-Guangdong<br />
Tel +86 750 389 28 23<br />
Fax +86 750 389 28 22<br />
wel@welcn.com<br />
COLOMBIA, VENEZUELA<br />
Falek Latina E.U<br />
(Falek Latina Comercializadora<br />
Internacional S.A.)<br />
Carrera 71 nr. 53-73<br />
CO-Bogota, D.C.<br />
Tel +57 1 744 6555<br />
Fax +57 1 743 2404<br />
ggalindo@faleklatina.com<br />
CZECH REPUBLIC<br />
Ing Miloslav Makovicka<br />
Krátká 2100<br />
CZ-289 24 Milovice<br />
Tel +420 602 394 806<br />
mimak@mybox.cz<br />
HUNGARY<br />
S & S Kereskedelmi BT<br />
Lágymányosi utca 7. fsz 1/b<br />
H-1111 Budapest<br />
Tel +36-1 209 06 83<br />
Fax +36-1 209 91 72<br />
sefer.sands@t-online.hu<br />
ISRAEL<br />
M.C.T. – Materials Ltd<br />
Hameyasdim Str. 69<br />
P O Box 3011<br />
IL-Even-Yehuda 40500<br />
Tel +972 9 891 1356<br />
Fax +972 2 740 116<br />
mct.ronald@mct-materials.com<br />
JAPAN<br />
<strong>Höganäs</strong> Japan K.K.<br />
Akasaka Shasta East Building<br />
2-19, Akasaka, 4-Chome,<br />
Minato-Ku<br />
JP-Tokyo 107-0052<br />
Tel +81 3 3582-8280<br />
Fax +81 3 3584-9087<br />
japan@hoganas.com<br />
Managing Director: Carl Eklund<br />
RUSSIA<br />
Hoganas East Europe LLC<br />
Savushkina st., 126 A, office 35H<br />
RU-197374 Saint Petersburg<br />
Tel +7 812 334 2542<br />
Fax + 7 812 334 2538<br />
info.russia@hoganas.com<br />
Managing Director:<br />
Radomir Kononov<br />
SOUTH KOREA<br />
<strong>Höganäs</strong> Korea Ltd<br />
13th Floor Daesung Building<br />
1602-7 Seocho-dong<br />
Seocho-gu<br />
KR-Seoul 137-876<br />
Tel +82 2 511 43 44<br />
Fax +82 2 548 25 92<br />
korea@hoganas.com<br />
Managing Director: Per Engdahl<br />
SPAIN<br />
<strong>Höganäs</strong> Ibérica S.A.<br />
C/.Basauri, 17A Bajo Dcha<br />
ES-280 23 Madrid<br />
Tel +34 91 708 05 95<br />
Fax +34 91 708 05 94<br />
Managing Director:<br />
spain@hoganas.com<br />
Ramón Martínez<br />
PHILIPPINES, MALAYSIA<br />
INDONESIA, SINGAPORE,<br />
VIETNAM<br />
CK Metal Trading<br />
45, Jalan BRP 5/3<br />
Bukit Rahman Putra<br />
MY-47000 Sungai Buloh<br />
Selangor<br />
Tel +60-3 6157 8700<br />
Fax +60-3 6157 9700<br />
ckmetal@tm.net.my<br />
Dura-Metal (S) Pte Ltd.<br />
15 Jalan Kilang Barat<br />
# 04-02 Frontech Centre<br />
159357 Singapore<br />
Tel +65 635 62 422<br />
Fax +65 635 267 66<br />
info@durametal.com.sg<br />
POLAND<br />
KOS-Technika<br />
Biuro Doradcze, Slawomir<br />
Kozlowski<br />
ul. Promienna 1A<br />
PL-05-540 Zalesie Gorne<br />
Tel +48 22 73 62 377<br />
Fax +48 22 73 62 377<br />
s.kozlowski@infologis.com.pl<br />
ROMANIA<br />
PromSID S.R.L.<br />
Intr. Lt. Av. Marcel Andreescu<br />
Nr. 45, AP. 3 Sector 1<br />
RO-011648 Bukarest<br />
Tel +40 21 233 90 27<br />
Fax +40 21 230 66 75<br />
office@promsid.ro<br />
Production: <strong>Höganäs</strong> in cooperation with Hallvarsson & Halvarsson • Final Art: Gylling Produktion • Print: Holmbergs i Malmö <strong>AB</strong><br />
A D D R E S S E S<br />
SWEDEN<br />
<strong>Höganäs</strong> Sweden <strong>AB</strong><br />
SE-263 83 <strong>Höganäs</strong><br />
Tel +46 42 33 80 00<br />
Fax +46 42 33 84 04<br />
info@hoganas.com<br />
Managing Director: Fredrik Emilson<br />
TAIWAN R.O.C.<br />
<strong>Höganäs</strong> Taiwan Ltd<br />
Room B, No. 44, 11th Floor,<br />
Chung Shan North Road,<br />
Section 2<br />
TW-Taipei 10448<br />
Tel +886 2 2543 1618<br />
Fax +886 2 2543 1511<br />
taiwan@hoganas.com<br />
Managing Director: Per Engdahl<br />
UNITED KINGDOM<br />
<strong>Höganäs</strong> (Great Britain) Ltd<br />
Munday Industrial Estate<br />
58/66 Morley Road<br />
GB-Tonbridge, TN9 1RP Kent<br />
Tel +44 1732 362243<br />
Fax +44 1732 770262<br />
uk@hoganas.com<br />
Site Manager: Adrian Allen<br />
USA<br />
North American <strong>Höganäs</strong>, Inc.<br />
111 <strong>Höganäs</strong> Way<br />
US-Hollsopple, PA 15935-6416<br />
Tel +1 814 479 3500<br />
Fax +1 814 479 2003<br />
info@nah.com<br />
Managing Director: Avinash Gore<br />
SOUTH AFRICA<br />
Fe Powder Supplies<br />
(Pty) Ltd, Suite 242<br />
Private Bag X7<br />
ZA-2163 Northriding<br />
Tel +27 11 708 7951<br />
Fax +27 11 708 7983<br />
ray@fepowders.co.za<br />
THAILAND<br />
Acme International<br />
(Thailand) Ltd, 630 Onnuj 54<br />
Sukhumvit 77 Road, Suanluang<br />
TH-Bangkok 10250<br />
Tel +66 2 320 5200<br />
Fax +66 2 721 4729<br />
boon@acme-inter.com<br />
TURKEY<br />
Eksper Endustriyel Hammadde<br />
Ve Dis Ticaret Ltd. Sti.<br />
Sipahioglu Caddesi Ekin Sokak<br />
Salkim Apartmani No:11 D:13<br />
TR-34149 Yesilyurt Istanbul<br />
Tel +90 212 573 7391<br />
Fax +90 212 573 7379<br />
eda@eksperdisticaret.com<br />
Polipaz Muhendislik<br />
Buttim is Merkezi<br />
A Blok Kat 4 No 1035<br />
TR-Bursa<br />
Tel +90 224 211 2090<br />
Fax +90 224 211 2636<br />
ridvankahrman@polypaz.xom<br />
Mr Ridvan Kahraman<br />
SET Mühendislik Sanayi ve<br />
Ticaret Ltd<br />
Aydinli Mah. Evrenpasa Cad.<br />
Sonay Is Merkezi No: 65/2<br />
TR-34953 Tuzla/Istanbul<br />
Tel +90 216 393 4010<br />
Fax +90 216 393 4208<br />
kkaya@seteng.com
<strong>Höganäs</strong> has developed an efficient and com-<br />
pact electric motor for bicycles. We have been<br />
able to combine high efficiency with a modular<br />
design thanks to the three-dimensional soft<br />
magnetic characteristics of metal powder.<br />
Accordingly, the motor is suitable for a raft of<br />
applications such as scooters and other light<br />
vehicles, pumps, fans and generators.<br />
This motor has been developed to minimise<br />
environmental impact. The stator is made from<br />
metal powder produced from scrap raw material<br />
and the design enables efficient recycling. It also<br />
uses less rare earth metals and copper wire than<br />
conventional electric motors.<br />
A great example of the Power of Powder.<br />
<strong>Höganäs</strong> <strong>AB</strong> (publ)<br />
263 83 <strong>Höganäs</strong>, Sweden<br />
Tel +46 42 33 80 00<br />
Fax +46 42 33 83 60<br />
www.hoganas.com