

20 - World Journal of Gastroenterology
20 - World Journal of Gastroenterology
20 - World Journal of Gastroenterology

Create successful ePaper yourself
Turn your PDF publications into a flip-book with our unique Google optimized e-Paper software.
HCT116 cells (1 × 10 6 ) were planted in 96-well plates with<br />
RPMI1640 in a final volume <strong>of</strong> 500 μL. On the following<br />
day, cells were treated with increasing concentration <strong>of</strong><br />
siRNA and cultured for 48 h, then cell proliferation was<br />
assessed by MTT assay. Following incubation at 37℃ for<br />
3 h, the reaction was stopped by the addition <strong>of</strong> 150 μL<br />
DMSO. After the crystal dissolved, the absorbency <strong>of</strong> the<br />
samples was determined at 492 nm.<br />
Cell counting<br />
HCT116 cells were planted in 24-well plates with RPMI<br />
1640. Cells were treated with increasing concentration <strong>of</strong><br />
siRNA and cultured for 48 h, then cells were collected by<br />
trypsinization, mixed in PBS and trypan blue added. Cells<br />
were counted using a microscope counting chamber.<br />
Flow cytometric analysis<br />
At 24 h after transfection, HCT116 cells on 60-mm tissue<br />
culture plate were treated with 1 × trypsin-EDTA (Invitrogen,<br />
Carlsbad, CA) for 5 min at 37℃; cells were then<br />
removed from the plate by gentle scraping, dispersed into<br />
cold PBS and washed twice. The cells were resuspended in<br />
1 × binding buffer at a concentration <strong>of</strong> approximately 1<br />
× 10 6 cells/mL. Five μL <strong>of</strong> Annexin V- FITC and 10 μL<br />
<strong>of</strong> PI were added to each cell suspension and incubated at<br />
room temperature for 10 min in the dark. The cells were<br />
subjected to fluorescence estimation using a FACS Calibur<br />
flow cytometer. Uninoculated cells stained with Annexin V-<br />
FITC and PI were used to determine background levels <strong>of</strong><br />
apoptosis.<br />
Xenograft model<br />
All animal experiments in this report were performed with<br />
approval <strong>of</strong> the Institutional Animal Care & Use Committee<br />
in Ewha Womans University, School <strong>of</strong> Medicine.<br />
The 4-wk-old male BALB/c nude mice were grown in a<br />
sanitary room and adjusted for 1 wk before the start <strong>of</strong><br />
the experiments. Viable HCT116 colon cancer cells (2.0 ×<br />
10 6 in PBS/100 μL) were injected subcutaneously into the<br />
right flank <strong>of</strong> the nude mice. Three weeks after tumor cell<br />
inoculation with confirmation <strong>of</strong> successful maturation <strong>of</strong><br />
tumors, mice were divided randomly into four groups (ten<br />
mice per group) and were treated weekly for 4 wk by way<br />
<strong>of</strong> center-intratumoral direct injection at different doses (10,<br />
<strong>20</strong>, 50 μmol/L) <strong>of</strong> siRNA manufactured with atelocollagen<br />
to achieve effective delivery. To prepare the siRNA/atelocollagen<br />
complex, equal volumes <strong>of</strong> atelocollagen (Atelo-<br />
Gene ® Systemic Use; Koken, Tokyo, Japan. 0.1% in PBS<br />
at pH 7.4) and siRNA solution were combined and mixed<br />
by rotation for <strong>20</strong> min at 4℃. In the control group, pure<br />
PBS was injected using the same method. The tumors were<br />
monitored with a caliper every week over a 4 wk period<br />
after siRNA transfection. Tumor volume for each mouse<br />
was determined (in cubic millimeter) by measuring in two<br />
directions and was calculated as tumor volume = length ×<br />
(width) 2 /2. Also, body weight <strong>of</strong> each mouse was monitored<br />
and recorded. Five weeks after the last siRNA injection,<br />
all mice were sacrificed according to the animal experi-<br />
WJG|www.wjgnet.com<br />
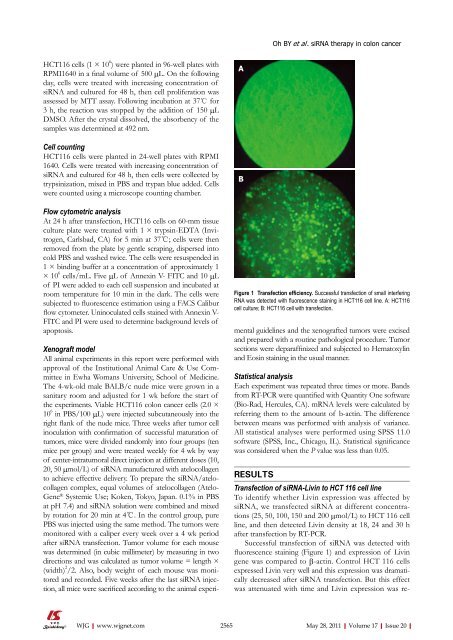
A<br />
B<br />
Figure 1 Transfection efficiency. Successful transfection <strong>of</strong> small interfering<br />
RNA was detected with fluorescence staining in HCT116 cell line. A: HCT116<br />
cell culture; B: HCT116 cell with transfection.<br />
mental guidelines and the xenografted tumors were excised<br />
and prepared with a routine pathological procedure. Tumor<br />
sections were deparaffinized and subjected to Hematoxylin<br />
and Eosin staining in the usual manner.<br />
Statistical analysis<br />
Each experiment was repeated three times or more. Bands<br />
from RT-PCR were quantified with Quantity One s<strong>of</strong>tware<br />
(Bio-Rad, Hercules, CA). mRNA levels were calculated by<br />
referring them to the amount <strong>of</strong> b-actin. The difference<br />
between means was performed with analysis <strong>of</strong> variance.<br />
All statistical analyses were performed using SPSS 11.0<br />
s<strong>of</strong>tware (SPSS, Inc., Chicago, IL). Statistical significance<br />
was considered when the P value was less than 0.05.<br />
RESULTS<br />
Oh BY et al . siRNA therapy in colon cancer<br />
Transfection <strong>of</strong> siRNA-Livin to HCT 116 cell line<br />
To identify whether Livin expression was affected by<br />
siRNA, we transfected siRNA at different concentrations<br />
(25, 50, 100, 150 and <strong>20</strong>0 μmol/L) to HCT 116 cell<br />
line, and then detected Livin density at 18, 24 and 30 h<br />
after transfection by RT-PCR.<br />
Successful transfection <strong>of</strong> siRNA was detected with<br />
fluorescence staining (Figure 1) and expression <strong>of</strong> Livin<br />
gene was compared to β-actin. Control HCT 116 cells<br />
expressed Livin very well and this expression was dramatically<br />
decreased after siRNA transfection. But this effect<br />
was attenuated with time and Livin expression was re-<br />
2565 May 28, <strong>20</strong>11|Volume 17|Issue <strong>20</strong>|


