Operating Instructions CQ Series - Meyer Sound Laboratories Inc.
Operating Instructions CQ Series - Meyer Sound Laboratories Inc.
Operating Instructions CQ Series - Meyer Sound Laboratories Inc.

You also want an ePaper? Increase the reach of your titles
YUMPU automatically turns print PDFs into web optimized ePapers that Google loves.
Coverage Angles and<br />
Polar Plots<br />
Coverage Angles<br />
The coverage angles for the <strong>CQ</strong> <strong>Series</strong> over a wide<br />
frequency range are summarized in the following table:<br />
<strong>CQ</strong><br />
<strong>Series</strong><br />
Coverage<br />
Angles<br />
1 horizontal vertical<br />
<strong>CQ</strong>-1 ( – 6 dB<br />
points)<br />
8 0°<br />
4 0°<br />
<strong>CQ</strong>-1 ( – 10<br />
dB<br />
points)<br />
1 00°<br />
5 0°<br />
<strong>CQ</strong>-2 ( – 6 dB<br />
points)<br />
5 0°<br />
4 0°<br />
<strong>CQ</strong>-2 ( – 10<br />
dB<br />
points)<br />
6 0°<br />
5 0°<br />
1. <strong>CQ</strong>-1: 500 Hz–16 kHz; <strong>CQ</strong>-2: 800 Hz–12 kHz<br />
2. <strong>CQ</strong>-1 and <strong>CQ</strong>-2: 1.5–12 kHz<br />
The –6 dB points denote the angle at which the measured<br />
SPL has decreased to half its on-axis value. The –10 dB<br />
points represent the angle at which the perceived SPL<br />
has decreased to half its on-axis value.<br />
Polar Plots<br />
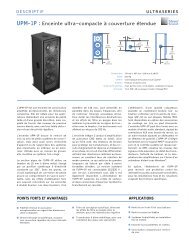
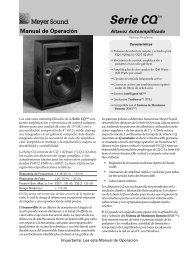
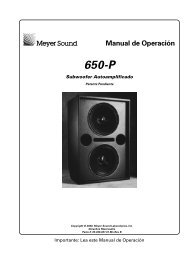
The data for the <strong>CQ</strong> <strong>Series</strong> polar patterns was measured<br />
in <strong>Meyer</strong> <strong>Sound</strong>’s anechoic chamber (photo at right)<br />
with the SIM System II <strong>Sound</strong> Analyzer in dB SPL at a<br />
distance of 14 ft, using angular and frequency resolutions<br />
of 1° and 1 ⁄24 octave, respectively. The polar plots on<br />
the following pages have been smoothed to angular<br />
and frequency resolutions of 2° and 1 octave, and<br />
normalized to 0 dB on-axis. Each polar pattern shows<br />
the response of a 1 octave band centered at the frequency<br />
indicated on the plot; there are no gaps in the data<br />
from 125 Hz to 16 kHz.<br />
The polar patterns reveal that the <strong>CQ</strong>-1 has a wider<br />
horizontal coverage pattern than the <strong>CQ</strong>-2 and that<br />
their vertical coverage is virtually identical. The uniform<br />
beam width that distinguishes the <strong>CQ</strong> <strong>Series</strong> is evident<br />
in their polar patterns in the horn’s range (1–16 kHz);<br />
note the lack of side or back lobes.<br />
2<br />
The table below lists the maximum on-axis peak dB SPL<br />
per octave measured at 1 m for the <strong>CQ</strong>-1 and <strong>CQ</strong>-2.<br />
Maximum<br />
Peak<br />
dB<br />
SPL<br />
Frequency <strong>CQ</strong>-1 <strong>CQ</strong>-2<br />
125 Hz<br />
127127 250 Hz<br />
130 130<br />
500 Hz<br />
130 130<br />
1 kHz<br />
132 139<br />
2 kHz<br />
136 139<br />
4 kHz<br />
136 139<br />
8 kHz<br />
132 134<br />
16 kHz<br />
122 124<br />
<strong>Meyer</strong> <strong>Sound</strong>’s anechoic chamber<br />
11