Living on the Margins. Minorities in South Asia - EURAC
Living on the Margins. Minorities in South Asia - EURAC
Living on the Margins. Minorities in South Asia - EURAC
- TAGS
- minorities
- eurac
- www.eurac.edu
You also want an ePaper? Increase the reach of your titles
YUMPU automatically turns print PDFs into web optimized ePapers that Google loves.
leave Karachi. Outward migrati<strong>on</strong> resulted <strong>in</strong> a 7.73 % <strong>in</strong>crease <strong>in</strong> <strong>the</strong> number of S<strong>in</strong>dhi<br />
speak<strong>in</strong>g populati<strong>on</strong> <strong>in</strong> <strong>the</strong> prov<strong>in</strong>ce.<br />
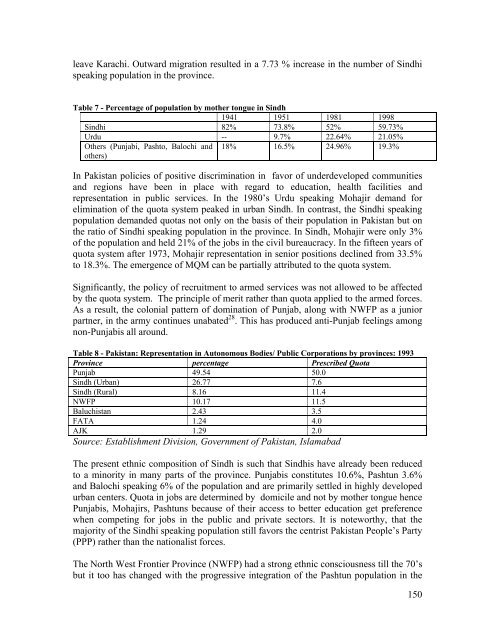
Table 7 - Percentage of populati<strong>on</strong> by mo<strong>the</strong>r t<strong>on</strong>gue <strong>in</strong> S<strong>in</strong>dh<br />
1941 1951 1981 1998<br />
S<strong>in</strong>dhi 82% 73.8% 52% 59.73%<br />
Urdu -- 9.7% 22.64% 21.05%<br />
O<strong>the</strong>rs (Punjabi, Pashto, Balochi and<br />
o<strong>the</strong>rs)<br />
18% 16.5% 24.96% 19.3%<br />
In Pakistan policies of positive discrim<strong>in</strong>ati<strong>on</strong> <strong>in</strong> favor of underdeveloped communities<br />
and regi<strong>on</strong>s have been <strong>in</strong> place with regard to educati<strong>on</strong>, health facilities and<br />
representati<strong>on</strong> <strong>in</strong> public services. In <strong>the</strong> 1980’s Urdu speak<strong>in</strong>g Mohajir demand for<br />
elim<strong>in</strong>ati<strong>on</strong> of <strong>the</strong> quota system peaked <strong>in</strong> urban S<strong>in</strong>dh. In c<strong>on</strong>trast, <strong>the</strong> S<strong>in</strong>dhi speak<strong>in</strong>g<br />
populati<strong>on</strong> demanded quotas not <strong>on</strong>ly <strong>on</strong> <strong>the</strong> basis of <strong>the</strong>ir populati<strong>on</strong> <strong>in</strong> Pakistan but <strong>on</strong><br />
<strong>the</strong> ratio of S<strong>in</strong>dhi speak<strong>in</strong>g populati<strong>on</strong> <strong>in</strong> <strong>the</strong> prov<strong>in</strong>ce. In S<strong>in</strong>dh, Mohajir were <strong>on</strong>ly 3%<br />
of <strong>the</strong> populati<strong>on</strong> and held 21% of <strong>the</strong> jobs <strong>in</strong> <strong>the</strong> civil bureaucracy. In <strong>the</strong> fifteen years of<br />
quota system after 1973, Mohajir representati<strong>on</strong> <strong>in</strong> senior positi<strong>on</strong>s decl<strong>in</strong>ed from 33.5%<br />
to 18.3%. The emergence of MQM can be partially attributed to <strong>the</strong> quota system.<br />
Significantly, <strong>the</strong> policy of recruitment to armed services was not allowed to be affected<br />
by <strong>the</strong> quota system. The pr<strong>in</strong>ciple of merit ra<strong>the</strong>r than quota applied to <strong>the</strong> armed forces.<br />
As a result, <strong>the</strong> col<strong>on</strong>ial pattern of dom<strong>in</strong>ati<strong>on</strong> of Punjab, al<strong>on</strong>g with NWFP as a junior<br />
partner, <strong>in</strong> <strong>the</strong> army c<strong>on</strong>t<strong>in</strong>ues unabated 28 . This has produced anti-Punjab feel<strong>in</strong>gs am<strong>on</strong>g<br />
n<strong>on</strong>-Punjabis all around.<br />
Table 8 - Pakistan: Representati<strong>on</strong> <strong>in</strong> Aut<strong>on</strong>omous Bodies/ Public Corporati<strong>on</strong>s by prov<strong>in</strong>ces: 1993<br />
Prov<strong>in</strong>ce percentage Prescribed Quota<br />
Punjab 49.54 50.0<br />
S<strong>in</strong>dh (Urban) 26.77 7.6<br />
S<strong>in</strong>dh (Rural) 8.16 11.4<br />
NWFP 10.17 11.5<br />
Baluchistan 2.43 3.5<br />
FATA 1.24 4.0<br />
AJK 1.29 2.0<br />
Source: Establishment Divisi<strong>on</strong>, Government of Pakistan, Islamabad<br />
The present ethnic compositi<strong>on</strong> of S<strong>in</strong>dh is such that S<strong>in</strong>dhis have already been reduced<br />
to a m<strong>in</strong>ority <strong>in</strong> many parts of <strong>the</strong> prov<strong>in</strong>ce. Punjabis c<strong>on</strong>stitutes 10.6%, Pashtun 3.6%<br />
and Balochi speak<strong>in</strong>g 6% of <strong>the</strong> populati<strong>on</strong> and are primarily settled <strong>in</strong> highly developed<br />
urban centers. Quota <strong>in</strong> jobs are determ<strong>in</strong>ed by domicile and not by mo<strong>the</strong>r t<strong>on</strong>gue hence<br />
Punjabis, Mohajirs, Pashtuns because of <strong>the</strong>ir access to better educati<strong>on</strong> get preference<br />
when compet<strong>in</strong>g for jobs <strong>in</strong> <strong>the</strong> public and private sectors. It is noteworthy, that <strong>the</strong><br />
majority of <strong>the</strong> S<strong>in</strong>dhi speak<strong>in</strong>g populati<strong>on</strong> still favors <strong>the</strong> centrist Pakistan People’s Party<br />
(PPP) ra<strong>the</strong>r than <strong>the</strong> nati<strong>on</strong>alist forces.<br />
The North West Fr<strong>on</strong>tier Prov<strong>in</strong>ce (NWFP) had a str<strong>on</strong>g ethnic c<strong>on</strong>sciousness till <strong>the</strong> 70’s<br />
but it too has changed with <strong>the</strong> progressive <strong>in</strong>tegrati<strong>on</strong> of <strong>the</strong> Pashtun populati<strong>on</strong> <strong>in</strong> <strong>the</strong><br />
150


