Species and Community Profiles - San Francisco Estuary ...
Species and Community Profiles - San Francisco Estuary ...
Species and Community Profiles - San Francisco Estuary ...

You also want an ePaper? Increase the reach of your titles
YUMPU automatically turns print PDFs into web optimized ePapers that Google loves.
Fish<br />
Amphibians &<br />
Reptiles<br />
numerically dominant fish species of Morro Bay lower<br />
intertidal mudflats. The bay goby inhabits burrows of<br />
the blue mud shrimp (Upogebia pugettensis) <strong>and</strong> the innkeeper<br />
worm (Urechis caupo) <strong>and</strong> siphon holes of the<br />
geoduck clam (Panope generosa) in Morro Bay (Grossman<br />
1979a). As for several other species of gobies common<br />
to <strong>San</strong> <strong>Francisco</strong> Bay, including arrow goby <strong>and</strong> longjaw<br />
mudsucker, the bay goby probably utilizes burrows as a<br />
refuge from predators <strong>and</strong> to avoid desiccation at low<br />
tides.<br />
Few bay gobies have been collected in <strong>San</strong> <strong>Francisco</strong><br />
Bay tidal marshes. One bay goby was reported from<br />
Gallinas Marsh <strong>and</strong> one from Corte Madera Marsh<br />
(CH 2 M Hill 1982). Both fish were collected by gill nets,<br />
which were used to sample the larger channels. In contrast,<br />
the bay goby was the most common species collected<br />
in otter trawl samples from Corte Madera Creek<br />
channel, adjacent to Corte Madera Marsh. No bay gobies<br />
have been collected by other <strong>San</strong> <strong>Francisco</strong> Bay tidal<br />
marsh studies (Wild 1969; Woods 1981; ANATEC<br />
Laboratories1981; CH 2 MHill 1996; CDFG, unpub.<br />
data) or by a study of fishes of Elkhorn Slough tidal<br />
marshes (Barry 1983).<br />
Bay goby YOY are most abundant in otter trawl<br />
samples from February through June, which is a one or<br />
two months after peak abundance period for smaller juveniles<br />
from the ichthyoplankton net (CDFG 1987 <strong>and</strong><br />
unpub. data). In several years, multiple cohorts of YOY<br />
fish have been collected; this was especially noticeable<br />
in four of the six years of the 1987-1992 drought<br />
(CDFG, unpub. data). Peak abundance of older fish is<br />
usually from May through September, which corresponds<br />
with the peak period of larval abundance in <strong>San</strong><br />
<strong>Francisco</strong> Bay.<br />
The bay goby has been collected primarily from<br />
polyhaline salinities in <strong>San</strong> <strong>Francisco</strong> Bay, with YOY fish<br />
collected at lower salinities than older fish (Table 2.6).<br />
YOY were also collected at slightly lower temperatures<br />
than older fish (Table 2.6). These differences in salinity<br />
<strong>and</strong> temperature by age class are reflected by the dis-<br />
Table 2.6 Bay Goby Salinity <strong>and</strong> Temperature<br />
Statistics: 1980-92 (CDFG unpublished data)<br />
Age Class Mean 5 th Median 95 th<br />
percentile percentile<br />
Salinity (ppt):<br />
YOY 27.3 14.9 29.2 31.7<br />
1+ <strong>and</strong> older 28.1 17.1 29.7 32.4<br />
Temperature (°C):<br />
YOY 15.4 11.3 15.2 18.8<br />
1+ <strong>and</strong> older 16.0 12.4 16.3 18.9<br />
140 Bayl<strong>and</strong>s Ecosystem <strong>Species</strong> <strong>and</strong> <strong>Community</strong> <strong>Profiles</strong><br />
tribution of YOY somewhat further upstream than older<br />
fish <strong>and</strong> by the peak abundance of YOY in the winter<br />
<strong>and</strong> spring <strong>and</strong> older fish in summer <strong>and</strong> fall.<br />
Population Status <strong>and</strong> Influencing Factors<br />
Although trawls are usually considered ineffective for gobies,<br />
the bay goby is a very common fish in <strong>San</strong> <strong>Francisco</strong><br />
Bay otter trawl surveys. As such, the abundance<br />
indices derived from trawl data may be good indicators<br />
of population trends. California Department of Fish <strong>and</strong><br />
Game otter trawl data from 1980-1998 is the longest<br />
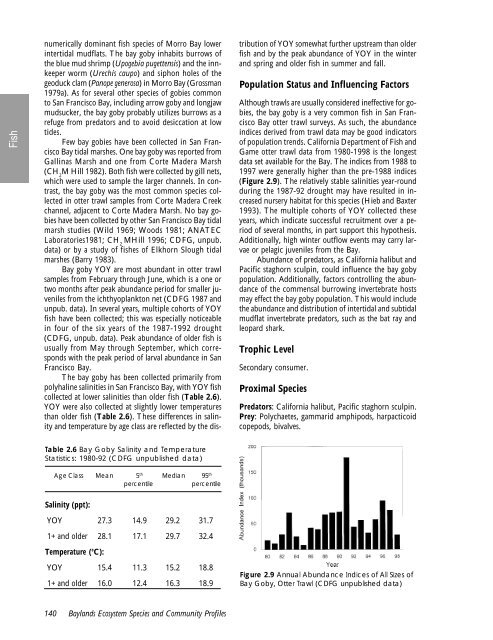
data set available for the Bay. The indices from 1988 to<br />
1997 were generally higher than the pre-1988 indices<br />
(Figure 2.9). The relatively stable salinities year-round<br />
during the 1987-92 drought may have resulted in increased<br />
nursery habitat for this species (Hieb <strong>and</strong> Baxter<br />
1993). The multiple cohorts of YOY collected these<br />
years, which indicate successful recruitment over a period<br />
of several months, in part support this hypothesis.<br />
Additionally, high winter outflow events may carry larvae<br />
or pelagic juveniles from the Bay.<br />
Abundance of predators, as California halibut <strong>and</strong><br />
Pacific staghorn sculpin, could influence the bay goby<br />
population. Additionally, factors controlling the abundance<br />
of the commensal burrowing invertebrate hosts<br />
may effect the bay goby population. This would include<br />
the abundance <strong>and</strong> distribution of intertidal <strong>and</strong> subtidal<br />
mudflat invertebrate predators, such as the bat ray <strong>and</strong><br />
leopard shark.<br />
Trophic Level<br />
Secondary consumer.<br />
Proximal <strong>Species</strong><br />
Predators: California halibut, Pacific staghorn sculpin.<br />
Prey: Polychaetes, gammarid amphipods, harpacticoid<br />
copepods, bivalves.<br />
Figure 2.9 Annual Abundance Indices of All Sizes of<br />
Bay Goby, Otter Trawl (CDFG unpublished data)<br />
Plants