

Necesidades de ecoinnovación y ecoconstrucción en la edificación
Necesidades de ecoinnovación y ecoconstrucción en la edificación
Necesidades de ecoinnovación y ecoconstrucción en la edificación

You also want an ePaper? Increase the reach of your titles
YUMPU automatically turns print PDFs into web optimized ePapers that Google loves.
28<br />
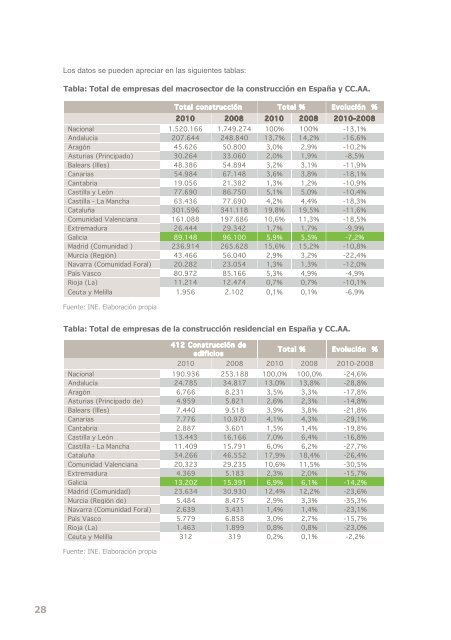
Los datos se pue<strong>de</strong>n apreciar <strong>en</strong> <strong>la</strong>s sigui<strong>en</strong>tes tab<strong>la</strong>s:<br />
tab<strong>la</strong>: total <strong>de</strong> empresas <strong>de</strong>l macrosector <strong>de</strong> <strong>la</strong> construcción <strong>en</strong> España y cc.AA.<br />
Fu<strong>en</strong>te: INE. E<strong>la</strong>boración propia<br />
Fu<strong>en</strong>te: INE. E<strong>la</strong>boración propia<br />
Total construcción Total % Evolución %<br />
2010 2008 2010 2008 2010-2008<br />
Nacional 1.520.166 1.749.274 100% 100% -13,1%<br />
Andalucía 207.644 248.840 13,7% 14,2% -16,6%<br />
Aragón 45.626 50.800 3,0% 2,9% -10,2%<br />
Asturias (Principado) 30.264 33.060 2,0% 1,9% -8,5%<br />
Balears (Illes) 48.386 54.894 3,2% 3,1% -11,9%<br />
Canarias 54.984 67.148 3,6% 3,8% -18,1%<br />
Cantabria 19.056 21.382 1,3% 1,2% -10,9%<br />
Castil<strong>la</strong> y León 77.690 86.750 5,1% 5,0% -10,4%<br />
Castil<strong>la</strong> - La Mancha 63.436 77.690 4,2% 4,4% -18,3%<br />
Cataluña 301.596 341.118 19,8% 19,5% -11,6%<br />
Comunidad Val<strong>en</strong>ciana 161.088 197.686 10,6% 11,3% -18,5%<br />
Extremadura 26.444 29.342 1,7% 1,7% -9,9%<br />
Galicia 89.148 96.100 5,9% 5,5% -7,2%<br />
Madrid (Comunidad ) 236.914 265.628 15,6% 15,2% -10,8%<br />
Murcia (Región) 43.466 56.040 2,9% 3,2% -22,4%<br />
Navarra (Comunidad Foral) 20.282 23.054 1,3% 1,3% -12,0%<br />
País Vasco<br />
Rioja (La) !<br />
80.972<br />
11.214<br />
85.166<br />
12.474<br />
5,3%<br />
0,7%<br />
4,9%<br />
0,7%<br />
-4,9%<br />
-10,1%<br />
Ceuta y Melil<strong>la</strong> 1.956 2.102 0,1% 0,1% -6,9%<br />
tab<strong>la</strong>: total <strong>de</strong> empresas <strong>de</strong> <strong>la</strong> construcción resi<strong>de</strong>ncial <strong>en</strong> España y cc.AA.<br />
412 Construcción <strong>de</strong><br />
edificios<br />
Total % Evolución %<br />
2010 2008 2010 2008 2010-2008<br />
Nacional 190.936 253.188 100,0% 100,0% -24,6%<br />
Andalucía 24.785 34.817 13,0% 13,8% -28,8%<br />
Aragón 6.766 8.231 3,5% 3,3% -17,8%<br />
Asturias (Principado <strong>de</strong>) 4.959 5.821 2,6% 2,3% -14,8%<br />
Balears (Illes) 7.440 9.518 3,9% 3,8% -21,8%<br />
Canarias 7.776 10.970 4,1% 4,3% -29,1%<br />
Cantabria 2.887 3.601 1,5% 1,4% -19,8%<br />
Castil<strong>la</strong> y León 13.443 16.166 7,0% 6,4% -16,8%<br />
Castil<strong>la</strong> - La Mancha 11.409 15.791 6,0% 6,2% -27,7%<br />
Cataluña 34.266 46.552 17,9% 18,4% -26,4%<br />
Comunidad Val<strong>en</strong>ciana 20.323 29.235 10,6% 11,5% -30,5%<br />
Extremadura 4.369 5.183 2,3% 2,0% -15,7%<br />
Galicia 13.202 15.391 6,9% 6,1% -14,2%<br />
Madrid (Comunidad) 23.634 30.930 12,4% 12,2% -23,6%<br />
Murcia (Región <strong>de</strong>) 5.484 8.475 2,9% 3,3% -35,3%<br />
Navarra (Comunidad Foral) 2.639 3.431 1,4% 1,4% -23,1%<br />
País Vasco 5.779 6.858 3,0% 2,7% -15,7%<br />
Rioja (La) 1.463 1.899 0,8% 0,8% -23,0%<br />
Ceuta y Melil<strong>la</strong> 312 319 0,2% 0,1% -2,2%