

Necesidades de ecoinnovación y ecoconstrucción en la edificación
Necesidades de ecoinnovación y ecoconstrucción en la edificación
Necesidades de ecoinnovación y ecoconstrucción en la edificación

Create successful ePaper yourself
Turn your PDF publications into a flip-book with our unique Google optimized e-Paper software.
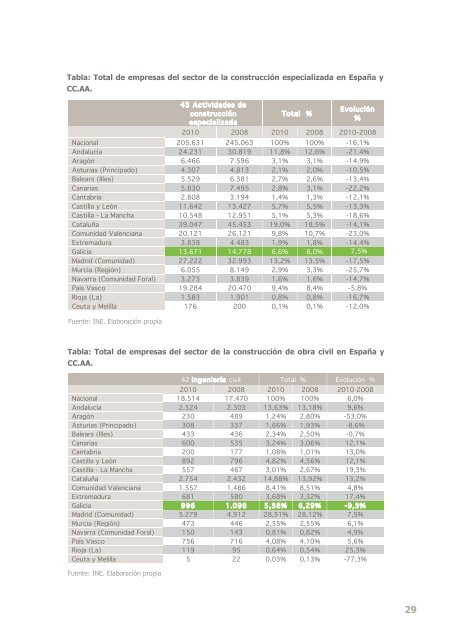
tab<strong>la</strong>: total <strong>de</strong> empresas <strong>de</strong>l sector <strong>de</strong> <strong>la</strong> construcción especializada <strong>en</strong> España y<br />
CC.AA.<br />
Nacional 205.631 245.063 100% 100% -16,1%<br />
Andalucía 24.231 30.819 11,8% 12,6% -21,4%<br />
Aragón 6.466 7.596 3,1% 3,1% -14,9%<br />
Asturias (Principado) 4.307 4.813 2,1% 2,0% -10,5%<br />
Balears (Illes) 5.529 6.381 2,7% 2,6% -13,4%<br />
Canarias 5.830 7.495 2,8% 3,1% -22,2%<br />
Cantabria 2.808 3.194 1,4% 1,3% -12,1%<br />
Castil<strong>la</strong> y León 11.642 13.427 5,7% 5,5% -13,3%<br />
Castil<strong>la</strong> - La Mancha 10.548 12.951 5,1% 5,3% -18,6%<br />
Cataluña 39.047 45.453 19,0% 18,5% -14,1%<br />
Comunidad Val<strong>en</strong>ciana 20.121 26.121 9,8% 10,7% -23,0%<br />
Extremadura 3.838 4.483 1,9% 1,8% -14,4%<br />
Galicia 13.671 14.778 6,6% 6,0% - 7,5%<br />
Madrid (Comunidad) 27.222 32.993 13,2% 13,5% -17,5%<br />
Murcia (Región) 6.055 8.149 2,9% 3,3% -25,7%<br />
Navarra (Comunidad Foral) 3.273 3.839 1,6% 1,6% -14,7%<br />
País Vasco 19.284 20.470 9,4% 8,4% -5,8%<br />
Rioja (La) 1.583 1.901 0,8% 0,8% -16,7%<br />
Ceuta y Melil<strong>la</strong> 176 200 0,1% 0,1% -12,0%<br />
Fu<strong>en</strong>te: INE. E<strong>la</strong>boración propia<br />
Fu<strong>en</strong>te: INE. E<strong>la</strong>boración propia<br />
43 Activida<strong>de</strong>s <strong>de</strong><br />
construcción<br />
especializada<br />
Total %<br />
Evolución<br />
%<br />
2010 2008 2010 2008 2010-2008<br />
tab<strong>la</strong>: total <strong>de</strong> empresas <strong>de</strong>l sector <strong>de</strong> <strong>la</strong> construcción <strong>de</strong> obra civil <strong>en</strong> España y<br />
CC.AA.<br />
42 Ing<strong>en</strong>iería civil Total % Evolución %<br />
2010 2008 2010 2008 2010-2008<br />
Nacional 18.514 17.470 100% 100% 6,0%<br />
Andalucía 2.524 2.303 13,63% 13,18% 9,6%<br />
Aragón 230 489 1,24% 2,80% -53,0%<br />
Asturias (Principado) 308 337 1,66% 1,93% -8,6%<br />
Balears (Illes) 433 436 2,34% 2,50% -0,7%<br />
Canarias 600 535 3,24% 3,06% 12,1%<br />
Cantabria 200 177 1,08% 1,01% 13,0%<br />
Castil<strong>la</strong> y León 892 796 4,82% 4,56% 12,1%<br />
Castil<strong>la</strong> - La Mancha 557 467 3,01% 2,67% 19,3%<br />
Cataluña 2.754 2.432 14,88% 13,92% 13,2%<br />
Comunidad ! Val<strong>en</strong>ciana 1.557 1.486 8,41% 8,51% 4,8%<br />
Extremadura 681 580 3,68% 3,32% 17,4%<br />
Galicia 996 1.098 5,38% 6,29% -9,3%<br />
Madrid (Comunidad) 5.279 4.912 28,51% 28,12% 7,5%<br />
Murcia (Región) 473 446 2,55% 2,55% 6,1%<br />
Navarra (Comunidad Foral) 150 143 0,81% 0,82% 4,9%<br />
País Vasco 756 716 4,08% 4,10% 5,6%<br />
Rioja (La) 119 95 0,64% 0,54% 25,3%<br />
Ceuta y Melil<strong>la</strong> 5 22 0,03% 0,13% -77,3%<br />
29