

Virtual Museums
Virtual Museums
Virtual Museums

Create successful ePaper yourself
Turn your PDF publications into a flip-book with our unique Google optimized e-Paper software.
99<br />
river port, ford, …) and extension. Another important part of<br />
the GIS implementation has been the study of the ancient<br />
communication routes: for reconstructing the itineraries of the<br />
Via Tiberina, on the right bank, of the Via Salaria on the left<br />
one, and of other secondary roads we used the published studies,<br />
the most recent archaeological data coming from the excavations<br />
of the Soprintendenza dell’Etruria Meridionale and, finally, our<br />
own surveys in order to register the remainings of the ancient<br />
routes.<br />
Figure 2.GIS of the archaeological evidences in the project area.<br />
Another important aspect, especially for the Roman period, was<br />
the identification of the traces of centuriationes (agricultural<br />
divisions) (CAMBI, 2004; STERNINI, 2004): these data were<br />
particularly useful for the generation of the reconstructed<br />
landscape, since they allowed us - when available - to clearly<br />
identify the portion of territory belonging to a given village.<br />
At present, the elaboration of the Geographic Information<br />
System of the archaeological evidences is maintained updatable<br />
with new data and sources of information available. The outputs<br />
of this work, impressive because of the lack of a comprehensive<br />
and open collection of all the archaeological sites falling in the<br />
project area, were the basis for the subsequent work aimed at<br />
reconstructing the distribution of ancient ecosystems and<br />
vegetation of the landscape through time.<br />
c. Development and mapping of the natural and anthropic<br />
ecosystems<br />
The first task after the GIS creation is the definition of different<br />
ecosystems characterizing - in each historical period - the<br />
different parts of the landscape. Each ecosystem is a collection<br />
of many plant species whose presence, height and density is<br />
highly interconnected and influenced by many factors such as<br />
geological soil composition, slope, sun exposition, closeness to<br />
water streams and so on. Two main steps are requested in such a<br />
perspective: the first one is related to the natural ecosystem: i.e.<br />
<strong>Virtual</strong> Archaeology Review<br />
the part of the landscape not affected by human actions. This<br />
kind of areas are relatively easy to be set up, according to the<br />
already mentioned data, which are the fundamental influencing<br />
factors. Over this naturally-shaped landscape, a second series of<br />
layers has to be defined: the anthropic landscape. The working<br />
process is, in this step a bit more complex. starting from the<br />
settlements, known through the historical sources and the<br />
archaeological data, areas of main influence are drawn as circular<br />
buffers whose dimension can be defined according to specific<br />
studies. The so-called site-catchment analysis, is a spatial study<br />
used in archaeology since about 40 years ago (HIGGS & VITA-<br />
FINZI, 1970) and applied to GIS analysis since 20 (GAFFNEY<br />
& STANCIC, 1992).<br />
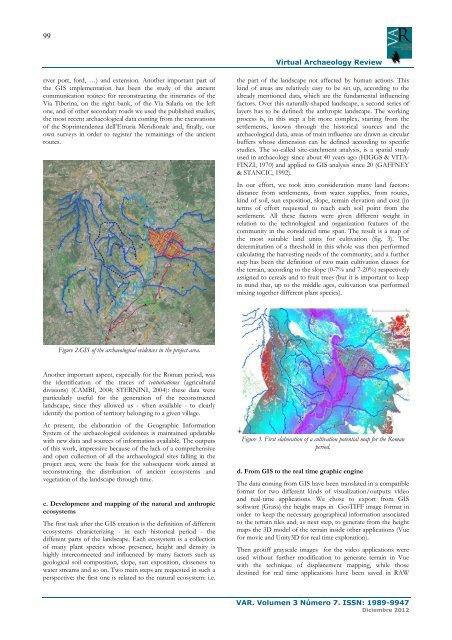
In our effort, we took into consideration many land factors:<br />
distance from settlements, from water supplies, from routes,<br />
kind of soil, sun exposition, slope, terrain elevation and cost (in<br />
terms of effort requested to reach each soil point from the<br />
settlement. All these factors were given different weight in<br />
relation to the technological and organization features of the<br />
community in the considered time span. The result is a map of<br />
the most suitable land units for cultivation (fig. 3). The<br />
determination of a threshold in this whole was then performed<br />
calculating the harvesting needs of the community, and a further<br />
step has been the definition of two main cultivation classes for<br />
the terrain, according to the slope (0-7% and 7-20%) respectively<br />
assigned to cereals and to fruit trees (but it is important to keep<br />
in mind that, up to the middle ages, cultivation was performed<br />
mixing together different plant species).<br />
Figure 3. First elaboration of a cultivation potential map for the Roman<br />
period.<br />
d. From GIS to the real time graphic engine<br />
The data coming from GIS have been translated in a compatible<br />
format for two different kinds of visualization/outputs: video<br />
and real-time applications. We chose to export from GIS<br />
software (Grass) the height maps in GeoTIFF image format in<br />
order to keep the necessary geographical information associated<br />
to the terrain tiles and, as next step, to generate from the height<br />
maps the 3D model of the terrain inside other applications (Vue<br />
for movie and Unity3D for real time exploration).<br />
Then geotiff grayscale images for the video applications were<br />
used without further modification to generate terrain in Vue<br />
with the technique of displacement mapping, while those<br />
destined for real time applications have been saved in RAW<br />
VAR. Volumen 3 Número 7. ISSN: 1989-9947<br />
Diciembre 2012