Análisis de Regresión y Correlación con MINITAB - Tecnun
Análisis de Regresión y Correlación con MINITAB - Tecnun
Análisis de Regresión y Correlación con MINITAB - Tecnun

Create successful ePaper yourself
Turn your PDF publications into a flip-book with our unique Google optimized e-Paper software.
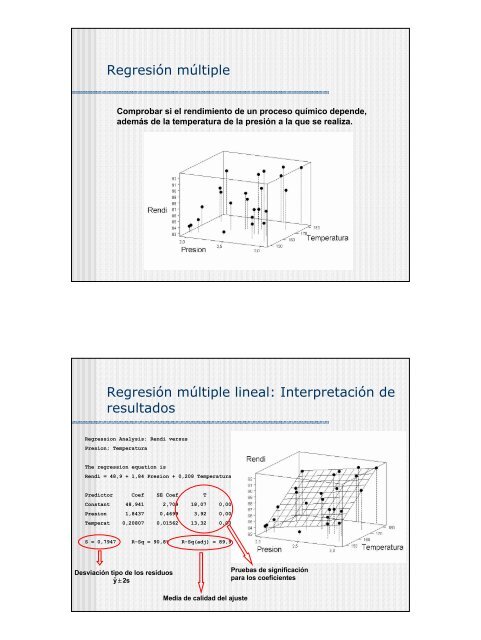
<strong>Regresión</strong> múltiple<br />
Comprobar si el rendimiento <strong>de</strong> un proceso químico <strong>de</strong>pen<strong>de</strong>,<br />
a<strong>de</strong>más <strong>de</strong> la temperatura <strong>de</strong> la presión a la que se realiza.<br />
<strong>Regresión</strong> múltiple lineal: Interpretación <strong>de</strong><br />
resultados<br />
Regression Analysis: Rendi versus<br />
Presion; Temperatura<br />
The regression equation is<br />
Rendi = 48,9 + 1,84 Presion + 0,208 Temperatura<br />
Predictor Coef SE Coef T P<br />
Constant 48,941 2,709 18,07 0,000<br />
Presion 1,8437 0,4699 3,92 0,001<br />
Temperat 0,20807 0,01562 13,32 0,000<br />
S = 0,7947 R-Sq = 90,8% R-Sq(adj) = 89,9%<br />
Desviación tipo <strong>de</strong> los residuos<br />
yˆ ± 2s<br />
Media <strong>de</strong> calidad <strong>de</strong>l ajuste<br />
Pruebas <strong>de</strong> significación<br />
para los coeficientes