Análisis de Regresión y Correlación con MINITAB - Tecnun
Análisis de Regresión y Correlación con MINITAB - Tecnun
Análisis de Regresión y Correlación con MINITAB - Tecnun

You also want an ePaper? Increase the reach of your titles
YUMPU automatically turns print PDFs into web optimized ePapers that Google loves.
95<br />
90<br />
85<br />
80<br />
75<br />
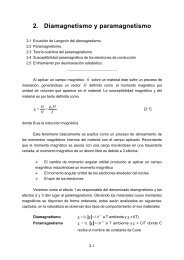
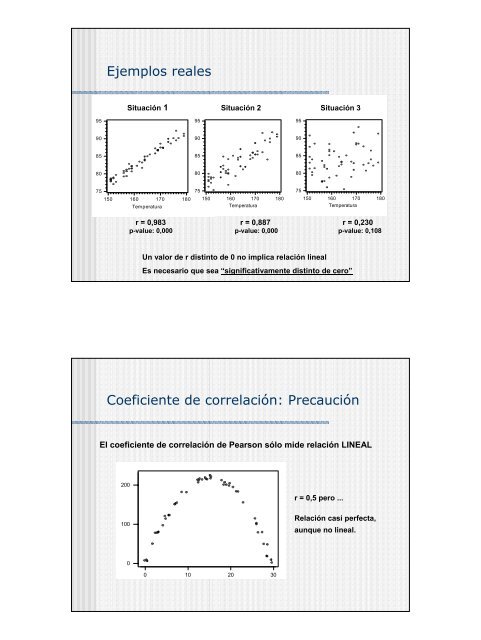
Ejemplos reales<br />
150<br />
Situación 1 Situación 2 Situación 3<br />
160<br />
170<br />
Temperatura<br />
180<br />
95<br />
90<br />
85<br />
80<br />
75<br />
150 160 170 180<br />
Temperatura<br />
95<br />
90<br />
85<br />
80<br />
75<br />
150 160 170 180<br />
Temperatura<br />
r = 0,983 r = 0,887 r = 0,230<br />
p-value: 0,000 p-value: 0,000 p-value: 0,108<br />
Un valor <strong>de</strong> r distinto <strong>de</strong> 0 no implica relación lineal<br />
Es necesario que sea “significativamente distinto <strong>de</strong> cero”<br />
Coeficiente <strong>de</strong> correlación: Precaución<br />
El coeficiente <strong>de</strong> correlación <strong>de</strong> Pearson sólo mi<strong>de</strong> relación LINEAL<br />
200<br />
100<br />
0<br />
0 10 20 30<br />
r = 0,5 pero ...<br />
Relación casi perfecta,<br />
aunque no lineal.