Riesgos a la salud por la crianza de cerdos alimentados ... - BVSDE
Riesgos a la salud por la crianza de cerdos alimentados ... - BVSDE
Riesgos a la salud por la crianza de cerdos alimentados ... - BVSDE

You also want an ePaper? Increase the reach of your titles
YUMPU automatically turns print PDFs into web optimized ePapers that Google loves.
1 <strong>Riesgos</strong> a <strong>la</strong> <strong>salud</strong> <strong>por</strong> <strong>la</strong> <strong>crianza</strong> <strong>de</strong> <strong>cerdos</strong> en sitios <strong>de</strong> disposición final <strong>de</strong><br />
residuos sólidos<br />
1.1 Aspectos generales <strong>de</strong> <strong>la</strong> problemática regional <strong>de</strong> residuos sólidos<br />
Según el informe <strong>de</strong> <strong>la</strong> Evaluación Regional <strong>de</strong><br />
los Servicios <strong>de</strong> Manejo <strong>de</strong> Residuos Sólidos<br />
Municipales en América Latina y el Caribe, OPS<br />
2005, en el año 2001 América Latina y el Caribe<br />
(ALC) tenía una pob<strong>la</strong>ción <strong>de</strong> 518 millones <strong>de</strong><br />
habitantes, <strong>de</strong> los cuales 406 millones (78,3%)<br />
eran urbanos y producían alre<strong>de</strong>dor <strong>de</strong> 369.000<br />
tone<strong>la</strong>das <strong>de</strong> residuos sólidos municipales al día.<br />
La generación promedio regional <strong>por</strong> habitante<br />
ascien<strong>de</strong> a 0,79 y 0,91 kg <strong>por</strong> día <strong>de</strong> residuos<br />
domésticos y municipales, respectivamente. En<br />
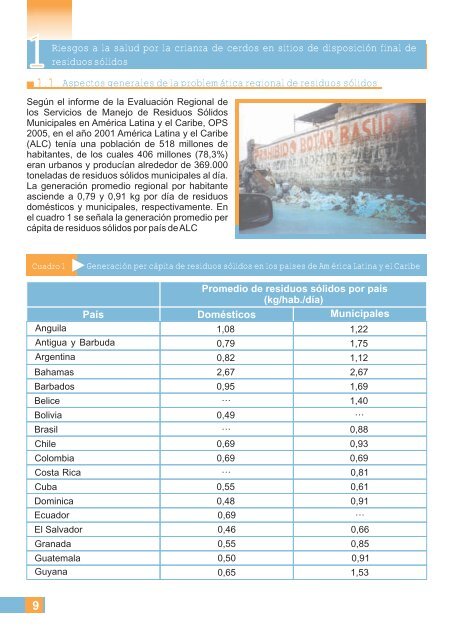
el cuadro 1 se seña<strong>la</strong> <strong>la</strong> generación promedio per<br />
cápita <strong>de</strong> residuos sólidos <strong>por</strong> país <strong>de</strong> ALC<br />
Cuadro 1 Generación per cápita <strong>de</strong> residuos sólidos en los países <strong>de</strong> América Latina y el Caribe<br />
Promedio <strong>de</strong> residuos sólidos <strong>por</strong> país<br />
(kg/hab./día)<br />
País Domésticos Municipales<br />
Angui<strong>la</strong> 1,08 1,22<br />
Antigua y Barbuda 0,79 1,75<br />
Argentina 0,82 1,12<br />
Bahamas 2,67 2,67<br />
Barbados 0,95 1,69<br />
Belice … 1,40<br />
Bolivia 0,49 …<br />
Brasil … 0,88<br />
Chile 0,69 0,93<br />
Colombia 0,69 0,69<br />
Costa Rica … 0,81<br />
Cuba 0,55 0,61<br />
Dominica 0,48 0,91<br />
Ecuador 0,69 …<br />
El Salvador 0,46 0,66<br />
Granada 0,55 0,85<br />
Guatema<strong>la</strong> 0,50 0,91<br />
Guyana 0,65 1,53<br />
9