- Page 1 and 2:
TI-84 Plus TI-84 Plus Silver Editio
- Page 3 and 4:
Capítulo 1: Funcionamiento del mod
- Page 5 and 6:
TI-84 Plus Teclas de representació
- Page 7 and 8:
La tecla y da acceso a la función
- Page 9 and 10:
(más oscuro), que indica el nivel
- Page 11 and 12:
pasará al comienzo de la línea si
- Page 13 and 14:
Carcasa intercambiable La carcasa d
- Page 15 and 16:
Cambio de la configuración del rel
- Page 17 and 18:
Uso de la pantalla Mode para activa
- Page 19 and 20:
Calcular 3.76 P (L7.9 + ‡5) + 2 l
- Page 21 and 22:
• Para ir al punto en el que se p
- Page 23 and 24:
opciones MODE al apagar la TI-84 Pl
- Page 25 and 26:
Modos Float, 0123456789 El modo dec
- Page 27 and 28:
Modos Sequential, Simul El modo Seq
- Page 29 and 30:
Tipo de variables Nombres Listas L1
- Page 31 and 32:
3. Pulse ƒ y, a continuación, la
- Page 33 and 34:
3. Pulse Í. El contenido de la var
- Page 35 and 36:
Para volver a ejecutar la entrada v
- Page 37 and 38:
Calcular la superficie de un huerto
- Page 39 and 40:
• Cuando un elemento de menú ter
- Page 41 and 42:
Cómo seleccionar un elemento de un
- Page 43 and 44:
2:Zoom y 5:Statistics, cada uno de
- Page 45 and 46:
EOS evalúa las funciones de una ex
- Page 47 and 48:
Por ejemplo, MX 2 , es un número n
- Page 49 and 50:
• Almacenar datos, programas, apl
- Page 51 and 52:
Listas Es posible introducir y guar
- Page 53 and 54:
Archivo La función de archivo perm
- Page 55 and 56:
Cómo corregir un error Para correg
- Page 57 and 58:
2. Pulse Í para calcular la expres
- Page 59 and 60:
Puede utilizar las funciones trigon
- Page 61 and 62:
Negación L (negación, Ì) devuelv
- Page 63 and 64:
simplificarse o el denominador resu
- Page 65 and 66:
nDeriv( nDeriv( (derivada numérica
- Page 67 and 68:
• El editor de ecuaciones (ver el
- Page 69 and 70:
Cómo resolver una variable en el e
- Page 71 and 72:
• Se muestra leftNrt=dif en la ú
- Page 73 and 74:
Operaciones MATH NUM (Número) Men
- Page 75 and 76:
fPart( (parte fraccionaria) devuelv
- Page 77 and 78:
Introducción y uso de los números
- Page 79 and 80:
de e^(i45) = cos(45) + i sen(45), s
- Page 81 and 82:
Operaciones MATH CPX (Complejos) Me
- Page 83 and 84:
angle(a+bi) devuelve un valor para
- Page 85 and 86:
and rand (número aleatorio) genera
- Page 87 and 88:
Nota: El factorial se calcula de fo
- Page 89 and 90:
Operaciones ANGLE Menú ANGLE Para
- Page 91 and 92:
Radianes r (radianes) designa un á
- Page 93 and 94:
Operaciones TEST (Relacionales) Men
- Page 95 and 96:
Operaciones TEST LOGIC (Booleanas)
- Page 97 and 98:
Capítulo 3: Representación gráfi
- Page 99 and 100:
Definición de gráficos Similitude
- Page 101 and 102:
La TI-84 Plus tiene cuatro modos de
- Page 103 and 104:
2. Pulse † para situar el cursor
- Page 105 and 106:
Plus sólo representa las funciones
- Page 107 and 108:
Por ejemplo, en el modo Func, FnOff
- Page 109 and 110:
5. Pulse ~, } o † después de sel
- Page 111 and 112:
Por ejemplo, cuando se ejecuta este
- Page 113 and 114:
Nota: Las expresiones Xmin
- Page 115 and 116:
Los parámetros de formato definen
- Page 117 and 118:
LabelOff, LabelOn LabelOff y LabelO
- Page 119 and 120:
Cómo solapar funciones en un gráf
- Page 121 and 122:
Precisión de gráficos El cursor d
- Page 123 and 124:
Cómo desplazar el cursor de recorr
- Page 125 and 126:
Explorar gráficos con instruccione
- Page 127 and 128:
Zoom In, Zoom Out Zoom In amplía l
- Page 129 and 130:
ZTrig ZTrig vuelve a dibujar inmedi
- Page 131 and 132:
ZoomSto ZoomSto almacena inmediatam
- Page 133 and 134:
Uso de las operaciones CALC (Cálcu
- Page 135 and 136:
Para buscar un cero de una función
- Page 137 and 138:
1. Elija 5: intersect en el menú C
- Page 139 and 140:
Capítulo 3: Representación gráfi
- Page 141 and 142:
1. Pulse z. Pulse † † † ~ Í
- Page 143 and 144:
10. Pulse s. La acción de represen
- Page 145 and 146:
Cómo definir y editar ecuaciones p
- Page 147 and 148:
Cómo visualizar un gráfico Cuando
- Page 149 and 150:
En el formato RectGC, se actualiza
- Page 151 and 152:
Capítulo 5: Gráficos en coordenad
- Page 153 and 154:
Cómo definir el modo de gráficos
- Page 155 and 156:
Cómo definir las variables de vent
- Page 157 and 158:
• Almacenar las ecuaciones en coo
- Page 159 and 160:
CALC En el modo de gráficos Pol, l
- Page 161 and 162:
3. Pulse o. Si el icono de estilo d
- Page 163 and 164:
• La variable independiente n.
- Page 165 and 166:
Cómo definir funciones de sucesion
- Page 167 and 168:
Las sucesiones recursivas requieren
- Page 169 and 170:
término de una sucesión, defina P
- Page 171 and 172:
está seleccionado el formato Coord
- Page 173 and 174:
• Si se selecciona el formato de
- Page 175 and 176:
Nota: Siempre que una sucesión cor
- Page 177 and 178:
8. Pulse r y después ~ para dibuja
- Page 179 and 180:
2. Pulse y . Í para seleccionar el
- Page 181 and 182:
Comparación de la TI-84 Plus con l
- Page 183 and 184:
Capítulo 7: Tablas Conceptos bási
- Page 185 and 186:
TblStart y @Tbl TblStart (inicio de
- Page 187 and 188:
3. Pulse Í. El cursor se desplaza
- Page 189 and 190:
Selección Características de la t
- Page 191 and 192:
Capítulo 8: Operaciones DRAW Conce
- Page 193 and 194:
Utilización del menú DRAW Menú D
- Page 195 and 196:
seleccionar una operación del men
- Page 197 and 198:
Line(X1,Y1,X2,Y2) Para borrar un se
- Page 199 and 200:
Dibujar rectas tangentes Directamen
- Page 201 and 202:
DrawF expresión Nota: No puede uti
- Page 203 and 204:
esolución =3 sombrea cada tres pí
- Page 205 and 206:
Circle(,Y,radius) Nota: Al utilizar
- Page 207 and 208:
Pantalla dividida En una pantalla d
- Page 209 and 210:
DRAW POINTS STO 3: Pt-Change( Cambi
- Page 211 and 212:
Pt-On(x,y[,marca]) Pt-Off(x,y[,marc
- Page 213 and 214:
Almacenar imágenes de gráficos Me
- Page 215 and 216:
Nota: También puede seleccionar un
- Page 217 and 218:
Recuperar bases de datos de gráfic
- Page 219 and 220:
Capítulo 9: Pantalla dividida Conc
- Page 221 and 222:
Uso de la pantalla dividida Cómo e
- Page 223 and 224:
Pantalla dividida Horiz (Horizontal
- Page 225 and 226:
La mitad izquierda muestra todos lo
- Page 227 and 228:
Píxeles de la TI-84 Plus en los mo
- Page 229 and 230:
Capítulo 9: Pantalla dividida 227
- Page 231 and 232:
4. Pulse 2 Í 3 Í 3 Í para comple
- Page 233 and 234:
El cursor pasará a la dimensión d
- Page 235 and 236:
Teclas del contexto de visualizaci
- Page 237 and 238:
Tecla Función y 6 Activa el cursor
- Page 239 and 240:
Los puntos suspensivos en la column
- Page 241 and 242:
matrizA+matrizB matrizANmatrizB Par
- Page 243 and 244:
Invertir Utilice la función L1 (œ
- Page 245 and 246:
iPart(matriz) fPart(matriz) int(mat
- Page 247 and 248:
matrizT Cómo acceder a las dimensi
- Page 249 and 250:
identity( identity( devuelve la mat
- Page 251 and 252:
List4matr( List4matr( (listas almac
- Page 253 and 254:
owSwap(matriz,filaA,filaB) row+( ro
- Page 255 and 256:
Capítulo 11: Listas Conceptos bás
- Page 257 and 258:
después la tecla pertinente. Las l
- Page 259 and 260:
• Utilizando llaves y ¿. • Uti
- Page 261 and 262:
Introducir nombres de listas Uso de
- Page 263 and 264:
Adjuntar fórmulas a nombres de lis
- Page 265 and 266:
1. Pulse ƒ [ã], introduzca la fó
- Page 267 and 268:
• Utilice y K para introducir el
- Page 269 and 270:
NAMES OPS MATH 8: Select( Seleccion
- Page 271 and 272:
longitud!dim(nombrelista) Uso de di
- Page 273 and 274:
cumSum(lista) @List( @List( devuelv
- Page 275 and 276:
3. Pulse Í. Se mostrará la pantal
- Page 277 and 278:
Nota: Las dos nuevas listas (nombre
- Page 279 and 280:
Matr4list(matriz, #columna,nombreli
- Page 281 and 282:
Nota: min( y max( son iguales que m
- Page 283 and 284:
stdDev(, variance( stdDev( devuelve
- Page 285 and 286:
Janson Publications, Inc., Dedham,
- Page 287 and 288: 8. Pulse Í para seleccionar On, co
- Page 289 and 290: 15. Pulse y 9 para acceder al menú
- Page 291 and 292: 21. Pulse q 9 para seleccionar 9:Zo
- Page 293 and 294: La nueva función y=.192x .522 pare
- Page 295 and 296: 31. Pulse £ 20 ¤ para introducir
- Page 297 and 298: Para acceder al editor de listas es
- Page 299 and 300: Para comenzar a introducir, desplaz
- Page 301 and 302: • En el editor de listas estadís
- Page 303 and 304: fórmula, su resultado debe ser una
- Page 305 and 306: TI-84 Plus tarda un poco más de ti
- Page 307 and 308: Cómo editar elementos de una lista
- Page 309 and 310: 6. Pulse ‘. Ahora estará en el c
- Page 311 and 312: Contexto de visualización de nombr
- Page 313 and 314: SortA(, SortD( SortA( (orden ascend
- Page 315 and 316: Si introduce un nombredelista que t
- Page 317 and 318: egresión se almacena automáticame
- Page 319 and 320: Nota: Para establecer DiagnosticOn
- Page 321 and 322: Para cada elemento del menú STAT C
- Page 323 and 324: LinReg (ax+b) LinReg (ax+b) (regres
- Page 325 and 326: ExpReg—(ab x ) ExpReg (regresión
- Page 327 and 328: Ejemplo de SinReg: Horas de luz sol
- Page 329 and 330: 2. Pulse las teclas de desplazamien
- Page 331 and 332: Variables número de datos n n XY m
- Page 333 and 334: Cálculos estadísticos Para efectu
- Page 335 and 336: xyLine xyLine (( ) es un gráfico d
- Page 337: Boxplot Boxplot (+)(diagrama de caj
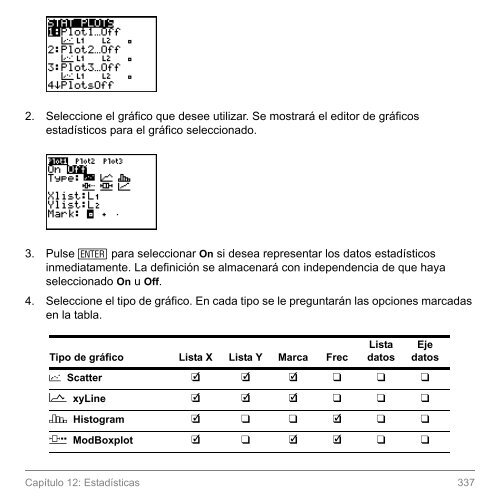
- Page 341 and 342: Cómo activar y desactivar gráfico
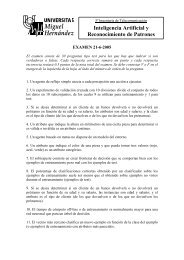
- Page 343 and 344: Cómo definir un gráfico estadíst
- Page 345 and 346: Cómo visualizar un gráfico estad
- Page 347 and 348: Estatura (en centímetros) de cada
- Page 349 and 350: media real de la población conside
- Page 351 and 352: Ahora represente gráficamente y so
- Page 353 and 354: 4. Seleccione la hipótesis alterna
- Page 355 and 356: Selección de la opción Pooled (Ag
- Page 357 and 358: La mayoría de las instrucciones ST
- Page 359 and 360: • Las descripciones de las instru
- Page 361 and 362: • H a : mm0) En el ejemplo: TEST=
- Page 363 and 364: LISTA={154 109 137 115 140} LISTB={
- Page 365 and 366: SAMP1={12.207 16.869 25.05 22.429 8
- Page 367 and 368: 2-PropZTest Resultados calculados:
- Page 369 and 370: ZInterval ZInterval (intervalo de c
- Page 371 and 372: 2-SampZInt 2-SampZInt (intervalo de
- Page 373 and 374: SAMP1={12.207 16.869 25.05 22.429 8
- Page 375 and 376: (x 1 y x 2 ) y el recuento de obser
- Page 377 and 378: Resultados gráficos: c 2 GOF-Test
- Page 379 and 380: • H a : s 1 s2) En el ejemplo: SA
- Page 381 and 382: En el ejemplo: L3={ L4={ 38 41 56 6
- Page 383 and 384: ANOVA( Resultados calculados: ANOVA
- Page 385 and 386: Descripciones de entradas para infe
- Page 387 and 388: Entrada Descripción n1 Recuento de
- Page 389 and 390:
Variables Pruebas Intervalos par de
- Page 391 and 392:
DISTR DRAW B: binomcdf( Densidad ac
- Page 393 and 394:
invNorm( invNorm( calcula la funci
- Page 395 and 396:
c 2 pdf( c 2 pdf( calcula la funci
- Page 397 and 398:
Üpdf(x,df del numerador,df del den
- Page 399 and 400:
poissonpdf( poissonpdf( calcula una
- Page 401 and 402:
Sombreado de distribución Menú DI
- Page 403 and 404:
Shadec 2 ( Shadec 2 ( traza la func
- Page 405 and 406:
Capítulo 14: Aplicaciones El menú
- Page 407 and 408:
Vd. ha visto un coche que le gustar
- Page 409 and 410:
2. Pulse Í para seleccionar 1:TVM
- Page 411 and 412:
2. Introduzca los valores conocidos
- Page 413 and 414:
Utilice estas funciones para prepar
- Page 415 and 416:
tvm_PV tvm_PV calcula el valor actu
- Page 417 and 418:
2000 2000 2000 4000 4000 AL0 = 2000
- Page 419 and 420:
al(npago[,valorredon]) GPrn(, GInt(
- Page 421 and 422:
5. Pulse o para visualizar el edito
- Page 423 and 424:
4Eff( 4Eff( calcula el tipo de inte
- Page 425 and 426:
En la línea PMT:END BEGIN del edit
- Page 427 and 428:
Cómo iniciar EasyData 1. Conecte e
- Page 429 and 430:
Inicio y parada de una captura de d
- Page 431 and 432:
Capítulo 15: CATALOG, cadenas, fun
- Page 433 and 434:
Cómo introducir y utilizar cadenas
- Page 435 and 436:
2. Pulse Í para mostrar el menú s
- Page 437 and 438:
Funciones e instrucciones de cadena
- Page 439 and 440:
expr( expr( convierte en una expres
- Page 441 and 442:
sub( sub( devuelve una cadena que e
- Page 443 and 444:
muestran entre los demás elementos
- Page 445 and 446:
Capítulo 16: Programación Concept
- Page 447 and 448:
8. Pulse Í para copiar prgmCYLINDE
- Page 449 and 450:
3. Seleccione 7:Prgm para ver el ed
- Page 451 and 452:
Introducir mandatos y ejecutar prog
- Page 453 and 454:
Editar programas Cómo editar un pr
- Page 455 and 456:
Cómo desplazarse en los menús PRG
- Page 457 and 458:
Cómo controlar el flujo de un prog
- Page 459 and 460:
:End :mandato Program Salida If-The
- Page 461 and 462:
:End :mandato Program Salida While
- Page 463 and 464:
:End :mandato Program Salida End En
- Page 465 and 466:
Goto etiqueta Program Salida IS>( I
- Page 467 and 468:
Menu("título","texto1",etiqueta1,"
- Page 469 and 470:
Por ejemplo, GraphStyle(1,5) en el
- Page 471 and 472:
Input Program Salida Cómo almacena
- Page 473 and 474:
Prompt variableA[,variableB,...,var
- Page 475 and 476:
Output( Output( muestra texto o val
- Page 477 and 478:
Diagrama de teclas de la TI-84 Plus
- Page 479 and 480:
nombre de lista, un elemento de mat
- Page 481 and 482:
Return sale de una subrutina y regr
- Page 483 and 484:
8. Pulse Í para compilar su progra
- Page 485 and 486:
4. Pulse Í para almacenar los valo
- Page 487 and 488:
Para ahorrarse pulsaciones, puede r
- Page 489 and 490:
4. Pulse y [ para omitir la instruc
- Page 491 and 492:
2. Pulse £ 20 ¹ 2 „ ¤£ 25 ¥
- Page 493 and 494:
2. Pulse y0. 3. Pulse † y } para
- Page 495 and 496:
Las variables de ventana estándar
- Page 497 and 498:
4. Pulse r. Se mostrará el cursor
- Page 499 and 500:
4. Pulse p para visualizar los nuev
- Page 501 and 502:
Comprobación de hipótesis Problem
- Page 503 and 504:
5. Pulse y ,. Seleccione 1:Plot1. A
- Page 505 and 506:
Representación gráfica de funcion
- Page 507 and 508:
Representación gráfica de inecuac
- Page 509 and 510:
Resolución de un sistema de ecuaci
- Page 511 and 512:
Uso de un programa para crear el tr
- Page 513 and 514:
Representación gráfica de puntos
- Page 515 and 516:
Uso de un programa para estimar los
- Page 517 and 518:
:If C=A and D=B :Stop :Goto Z Sale
- Page 519 and 520:
4. Introduzca las expresiones que d
- Page 521 and 522:
4. Pulse y 5 para ir a la pantalla
- Page 523 and 524:
Procedimiento 1. Pulse z. Seleccion
- Page 525 and 526:
8. Puede utilizar r para tomar inst
- Page 527 and 528:
4. Pulse r. Pulse |, }, ~ y † par
- Page 529 and 530:
5. Pulse r. Observe que, aunque los
- Page 531 and 532:
3. Introduzca N=4 y B=6 para calcul
- Page 533 and 534:
Y2=pB 2 (el área del círculo) es
- Page 535 and 536:
vez pagado al completo. Introduzca
- Page 537 and 538:
9. El gráfico muestra que para el
- Page 539 and 540:
RAM disponible, Archive disponible
- Page 541 and 542:
1. Pulse y L para mostrar el menú
- Page 543 and 544:
4. Pulse } y † para desplazar el
- Page 545 and 546:
Archivar y desarchivar variables Ar
- Page 547 and 548:
Tipo de variable Nombres Grupos vea
- Page 549 and 550:
Nota: Aparecerá un asterisco a la
- Page 551 and 552:
Reconfiguración de TI-84 Plus Men
- Page 553 and 554:
1. En el menú RAM ARCHIVE ALL, sel
- Page 555 and 556:
3. Lea el mensaje que aparece bajo
- Page 557 and 558:
Agrupar y desagrupar variables Agru
- Page 559 and 560:
6. Pulse } y † para mover el curs
- Page 561 and 562:
Notas sobre elementos de menú: •
- Page 563 and 564:
Limpieza de la memoria (Garbage Col
- Page 565 and 566:
cuenta con espacio suficiente, la v
- Page 567 and 568:
El proceso de limpieza de la memori
- Page 569 and 570:
Si aparece un mensaje ERR:ARCHIVE F
- Page 571 and 572:
4. En la unidad emisora, pulse 2 pa
- Page 573 and 574:
Conexión con la TI-84 Plus En este
- Page 575 and 576:
Conexión de TI-84 Plus a una TI-83
- Page 577 and 578:
SEND RECEIVE D: AppVars... Envía l
- Page 579 and 580:
3. Pulse Í para seleccionar 1:Tran
- Page 581 and 582:
deselecciona algún elemento, se bo
- Page 583 and 584:
Recepción de elementos Menú LINK
- Page 585 and 586:
Recepción desde una TI-84 Plus Sil
- Page 587 and 588:
6. Pulse Í en la unidad receptora
- Page 589 and 590:
• Se ha intentado utilizar Get( c
- Page 591 and 592:
Función o instrucción/ Argumentos
- Page 593 and 594:
Función o instrucción/ Argumentos
- Page 595 and 596:
Función o instrucción/ Argumentos
- Page 597 and 598:
Función o instrucción/ Argumentos
- Page 599 and 600:
Función o instrucción/ Argumentos
- Page 601 and 602:
Función o instrucción/ Argumentos
- Page 603 and 604:
Función o instrucción/ Argumentos
- Page 605 and 606:
Función o instrucción/ Argumentos
- Page 607 and 608:
Función o instrucción/ Argumentos
- Page 609 and 610:
Función o instrucción/ Argumentos
- Page 611 and 612:
Función o instrucción/ Argumentos
- Page 613 and 614:
Función o instrucción/ Argumentos
- Page 615 and 616:
Función o instrucción/ Argumentos
- Page 617 and 618:
Función o instrucción/ Argumentos
- Page 619 and 620:
Función o instrucción/ Argumentos
- Page 621 and 622:
Función o instrucción/ Argumentos
- Page 623 and 624:
Función o instrucción/ Argumentos
- Page 625 and 626:
Función o instrucción/ Argumentos
- Page 627 and 628:
Función o instrucción/ Argumentos
- Page 629 and 630:
Función o instrucción/ Argumentos
- Page 631 and 632:
Función o instrucción/ Argumentos
- Page 633 and 634:
Función o instrucción/ Argumentos
- Page 635 and 636:
Función o instrucción/ Argumentos
- Page 637 and 638:
Función o instrucción/ Argumentos
- Page 639 and 640:
Función o instrucción/ Argumentos
- Page 641 and 642:
Función o instrucción/ Argumentos
- Page 643 and 644:
Función o instrucción/ Argumentos
- Page 645 and 646:
Función o instrucción/ Argumentos
- Page 647 and 648:
Función o instrucción/ Argumentos
- Page 649 and 650:
Función o instrucción/ Argumentos
- Page 651 and 652:
Función o instrucción/ Argumentos
- Page 653 and 654:
Función o instrucción/ Argumentos
- Page 655 and 656:
Función o instrucción/ Argumentos
- Page 657 and 658:
Función o instrucción/ Argumentos
- Page 659 and 660:
Apéndice B: Información general V
- Page 661 and 662:
Fórmulas estadísticas Esta secci
- Page 663 and 664:
Los mínimos cuadrados (MS) que com
- Page 665 and 666:
2-SampÜTest para la hipótesis alt
- Page 667 and 668:
Fórmulas financieras Esta sección
- Page 669 and 670:
donde: i = 0 PMT donde: i ƒ 0 dond
- Page 671 and 672:
Activo líquido donde: npv( ) CF0 C
- Page 673 and 674:
+ ( Y1 - YB) ----------------------
- Page 675 and 676:
Si utiliza funciones trigonomética
- Page 677 and 678:
Copias de seguridad El dispositivo
- Page 679 and 680:
Tipo de error Causas posibles y sol
- Page 681 and 682:
Tipo de error Causas posibles y sol
- Page 683 and 684:
Tipo de error Causas posibles y sol
- Page 685 and 686:
Tipo de error Causas posibles y sol
- Page 687 and 688:
Tipo de error Causas posibles y sol
- Page 689 and 690:
Tipo de error Causas posibles y sol
- Page 691 and 692:
Precisión de la información Preci
- Page 693 and 694:
Límites de funciones Función Rang
- Page 695 and 696:
Apéndice C: Información sobre ser
- Page 697 and 698:
La aparición del mensaje B signifi
- Page 699 and 700:
4. Vuelva a colocar la tapa del com
- Page 701 and 702:
• Pulse y L 2 para ver el menú M
- Page 703 and 704:
Índice alfabético Símbolos ( !di
- Page 705 and 706:
fórmula 669 irr( (tasa de rentabil
- Page 707 and 708:
complejos modos (a+bi, re^qi) 25, 7
- Page 709 and 710:
Fcdf( 395, 600 Fpdf( 602 geometcdf(
- Page 711 and 712:
horas de luz solar en Alaska 325 mo
- Page 713 and 714:
encuadre 121 estilos de gráfico 10
- Page 715 and 716:
numÈrica 136 numérica 64 intersec
- Page 717 and 718:
copia de seguridad 584 error 564 in
- Page 719 and 720:
pantalla completa (Full) modo 25, 6
- Page 721 and 722:
editar 451 ejecutar 450 insertar l
- Page 723 and 724:
Repeat 460, 628 representación gr
- Page 725 and 726:
tan/( (arcotangente) 56, 639 Tangen
- Page 727 and 728:
Zoom 40 ventana de visualización 1