Perfiles de - Prisma
Perfiles de - Prisma
Perfiles de - Prisma

You also want an ePaper? Increase the reach of your titles
YUMPU automatically turns print PDFs into web optimized ePapers that Google loves.
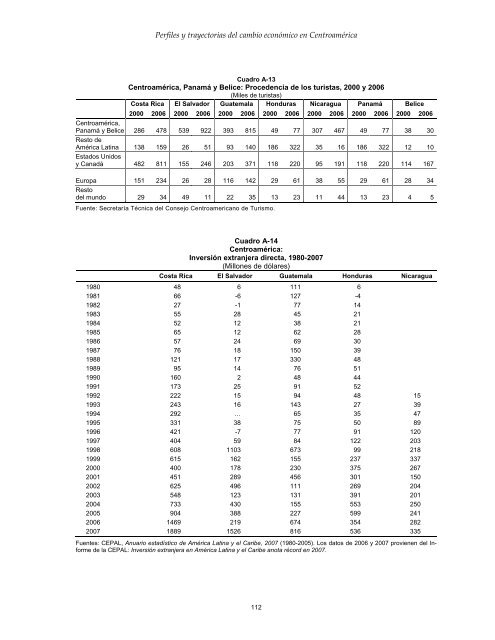
<strong>Perfiles</strong> y trayectorias <strong>de</strong>l cambio económico en Centroamérica<br />
Cuadro A-13<br />
Centroamérica, Panamá y Belice: Proce<strong>de</strong>ncia <strong>de</strong> los turistas, 2000 y 2006<br />
(Miles <strong>de</strong> turistas)<br />
Costa Rica El Salvador Guatemala Honduras Nicaragua Panamá Belice<br />
2000 2006 2000 2006 2000 2006 2000 2006 2000 2006 2000 2006 2000 2006<br />
Centroamérica,<br />
Panamá y Belice 286 478 539 922 393 815 49 77 307 467 49 77 38 30<br />
Resto <strong>de</strong><br />
América Latina 138 159 26 51 93 140 186 322 35 16 186 322 12 10<br />
Estados Unidos<br />
y Canadá 482 811 155 246 203 371 118 220 95 191 118 220 114 167<br />
Europa<br />
Resto<br />
151 234 26 28 116 142 29 61 38 55 29 61 28 34<br />
<strong>de</strong>l mundo 29 34 49 11 22 35 13 23 11 44 13 23 4 5<br />
Fuente: Secretaría Técnica <strong>de</strong>l Consejo Centroamericano <strong>de</strong> Turismo.<br />
Cuadro A-14<br />
Centroamérica:<br />
Inversión extranjera directa, 1980-2007<br />
(Millones <strong>de</strong> dólares)<br />
Costa Rica El Salvador Guatemala Honduras Nicaragua<br />
1980 48 6 111 6<br />
1981 66 -6 127 -4<br />
1982 27 -1 77 14<br />
1983 55 28 45 21<br />
1984 52 12 38 21<br />
1985 65 12 62 28<br />
1986 57 24 69 30<br />
1987 76 18 150 39<br />
1988 121 17 330 48<br />
1989 95 14 76 51<br />
1990 160 2 48 44<br />
1991 173 25 91 52<br />
1992 222 15 94 48 15<br />
1993 243 16 143 27 39<br />
1994 292 … 65 35 47<br />
1995 331 38 75 50 89<br />
1996 421 -7 77 91 120<br />
1997 404 59 84 122 203<br />
1998 608 1103 673 99 218<br />
1999 615 162 155 237 337<br />
2000 400 178 230 375 267<br />
2001 451 289 456 301 150<br />
2002 625 496 111 269 204<br />
2003 548 123 131 391 201<br />
2004 733 430 155 553 250<br />
2005 904 388 227 599 241<br />
2006 1469 219 674 354 282<br />
2007 1889 1526 816 536 335<br />
Fuentes: CEPAL, Anuario estadístico <strong>de</strong> América Latina y el Caribe, 2007 (1980-2005). Los datos <strong>de</strong> 2006 y 2007 provienen <strong>de</strong>l Informe<br />
<strong>de</strong> la CEPAL: Inversión extranjera en América Latina y el Caribe anota récord en 2007.<br />
112