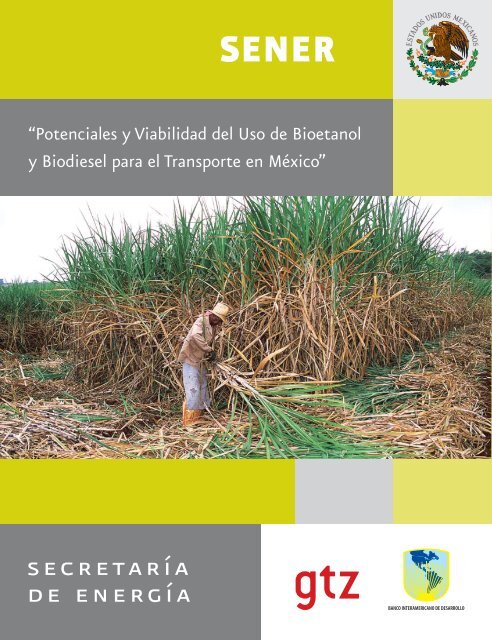
Potenciales y Viabilidad del Uso de Bioetanol y Biodiesel para el ...
Potenciales y Viabilidad del Uso de Bioetanol y Biodiesel para el ...
Potenciales y Viabilidad del Uso de Bioetanol y Biodiesel para el ...

You also want an ePaper? Increase the reach of your titles
YUMPU automatically turns print PDFs into web optimized ePapers that Google loves.
“<strong>Potenciales</strong> y <strong>Viabilidad</strong> <strong><strong>de</strong>l</strong> <strong>Uso</strong> <strong>de</strong> <strong>Bioetanol</strong><br />
y <strong>Biodies<strong>el</strong></strong> <strong>para</strong> <strong>el</strong> Transporte en México”
<strong>Potenciales</strong> y <strong>Viabilidad</strong> <strong><strong>de</strong>l</strong> <strong>Uso</strong> <strong>de</strong><br />
<strong>Bioetanol</strong> y <strong>Biodies<strong>el</strong></strong> <strong>para</strong> <strong>el</strong> Transporte en México<br />
(Proyectos ME-T1007 – ATN/DO-9375-ME y<br />
PN 04.2148.7-001.00)<br />
Noviembre 2006
Noviembre 2006<br />
Realizado por:<br />
Omar Masera Cerutti (Coordinador <strong>de</strong> los Consultores), Nicolás Rodríguez Martínez (Etanol y <strong>Biodies<strong>el</strong></strong>),<br />
Ignacio Lazcano Martínez (Etanol y <strong>Biodies<strong>el</strong></strong>), Luiz Augusto Horta Nogueira (Etanol), Isaias C. Macedo<br />
(Etanol), Sergio C. Trinda<strong>de</strong> (Etanol y Coordinador <strong>de</strong> los Consultores Internacionales <strong>de</strong> Etanol), Dani<strong>el</strong>a Thrän<br />
(<strong>Biodies<strong>el</strong></strong>), Oliver Probst (<strong>Biodies<strong>el</strong></strong>), Micha<strong>el</strong> Weber (<strong>Biodies<strong>el</strong></strong>), Franziska Müller-Langer (<strong>Biodies<strong>el</strong></strong>)<br />
Solicitado por:<br />
Secretaría <strong>de</strong> Energía (SENER), Subsecretaría <strong>de</strong> Planeación Energético y Desarrollo Tecnológico, Dirección<br />
General <strong>de</strong> Investigación, Desarrollo Tecnológico y Medio Ambiente<br />
Financiado por:<br />
Banco Interamericano <strong>de</strong> Desarrollo (BID), ME-T1007 – ATN/DO-9375-ME, y Deutsche Ges<strong>el</strong>lschaft für<br />
Technische Zusammenarbeit (GTZ) GmbH – Cooperación técnica alemana, PN 04.2148.7-001.00<br />
Sener/ BID/ GTZ (Edit.): <strong>Potenciales</strong> y <strong>Viabilidad</strong> <strong><strong>de</strong>l</strong> <strong>Uso</strong> <strong>de</strong> <strong>Bioetanol</strong> y <strong>Biodies<strong>el</strong></strong> <strong>para</strong> <strong>el</strong> Transporte en<br />
México, México, D.F., México, Noviembre 2006<br />
ISBN 970-9983-14-8<br />
Este documento ha sido pre<strong>para</strong>do a solicitud <strong>de</strong> la Secretaría <strong>de</strong> Energía (Sener), por encargo y financiado por <strong>el</strong><br />
Banco Interamericano <strong>de</strong> Desarrollo (BID) y <strong>de</strong> la Deutsche Ges<strong>el</strong>lschaft für Technische Zusammenarbeit (GTZ)<br />
GmbH (cooperación técnica alemana), y fue <strong>el</strong>aborado por consultores externos. Las opiniones expresadas en<br />
este documento son <strong>de</strong> exclusiva responsabilidad <strong>de</strong> los autores y no necesariamente representan la opinión <strong>de</strong><br />
Sener, BID y GTZ. Se autoriza la reproducción parcial o total, siempre y cuando se cite la fuente <strong>de</strong> referencia.<br />
SENER- Secretaría <strong>de</strong> Energía<br />
Dirección General <strong>de</strong><br />
Investigación, Desarrollo<br />
Tecnológico y Medio Ambiente<br />
Av. Insurgentes Sur 890, 3° piso<br />
Col. D<strong>el</strong> Valle 03100<br />
México, D.F.<br />
T<strong>el</strong>. +52-55-5000 6000 ext. 1023<br />
Fax. +52-55-5000 6223<br />
www.energia.gob.mx<br />
Inter-American Dev<strong>el</strong>opment<br />
Bank<br />
Av. Horacio 1855, piso 6<br />
Los Morales-Polanco<br />
11510 México, D.F.<br />
T<strong>el</strong>: + 52-55-91386200<br />
www.iadb.org<br />
Deutsche Ges<strong>el</strong>lschaft für<br />
Technische Zusammenarbeit<br />
(GTZ) GmbH<br />
Cooperación técnica alemana<br />
Promoción <strong>de</strong> Energías Renovables<br />
Dr. Bernhard Boesl<br />
Lic. André Eckermann<br />
Edificio Secretaría <strong>de</strong> Energía<br />
Insurgentes Sur 890, 9° piso<br />
Colonia D<strong>el</strong> Valle<br />
03100 México, D.F., México<br />
T<strong>el</strong>. +52-55-5000 6000 ext. 1088<br />
Fax. +52-55-5000 6000 ext. 2160<br />
E-mail: bernhard.boesl@gtz.<strong>de</strong>,<br />
andre.eckermann@gtz.<strong>de</strong><br />
www.gtz.<strong>de</strong>/mexico<br />
ii
In<strong>de</strong>x<br />
1 Executive Summary<br />
1.1 Introduction<br />
1.2 Bioethanol<br />
1.3 <strong>Biodies<strong>el</strong></strong><br />
2 Background<br />
Task 1: Economic overview<br />
Task 2 & Task A: Mexico’s energy picture with regard to bioethanol and biodies<strong>el</strong><br />
Task 3: Overview of agricultural aspects<br />
3 Bioethanol in Mexico<br />
Task 4: Ethanol feedstocks<br />
Task 5: Ethanol and ETBE production and end-use in Mexico<br />
Task 6: Potentials in r<strong>el</strong>ation to sustainability criteria<br />
Task 7: Rationales, drivers and barriers for fu<strong>el</strong> ethanol and ETBE market<br />
introduction<br />
Task 8: Synthesis and recommendations<br />
4 <strong>Biodies<strong>el</strong></strong> in Mexico<br />
Task B: Agricultural aspects and sources for biodies<strong>el</strong> production<br />
Task C: <strong>Biodies<strong>el</strong></strong> production and end-use in Mexico: current and future (Scenario<br />
Building)<br />
Task D: Potentials in r<strong>el</strong>ation to sustainability criteria<br />
Task E: Rationales, drivers and barriers for biodies<strong>el</strong> market introduction<br />
Task F: Synthesis and recommendations<br />
5 Advisory Board Sessions<br />
iii
1 Executive Summary
<strong>Potenciales</strong> y <strong>Viabilidad</strong> <strong><strong>de</strong>l</strong> <strong>Uso</strong> <strong>de</strong> <strong>Bioetanol</strong> y <strong>Biodies<strong>el</strong></strong> <strong>para</strong> <strong>el</strong> Transporte en México (SENER-BID-GTZ)<br />
Executive Summary<br />
1.1 Introduction<br />
Este reporte contiene un estudio exhaustivo sobre las posibilida<strong>de</strong>s <strong><strong>de</strong>l</strong> bioetanol y <strong>el</strong> biodies<strong>el</strong><br />
como combustibles <strong>para</strong> <strong>el</strong> transporte en México. El estudio fue coordinado por la Secretaría<br />
<strong>de</strong> Energía <strong>de</strong> México (SENER) y patrocinado por <strong>el</strong> Banco Interamericano <strong>de</strong> Desarrollo<br />
(Proyecto ME-T1007 – ATN/DO-9375-ME) y la GTZ (Cooperación Técnica Alemana)<br />
(Proyecto PN 04.2148.7-001.00) por encargo <strong><strong>de</strong>l</strong> Ministerio <strong>de</strong> Cooperación Económica y<br />
Desarrollo (BMZ). Para la realización <strong>de</strong> las diferentes activida<strong>de</strong>s <strong>de</strong> este estudio se contrató<br />
un grupo <strong>de</strong> consultores mexicanos e internacionales. 1<br />
El grupo <strong>de</strong> consultores técnicos trabajó en estrecho contacto con un Comité Consultivo<br />
constituido <strong>para</strong> este estudio. Dicho Comité estuvo formado por representantes <strong>de</strong> distintos<br />
sectores económicos y sociales r<strong>el</strong>acionados con los biocombustibles (campesinos cañeros y<br />
<strong>de</strong> otro tipo, industria automotriz, Cámara Nacional <strong>de</strong> la Industria Azucarera y Alcoholera-<br />
CNIAA, Cámara Nacional <strong>de</strong> la Industria <strong>de</strong> Transformación-CANACINTRA, Petróleos<br />
Mexicanos-PEMEX, Secretaría <strong>de</strong> Medioambiente y Recursos Naturales-SEMARNAT,<br />
Secretaría <strong>de</strong> Economía, Secretaría <strong>de</strong> Energía-SENER, Secretaría <strong>de</strong> Agricultura, Gana<strong>de</strong>ría,<br />
Desarrollo Rural, Pesca y Alimentación-SAGARPA, Fi<strong>de</strong>icomisos Instituidos en R<strong>el</strong>ación con<br />
la Agricultura en <strong>el</strong> Banco <strong>de</strong> México-FIRA, Red Mexicana <strong>de</strong> Bioenergía-REMBIO, Comité<br />
Nacional Sistema Producto Oleaginosas, Universida<strong>de</strong>s y otros). Durante <strong>el</strong> estudio se<br />
tuvieron tres reuniones <strong>de</strong> trabajo que permitieron orientar y retroalimentar <strong>el</strong> trabajo <strong>de</strong> los<br />
consultores <strong>para</strong> a<strong>de</strong>cuarlo a las priorida<strong>de</strong>s y características <strong>de</strong> México.<br />
A continuación se presentan los principales resultados <strong><strong>de</strong>l</strong> estudio <strong>para</strong> cada uno <strong>de</strong> los<br />
combustibles analizados: bioetanol y biodies<strong>el</strong>. Aunque existen aspectos comunes a estos<br />
combustibles, la problemática y las opciones tecnológicas y <strong>de</strong> política son muy específicas a<br />
cada uno <strong>de</strong> <strong>el</strong>los, lo que amerita un análisis individual. Los informes <strong>de</strong>tallados <strong>de</strong> cada una<br />
<strong>de</strong> estas activida<strong>de</strong>s tanto <strong>para</strong> etanol como <strong>para</strong> biodies<strong>el</strong> se encuentran en <strong>el</strong> documento final<br />
<strong><strong>de</strong>l</strong> proyecto (“Reporte final”).<br />
1.2 Bioethanol<br />
Existe una oportunidad importante <strong>para</strong> que México emprenda la producción <strong>de</strong> etanol a gran<br />
escala, si bien <strong>de</strong>ben superarse varios retos que se analizan con <strong>de</strong>talle en <strong>el</strong> informe.<br />
Para la conversión a etanol fueron consi<strong>de</strong>rados como insumos: caña <strong>de</strong> azúcar, maíz, yuca,<br />
sorgo y remolacha azucarera, con las tecnologías maduras existentes y, en <strong>el</strong> caso <strong>de</strong> la caña<br />
<strong>de</strong> azúcar, se analizó la producción <strong>de</strong> etanol a partir <strong><strong>de</strong>l</strong> bagazo, cuya tecnología se encuentra<br />
en <strong>de</strong>sarollo. Con base en criterios <strong>de</strong> s<strong>el</strong>ección como: disponibilidad <strong>de</strong> una tecnología<br />
1 Omar Masera Cerutti (Coordinador <strong>de</strong> los Consultores, omasera@oikos.unam.mx), Nicolás Rodríguez Martínez (Etanol y<br />
<strong>Biodies<strong>el</strong></strong>, nrmartin@www.imp.mx), Ignacio Lazcano Martínez (Etanol y <strong>Biodies<strong>el</strong></strong>, ilazcano29@yahoo.com.mx), Luiz<br />
Augusto Horta Nogueira (Etanol, horta@unifei.edu.br), Isaias C. Macedo (Etanol, isaiasmacedo22@terra.com.br), Sergio<br />
C. Trinda<strong>de</strong> (Etanol y Coordinador <strong>de</strong> los Consultores Internacionales <strong>de</strong> Etanol, strinda<strong>de</strong>@msn.com), Dani<strong>el</strong>a Thrän<br />
(<strong>Biodies<strong>el</strong></strong>, Dani<strong>el</strong>a.Thraen@ie-leipzig.<strong>de</strong>), Oliver Probst (<strong>Biodies<strong>el</strong></strong>, oprobst@itesm.mx), Micha<strong>el</strong> Weber (<strong>Biodies<strong>el</strong></strong>,<br />
Micha<strong>el</strong>.Weber@ie-leipzig.<strong>de</strong>), Franziska Müller-Langer (<strong>Biodies<strong>el</strong></strong>, Franziska.Mu<strong>el</strong>ler-Langer@ie-leipzig.<strong>de</strong>)<br />
2
<strong>Potenciales</strong> y <strong>Viabilidad</strong> <strong><strong>de</strong>l</strong> <strong>Uso</strong> <strong>de</strong> <strong>Bioetanol</strong> y <strong>Biodies<strong>el</strong></strong> <strong>para</strong> <strong>el</strong> Transporte en México (SENER-BID-GTZ)<br />
Executive Summary<br />
madura, costos, necesida<strong>de</strong>s <strong>de</strong> inversión, superficie requerida, índice <strong>de</strong> energía neta y<br />
emisiones y mitigación <strong>de</strong> gases <strong>de</strong> efecto inverna<strong>de</strong>ro se s<strong>el</strong>eccionó a la caña <strong>de</strong> azúcar como<br />
<strong>el</strong> cultivo más promisorio <strong>de</strong> immediato, que pue<strong>de</strong> ser complementada por otros cultivos a<br />
mediano y largo plazo.<br />
El análisis económico mostró que con los insumos valorados a precio <strong>de</strong> costo actuales y tres<br />
precios <strong>de</strong> venta <strong>de</strong> etanol, representativos <strong><strong>de</strong>l</strong> mercado reciente <strong>de</strong> etanol combustible, todos<br />
en US$/m3: 450, 550 y 650. Consi<strong>de</strong>rando <strong>el</strong> precio <strong>de</strong> etanol en US$ 0.45 <strong>el</strong> resultado<br />
económico neto seria negativo <strong>para</strong> todos los casos / consi<strong>de</strong>rando precios <strong>de</strong> etanol <strong>de</strong> US$<br />
0.55 a US$ 0.65 <strong>el</strong> resultado seria positivo <strong>para</strong> caña <strong>de</strong> azúcar y maíz./ l. El costo <strong>de</strong> la<br />
materia prima es <strong>el</strong> <strong>el</strong>emento más importante <strong>de</strong> los costos <strong>de</strong> producción. De acuerdo con los<br />
datos <strong><strong>de</strong>l</strong> Annual Energy Outlook 2006 <strong>de</strong> la agencia <strong>de</strong> la información <strong>de</strong> la energía, <strong>el</strong> precio<br />
<strong>de</strong> mercado <strong>de</strong> etanol es <strong>de</strong> US$ 1.17 por litro <strong>para</strong> <strong>el</strong> 2006. Actualmente la fabricación <strong>de</strong><br />
etanol en México <strong>para</strong> combustibles es marginal. Sería posible, <strong>de</strong>ntro <strong>de</strong> ciertos límites, tener<br />
un programa <strong>de</strong> etanol combustible exitoso en México. Para eso, sería necesário una<br />
disminuición <strong><strong>de</strong>l</strong> costo <strong>de</strong> materia prima con <strong>el</strong> aumento <strong>de</strong> la escala productiva y precios <strong>de</strong><br />
etanol en la franja superior <strong><strong>de</strong>l</strong> rango mencionado. El precio <strong><strong>de</strong>l</strong> etanol combustible tien<strong>de</strong> a<br />
vincularse al precio <strong>de</strong> gasolina, cuya ten<strong>de</strong>ncia futura es creciente, augurando así una<br />
expectativa positiva <strong>de</strong> viabilidad.<br />
Basado en la experiencia internacional, un programa <strong>de</strong> etanol como combustible pue<strong>de</strong> ser<br />
i<strong>de</strong>ado como parte <strong>de</strong> una transición hacia sistemas <strong>de</strong> transporte sustentables. No se espera<br />
que <strong>el</strong> combustible etanol <strong>de</strong>splace completamente a la gasolina <strong><strong>de</strong>l</strong> mercado en ningún<br />
momento. Por <strong>el</strong> contrario, <strong>el</strong> etanol pue<strong>de</strong> alargar los recursos petrolíferos logrando una<br />
mo<strong>de</strong>rada cuota <strong>de</strong> mercado y ahorrando gasolina <strong>para</strong> <strong>el</strong> futuro. En este estudio se<br />
recomienda un programa <strong>de</strong> introducción gradual <strong><strong>de</strong>l</strong> etanol con tres fases o escenarios. En la<br />
primera fase (2007-2012) se tendría como meta producir 411.9 miles <strong>de</strong> m3 <strong>de</strong> etanol <strong>el</strong> cual<br />
se obtendría principalmente <strong>de</strong> mi<strong>el</strong>es <strong>de</strong> caña <strong>de</strong> azúcar y se dirigiría a reemplazar al metanol<br />
en los éteres producidos en <strong>el</strong> mercado nacional (MTBE y TAME) <strong>para</strong> fabricar ETBE. El<br />
etanol como componente <strong><strong>de</strong>l</strong> ETBE fabricado en México correspon<strong>de</strong>ría a una penetración <strong><strong>de</strong>l</strong><br />
5.7% en volumen <strong>de</strong> un porcentaje <strong>de</strong> las gasolinas suministradas a las Zonas Metropolitanas.<br />
Para 2012, y sobre la base <strong>de</strong> etanol <strong>de</strong> jugo <strong>de</strong> caña <strong>de</strong> azúcar <strong>de</strong> cultivo <strong>de</strong> temporal en<br />
pastizales y tierras marginales, así como en proyectos <strong>de</strong> etanol que podrían <strong>de</strong>sarrollarse a<br />
partir <strong>de</strong> otros insumos, podría tener lugar la sustitución <strong><strong>de</strong>l</strong> 5.7% <strong>de</strong> todas las gasolinas <strong>de</strong> las<br />
áreas metropolitanas, correspondiendo a una <strong>de</strong>manda <strong>de</strong> 1,110.6 miles <strong>de</strong> m3. De 2012 en<br />
a<strong><strong>de</strong>l</strong>ante, y sobre la base <strong>de</strong> caña <strong>de</strong> azúcar y otros posibles insumos, como <strong>el</strong> cultivo múltiple<br />
anual sorgo dulce o maíz, <strong>el</strong> 10% <strong>de</strong> todas las gasolinas en México podría ser reemplazado por<br />
etanol, correspondiendo a una producción <strong>de</strong> 4,406.3 miles <strong>de</strong> m3. En todos estos <strong>de</strong>sarrollos<br />
podría haber oportunida<strong>de</strong>s <strong>para</strong> la exportación e importación <strong>de</strong> etanol, directamente o como<br />
ETBE.<br />
Suponiendo que <strong>el</strong> jugo <strong>de</strong> caña <strong>de</strong> azúcar sea <strong>el</strong> insumo dominante, alcanzando una mezcla <strong>de</strong><br />
etanol en todo México <strong><strong>de</strong>l</strong> 10%, <strong>el</strong> número actual <strong>de</strong> empleos en la industria se doblaría y se<br />
crearían unos 400 mil nuevos puestos <strong>de</strong> trabajo. El área necesaria alcanzaría alre<strong>de</strong>dor <strong>de</strong> 800<br />
mil hectáreas, más <strong><strong>de</strong>l</strong> doble <strong>de</strong> la superficie <strong>de</strong> cultivo actual <strong>de</strong> caña <strong>de</strong> azúcar en México.<br />
Los requerimientos <strong>de</strong> tierra podrían cumplirse aparentemente sin comprometer la producción<br />
<strong>de</strong> alimentos. Para lograr estas metas se requeriría una inversión <strong>de</strong> alre<strong>de</strong>dor <strong>de</strong> US$ 160<br />
millones en los próximos años y a más largo plazo una inversión en 45 <strong>de</strong>stilerías<br />
3
<strong>Potenciales</strong> y <strong>Viabilidad</strong> <strong><strong>de</strong>l</strong> <strong>Uso</strong> <strong>de</strong> <strong>Bioetanol</strong> y <strong>Biodies<strong>el</strong></strong> <strong>para</strong> <strong>el</strong> Transporte en México (SENER-BID-GTZ)<br />
Executive Summary<br />
in<strong>de</strong>pendientes <strong>de</strong> jugo <strong>de</strong> caña supondría US$ 2.25 miles <strong>de</strong> millones distribuidos a lo largo<br />
<strong>de</strong> varios años y más allá <strong>de</strong> 2012.<br />
México se beneficiaría <strong>de</strong> la introducción <strong><strong>de</strong>l</strong> etanol como combustible <strong>de</strong> muchas formas:<br />
creación <strong>de</strong> empleo, <strong>de</strong>sarrollo <strong>de</strong> la economía rural, ampliación <strong>de</strong> las infraestructuras<br />
sociales en zonas rurales, mejora <strong>de</strong> la seguridad energética, conservación <strong>de</strong> los recursos<br />
petrolíferos, mejor gestión <strong><strong>de</strong>l</strong> agua, expansión <strong>de</strong> la agricultura a tierras más secas<br />
cosechando cultivos resilientes, como cultivos anuales múltiples como <strong>el</strong> sorgo dulce, ahorro<br />
en los intercambios exteriores, motivación <strong>de</strong> la comunidad científica y tecnológica,<br />
incentivos a la industria <strong>de</strong> bienes <strong>de</strong> producción, mejora <strong><strong>de</strong>l</strong> medio ambiente local y global.<br />
El equipamiento <strong>para</strong> la fabricación <strong>de</strong> etanol y la generación combinada <strong>de</strong> calor y<br />
<strong>el</strong>ectricidad, en <strong>el</strong> caso <strong><strong>de</strong>l</strong> bagazo <strong>de</strong> caña, podrían tener un índice <strong>de</strong> nacionalización <strong>de</strong> casi<br />
<strong>el</strong> 100% en México, creando empleos <strong>de</strong> calidad y fortaleciendo la industria.<br />
La reducción <strong>de</strong> las importaciones <strong>de</strong> gasolina y MTBE <strong>para</strong> <strong>el</strong> escenario en que todas las<br />
gasolinas en México fueran mezclas <strong><strong>de</strong>l</strong> 10% <strong>de</strong> etanol supondría un ahorro en la balanza <strong>de</strong><br />
pagos <strong>de</strong> hasta US$ 2.0 mil millones. La venta <strong>de</strong> bonos <strong>de</strong> carbono a través <strong>de</strong> proyectos<br />
MDL podría potencialmente añadirse a este beneficio. Para <strong>el</strong> escenario <strong>de</strong> mayor penetración<br />
<strong>de</strong> etanol se espera una mitigación <strong>de</strong> 10.6 millones t CO2 eq/año con base en una producción<br />
a partir <strong>de</strong> caña <strong>de</strong> azúcar.<br />
El éxito en <strong>el</strong> lanzamiento <strong><strong>de</strong>l</strong> programa <strong>de</strong> etanol <strong>de</strong>pen<strong>de</strong>rá en gran medida <strong>de</strong> un programa<br />
<strong>de</strong> inspección y mantenimiento <strong>de</strong> las estaciones <strong>de</strong> venta o gasolineras diseñado<br />
cuidadosamente e implementado <strong>de</strong> manera experta, en especial los tanques subterráneos <strong>de</strong><br />
almacenamiento, y <strong>de</strong> los vehículos, en particular aquéllos fabricados antes <strong>de</strong> 1986. PEMEX<br />
y la industria automotriz mexicana tendrían un pap<strong>el</strong> importante que jugar aquí.<br />
La estructura <strong>de</strong> la producción <strong>de</strong> etanol en México en <strong>el</strong> futuro podría tener diferentes vías.<br />
Posiblemente coexistirán dos sistemas. Uno sería similar a la situación actual, esto es: un gran<br />
número <strong>de</strong> propietarios <strong>de</strong> tierra, superficies pequeñas, algunas organizadas en cooperativas.<br />
El otro sistema se basaría en participaciones mucho mayores. Estructuras apropiadas (<strong>para</strong><br />
ambos sistemas) conllevarán diferencias en la creación <strong>de</strong> empleos. Si se da prioridad a la<br />
expansión a gran escala <strong>de</strong> la caña en pastizales y tierras marginales, tendrá lugar un <strong>de</strong>sarrollo<br />
regional en nuevas zonas, creando empleos y promoviendo infraestructuras sociales don<strong>de</strong><br />
antes apenas existían.<br />
La revisión creativa <strong><strong>de</strong>l</strong> pacto social existente entre productores <strong>de</strong> caña e ingenios podría<br />
ofrecer una oportunidad a mantener por los beneficiarios actuales y <strong>para</strong> ampliar los beneficios<br />
sociales <strong>de</strong> los trabajadores rurales que no los disfrutan en <strong>el</strong> presente. Es una tarea que<br />
requiere ingenio y creatividad, pero a no ser que haya avances en esta área, <strong>el</strong> costo <strong><strong>de</strong>l</strong> etanol<br />
en México podría ser <strong>de</strong>masiado alto 2 <strong>para</strong> los implicados a fin <strong>de</strong> lograr un consenso hacia un<br />
programa <strong>de</strong> etanol como combustible en <strong>el</strong> país. La experiencia brasileña <strong>de</strong> integración <strong>de</strong><br />
intereses <strong>de</strong> productores e ingenios en un acuerdo negociado libremente, dirigido por mo<strong><strong>de</strong>l</strong>os<br />
técnicos y económicos y supervisados por expertos <strong>de</strong> ambas partes podría ser <strong>de</strong> interés <strong>para</strong><br />
México.<br />
2 Los precios <strong>de</strong> exportación <strong><strong>de</strong>l</strong> azúcar están por <strong>de</strong>bajo <strong>de</strong> los precios nacionales – <strong>el</strong> llamado precio KARBE pagado por la<br />
caña a partir <strong><strong>de</strong>l</strong> azúcar recuperable.<br />
4
<strong>Potenciales</strong> y <strong>Viabilidad</strong> <strong><strong>de</strong>l</strong> <strong>Uso</strong> <strong>de</strong> <strong>Bioetanol</strong> y <strong>Biodies<strong>el</strong></strong> <strong>para</strong> <strong>el</strong> Transporte en México (SENER-BID-GTZ)<br />
Executive Summary<br />
Compren<strong>de</strong>r los fundamentos, oportunida<strong>de</strong>s y barreras, así como las motivaciones <strong>de</strong> los<br />
actores sociales clave en <strong>el</strong> programa <strong>de</strong> etanol, contribuirán a construir <strong>el</strong> consenso que<br />
posibilitará la introducción <strong><strong>de</strong>l</strong> etanol en <strong>el</strong> mercado en México, <strong>de</strong>ntro <strong><strong>de</strong>l</strong> marco legal creado<br />
por las leyes y regulaciones a tal efecto. Los gobiernos son los iniciadores naturales <strong>de</strong> este<br />
proceso transición. La implementación en sí se lleva a cabo a través <strong>de</strong> una combinación <strong>de</strong><br />
agentes públicos y privados. Deberían consi<strong>de</strong>rarse foros nacionales <strong>de</strong> actores sociales clave<br />
<strong>para</strong> conseguir un consenso sobre un portafolio <strong>de</strong> priorida<strong>de</strong>s <strong>de</strong> acción. Esto pue<strong>de</strong> traducirse<br />
en legislación, regulación, financiamiento, presupuestos públicos y privados, asistencia<br />
técnica, cooperación técnica, llevando todos estos aspectos a una implementación suave y sin<br />
problemas <strong>de</strong> un programa <strong>de</strong> etanol.<br />
Todo programa <strong>de</strong> etanol puesto en marcha en <strong>el</strong> mundo fue lanzado con <strong>el</strong> apoyo <strong>de</strong><br />
incentivos financieros y <strong>de</strong> todo tipo, inclusive mandatos y los contratos <strong>de</strong> compra<br />
resultantes; impuestos diferenciales <strong><strong>de</strong>l</strong> etanol <strong>para</strong> ser mezclado con gasolina <strong>para</strong> niv<strong>el</strong>ar los<br />
costos <strong><strong>de</strong>l</strong> etanol y <strong>de</strong> la gasolina en la mezcla distribuida a través <strong>de</strong> la red <strong>de</strong> venta y otros.<br />
Esto tendría como resultado a corto plazo pérdidas <strong>para</strong> <strong>el</strong> Erario, que podrían ser<br />
compensadas a través <strong>de</strong> fondos que <strong>de</strong>berían establecerse en la implementación <strong>de</strong> la<br />
legislación mexicana sobre biocombustibles y energías alternativas.<br />
1.3 <strong>Biodies<strong>el</strong></strong><br />
La producción <strong>de</strong> biodies<strong>el</strong> a escala comercial pue<strong>de</strong> ser factible en México en <strong>el</strong> mediano<br />
plazo <strong>de</strong> realizar acciones integrales que <strong>de</strong>ben incluir aspectos técnicos, económicos y<br />
medioambientales, <strong>de</strong> concertación con <strong>el</strong> sector agrario y agroindustrial así como un esfuerzo<br />
importante en investigación y <strong>de</strong>sarrollo tecnológico.<br />
El biodies<strong>el</strong> pue<strong>de</strong> producirse a partir <strong>de</strong> una gran variedad <strong>de</strong> cultivos oleaginosos, <strong>de</strong> grasas<br />
animales y <strong>de</strong> aceites y grasas recicladas. En este proyecto se estudiaron como insumos <strong>para</strong><br />
este combustible a la semiila <strong>de</strong> colza, soya, jatropha, girasol, y cártamo, así como <strong>el</strong> uso <strong>de</strong><br />
sebo animal y aceite reciclado. Se analizó la producción <strong>de</strong> biodies<strong>el</strong> en plantas con <strong>de</strong>dicación<br />
exclusiva a este combustible o como anexos a plantas existentes <strong>para</strong> la extracción <strong>de</strong> aceites<br />
comestibles.<br />
La producción <strong>de</strong> biodies<strong>el</strong> a partir <strong>de</strong> semilla <strong>de</strong> colza y soya es técnicamente madura en todo<br />
<strong>el</strong> mundo. El biodies<strong>el</strong> producido a partir <strong>de</strong> jatropha es técnicamente viable aunque no se<br />
tiene tanta experiencia a niv<strong>el</strong> internacional; finalmente <strong>el</strong> biodies<strong>el</strong> <strong>de</strong> palma tiene <strong>el</strong><br />
inconveniente <strong>de</strong> no permitir que los ésteres satisfagan los requerimientos <strong>de</strong> flujo en frío en<br />
las regiones templadas.<br />
El análisis económico muestra que en todos los casos los precios <strong>de</strong> producción <strong><strong>de</strong>l</strong> biodies<strong>el</strong><br />
son mayores que <strong>el</strong> costo <strong>de</strong> oportunidad <strong><strong>de</strong>l</strong> dies<strong>el</strong> comercializado por PEMEX. En este<br />
sentido, la situación en México no es muy diferente <strong>de</strong> la <strong>de</strong> otros países, pero es más evi<strong>de</strong>nte<br />
dado <strong>el</strong> bajo costo <strong><strong>de</strong>l</strong> dies<strong>el</strong> <strong>de</strong> petróleo, <strong>el</strong> cual cuenta incluso con subsidios especiales <strong>de</strong>ntro<br />
<strong><strong>de</strong>l</strong> sector agrícola. Los costos <strong>de</strong> producción <strong><strong>de</strong>l</strong> biodies<strong>el</strong> tienen un rango <strong>de</strong> entre $5.3 a<br />
$12.4 pesos por litro equivalente. Los cultivos más competitivos son la palma, girasol y soya.<br />
La jatropha es promisoria pero <strong>de</strong>be resolverse <strong>el</strong> problema <strong>de</strong> posibles toxinas en la glicerina<br />
y otros subproductos generados en <strong>el</strong> proceso. Los costos <strong>de</strong> los insumos agrícolas representan<br />
5
<strong>Potenciales</strong> y <strong>Viabilidad</strong> <strong><strong>de</strong>l</strong> <strong>Uso</strong> <strong>de</strong> <strong>Bioetanol</strong> y <strong>Biodies<strong>el</strong></strong> <strong>para</strong> <strong>el</strong> Transporte en México (SENER-BID-GTZ)<br />
Executive Summary<br />
entre <strong>el</strong> 59% y 91% <strong>de</strong> los costos <strong>de</strong> producción <strong><strong>de</strong>l</strong> biodies<strong>el</strong>. En muchos casos, como la soya,<br />
estos costos <strong>de</strong>pen<strong>de</strong>n en gran medida <strong>de</strong> la posibilidad <strong>de</strong> ven<strong>de</strong>r los subproductos agrícolas.<br />
Al igual que en <strong>el</strong> caso <strong><strong>de</strong>l</strong> etanol, este estudio sugiere una estrategia gradual <strong>de</strong> introducción<br />
<strong><strong>de</strong>l</strong> biodies<strong>el</strong> en México. De manera inmediata, la introducción <strong><strong>de</strong>l</strong> biodies<strong>el</strong> podría basarse<br />
sobre todo en <strong>el</strong> uso <strong>de</strong> materias primas <strong>de</strong> bajo costo como aceites y grasas recicladas. En <strong>el</strong><br />
mediano plazo se requerirán esquemas <strong>de</strong> incentivos <strong>para</strong> la introducción <strong><strong>de</strong>l</strong> biodies<strong>el</strong><br />
<strong>de</strong>manera masiva a fin <strong>de</strong> permitir la sustitución <strong>de</strong> entre <strong>el</strong> 2% y 5% <strong><strong>de</strong>l</strong> dies<strong>el</strong> <strong>de</strong> petróleo<br />
<strong>de</strong>spués <strong><strong>de</strong>l</strong> 2012. Para lograr estas metas se necesita un plan <strong>de</strong> <strong>de</strong>sarrollo <strong><strong>de</strong>l</strong> mercado <strong>de</strong><br />
este combustible que contemple aspectos como: establecer <strong>de</strong> manera inmediata <strong>el</strong> marco legal<br />
–por ejemplo, una directiva <strong>de</strong> biodies<strong>el</strong> con metas claras, estándares nacionales <strong>para</strong> este<br />
combustible e incentivos a la producción agrícola y comenzar a <strong>de</strong>sarrollar una industria<br />
nacional <strong>de</strong> producción <strong>de</strong> biodies<strong>el</strong>, incluyendo activida<strong>de</strong>s <strong>de</strong> capacitación y <strong>de</strong><br />
investigación y <strong>de</strong>sarrollo Asimismo, se necesita aumentar <strong>de</strong> manera muy significativa <strong>el</strong><br />
área <strong>de</strong> cultivos oleaginosos, puesto que nuestro país no cubre actualmente ni siquiera la<br />
<strong>de</strong>manda <strong>de</strong> aceites comestibles.<br />
Para llegar a sustituir un 5% <strong><strong>de</strong>l</strong> dies<strong>el</strong> <strong>de</strong> petróleo en <strong>el</strong> país será necesario instalar 10 plantas<br />
industriales con capacidad <strong>de</strong> 100.000 t/año cada una o más <strong>de</strong> 140 plantas pequeñas con<br />
capacidad <strong>de</strong> 5,000 t/año cada una. Para optimizar <strong>el</strong> suministro <strong>de</strong> los cultivos agrícolas, y<br />
reducir <strong>el</strong> costo <strong>de</strong> distribución <strong>de</strong> biodies<strong>el</strong> y sus subproductos, las plantas <strong>de</strong> producción<br />
<strong>de</strong>ben instalarse en las cercanías <strong>de</strong> refinerías o <strong>de</strong> las plantas productores <strong>de</strong> aceites vegetales.<br />
Des<strong>de</strong> <strong>el</strong> punto <strong>de</strong> vista logístico, la mejor opción son plantas integradas <strong>de</strong> producción <strong>de</strong><br />
aceites vegetales y biodies<strong>el</strong>.<br />
Las inversiones estimadas <strong>para</strong> llegar al escenario <strong>de</strong> 5% <strong>de</strong> biodies<strong>el</strong> alcanzan $3,100<br />
millones <strong>de</strong> pesos, puesto que cada planta industrial <strong>de</strong> gran escala tiene un costo unitario <strong>de</strong><br />
$311 millones <strong>de</strong> pesos. Aunque la producción <strong>de</strong> biodies<strong>el</strong> estaría orientada al mercado<br />
nacional, <strong>el</strong> combustible podría también exportarse ocasionalmente a otros mercados como<br />
Europa o los Estados Unidos.<br />
Las ventajas <strong>de</strong> un programa nacional <strong>de</strong> biodies<strong>el</strong> serían muy importantes. Des<strong>de</strong> <strong>el</strong> punto <strong>de</strong><br />
vista ambiental, la sustitución <strong>de</strong> dies<strong>el</strong> <strong>de</strong> petróleo por biodis<strong>el</strong> permitiría ahorrar alre<strong>de</strong>dor <strong>de</strong><br />
1.7 millones <strong>de</strong> ton<strong>el</strong>adas <strong>de</strong> CO2/año hacia <strong>el</strong> año 2010 y 7.5 millones <strong>de</strong> ton<strong>el</strong>adas <strong>de</strong><br />
CO2/año hacia <strong>el</strong> 2014.<br />
Dentro <strong><strong>de</strong>l</strong> sector rural, apropiadamente diseñado, un programa <strong>de</strong> introducción <strong>de</strong> biodies<strong>el</strong><br />
podría presentar un balance ecológico positivo y ayudar al <strong>de</strong>sarrollo <strong>de</strong> las economías<br />
regionales y locales. Para lograr estos objetivos es muy importante que, en las zonas<br />
tropicales, los cultivos <strong>de</strong> biodies<strong>el</strong> –ej. Aquéllos basados en aceite <strong>de</strong> palma- no se<br />
establezcan sobre bosques naturales. Asimismo, se <strong>de</strong>be evitar la competencia por <strong>el</strong> uso <strong>de</strong> la<br />
tierra <strong>para</strong> fines <strong>de</strong> alimentación, o evitar la contaminación por <strong>el</strong> uso intensivo <strong>de</strong> fertilizantes<br />
químicos y pesticidas. En este sentido, se <strong>de</strong>bería enfatizar un enfoque agroecológico e<br />
impulsar los cultivos perennes–como la Jatropha- que permitan <strong>el</strong> uso <strong>de</strong> tierras <strong>de</strong> temporal<br />
y/o marginales y aseguren una mayor cobertura <strong><strong>de</strong>l</strong> su<strong>el</strong>o <strong>para</strong> control <strong>de</strong> erosión.<br />
De hecho, un programa nacional <strong>de</strong> biodies<strong>el</strong> <strong>de</strong>bería basarse en un esquema diverso e<br />
integrado regionalmente tanto en aspectos <strong>de</strong> la <strong>de</strong>manda y procesamiento –utilizando plantas<br />
<strong>de</strong> distintas capacida<strong>de</strong>s- como en la oferta <strong>de</strong> cultivos. En todos los casos <strong>el</strong> énfasis <strong>de</strong> un<br />
6
<strong>Potenciales</strong> y <strong>Viabilidad</strong> <strong><strong>de</strong>l</strong> <strong>Uso</strong> <strong>de</strong> <strong>Bioetanol</strong> y <strong>Biodies<strong>el</strong></strong> <strong>para</strong> <strong>el</strong> Transporte en México (SENER-BID-GTZ)<br />
Executive Summary<br />
programa <strong>de</strong> biodies<strong>el</strong> es la creación <strong>de</strong> valor agregado y empleo en México. Para esto se<br />
recomienda que la producción y procesamiento <strong>de</strong> este combustible se haga con tecnología<br />
diseñada y construída localmente. La transferencia <strong>de</strong> tecnología en áreas específicas es<br />
importante, pero <strong>de</strong>be evitarse la importación directa <strong>de</strong> las plantas.<br />
Los principales cu<strong>el</strong>los <strong>de</strong> bot<strong>el</strong>la <strong>para</strong> la introducción <strong><strong>de</strong>l</strong> biodies<strong>el</strong> en México están en <strong>el</strong><br />
sector agrícola. Por esta razón se tiene que establecer un amplio plan <strong>de</strong> apoyo a la agricultura<br />
<strong>para</strong> lograr <strong>el</strong> suministro nacional <strong>de</strong> los insumos. Los estímulos <strong>para</strong> una economía rural más<br />
dinámica <strong>de</strong>berían incluir los siguientes aspectos:<br />
• Apoyar cultivos oleaginosos a pequeña escala, los cuales aumentan <strong>el</strong> valor añadido <strong>de</strong> la<br />
agricultura rural y contribuyen a la biodiversidad, <strong>de</strong>bería iniciarse un plan <strong>de</strong> promoción<br />
específico (como ejemplo, <strong>el</strong> programa brasileño <strong>de</strong> biodies<strong>el</strong>).<br />
• Para algunos cultivos oleaginosos como la Jatropha es necesario un mejor conocimiento<br />
<strong><strong>de</strong>l</strong> cultivo. Asimismo necesitan más tiempo <strong>para</strong> su establecimiento. Los conocimientos<br />
resultantes <strong>de</strong> estas activida<strong>de</strong>s <strong>de</strong> investigación tendrán que ser transferidos a la población<br />
rural a través <strong>de</strong> programas educacionales.<br />
• La formación <strong>de</strong> cooperativas especializadas, que permitirían crear sinergias a través <strong>de</strong><br />
una utilización conjunta <strong>de</strong> la maquinaria; <strong>de</strong>bería fomentarse <strong>el</strong> acceso a financiamiento y<br />
a asistencia técnica.<br />
• Agencias <strong>de</strong> financiamiento, como FIRA, podrían crear programas especiales <strong>para</strong> <strong>el</strong><br />
biodies<strong>el</strong> o su producción a tasas <strong>de</strong> interés preferenciales.<br />
• Debería fomentarse la integración <strong>de</strong> la producción <strong>de</strong> semillas oleaginosas y prensado <strong>de</strong><br />
semillas/refinado <strong>de</strong> aceites/producción <strong>de</strong> biodies<strong>el</strong> (siendo económicamente viable) <strong>para</strong><br />
crear una retención más fuerte <strong>de</strong> valor añadido en las áreas rurales.<br />
La producción a gran escala <strong>de</strong> biodies<strong>el</strong> en México requiere <strong>de</strong> un esfuerzo importante en<br />
investigación y <strong>de</strong>sarrollo. Las activida<strong>de</strong>s que <strong>de</strong>berían enfatizarse son, por ejemplo, <strong>el</strong><br />
establecimiento <strong>de</strong> investigación agrícola <strong>para</strong> mejorar la productividad <strong>de</strong> cultivos<br />
energéticos, especialmente <strong>para</strong> ampliar las varieda<strong>de</strong>s <strong>de</strong> las diferentes especies, y <strong>el</strong><br />
establecimiento <strong>de</strong> nuevos sistemas <strong>de</strong> cultivo. Igualmente <strong>de</strong>bería existir una cooperación con<br />
las investigaciones <strong>de</strong> PEMEX sobre <strong>el</strong> conocimiento <strong>de</strong> las opciones <strong>de</strong> hidrogenación, en<br />
especial <strong>para</strong> <strong>el</strong> uso <strong>de</strong> aceite <strong>de</strong> palma. Otra medida necesaria sería la creación <strong>de</strong> centros <strong>de</strong><br />
investigación y <strong>de</strong>sarrollo regional sobre biodies<strong>el</strong>/biocombustibles y aportar continuamente<br />
fondos. Las industrias privadas <strong>de</strong>berían ser bienvenidas a participar, pero los fondos básicos<br />
<strong>de</strong>berían ser aportados por <strong>el</strong> Gobierno <strong>para</strong> asegurar la disponibilidad <strong>de</strong> la información<br />
r<strong>el</strong>evante <strong>de</strong> los interesados. Estos fondos <strong>de</strong> base podrían ser aportados a través <strong>de</strong> un módico<br />
impuesto estatal sobre los biocombustibles. En estos centros <strong>de</strong>berían llevarse a cabo<br />
programas <strong>de</strong> alcance institucional y <strong>de</strong> asistencia técnica y parte <strong>de</strong> este esfuerzo podría ser<br />
combinado con los centros existentes <strong>de</strong> investigación y tecnología agrícola operados por<br />
Fi<strong>de</strong>icomisos Instituidos en R<strong>el</strong>ación con la Agricultura en <strong>el</strong> Banco <strong>de</strong> México (FIRA).<br />
7
2 Background
Task 1: Economic overview<br />
Omar Masera Cerutti, Manu<strong>el</strong>a Prehn Junquera
<strong>Potenciales</strong> y <strong>Viabilidad</strong> <strong><strong>de</strong>l</strong> <strong>Uso</strong> <strong>de</strong> <strong>Bioetanol</strong> y <strong>Biodies<strong>el</strong></strong> <strong>para</strong> <strong>el</strong> Transporte en México (SENER-BID-GTZ)<br />
Task 1: Economic Overview<br />
1. Aspectos generales<br />
Índice<br />
2. El sector agrícola<br />
3. El contexto <strong>de</strong>mográfico y <strong><strong>de</strong>l</strong> empleo<br />
4. El pap<strong>el</strong> <strong>de</strong> los hidrocarburos en la economía mexicana<br />
5. El pap<strong>el</strong> <strong><strong>de</strong>l</strong> comercio y la situación <strong>de</strong> la balanza <strong>de</strong> pagos en la economía mexicana<br />
6. La participación <strong>de</strong> México en tratados <strong>de</strong> libre comercio como <strong>el</strong> NAFTA<br />
7. Bibliografía
<strong>Potenciales</strong> y <strong>Viabilidad</strong> <strong><strong>de</strong>l</strong> <strong>Uso</strong> <strong>de</strong> <strong>Bioetanol</strong> y <strong>Biodies<strong>el</strong></strong> <strong>para</strong> <strong>el</strong> Transporte en México (SENER-BID-GTZ)<br />
Task 1: Economic Overview<br />
Lista <strong>de</strong> Tablas<br />
Tabla 1.1. Listado <strong>de</strong> los Estados <strong>de</strong> México y <strong>el</strong> número <strong>de</strong> Municipios por Estado<br />
Tabla 1.2. México: Producto Interno Bruto por Entidad Fe<strong>de</strong>rativa, 1994-2004. Total <strong>de</strong><br />
la actividad económica (Millones <strong>de</strong> Pesos a Precios Corrientes)<br />
Tabla 1.3. Evolución <strong>de</strong> la tasa anual <strong>de</strong> crecimiento <strong><strong>de</strong>l</strong> PIB (1993-2005)<br />
Tabla 1.4. Tasas anuales <strong>de</strong> variación <strong><strong>de</strong>l</strong> PIB por sectores (1993-2005)<br />
Tabla 1.5. Tasas anuales <strong>de</strong> variación <strong><strong>de</strong>l</strong> PIB por Habitante (1993-2005)<br />
Tabla 2.1. México: Personal ocupado remunerado por sectores <strong>de</strong> actividad (1970-2003)<br />
Tabla 3.1. México: población según Entida<strong>de</strong>s Fe<strong>de</strong>rativas, 2000<br />
Tabla 3.2. México: total <strong>de</strong> la población según tamaño <strong>de</strong> localidad, 2000 (Localida<strong>de</strong>s<br />
<strong>de</strong> 1 a 4,999 habitantes)<br />
Tabla 3.3. México: total <strong>de</strong> la población por eda<strong>de</strong>s, 2000<br />
Tabla 4.1. Producción <strong>de</strong> petróleo crudo, principales países, 2004. Producción <strong>de</strong> gas<br />
natural, principales países, 2004<br />
Tabla 4.2. Reservas probadas <strong>de</strong> petróleo crudo, principales países, a 1 <strong>de</strong> enero <strong>de</strong> 2005<br />
Tabla 4.3. Producción <strong>de</strong> energía primaria en México 2003-2004 (Petajoules)<br />
Lista <strong>de</strong> Figuras<br />
Figura 1.1. Carta topográfica nacional estatal 1:50,000. Instituto Nacional <strong>de</strong> Estadística,<br />
Geografía e Informática (INEGI), 1995<br />
Figura 1.2. Evolución <strong>de</strong> la tasa anual <strong>de</strong> crecimiento <strong><strong>de</strong>l</strong> PIB (1993-2005)<br />
Figura 1.3. Tasas anuales <strong>de</strong> variación <strong><strong>de</strong>l</strong> PIB por sectores (1993-2005)<br />
Figura 1.4. Tasas anuales <strong>de</strong> variación <strong><strong>de</strong>l</strong> PIB por Habitante (1993-2005)<br />
Figura 3.1. Evolución <strong>de</strong> la población mexicana (1900 – 2000)<br />
Figura 4.1. Estructura <strong>de</strong> la producción <strong>de</strong> energía primaria en México, 2004<br />
(10,330.774 Petajoules)<br />
Figura 6.1. Cronología <strong>de</strong> la política <strong>de</strong> apertura <strong>de</strong> México
<strong>Potenciales</strong> y <strong>Viabilidad</strong> <strong><strong>de</strong>l</strong> <strong>Uso</strong> <strong>de</strong> <strong>Bioetanol</strong> y <strong>Biodies<strong>el</strong></strong> <strong>para</strong> <strong>el</strong> Transporte en México (SENER-BID-GTZ)<br />
Task 1: Economic Overview<br />
1. Aspectos generales 1<br />
Los Estados Unidos Mexicanos abarcan un territorio <strong>de</strong> 1,964,375 km 2 y cuentan con una<br />
población <strong>de</strong> 97,483,412 habitantes. La República Mexicana tiene fronteras con los Estados<br />
Unidos <strong>de</strong> América, Guatemala y B<strong>el</strong>ice, a lo largo <strong>de</strong> un total <strong>de</strong> 4,301 km. (Presi<strong>de</strong>ncia <strong>de</strong> la<br />
República, 2004). México se compone <strong>de</strong> 32 Entida<strong>de</strong>s Fe<strong>de</strong>rativas: 31 Estados y un Distrito<br />
Fe<strong>de</strong>ral (Ciudad <strong>de</strong> México), siendo éste último la capital <strong><strong>de</strong>l</strong> país y se<strong>de</strong> <strong>de</strong> los po<strong>de</strong>res<br />
fe<strong>de</strong>rales. México a<strong>de</strong>más cuenta con 2,438 Municipios (Instituto Nacional <strong>para</strong> <strong>el</strong><br />
Fe<strong>de</strong>ralismo y <strong>el</strong> Desarrollo Municipal, 2005) como sub-división administrativa <strong>de</strong> los<br />
Estados. Oaxaca y Veracruz presentan <strong>el</strong> mayor número <strong>de</strong> Municipios, muchos <strong>de</strong> <strong>el</strong>los <strong>de</strong><br />
tamaño muy reducido. A continuación se listan los Estados y <strong>el</strong> número <strong>de</strong> Municipios, así<br />
como un mapa estatal.<br />
Tabla 1.1. Listado <strong>de</strong> los Estados <strong>de</strong> México y <strong>el</strong> número <strong>de</strong> Municipios por Estado<br />
Estado<br />
Número <strong>de</strong><br />
Municipios<br />
Estado<br />
Número <strong>de</strong><br />
Municipios<br />
AGUASCALIENTES 11 NAYARIT 20<br />
BAJA CALIFORNIA 5 NUEVO LEON 51<br />
BAJA CALIFORNIA SUR 5 OAXACA 570<br />
CAMPECHE 11 PUEBLA 217<br />
COAHUILA DE ZARAGOZA 38 QUERETARO DE ARTEAGA 18<br />
COLIMA 10 QUINTANA ROO 8<br />
CHIAPAS 118 SAN LUIS POTOSI 58<br />
CHIHUAHUA 67 SINALOA 18<br />
DURANGO 39 SONORA 72<br />
GUANAJUATO 46 TABASCO 17<br />
GUERRERO 81 TAMAULIPAS 43<br />
HIDALGO 84 TLAXCALA 60<br />
JALISCO 124 VERACRUZ-LLAVE 212<br />
MEXICO 125 YUCATAN 106<br />
MICHOACAN DE OCAMPO 113<br />
ZACATECAS<br />
MORELOS 33<br />
58<br />
TOTAL 2,438<br />
Fuente: Instituto Nacional <strong>para</strong> <strong>el</strong> Fe<strong>de</strong>ralismo y <strong>el</strong> Desarrollo Municipal, 2005<br />
1 Los datos y análisis se presentarán teniendo en cuenta los indicadores económicos principales, como <strong>el</strong> PIB y<br />
PIB per cápita en términos corrientes y en términos <strong>de</strong> la paridad <strong><strong>de</strong>l</strong> po<strong>de</strong>r adquisitivo, distribución <strong>de</strong> la renta,<br />
tasas <strong>de</strong> crecimiento general y sectorial<br />
1
<strong>Potenciales</strong> y <strong>Viabilidad</strong> <strong><strong>de</strong>l</strong> <strong>Uso</strong> <strong>de</strong> <strong>Bioetanol</strong> y <strong>Biodies<strong>el</strong></strong> <strong>para</strong> <strong>el</strong> Transporte en México (SENER-BID-GTZ)<br />
Task 1: Economic Overview<br />
Figura 1.1. Carta topográfica nacional estatal 1:50,000. Instituto Nacional <strong>de</strong> Estadística,<br />
Geografía e Informática (INEGI), 1995<br />
La forma <strong>de</strong> organización política <strong>de</strong> México es la <strong>de</strong> una República representativa,<br />
<strong>de</strong>mocrática, fe<strong>de</strong>ral, compuesta <strong>de</strong> Estados libres y soberanos en todo lo concerniente a su<br />
régimen interior; pero unidos en una fe<strong>de</strong>ración.<br />
En cuanto a su geografía, <strong>el</strong> <strong>el</strong>emento topográfico prominente <strong><strong>de</strong>l</strong> país es la altiplanicie<br />
Mexicana, continuación <strong>de</strong> las llanuras <strong><strong>de</strong>l</strong> suroeste <strong>de</strong> Estados Unidos, que compren<strong>de</strong> más <strong>de</strong><br />
la cuarta parte <strong><strong>de</strong>l</strong> área total <strong>de</strong> México. Se divi<strong>de</strong> en la altiplanicie septentrional y meridional<br />
y limita en <strong>el</strong> este y <strong>el</strong> oeste por dos ca<strong>de</strong>nas montañosas, la sierra Madre occi<strong>de</strong>ntal y la sierra<br />
Madre oriental. Ambas sierras son interceptadas al sur por <strong>el</strong> eje o cordillera Neovolcánica<br />
transversal, por <strong>de</strong>bajo <strong>de</strong> la cual también se encuentran la sierra Madre <strong><strong>de</strong>l</strong> Sur, la sierra<br />
Madre <strong>de</strong> Chiapas y la sierra Madre <strong>de</strong> Oaxaca.<br />
La República <strong>de</strong>staca por la extensión <strong>de</strong> sus litorales, que es <strong>de</strong> 11,122 km. exclusivamente<br />
en su parte continental, sin incluir los litorales insulares (INEGI, 2006) y cuenta con algunos<br />
ríos importantes (la mayoría no navegables), siendo <strong>el</strong> río Bravo <strong>el</strong> <strong>de</strong> mayor longitud, y con<br />
lagos como <strong>el</strong> <strong>de</strong> Chapala.<br />
La economía mexicana ha registrado un crecimiento promedio <strong><strong>de</strong>l</strong> 2.8% al año a lo largo <strong><strong>de</strong>l</strong><br />
período 1993-2005. El Producto Interno Bruto (PIB) en 1994 se situó en 1.3 billones <strong>de</strong> pesos<br />
a precios corrientes y ascendió a 6.9 billones en 2004 (Centro <strong>de</strong> Estudios <strong>de</strong> las Finanzas<br />
Públicas <strong>de</strong> la H. Cámara <strong>de</strong> Diputados, 2005). Geográficamente <strong>el</strong> PIB más alto se registra en<br />
2
<strong>Potenciales</strong> y <strong>Viabilidad</strong> <strong><strong>de</strong>l</strong> <strong>Uso</strong> <strong>de</strong> <strong>Bioetanol</strong> y <strong>Biodies<strong>el</strong></strong> <strong>para</strong> <strong>el</strong> Transporte en México (SENER-BID-GTZ)<br />
Task 1: Economic Overview<br />
<strong>el</strong> Distrito Fe<strong>de</strong>ral, seguido por <strong>el</strong> Estado <strong>de</strong> México y <strong>el</strong> más bajo las Entida<strong>de</strong>s Fe<strong>de</strong>rativas<br />
<strong>de</strong> Colima y Nayarit.<br />
Tabla 1.2. México: Producto Interno Bruto por Entidad Fe<strong>de</strong>rativa, 1994-2004. Total <strong>de</strong><br />
la actividad económica (Millones <strong>de</strong> Pesos a Precios Corrientes)<br />
PERIODO 1994 1995 1996 1997 1998 1999 2000 2001 2002 2003 2004<br />
Total Nacional 1.306.301,6 1.678.834,8 2.296.674,5 2.873.273,0 3.517.781,9 4.206.742,9 4.983.517,7 5.269.653,6 5.734.645,8 6.245.546,9 6.964.058,6<br />
Aguascalientes 13.253,9 18.127,9 25.362,5 33.167,7 41.010,0 49.265,2 61.679,1 66.231,9 71.616,8 77.702,3 85.575,4<br />
Baja California 38.071,7 53.460,8 72.662,8 97.637,7 119.420,2 148.317,7 180.879,6 183.592,0 189.341,7 210.278,9 244.088,7<br />
Baja California<br />
Sur<br />
6.817,7 9.007,8 12.305,7 15.887,2 19.223,7 22.963,0 26.961,1 30.676,3 33.336,9 37.382,2 41.788,9<br />
Campeche 15.288,6 23.006,1 29.688,5 35.335,7 38.110,0 48.692,2 59.557,3 63.105,6 73.267,0 77.355,0 86.031,9<br />
Coahuila <strong>de</strong><br />
Zaragoza<br />
37.587,8 55.767,1 75.850,2 98.652,0 121.394,4 140.323,0 155.674,8 163.099,0 185.148,8 205.495,6 234.823,6<br />
Colima 7.076,0 8.769,8 12.184,7 15.185,7 19.265,9 23.731,9 27.247,8 28.152,8 31.296,2 33.298,6 37.166,9<br />
Chiapas 23.579,1 29.900,8 39.517,8 49.340,6 59.339,0 68.701,2 81.194,9 86.693,8 96.802,4 106.025,2 118.079,2<br />
Chihuahua 49.983,8 69.763,0 97.131,4 121.773,2 152.233,3 184.824,8 228.549,5 233.023,1 243.428,4 272.027,9 301.539,2<br />
Distrito Fe<strong>de</strong>ral 313.554,9 384.748,5 522.989,2 643.559,4 786.584,5 943.877,1 1.121.855,8 1.176.371,8 1.331.089,4 1.419.881,8 1.520.677,1<br />
Durango 17.013,7 21.862,5 30.926,0 37.498,6 46.207,5 52.378,7 59.924,5 66.573,2 72.242,8 81.146,5 92.406,1<br />
Guanajuato 42.880,3 55.057,3 76.566,0 101.384,8 124.416,9 145.166,6 170.862,2 179.817,0 201.967,6 223.096,8 250.370,7<br />
Guerrero 24.269,2 29.917,9 38.563,1 47.294,0 59.032,8 72.637,4 85.676,8 93.694,8 100.398,8 107.374,6 117.247,6<br />
Hidalgo 19.049,3 22.211,6 31.414,3 38.715,6 48.510,2 57.125,7 64.968,6 68.438,7 74.280,1 80.315,9 90.768,0<br />
Jalisco 85.292,7 105.052,8 147.351,5 181.786,9 227.495,1 273.261,1 321.206,8 346.263,9 367.710,2 391.820,7 439.288,5<br />
México 132.864,6 168.942,6 238.288,2 299.227,1 362.431,9 426.241,7 503.113,1 527.733,8 552.573,7 589.024,7 659.943,0<br />
Michoacán <strong>de</strong><br />
Ocampo<br />
30.759,6 39.453,7 52.919,1 69.071,5 81.329,1 101.532,8 110.932,1 116.280,9 121.559,6 135.261,9 153.969,6<br />
Mor<strong>el</strong>os 18.979,4 22.624,4 30.320,0 38.167,9 48.663,0 57.815,0 66.511,4 75.279,3 77.781,5 87.949,8 96.119,9<br />
Nayarit 8.539,9 9.428,7 12.823,5 15.885,0 19.743,9 23.692,3 26.379,1 30.481,6 32.645,6 33.621,5 37.504,6<br />
Nuevo León 85.545,1 111.663,0 151.815,1 193.251,3 240.613,2 286.750,0 352.924,3 368.601,6 409.144,5 452.692,0 517.474,5<br />
Oaxaca 21.869,4 27.135,5 36.617,9 43.584,5 51.939,8 62.767,3 73.878,4 81.320,2 88.876,0 97.443,5 106.014,5<br />
Puebla 42.445,0 55.905,6 78.401,3 101.479,2 129.119,7 163.274,6 187.412,9 198.867,2 209.142,8 229.458,5 247.502,8<br />
Querétaro <strong>de</strong><br />
Arteaga<br />
19.209,7 26.935,9 37.591,7 48.780,7 62.127,2 73.262,9 86.334,3 90.933,3 98.817,4 106.564,9 119.657,0<br />
Quintana Roo 16.608,8 20.596,8 27.932,3 36.374,2 46.707,5 56.899,5 69.770,4 81.295,7 87.947,3 98.759,5 114.238,2<br />
San Luis Potosí 23.688,4 30.276,7 40.473,7 50.553,4 61.374,1 71.570,5 85.772,4 87.333,8 94.796,9 106.648,6 126.279,9<br />
Sinaloa 28.640,4 34.711,3 48.155,2 57.307,5 67.857,8 79.188,3 96.570,0 99.888,5 109.461,4 119.362,2 138.472,0<br />
Sonora 34.716,0 48.589,1 63.915,8 79.343,2 95.724,2 111.617,8 133.261,7 141.481,4 145.711,4 161.308,3 186.618,3<br />
Tabasco 16.472,8 21.723,4 28.983,6 35.774,8 42.030,9 51.198,7 60.267,8 65.734,1 70.210,4 77.501,7 86.748,1<br />
Tamaulipas 37.545,3 50.282,3 68.390,6 83.673,6 104.218,5 128.040,1 154.304,1 160.993,9 178.829,4 201.558,4 232.432,1<br />
Tlaxcala 6.561,2 8.510,6 11.963,9 15.194,9 18.281,1 22.020,1 26.511,3 29.394,2 30.834,5 34.161,5 39.649,4<br />
Veracruz 60.386,8 80.251,4 107.729,4 128.771,3 148.949,0 172.537,1 198.245,7 212.841,8 232.009,6 255.712,0 290.409,6<br />
Yucatán 17.218,1 20.898,5 29.029,2 36.895,2 46.043,3 56.750,6 69.230,6 76.411,1 80.398,4 88.274,5 98.498,2<br />
Zacatecas 10.532,5 14.251,1 18.810,2 22.718,5 28.384,3 30.317,8 35.859,7 39.047,4 41.978,3 47.041,5 52.675,0<br />
Fuente: Centro <strong>de</strong> Estudios <strong>de</strong> las Finanzas Públicas <strong>de</strong> la H. Cámara <strong>de</strong> Diputados, 2005<br />
La tasa anual <strong>de</strong> crecimiento <strong><strong>de</strong>l</strong> PIB (sobre la base <strong><strong>de</strong>l</strong> PIB trimestral a precios constantes <strong>de</strong><br />
1993), ha tenido consi<strong>de</strong>rables altibajos entre 1993 y 2005, como pue<strong>de</strong> observarse en la tabla<br />
3
<strong>Potenciales</strong> y <strong>Viabilidad</strong> <strong><strong>de</strong>l</strong> <strong>Uso</strong> <strong>de</strong> <strong>Bioetanol</strong> y <strong>Biodies<strong>el</strong></strong> <strong>para</strong> <strong>el</strong> Transporte en México (SENER-BID-GTZ)<br />
Task 1: Economic Overview<br />
1.3. y figura 1.2. A partir <strong>de</strong> la crisis <strong>de</strong> 1995, <strong>el</strong> crecimiento promedio anual ha sido <strong><strong>de</strong>l</strong> 3.7%.<br />
En 2004 se alcanzó la tasa <strong>de</strong> crecimiento más alta <strong>de</strong>s<strong>de</strong> 2000, en un escenario internacional<br />
muy favorable <strong>de</strong>bido al dinamismo <strong>de</strong> la economía <strong>de</strong> Estados Unidos, <strong>de</strong>stino <strong><strong>de</strong>l</strong> 90% <strong>de</strong> las<br />
exportaciones mexicanas, y a los altos precios <strong><strong>de</strong>l</strong> petróleo. Según cifras pr<strong>el</strong>iminares <strong>de</strong> 2005,<br />
<strong>el</strong> PIB registró una tasa <strong>de</strong> 3.0% en ese año.<br />
Tabla 1.3. Evolución <strong>de</strong> la tasa anual <strong>de</strong> crecimiento <strong><strong>de</strong>l</strong> PIB (1993-2005)<br />
Evolución <strong>de</strong> la tasa anual <strong>de</strong> crecimiento <strong><strong>de</strong>l</strong> PIB* (1993-2005)<br />
1993 1994 1995 1996 1997 1998 1999 2000 2001 2002 2003 2004 2005**<br />
1.9 4.5 -6.2 5.1 6.8 4.9 3.9 6.6 -0.2 0.8 1.4 4.2 3.0<br />
*Sobre la base <strong><strong>de</strong>l</strong> PIB trimestral a precios constantes <strong>de</strong> 1993<br />
**Cifras pr<strong>el</strong>iminares<br />
Fuente: Centro <strong>de</strong> Estudios <strong>de</strong> las Finanzas Públicas <strong>de</strong> la H. Cámara <strong>de</strong> Diputados, 2005<br />
Evolución <strong>de</strong> la tasa anual <strong>de</strong> crecimiento <strong><strong>de</strong>l</strong> PIB<br />
(1993-2005)<br />
8<br />
6<br />
4<br />
2<br />
0<br />
1.9<br />
4.5<br />
5.1<br />
6.8<br />
4.9<br />
3.9<br />
6.6<br />
-0.2<br />
0.8<br />
1.4<br />
4.2<br />
3.0<br />
-2<br />
1993<br />
1994<br />
1995<br />
1996<br />
1997<br />
1998<br />
1999<br />
2000<br />
2001<br />
2002<br />
2003<br />
2004<br />
2005**<br />
-4<br />
-6<br />
-6.2<br />
-8<br />
Figura 1.2. Evolución <strong>de</strong> la tasa anual <strong>de</strong> crecimiento <strong><strong>de</strong>l</strong> PIB (1993-2005)<br />
El sector más dinámico <strong>de</strong> la economía en los últimos 12 años ha sido <strong>el</strong> transporte y<br />
comunicaciones con un crecimiento promedio <strong>de</strong> 5.9% al año, seguido <strong>de</strong> los sectores<br />
financiero y <strong>de</strong> producción <strong>de</strong> <strong>el</strong>ectricidad, agua y gas con 3.91% al año y 3.77% al año,<br />
respectivamente. En contraste, <strong>el</strong> sector agrícola creció sólo un 1.7% al año en promedio en <strong>el</strong><br />
mismo período, como se indica en la tabla 1.4. y figura 1.3.<br />
4
<strong>Potenciales</strong> y <strong>Viabilidad</strong> <strong><strong>de</strong>l</strong> <strong>Uso</strong> <strong>de</strong> <strong>Bioetanol</strong> y <strong>Biodies<strong>el</strong></strong> <strong>para</strong> <strong>el</strong> Transporte en México (SENER-BID-GTZ)<br />
Task 1: Economic Overview<br />
Tabla 1.4. Tasas anuales <strong>de</strong> variación <strong><strong>de</strong>l</strong> PIB por sectores (1993-2005)<br />
Producto Interno Bruto: Tasas anuales <strong>de</strong> variación* (1993 - 2005)<br />
1993 1994 1995 1996 1997 1998 1999 2000 2001 2002 2003 2004 2005**<br />
Total 1.9 4.5 -6.2 5.1 6.8 4.9 3.9 6.6 -0.2 0.8 1.4 4.2 3.0<br />
Agricultura 2.9 0.9 0.9 3.6 0.2 0.8 3.6 0.6 3.5 0.1 3.1 3.5 -1.5<br />
Minería 1.8 2.5 -2.7 8.1 4.5 2.7 -2.1 3.8 1.5 0.4 3.7 3.4 1.2<br />
Industria manufacturera -0.7 4.1 -4.9 10.8 9.9 7.4 4.2 6.9 -3.8 -0.7 -1.3 4.0 1.2<br />
Construcción 3.0 8.4 -23.5 9.8 9.3 4.2 5.0 4.2 -5.7 2.1 3.3 6.1 3.3<br />
Electricidad, gas y agua 2.6 4.8 2.1 4.6 5.2 1.9 15.8 3.0 2.3 1.0 1.5 2.8 1.4<br />
Transporte, almacenamiento y<br />
comunicaciones 4.0 8.7 -4.9 8.0 9.9 6.7 7.8 9.1 3.8 1.8 5.0 9.2 7.1<br />
Comercio, restaurantes y hot<strong>el</strong>es 0.1 6.8 -15.5 4.8 10.7 5.6 3.1 12.2 -1.2 0.0 1.5 5.5 3.1<br />
Establecimientos financieros,<br />
seguros, bienes inmuebles y<br />
servicios prestados a las empresas 5.4 5.4 -0.3 0.6 3.7 4.6 3.6 5.5 4.5 4.2 3.9 3.9 5.8<br />
*Sobre la base <strong><strong>de</strong>l</strong> PIB trimestral a precios constantes <strong>de</strong> 1993<br />
**Cifras pr<strong>el</strong>iminares<br />
Fuente: Centro <strong>de</strong> Estudios <strong>de</strong> las Finanzas Públicas <strong>de</strong> la H. Cámara <strong>de</strong> Diputados, 2005<br />
20<br />
15<br />
10<br />
PRODUCTO INTERNO BRUTO SECTORIAL: TASAS ANUALES DE<br />
VARIACIÓN (1993-2005)<br />
5<br />
0<br />
-5<br />
1993 1994 1995 1996 1997 1998 1999 2000 2001 2002 2003 2004 2005**<br />
-10<br />
-15<br />
-20<br />
-25<br />
-30<br />
Total<br />
Agricultura<br />
Minería<br />
Industria manufacturera<br />
Construcción<br />
Electricidad, gas y agua<br />
Transporte, almacenamiento y comunicaciones<br />
Comercio, restaurantes y hot<strong>el</strong>es<br />
Establecimientos financieros, seguros, bienes inmuebles y servicios prestados a las empresas<br />
Figura 1.3. Tasas anuales <strong>de</strong> variación <strong><strong>de</strong>l</strong> PIB por sectores (1993-2005)<br />
5
<strong>Potenciales</strong> y <strong>Viabilidad</strong> <strong><strong>de</strong>l</strong> <strong>Uso</strong> <strong>de</strong> <strong>Bioetanol</strong> y <strong>Biodies<strong>el</strong></strong> <strong>para</strong> <strong>el</strong> Transporte en México (SENER-BID-GTZ)<br />
Task 1: Economic Overview<br />
El PIB per cápita se situó en 9,136 dólares corrientes en 2003, por arriba <strong>de</strong> los 8,920 dólares<br />
corrientes PPP que había alcanzado en <strong>el</strong> año 2000 (BID, 2005). Sobre la base <strong><strong>de</strong>l</strong> PIB<br />
trimestral a precios constantes <strong>de</strong> 1993, <strong>el</strong> crecimiento anual promedio <strong><strong>de</strong>l</strong> PIB por habitante<br />
fue <strong>de</strong> 1.3%, con fuertes fluctuaciones. Para <strong>el</strong> 2005 <strong>el</strong> crecimiento estimado en <strong>el</strong> PIB per<br />
cápita fue <strong>de</strong> 1.9%, según se muestra en la tabla 1.5. y figura 1.4.<br />
Tabla 1.5. Tasas anuales <strong>de</strong> variación <strong><strong>de</strong>l</strong> PIB por Habitante (1993-2005)<br />
Producto Interno Bruto por Habitante*: Tasas anuales <strong>de</strong> variación<br />
(1993-2005)<br />
1993 1994 1995 1996 1997 1998 1999 2000 2001 2002 2003 2004 2005**<br />
0.1 2.6 -7.8 3.5 5.2 3.4 2.5 5.2 -1.4 -0.4 0.2 3.1 1.9<br />
*Sobre la base <strong><strong>de</strong>l</strong> PIB trimestral a precios constantes <strong>de</strong> 1993<br />
**Cifras pr<strong>el</strong>iminares<br />
Fuente: Centro <strong>de</strong> Estudios <strong>de</strong> las Finanzas Públicas <strong>de</strong> la H. Cámara <strong>de</strong> Diputados, 2005<br />
PRODUCTO INTERNO BRUTO POR HABITANTE: TASAS<br />
ANUALES DE VARIACIÓN (1993-2005)<br />
6<br />
4<br />
2<br />
2.6<br />
3.5<br />
5.2<br />
3.4<br />
2.5<br />
5.2<br />
3.1<br />
1.9<br />
0<br />
-2<br />
0.1<br />
1993<br />
1994<br />
1995<br />
1996<br />
1997<br />
1998<br />
1999<br />
2000<br />
-1.4<br />
2001<br />
-0.4<br />
2002<br />
0.2<br />
2003<br />
2004<br />
2005**<br />
-4<br />
-6<br />
-8<br />
-7.8<br />
-10<br />
Figura 1.4. Tasas anuales <strong>de</strong> variación <strong><strong>de</strong>l</strong> PIB por Habitante (1993-2005)<br />
6
2. El sector agrícola<br />
<strong>Potenciales</strong> y <strong>Viabilidad</strong> <strong><strong>de</strong>l</strong> <strong>Uso</strong> <strong>de</strong> <strong>Bioetanol</strong> y <strong>Biodies<strong>el</strong></strong> <strong>para</strong> <strong>el</strong> Transporte en México (SENER-BID-GTZ)<br />
Task 1: Economic Overview<br />
Las políticas agrícolas han sufrido una reforma significativa durante la última década, que se<br />
dio en <strong>el</strong> contexto <strong>de</strong> un movimiento hacia una economía más abierta y más orientada al<br />
mercado. Prueba <strong>de</strong> <strong>el</strong>lo es <strong>el</strong> ingreso <strong>de</strong> México en <strong>el</strong> Tratado <strong>de</strong> Libre Comercio <strong>de</strong> América<br />
<strong><strong>de</strong>l</strong> Norte (TLCAN), la Organización Mundial <strong><strong>de</strong>l</strong> Comercio (OMC) y la Organización <strong>para</strong> la<br />
Cooperación y Desarrollo Económicos (OCDE), cuya participación tiene implicaciones<br />
institucionales y económicas importantes <strong>para</strong> <strong>el</strong> país en general y <strong>para</strong> su agricultura en<br />
particular.<br />
De hecho, <strong>el</strong> punto <strong>de</strong> inicio <strong>de</strong> las reformas en <strong>el</strong> sector agrícola pue<strong>de</strong> situarse con la reforma<br />
<strong><strong>de</strong>l</strong> Artículo 27 <strong>de</strong> 1992. Tras décadas <strong>de</strong> redistribución <strong>de</strong> tierra y <strong><strong>de</strong>l</strong> <strong>de</strong>sarrollo <strong>de</strong> las formas<br />
sociales <strong>de</strong> propiedad <strong>de</strong> la tierra (ejidos o tierra comunal), <strong>el</strong> cambio al Artículo 27 <strong>de</strong> la<br />
Constitución Mexicana abrió la puerta a la transformación <strong>de</strong> las formas sociales <strong>de</strong> propiedad<br />
a la propiedad privada.<br />
Los recientes <strong>de</strong>sarrollos <strong>de</strong> la política agrícola en México pue<strong>de</strong>n agruparse en tres áreas:<br />
Reforma agraria: en la actualidad, la propiedad comunal y los ejidos cubren un área <strong>de</strong><br />
102 millones <strong>de</strong> hectáreas, que equivalen aproximadamente a la mitad <strong><strong>de</strong>l</strong> territorio<br />
nacional. La reforma al Artículo 27 <strong>de</strong> la Constitución en 1992 y la subsiguiente Ley<br />
Agraria abrieron la posibilidad <strong>de</strong> <strong>de</strong>finir <strong>de</strong>rechos <strong>de</strong> propiedad individual <strong>de</strong> la tierra<br />
en terrenos bajo <strong>el</strong> sistema <strong>de</strong> ejido o propiedad comunal. En agosto <strong>de</strong> 2004 se había<br />
certificado <strong>el</strong> 69% <strong>de</strong> las tierras ejidales y comunales bajo <strong>el</strong> programa PROCEDE,<br />
pudiendo entonces rentarse los terrenos a cualquiera o ven<strong>de</strong>rse a otros miembros <strong><strong>de</strong>l</strong><br />
ejido. La certificación <strong>de</strong> la tierra, supone un paso significativo en las políticas<br />
neoliberales que buscan la privatización <strong>de</strong> los <strong>de</strong>rechos <strong>de</strong> la tierra <strong>de</strong>ntro <strong>de</strong> los<br />
ejidos. Hasta <strong>el</strong> momento, esta política ha tenido un impacto limitado en <strong>el</strong> mercado <strong>de</strong><br />
la tierra agrícola, con cierto crecimiento en <strong>el</strong> arrendamiento <strong>de</strong> la misma (a pesar <strong>de</strong><br />
que los terrenos ejidales siempre se han rentado <strong>de</strong> manera informal). La cantidad <strong>de</strong><br />
tierra agrícola <strong>de</strong> ejidos que se ha vendido en cambio parece ser marginal.<br />
Desarrollos en la política comercial: <strong>el</strong> Tratado <strong>de</strong> Libre Comercio <strong>de</strong> América <strong><strong>de</strong>l</strong><br />
Norte, firmado en 1994, estableció un calendario difícil <strong>de</strong> reducción <strong>de</strong> barreras<br />
comerciales agrícolas entre México, Estados Unidos y Canadá. A<strong>de</strong>más, <strong>de</strong>s<strong>de</strong> 1995, <strong>el</strong><br />
Acuerdo <strong>de</strong> la Ronda <strong>de</strong> Uruguay sobre Agricultura <strong>de</strong> la OMC requirió reducciones en<br />
los aranc<strong>el</strong>es <strong>para</strong> la Nación Más Favorecida (NMF) aplicados a las importaciones <strong>de</strong><br />
México <strong>de</strong>s<strong>de</strong> otros países. Sin embargo, los plazos <strong>de</strong>rivados <strong><strong>de</strong>l</strong> TLCAN han sido<br />
más difíciles porque se aplican al mayor socio comercial <strong>de</strong> México, los Estados<br />
Unidos, y porque <strong>el</strong> TLC requiere un cambio hacia un libre comercio total con los<br />
países socios <strong>para</strong> 2008. Las consecuencias <strong><strong>de</strong>l</strong> TLC han sido generalmente favorables<br />
<strong>para</strong> <strong>el</strong> sector agrícola exportador mientras que han acentuado <strong>de</strong> manera muy<br />
importante la crisis <strong>de</strong> los agricultores pobres y cerealeros <strong><strong>de</strong>l</strong> país. Las repercusiones<br />
<strong><strong>de</strong>l</strong> TLCAN se analizarán en más <strong>de</strong>talle en <strong>el</strong> último punto <strong>de</strong> este estudio.<br />
Desarrollos en política interna: las medidas fronterizas llevadas a cabo suponen <strong>para</strong><br />
México que sus precios se mantengan por encima <strong>de</strong> los <strong><strong>de</strong>l</strong> mercado mundial. Con la<br />
reducción <strong>de</strong> la protección aranc<strong>el</strong>aria, otras políticas internas han adquirido r<strong>el</strong>evancia<br />
7
<strong>Potenciales</strong> y <strong>Viabilidad</strong> <strong><strong>de</strong>l</strong> <strong>Uso</strong> <strong>de</strong> <strong>Bioetanol</strong> y <strong>Biodies<strong>el</strong></strong> <strong>para</strong> <strong>el</strong> Transporte en México (SENER-BID-GTZ)<br />
Task 1: Economic Overview<br />
8<br />
y han tenido <strong>de</strong>sarrollos importantes en los últimos años, aunque no han logrado paliar<br />
las consecuencias negativas <strong><strong>de</strong>l</strong> TLCAN. El programa PROCAMPO fue lanzado en<br />
1994 <strong>para</strong> apoyar <strong>el</strong> ingreso <strong>de</strong> los campesinos y facilitar <strong>el</strong> ajuste en un período <strong>de</strong><br />
reducción al apoyo en precio y <strong>de</strong> reducciones aranc<strong>el</strong>arias según <strong>el</strong> TLCAN y consiste<br />
en pagos directos realizados a los campesinos <strong>el</strong>egibles a fin <strong>de</strong> compensar la<br />
<strong>de</strong>clinación <strong>de</strong> los precios <strong>de</strong> venta esperada, a condición <strong>de</strong> que la tierra se use <strong>para</strong><br />
producción agrícola o gana<strong>de</strong>ra o se encuentre <strong>de</strong>ntro <strong>de</strong> algún programa ambiental.<br />
Des<strong>de</strong> 1996 también existe un conjunto <strong>de</strong> programas bajo la Alianza <strong>para</strong> El Campo y<br />
la Alianza Contigo <strong>para</strong> reforzar la inversión en áreas rurales pobres, ofreciendo<br />
subsidios sobre todo <strong>para</strong> inversión en <strong>el</strong> campo. El Acuerdo Nacional <strong>para</strong> la<br />
Agricultura <strong>de</strong> 2003 intentó dar respuesta a ciertas inquietu<strong>de</strong>s <strong>de</strong> los campesinos sobre<br />
<strong>el</strong> final <strong><strong>de</strong>l</strong> período <strong>de</strong> transición <strong><strong>de</strong>l</strong> TLCAN.<br />
Las dificulta<strong>de</strong>s <strong>de</strong> estos ajustes han provocado en muchas ocasiones la intervención <strong><strong>de</strong>l</strong><br />
gobierno en la industria, como en <strong>el</strong> caso <strong><strong>de</strong>l</strong> azúcar. Esta industria fue privatizada a principios<br />
<strong>de</strong> los años noventa, se encontró en bancarrota en 2000, junto con la mitad <strong>de</strong> los ingenios y la<br />
entidad nacional <strong>para</strong> <strong>el</strong> financiamiento <strong>de</strong> azúcar (FINA) En 2001, como respuesta a<br />
consi<strong>de</strong>raciones sociales y locales <strong>de</strong> empleo, se expropiaron 27 ingenios (producían la mitad<br />
<strong><strong>de</strong>l</strong> azúcar mexicano) y se creó un fondo <strong>para</strong> facilitar la operación <strong>de</strong> los mismos hasta que<br />
fueran privatizados <strong>de</strong> nuevo.<br />
La estructura <strong>de</strong> la economía agrícola <strong>de</strong> México ha cambiado <strong>de</strong> modo muy dramático <strong>de</strong>s<strong>de</strong><br />
la implantación <strong>de</strong> las reformas. El volumen <strong><strong>de</strong>l</strong> comercio agrícola aumentó sustancialmente,<br />
mostrando cambios en la composición <strong>de</strong> las importaciones y exportaciones mexicanas. Los<br />
efectos combinados <strong>de</strong> la reforma agraria, las reformas <strong>de</strong> mercado y PROCAMPO han sido<br />
negativos <strong>para</strong> los cultivos que se beneficiaban más <strong><strong>de</strong>l</strong> apoyo y protección antes <strong>de</strong> la<br />
implantación <strong>de</strong> las reformas: reducción en la producción y aumento <strong>de</strong> las importaciones,<br />
algún incremento en <strong>el</strong> área <strong>de</strong> la tierra, tal vez algún incremento en inversión, una caída en <strong>el</strong><br />
uso <strong>de</strong> aportes comprados y quizá la caída asociada en los rendimientos <strong>de</strong> los cultivos y, por<br />
último, reducción en <strong>el</strong> empleo.<br />
El empleo agrícola ha sido también fuertemente afectado por las reformas a la política<br />
agrícola. Casi tres millones <strong>de</strong> agricultores en México reciben los pagos <strong>de</strong> PROCAMPO, lo<br />
que sirve como indicador <strong><strong>de</strong>l</strong> total <strong>de</strong> la población <strong>de</strong> trabajadores directamente afectados por<br />
<strong>el</strong> cambio en la estructura <strong>de</strong> apoyo al campo. Más <strong>de</strong> la tercera parte <strong>de</strong> los beneficiarios <strong>de</strong><br />
los pagos <strong>de</strong> PROCAMPO, cerca <strong>de</strong> 1.2 millones <strong>de</strong> agricultores, tiene terrenos <strong>de</strong> maíz <strong>de</strong><br />
menos <strong>de</strong> una hectárea.<br />
Una vía <strong><strong>de</strong>l</strong> ajuste en la caída en <strong>el</strong> empleo agrícola en los hogares fue aumentar <strong>el</strong> tiempo<br />
<strong>de</strong>dicado al trabajo fuera <strong><strong>de</strong>l</strong> campo, mientras permanecían en su comunidad. Sin embargo, la<br />
medida más socorrida en los hogares pobres ha sido <strong>el</strong> aumento significativo <strong>de</strong> la migración<br />
hacia los Estados Unidos. La producción <strong>de</strong> cultivos se ha vu<strong>el</strong>to más intensiva en términos <strong>de</strong><br />
tierra y menos intensiva en términos <strong>de</strong> mano <strong>de</strong> obra. Las importaciones <strong>de</strong> algunos <strong>de</strong> los<br />
principales cultivos han crecido notablemente.<br />
En la tabla 2.1. aparecen los datos <strong><strong>de</strong>l</strong> personal ocupado remunerado por sectores en México<br />
<strong>de</strong> 1970 a 2003 en promedio anual. Se observa como a principios <strong>de</strong> los setenta los sectores<br />
agropecuario y <strong>de</strong> servicios se hallaban bastante equilibrados, siendo <strong>el</strong> sector industrial <strong>el</strong> que
<strong>Potenciales</strong> y <strong>Viabilidad</strong> <strong><strong>de</strong>l</strong> <strong>Uso</strong> <strong>de</strong> <strong>Bioetanol</strong> y <strong>Biodies<strong>el</strong></strong> <strong>para</strong> <strong>el</strong> Transporte en México (SENER-BID-GTZ)<br />
Task 1: Economic Overview<br />
empleaba a menos personal remunerado. En los años posteriores, <strong>el</strong> sector industrial fue<br />
ganando importancia sobre <strong>el</strong> sector agropecuario, superándolo a partir <strong>de</strong> 1991. El sector<br />
servicios ha ocupado <strong>el</strong> primer puesto en todo este período y a partir <strong>de</strong> 2000 empleó<br />
prácticamente al triple <strong>de</strong> personas que <strong>el</strong> agropecuario.<br />
De todo lo expuesto anteriormente cabe afirmar que la agricultura en México ha sufrido un<br />
gran cambio en la última década, con efectos diferenciados <strong>para</strong> la agricultura <strong>de</strong> exportación<br />
–beneficiada en forma neta- y <strong>para</strong> los agricultores campesinos –quienes han sido los gran<strong>de</strong>s<br />
per<strong>de</strong>dores hasta <strong>el</strong> momento. La reforma a las políticas agrícolas en México se asienta sobre<br />
tres pilares:<br />
• un mercado <strong>de</strong> la tierra un poco más activo y seguro <strong>para</strong> la inversión privada.<br />
• la liberalización comercial en <strong>el</strong> contexto <strong>de</strong> la OMC y <strong><strong>de</strong>l</strong> TLCAN, que ha hecho que<br />
los agricultores mexicanos sean más sensibles a las señales <strong>de</strong> precio <strong><strong>de</strong>l</strong> mercado<br />
mundial<br />
• la composición <strong><strong>de</strong>l</strong> apoyo a los productores agrícolas ha cambiado, alejándose <strong>de</strong> los<br />
esquemas <strong>de</strong> apoyo en precio y aportes hacia los pagos al ingreso directo <strong>de</strong><br />
PROCAMPO<br />
9
<strong>Potenciales</strong> y <strong>Viabilidad</strong> <strong><strong>de</strong>l</strong> <strong>Uso</strong> <strong>de</strong> <strong>Bioetanol</strong> y <strong>Biodies<strong>el</strong></strong> <strong>para</strong> <strong>el</strong> Transporte en México (SENER-BID-GTZ)<br />
Task 1: Economic Overview<br />
Tabla 2.1. México: Personal ocupado remunerado por sectores <strong>de</strong> actividad (1970-2003)<br />
(Miles <strong>de</strong> personas ocupadas remuneradas, promedio anual)<br />
Agropecuario Industrial Servicios<br />
Año Total var. Total Minería Manufact. Construcc. Electricidad, Total Comercio, Transporte Financieros, Comunales,<br />
% Gas y Restaurantes Almacenamiento Seguros y Sociales y<br />
B.<br />
anual Agua y Hot<strong>el</strong>es y Comunicac. Inmuebles Personales<br />
1970 1/ 12,863 4,466 2,729 155 1,726 810 38 5,668 2,011 443 229 2,985<br />
1971 13,322 3.57 4,624 2,759 155 1,772 792 40 5,939 2,053 475 238 3,173<br />
1972 13,702 2.85 4,550 2,925 162 1,831 890 42 6,227 2,104 507 249 3,367<br />
1973 14,441 5.39 4,759 3,153 174 1,925 1,010 44 6,529 2,157 538 257 3,577<br />
1974 14,647 1.43 4,503 3,298 186 1,996 1,070 46 6,846 2,202 569 270 3,805<br />
1975 15,296 4.43 4,655 3,386 184 2,002 1,151 49 7,255 2,267 602 282 4,104<br />
1976 15,550 1.66 4,472 3,491 193 2,046 1,200 52 7,587 2,300 642 295 4,350<br />
1977 16,238 4.42 4,897 3,466 197 2,051 1,163 55 7,875 2,345 664 309 4,557<br />
1978 16,844 3.73 4,891 3,715 206 2,133 1,321 55 8,238 2,368 712 327 4,831<br />
1979 17,676 4.94 4,737 4,066 220 2,291 1,497 58 8,873 2,534 780 351 5,208<br />
1980 18,795 6.33 4,901 4,407 240 2,417 1,687 63 9,487 2,637 907 382 5,561<br />
1981 20,043 6.64 5,189 4,752 263 2,542 1,881 66 10,102 2,762 988 425 5,927<br />
1982 19,863 -0.90 5,035 4,606 270 2,485 1,785 66 10,222 2,701 993 454 6,074<br />
1983 19,572 -1.47 5,245 4,063 266 2,310 1,421 66 10,264 2,704 993 466 6,101<br />
1984 20,271 3.57 5,342 4,167 271 2,361 1,467 68 10,762 2,744 1,203 480 6,335<br />
1980 2/ 20,280 5,670 4,661 209 2,441 1,930 81 9,949 2,940 904 352 5,753<br />
1981 21,548 6.25 5,829 5,119 224 2,557 2,252 86 10,600 3,129 972 386 6,113<br />
1982 21,482 -0.31 5,637 5,024 237 2,505 2,193 89 10,821 3,157 1,037 426 6,201<br />
1983 20,995 -2.27 5,874 4,426 238 2,326 1,771 91 10,695 3,072 990 437 6,196<br />
1984 21,482 2.32 5,941 4,605 248 2,374 1,889 94 10,936 3,127 1,006 465 6,338<br />
1985 21,955 2.20 6,096 4,763 258 2,451 1,955 99 11,096 3,147 1,029 470 6,450<br />
1986 21,640 -1.43 5,946 4,653 257 2,404 1,891 101 11,041 3,108 1,035 471 6,427<br />
1987 21,843 0.94 6,020 4,691 267 2,430 1,890 104 11,132 3,153 1,060 479 6,440<br />
1988 21,892 0.22 6,011 4,717 273 2,427 1,910 107 11,164 3,209 1,040 489 6,426<br />
1989 22,279 1.77 6,152 4,750 272 2,428 1,946 104 11,377 3,230 1,070 476 6,601<br />
1988 3/ 24,070 6,261 5,291 184 3,035 1,940 133 12,518 3,922 1,268 495 6,834<br />
1989 24,764 2.88 6,131 5,657 173 3,168 2,179 136 12,976 4,150 1,338 503 6,986<br />
1990 25,958 4.82 6,230 6,125 179 3,275 2,529 142 13,602 4,505 1,438 511 7,148<br />
1991 26,724 2.95 6,215 6,296 176 3,307 2,667 146 14,214 4,772 1,485 529 7,427<br />
1992 27,160 1.63 6,158 6,410 149 3,380 2,734 147 14,592 4,977 1,489 538 7,589<br />
1993 27,467 1.13 6,245 6,427 131 3,310 2,838 148 14,795 5,025 1,499 547 7,725<br />
1994 28,166 2.54 6,319 6,565 125 3,239 3,054 147 15,282 5,177 1,579 556 7,970<br />
1995 27,347 -2.91 6,194 5,986 124 3,067 2,646 149 15,168 5,185 1,521 549 7,914<br />
1996 28,270 3.37 6,309 6,568 124 3,278 3,014 152 15,393 5,191 1,625 562 8,015<br />
1997 29,347 3.81 6,116 7,295 127 3,566 3,447 155 15,935 5,383 1,699 590 8,263<br />
1998 30,635 4.39 6,346 7,784 130 3,773 3,720 161 16,506 5,584 1,791 598 8,533<br />
1999 31,364 2.38 6,392 8,046 130 3,913 3,828 174 16,926 5,768 1,857 602 8,699<br />
2000 32,009 2.06 6,286 8,367 132 4,102 3,957 176 17,357 5,929 1,934 605 8,889<br />
2001 31,827 -0.57 6,356 7,953 129 3,899 3,743 182 17,518 6,079 1,963 612 8,864<br />
2002 31,552 -0.87 6,282 7,730 127 3,637 3,777 188 17,540 6,058 1,919 617 8,947<br />
2003 31,681 0.41 6,370 7,724 127 3,531 3,870 196 17,587 6,116 1,902 615 8,955<br />
Fuente: Centro <strong>de</strong> Estudios <strong>de</strong> las Finanzas Públicas <strong>de</strong> la H. Cámara <strong>de</strong> Diputados, con datos <strong><strong>de</strong>l</strong> INEGI, Sistema <strong>de</strong> Cuentas Nacionales<br />
Nota: El año 2003 es la última información disponible publicada por la fuente oficial que es <strong>el</strong> INEGI.<br />
1/<br />
Serie Histórica 1970-1984 <strong>el</strong>aborada con la Matriz Insumo-Producto <strong>de</strong> 1970.<br />
2/<br />
Serie Histórica 1980-1988 <strong>el</strong>aborada con la Matriz Insumo-Producto <strong>de</strong> 1980.<br />
3/<br />
Serie Histórica 1988-2003 <strong>el</strong>aborada con base al Sistema <strong>de</strong> Cuentas Nacionales <strong>de</strong> México. (Metodología año base 1993).<br />
10
<strong>Potenciales</strong> y <strong>Viabilidad</strong> <strong><strong>de</strong>l</strong> <strong>Uso</strong> <strong>de</strong> <strong>Bioetanol</strong> y <strong>Biodies<strong>el</strong></strong> <strong>para</strong> <strong>el</strong> Transporte en México (SENER-BID-GTZ)<br />
Task 1: Economic Overview<br />
3. El contexto <strong>de</strong>mográfico y <strong><strong>de</strong>l</strong> empleo<br />
México contaba con una población <strong>de</strong> 97,483,412 habitantes <strong>para</strong> <strong>el</strong> año 2000 (INEGI, 2000),<br />
población cuya composición étnica es 60 por ciento <strong>de</strong> mestizos, 30 por ciento amerindios, 9<br />
por ciento europeos y 1 por ciento otros. En la figura 3.1. se observa la evolución <strong>de</strong> la<br />
población mexicana <strong>de</strong>s<strong>de</strong> 1900 a 2000, habiéndose registrado en este período un continuo<br />
crecimiento <strong><strong>de</strong>l</strong> número <strong>de</strong> habitantes, si bien a partir <strong>de</strong> 1970 la tasa <strong>de</strong> crecimiento anual ha<br />
ido disminuyendo <strong>de</strong>s<strong>de</strong> un 3.5% a un 1.6%.<br />
Fuente: SEMARNAT con datos <strong>de</strong> INEGI, XII Censo General <strong>de</strong> Población y Vivienda 2000<br />
Figura 3.1. Evolución <strong>de</strong> la población mexicana (1900 – 2000)<br />
La distribución geográfica <strong>de</strong> la población según Entida<strong>de</strong>s Fe<strong>de</strong>rativas indica que <strong>el</strong> Estado<br />
<strong>de</strong> México engloba <strong>el</strong> mayor número <strong>de</strong> habitantes (13% <strong><strong>de</strong>l</strong> total), seguido por <strong>el</strong> Distrito<br />
Fe<strong>de</strong>ral, Veracruz y Jalisco. El Estado menos poblado es Baja California Sur (0.4% <strong><strong>de</strong>l</strong> total)<br />
(INEGI, 2000). El listado completo se incluye en la tabla 3.1.<br />
11
<strong>Potenciales</strong> y <strong>Viabilidad</strong> <strong><strong>de</strong>l</strong> <strong>Uso</strong> <strong>de</strong> <strong>Bioetanol</strong> y <strong>Biodies<strong>el</strong></strong> <strong>para</strong> <strong>el</strong> Transporte en México (SENER-BID-GTZ)<br />
Task 1: Economic Overview<br />
Tabla 3.1. México: población según Entida<strong>de</strong>s Fe<strong>de</strong>rativas, 2000<br />
Total <strong>de</strong> la población<br />
2000<br />
Total Nacional 97.483.412<br />
01 Aguascalientes 944.285<br />
02 Baja California 2.487.367<br />
03 Baja California Sur 424.041<br />
04 Campeche 690.689<br />
05 Coahuila <strong>de</strong> Zaragoza 2.298.070<br />
06 Colima 542.627<br />
07 Chiapas 3.920.892<br />
08 Chihuahua 3.052.907<br />
09 Distrito Fe<strong>de</strong>ral 8.605.239<br />
10 Durango 1.448.661<br />
11 Guanajuato 4.663.032<br />
12 Guerrero 3.079.649<br />
13 Hidalgo 2.235.591<br />
14 Jalisco 6.322.002<br />
15 México 13.096.686<br />
16 Michoacán <strong>de</strong> Ocampo 3.985.667<br />
17 Mor<strong>el</strong>os 1.555.296<br />
18 Nayarit 920.185<br />
19 Nuevo León 3.834.141<br />
20 Oaxaca 3.438.765<br />
21 Puebla 5.076.686<br />
22 Querétaro <strong>de</strong> Arteaga 1.404.306<br />
23 Quintana Roo 874.963<br />
24 San Luis Potosí 2.299.360<br />
25 Sinaloa 2.536.844<br />
26 Sonora 2.216.969<br />
27 Tabasco 1.891.829<br />
28 Tamaulipas 2.753.222<br />
29 Tlaxcala 962.646<br />
30 Veracruz <strong>de</strong> Ignacio <strong>de</strong> la Llave 6.908.975<br />
31 Yucatán 1.658.210<br />
32 Zacatecas 1.353.610<br />
Fuente: INEGI – XII Censo General <strong>de</strong> Población y Vivienda 2000<br />
12
<strong>Potenciales</strong> y <strong>Viabilidad</strong> <strong><strong>de</strong>l</strong> <strong>Uso</strong> <strong>de</strong> <strong>Bioetanol</strong> y <strong>Biodies<strong>el</strong></strong> <strong>para</strong> <strong>el</strong> Transporte en México (SENER-BID-GTZ)<br />
Task 1: Economic Overview<br />
Esta distribución territorial a<strong>de</strong>más se caracteriza por dos fenómenos <strong>de</strong>mográficos<br />
predominantes: la concentración en gran<strong>de</strong>s ciuda<strong>de</strong>s y la dispersión poblacional. Esta<br />
dualidad se expresa en un alto volumen <strong>de</strong> población localizado en un número reducido <strong>de</strong><br />
ciuda<strong>de</strong>s, al mismo tiempo que se presenta un gran número <strong>de</strong> asentamientos humanos<br />
dispersos a lo largo <strong><strong>de</strong>l</strong> territorio nacional. Por ejemplo, según <strong>el</strong> XII Censo General <strong>de</strong><br />
Población y Vivienda 2000 llevado a cabo por INEGI, 8,034,680 personas habitaban en 2000<br />
en localida<strong>de</strong>s <strong>de</strong> 100 a 499 habitantes, un 8.2% <strong>de</strong> la población total (Tabla 3.2.).<br />
Tabla 3.2. México: total <strong>de</strong> la población según tamaño <strong>de</strong> localidad, 2000 (Localida<strong>de</strong>s <strong>de</strong><br />
1 a 4,999 habitantes)<br />
De 1 - 49<br />
habitantes<br />
De 50 - 99<br />
habitantes<br />
De 100 -<br />
499<br />
habitantes<br />
De 500 -<br />
999<br />
habitantes<br />
De 1000 -<br />
1999<br />
habitantes<br />
De 2000 –<br />
2,499<br />
habitantes<br />
De 2,500<br />
– 4,999<br />
habitantes<br />
Total Nacional 1,483,739 1,104,249 8,034,630 6,109,048 6,180,197 1,811,727 5,462,305<br />
Fuente: INEGI – XII Censo General <strong>de</strong> Población y Vivienda 2000<br />
Por eda<strong>de</strong>s, México se caracteriza por tener una población predominantemente joven.<br />
Aproximadamente <strong>el</strong> 70% se concentra entre los 0 y los 34 años. Por sexos, en 2000 <strong>el</strong> número<br />
<strong>de</strong> mujeres superó al <strong>de</strong> hombres en 2,298.906 personas (INEGI, 2000), ten<strong>de</strong>ncia que se ha<br />
seguido manifestando en <strong>el</strong> transcurso <strong>de</strong> los años (Tabla 3.3.).<br />
De 0 - 4<br />
años<br />
Tabla 3.3. México: total <strong>de</strong> la población por eda<strong>de</strong>s, 2000<br />
De 5 - 9<br />
años<br />
De 10 - 14<br />
años<br />
De 15 -<br />
19 años<br />
De 20 -<br />
24 años<br />
De 25 - 29<br />
años<br />
De 30 - 34<br />
años<br />
De 35 -<br />
39 años<br />
De 40 -<br />
44 años<br />
De 45 -<br />
49 años<br />
De 50 -<br />
54 años<br />
10,635,157 11,215,323 10,736,493 9,992,135 9,071,134 8,157,743 7,136,523 6,352,538 5,194,833 4,072,091 3,357,953<br />
De 55 - 59<br />
años<br />
De 60 - 64<br />
años<br />
De 65 - 69<br />
años<br />
De 70 -<br />
74 años<br />
De 75 -<br />
79 años<br />
De 80 - 84<br />
años<br />
De 85 - 89<br />
años<br />
De 90 -<br />
94 años<br />
De 95 -<br />
99 años<br />
De 100 y<br />
más años<br />
2,559,231 2,198,146 1,660,785 1,245,674 865,270 483,876 290,051 122,006 62,892 19,757<br />
Fuente: INEGI – XII Censo General <strong>de</strong> Población y Vivienda 2000<br />
En <strong>el</strong> período 1990-2000 la evolución <strong>de</strong> las tasas <strong>de</strong> natalidad y mortalidad ha sido<br />
<strong>de</strong>creciente, y la esperanza <strong>de</strong> vida tanto <strong>de</strong> hombres como <strong>de</strong> mujeres ha registrado un<br />
aumento progresivo, situándose la total en 2000 en 74 años, frente a los 71,2 años en 1990<br />
(CONAPO, 2002).<br />
El porcentaje <strong>de</strong> población urbana se situó en 2000 en un 74% (INEGI, 2002). Esta mayor<br />
concentración <strong>de</strong> habitantes en las zonas urbanas se viene observando <strong>de</strong>s<strong>de</strong> los años setenta<br />
(en 1950 la población rural superaba a la urbana y en 1960 estaban prácticamente al mismo<br />
niv<strong>el</strong>). La población campesina está mostrando a su vez un envejecimiento ante la emigración<br />
<strong>de</strong> los jóvenes hacia las ciuda<strong>de</strong>s en busca <strong>de</strong> trabajo.<br />
13
<strong>Potenciales</strong> y <strong>Viabilidad</strong> <strong><strong>de</strong>l</strong> <strong>Uso</strong> <strong>de</strong> <strong>Bioetanol</strong> y <strong>Biodies<strong>el</strong></strong> <strong>para</strong> <strong>el</strong> Transporte en México (SENER-BID-GTZ)<br />
Task 1: Economic Overview<br />
Según datos <strong><strong>de</strong>l</strong> Banco Mundial, <strong>el</strong> total <strong>de</strong> la mano <strong>de</strong> obra en México ha ido creciendo <strong>de</strong>s<strong>de</strong><br />
22 millones <strong>de</strong> personas en 1980 hasta alcanzar 44 millones <strong>de</strong> personas en 2003. El<br />
porcentaje <strong>de</strong> mano <strong>de</strong> obra femenina también ha registrado un aumento en este período (en<br />
2003: 34% <strong><strong>de</strong>l</strong> total). La tasa <strong>de</strong> <strong>de</strong>sempleo ha <strong>de</strong>scendido <strong>de</strong> un 3% en 1990 a un 2.2% en<br />
2000. En 2003 se situó en 2.4%. Analizando la población ocupada por rama <strong>de</strong> actividad, <strong>el</strong><br />
sector servicios es <strong>el</strong> que viene ocupando <strong>el</strong> primer lugar en los últimos años, seguido por <strong>el</strong><br />
comercio. Hasta 2002, sin embargo, <strong>el</strong> segundo puesto fue ocupado por la industria extractiva,<br />
<strong>de</strong> transformación y <strong>el</strong>ectricidad. Las activida<strong>de</strong>s agropecuarias han ido disminuyendo <strong>el</strong><br />
número <strong>de</strong> empleados, si bien su peso como rama <strong>de</strong> actividad en México sigue siendo<br />
<strong>el</strong>evado.<br />
4. El pap<strong>el</strong> <strong>de</strong> los hidrocarburos en la economía mexicana<br />
El sector energético tiene un pap<strong>el</strong> <strong>de</strong>cisivo en México, ya que en él se sustenta en gran<br />
medida su <strong>de</strong>sarrollo económico y social, y abarca <strong>de</strong>s<strong>de</strong> la generación <strong>de</strong> <strong>el</strong>ectricidad e<br />
hidrocarburos como insumos <strong>para</strong> la economía y la prestación <strong>de</strong> servicios públicos, dando<br />
empleo a más <strong>de</strong> 300,000 trabajadores. La comercialización <strong>de</strong> hidrocarburos en <strong>el</strong> plano<br />
internacional es un factor <strong>de</strong>terminante <strong>para</strong> la generación <strong>de</strong> divisas y <strong>de</strong> importantes<br />
contribuciones fiscales <strong>para</strong> <strong>el</strong> gobierno fe<strong>de</strong>ral. En suma, <strong>el</strong> sector energético representa un<br />
espacio económico clave.<br />
México ocupó en 2004 la sexta posición mundial en cuanto a la producción <strong>de</strong> petróleo crudo,<br />
por <strong>de</strong>trás <strong>de</strong> Arabia Saudita, Rusia, Estados Unidos, Irán y China, y la onceava como<br />
productor <strong>de</strong> gas natural (PEMEX, 2005). En la tabla 4.1. se listan los quince mayores<br />
productores <strong>de</strong> petróleo y gas <strong><strong>de</strong>l</strong> mundo.<br />
Tabla 4.1. Producción <strong>de</strong> petróleo crudo, principales países, 2004<br />
País<br />
Miles <strong>de</strong> barriles<br />
diarios<br />
1 Arabia Saudita 8,900<br />
2 Rusia 8,887<br />
3 Estados Unidos <strong>de</strong> América 5,430<br />
4 Irán 3,932<br />
5 China 3,485<br />
6 México 3,383<br />
7 Noruega 2,979<br />
8 Canadá 2,418<br />
9 Emiratos Arabes Unidos 2,355<br />
10 Kuwait 2,345<br />
11 Nigeria 2,343<br />
12 Venezu<strong>el</strong>a 2,208<br />
13 Iraq 2,003<br />
14 Reino Unido 1,888<br />
15 Libia 1,547<br />
TOTAL MUNDIAL 71,160<br />
Fuente: Pemex Anuario Estadístico 2005<br />
14
<strong>Potenciales</strong> y <strong>Viabilidad</strong> <strong><strong>de</strong>l</strong> <strong>Uso</strong> <strong>de</strong> <strong>Bioetanol</strong> y <strong>Biodies<strong>el</strong></strong> <strong>para</strong> <strong>el</strong> Transporte en México (SENER-BID-GTZ)<br />
Task 1: Economic Overview<br />
Producción <strong>de</strong> gas natural, principales países, 2004<br />
País<br />
Millones <strong>de</strong> pies<br />
cúbicos diarios<br />
1 Rusia 58,645<br />
2 Estados Unidos <strong>de</strong> América 53,306<br />
3 Canadá 19,594<br />
4 Reino Unido 9,764<br />
5 Arg<strong>el</strong>ia 8,142<br />
6 Holanda 7,993<br />
7 Noruega 7,401<br />
8 Irán 7,101<br />
9 Indonesia 6,033<br />
10 Arabia Saudita 5,314<br />
11 México 4,573<br />
12 Argentina 4,412<br />
13 Malasia 4,178<br />
14 Emiratos Arabes Unidos 4,098<br />
15 China 3,936<br />
TOTAL MUNDIAL 257,962<br />
Petróleos Mexicanos (PEMEX), cuenta con un monopolio constitucional <strong>para</strong> la explotación<br />
<strong>de</strong> los recursos energéticos <strong><strong>de</strong>l</strong> país (principalmente petróleo y gas) y ostentó en 2003 <strong>el</strong> tercer<br />
puesto <strong>de</strong> entre las principales empresas <strong><strong>de</strong>l</strong> mundo productoras <strong>de</strong> petróleo crudo y <strong>el</strong> noveno<br />
en gas natural. Las reservas probadas <strong>de</strong> petróleo crudo, incluyendo con<strong>de</strong>nsados, se situaron<br />
en 13,401 millones <strong>de</strong> barriles (lugar catorceavo <strong><strong>de</strong>l</strong> ranking mundial, ver tabla 4.2.) y las <strong>de</strong><br />
gas natural en 15 billones <strong>de</strong> pies cúbicos (PEMEX, 2005) en enero <strong>de</strong> 2005.<br />
15
<strong>Potenciales</strong> y <strong>Viabilidad</strong> <strong><strong>de</strong>l</strong> <strong>Uso</strong> <strong>de</strong> <strong>Bioetanol</strong> y <strong>Biodies<strong>el</strong></strong> <strong>para</strong> <strong>el</strong> Transporte en México (SENER-BID-GTZ)<br />
Task 1: Economic Overview<br />
Tabla 4.2. Reservas probadas <strong>de</strong> petróleo crudo, principales países, a 1 <strong>de</strong> enero <strong>de</strong> 2005<br />
País<br />
Millones <strong>de</strong><br />
barriles<br />
1 Arabia Saudita 259,400<br />
2 Canadá 178,800<br />
3 Irán 125,800<br />
4 Irak 115,000<br />
5 Kuwait 99,000<br />
6 Emiratos Árabes Unidos 97,800<br />
7 Venezu<strong>el</strong>a 77,226<br />
8 Rusia 60,000<br />
9 Libia 39,000<br />
10 Nigeria 35,255<br />
11 Estados Unidos <strong>de</strong> América 21,891<br />
12 China 18,250<br />
13 Qatar 15,207<br />
14 México 13,401*<br />
15 Arg<strong>el</strong>ia 11,800<br />
TOTAL MUNDIAL 1,277,702<br />
Fuente: Pemex Anuario Estadístico 2005<br />
* Incluye con<strong>de</strong>nsados<br />
La <strong>de</strong>manda nacional <strong>de</strong> petrolíferos promedio entre 1994 y 2004 fue <strong>de</strong> 1,308 miles <strong>de</strong><br />
barriles diarios <strong>de</strong> petróleo crudo equivalente (mbdpce), registrando un crecimiento <strong>de</strong> 3.1%<br />
en 2004 (1,358.7 mbdpce) con respecto a 2003 (Secretaría <strong>de</strong> Energía, 2005). El sector<br />
transporte constituye <strong>el</strong> principal consumidor <strong>de</strong> petrolíferos con 853.5 mbdpce (2004), valor<br />
que supone <strong>el</strong> 62.8% <strong><strong>de</strong>l</strong> total, habiendo aumentado un 5.8% en com<strong>para</strong>ción a 2003. El sector<br />
<strong>el</strong>éctrico ocupó <strong>el</strong> segundo lugar, con una participación <strong><strong>de</strong>l</strong> 22.7% <strong>el</strong> total. En cuanto al<br />
consumo <strong>de</strong> combustibles, las gasolinas fueron <strong>el</strong> mayor insumo energético <strong><strong>de</strong>l</strong> sector<br />
transporte y según su niv<strong>el</strong> <strong>de</strong> <strong>de</strong>manda <strong>el</strong> segundo petrolífero fue <strong>el</strong> combustóleo.<br />
La incorporación <strong>de</strong> procesos más eficientes y <strong>el</strong> mayor procesamiento <strong>de</strong> crudo Maya han<br />
sido algunas <strong>de</strong> las razones que han permitido incrementar <strong>de</strong> forma sostenida la <strong>el</strong>aboración<br />
<strong>de</strong> petrolíferos <strong>de</strong>s<strong>de</strong> 2000 hasta 2004, situándose ésta en 1,189 mbdpce. El petrolífero <strong>de</strong><br />
mayor producción correspon<strong>de</strong> al combustóleo, aunque su participación en la oferta interna<br />
disminuyó durante ese período. No obstante, en <strong>el</strong> caso <strong>de</strong> las gasolinas, su participación<br />
aumentó en 2.1% entre 1994 y 2004.<br />
16
<strong>Potenciales</strong> y <strong>Viabilidad</strong> <strong><strong>de</strong>l</strong> <strong>Uso</strong> <strong>de</strong> <strong>Bioetanol</strong> y <strong>Biodies<strong>el</strong></strong> <strong>para</strong> <strong>el</strong> Transporte en México (SENER-BID-GTZ)<br />
Task 1: Economic Overview<br />
En términos <strong>de</strong> comercio exterior, a pesar <strong>de</strong> las disminuciones que se registraron entre 2000<br />
y 2003, en 2004 ascendió la importación <strong>de</strong> petrolíferos en 16.8 mbdpce con respecto al año<br />
anterior <strong>de</strong>bido a que la oferta nacional <strong>de</strong> petrolíferos no pudo satisfacer <strong>el</strong> aumento <strong>de</strong> la<br />
<strong>de</strong>manda. Por su parte, las exportaciones <strong>de</strong> petrolíferos se redujeron fundamentalmente por la<br />
disminución <strong>de</strong> las ventas <strong>de</strong> combustóleo al exterior.<br />
Según los resultados <strong><strong>de</strong>l</strong> estudio “Prospectiva <strong>de</strong> petrolíferos 2005-2014” llevado a cabo por la<br />
Secretaría <strong>de</strong> Energía, se pronostica que al final <strong><strong>de</strong>l</strong> período se presente un incremento <strong><strong>de</strong>l</strong><br />
20% <strong>de</strong> la <strong>de</strong>manda, siendo los principales combustibles <strong>de</strong> la <strong>de</strong>manda nacional las gasolinas,<br />
<strong>el</strong> combustóleo y <strong>el</strong> dies<strong>el</strong>. Se prevé que <strong>el</strong> procesamiento <strong><strong>de</strong>l</strong> crudo crezca en un 34.5%.<br />
La tasa <strong>de</strong> crecimiento anual <strong>de</strong> la economía mexicana registrada en 2004, facilitada por <strong>el</strong><br />
proceso <strong>de</strong> recuperación global <strong>de</strong> la actividad económica, tuvo también su reflejo en la<br />
<strong>de</strong>manda nacional <strong>de</strong> gas natural durante 2004, registrando un aumento <strong>de</strong> 8.2% con<br />
respecto a 2003. El consumo interno <strong>de</strong> gas natural creció 77.7% en <strong>el</strong> período 1994-2004. Por<br />
sectores, <strong>el</strong> consumo en 2004 se estructuró <strong>de</strong> la siguiente forma: 40.4% sector petrolero,<br />
35.9% sector <strong>el</strong>éctrico, 21.8% sector industrial y <strong>el</strong> resto correspondió al sector resi<strong>de</strong>ncial,<br />
servicios y transporte. El estudio “Prospectiva <strong><strong>de</strong>l</strong> mercado <strong>de</strong> gas natural 2005-2014”<br />
realizado por la Secretaría <strong>de</strong> Energía estima que la <strong>de</strong>manda nacional en ese período crecerá<br />
en un promedio anual <strong>de</strong> 5.2% al pasar <strong>de</strong> 5,722 mmpcd en 2004 a 9,493 mmpcd en 2014.<br />
Por lo que respecta al gas LP, alre<strong>de</strong>dor <strong><strong>de</strong>l</strong> 70% <strong>de</strong> los hogares mexicanos consumen este<br />
combustible, hecho que <strong>de</strong>staca su carácter predominantemente social. De 1995 a 2005 <strong>el</strong><br />
consumo nacional <strong><strong>de</strong>l</strong> gas LP creció en un promedio <strong>de</strong> 2.8% anual y se pronostica que la<br />
<strong>de</strong>manda interna durante <strong>el</strong> período 2005-2014 aumente a una tasa <strong>de</strong> 1.4% anual, pasando <strong>de</strong><br />
334.4 miles <strong>de</strong> barriles diarios (mbd) en 2005 a 383.5 mbd en 2014.<br />
Dos graves problemas <strong>de</strong> la situación energética actual <strong>de</strong> México son: a) la creciente<br />
<strong>de</strong>pen<strong>de</strong>ncia <strong>de</strong> productos petrolíferos terminados <strong><strong>de</strong>l</strong> exterior; y b) la escasa diversificación<br />
<strong>de</strong> la oferta energética. Por un lado, existe una <strong>de</strong>manda creciente <strong>de</strong> productos energéticos<br />
terminados que <strong>el</strong> país es incapaz <strong>de</strong> cubrir únicamente con su producción nacional. De hecho<br />
existe una situación exce<strong>de</strong>ntaria <strong>de</strong> energía primaria (crudo), pero una falta <strong>de</strong> energéticos<br />
terminados (<strong>para</strong> uso doméstico, gasolinas, etc.), que <strong>de</strong>ben ser importados. La principal causa<br />
<strong>de</strong> fondo es la falta <strong>de</strong> inversión en aumentar la capacidad <strong>de</strong> refinación <strong><strong>de</strong>l</strong> país.<br />
La falta <strong>de</strong> diversificación <strong>de</strong> la oferta energética es también preocupante. El 90% <strong><strong>de</strong>l</strong><br />
consumo <strong>de</strong> energía primaria correspon<strong>de</strong> a los hidrocarburos y entre <strong>el</strong>los casi <strong>el</strong> 72% al<br />
petróleo crudo. Según cifras <strong>de</strong> 2004, la producción total <strong>de</strong> energía primaria se situó en<br />
10,333,774 petajoules, un 2.6% más que en 2003 (Secretaría <strong>de</strong> Energía, 2005). En contraste,<br />
las energías renovables tienen un rol marginal. La biomasa (que incluye leña y bagazo <strong>de</strong><br />
caña) ocupó únicamente un 3.4% <strong>de</strong> la oferta energética. Con excepción <strong>de</strong> la hidroenergía,<br />
otras fuentes <strong>de</strong> energía renovable como la geotermia o energía eólica participaron en un<br />
pequeño porcentaje en a producción <strong>de</strong> <strong>el</strong>ectricidad primaria (Tabla 4.3. y Figura 4.1.).<br />
17
<strong>Potenciales</strong> y <strong>Viabilidad</strong> <strong><strong>de</strong>l</strong> <strong>Uso</strong> <strong>de</strong> <strong>Bioetanol</strong> y <strong>Biodies<strong>el</strong></strong> <strong>para</strong> <strong>el</strong> Transporte en México (SENER-BID-GTZ)<br />
Task 1: Economic Overview<br />
Tabla 4.3. Producción <strong>de</strong> energía primaria en México 2003-2004 (Petajoules)<br />
Producción <strong>de</strong> energía primaria (Petajoules)<br />
2003 2004 Variación<br />
porcentual<br />
2004/2003<br />
Estructura porcentual<br />
2003<br />
%<br />
2004<br />
Total 10,064.352 10,330.774 2.6 100.0 100.0<br />
Carbón 192.888 198.847 3.1 1.9 1.9<br />
Hidrocarburos 9,143.659 9,359.645 2.4 90.9 90.6<br />
Petróleo crudo 7,228.465 7,432.559 2.8 71.8 71.9<br />
Con<strong>de</strong>nsados 153.169 178.345 16.4 1.5 1.7<br />
Gas no asociado 475.847 564.511 18.6 4.7 5.5<br />
Gas asociado 1,286.178 1,184.230 -7.9 12.8 11.5<br />
Electricidad primaria 381.646 421.809 10.5 3.8 4.1<br />
Nucleoenergía 114.871 100.634 -12.4 1.1 1.0<br />
Hidroenergía 205.059 254.391 24.1 2.0 2.5<br />
Geoenergía 61.664 66.722 8.2 0.6 0.6<br />
Energía eólica 0.052 0.061 17.3 n.s. n.s.<br />
Biomasa 346.159 350.474 1.2 3.4 3.4<br />
Bagazo <strong>de</strong> caña 89.417 92.063 3.0 0.9 0.9<br />
Leña 256.742 258.411 0.6 2.6 2.5<br />
Fuente: Sistema <strong>de</strong> Información Energética (SIE), Sener<br />
n.s.: no significativo<br />
La suma <strong>de</strong> los parciales pue<strong>de</strong> no coincidir con los totales, <strong>de</strong>bido al redon<strong>de</strong>o <strong>de</strong> las cifras<br />
%<br />
3.4% 1.9%<br />
4.1%<br />
90.6%<br />
Hidrocarburos<br />
Electricidad*<br />
Biomasa**<br />
Carbón<br />
Fuente: Sistema <strong>de</strong> Información Energética (SIE), Sener<br />
* Incluye hidroenergía (2.5%), nucleoenergía (1.0%), geoenergía (0.6%) y energía eólica (n.s.) evaluados en su<br />
equivalente primario<br />
** Incluye leña (2.5%) y bagazo <strong>de</strong> caña (0.9%)<br />
n.s.: no significativo<br />
La suma <strong>de</strong> los parciales pue<strong>de</strong> no coincidir con los totales, <strong>de</strong>bido al redon<strong>de</strong>o <strong>de</strong> las cifras<br />
Figura 4.1. Estructura <strong>de</strong> la producción <strong>de</strong> energía primaria en México, 2004 (10,330.774<br />
Petajoules)<br />
18
<strong>Potenciales</strong> y <strong>Viabilidad</strong> <strong><strong>de</strong>l</strong> <strong>Uso</strong> <strong>de</strong> <strong>Bioetanol</strong> y <strong>Biodies<strong>el</strong></strong> <strong>para</strong> <strong>el</strong> Transporte en México (SENER-BID-GTZ)<br />
Task 1: Economic Overview<br />
Es clave la implementación <strong>de</strong> políticas más <strong>de</strong>cididas y coordinadas <strong>de</strong> promoción <strong><strong>de</strong>l</strong> uso <strong>de</strong><br />
energías alternativas a las fuentes convencionales, así como una legislación nacional que<br />
fomente y regule dicha utilización. La diversificación es particularmente importante en <strong>el</strong><br />
sector transporte, que actualmente <strong>de</strong>pen<strong>de</strong> enteramente <strong>de</strong> los hidrocarburos.<br />
5. El pap<strong>el</strong> <strong><strong>de</strong>l</strong> comercio exterior y la situación <strong>de</strong> la balanza <strong>de</strong> pagos en la economía<br />
mexicana<br />
México tiene una balanza comercial <strong>de</strong>ficitaria. En 2005 <strong>el</strong> déficit <strong>de</strong> la cuenta corriente <strong>de</strong> la<br />
balanza <strong>de</strong> pagos <strong>de</strong> México, medido tanto en dólares como con r<strong>el</strong>ación al PIB, resultó <strong>de</strong><br />
5,708 millones <strong>de</strong> dólares, monto equivalente a 0.74% <strong><strong>de</strong>l</strong> PIB (BANCO DE MÉXICO, 2006).<br />
Tales cifras se com<strong>para</strong>n con los déficit observados en 2003 y 2004 <strong>de</strong> 8,621 y 7,180 millones,<br />
que como proporción <strong><strong>de</strong>l</strong> PIB se ubicaron respectivamente en 1.4 y 1.1 por ciento. Asimismo,<br />
en 2005, al igual que ocurrió en <strong>el</strong> año prece<strong>de</strong>nte, <strong>el</strong> saldo <strong>de</strong>ficitario <strong>de</strong> la cuenta corriente<br />
fue financiado con holgura con recursos <strong>de</strong> largo plazo (Tabla 5.1.).<br />
Tabla 5.1. Balanza <strong>de</strong> pagos en 2005<br />
Cuenta Corriente <strong>de</strong> la Balanza <strong>de</strong> Pagos<br />
Millones <strong>de</strong> dólares<br />
2004 (Anual) 2005 (Anual)<br />
Cuenta Corriente -7,180 -5,708<br />
Balanza Comercial -8,811 -7,559<br />
Exportaciones 187,999 213,711<br />
Importaciones 196,810 221,270<br />
Servicios No Factoriales -4,649 -5,231<br />
Servicios Factoriales -10,763 -13,402<br />
Transferencias 17,043 20,484<br />
Balanza Comercial No<br />
-21,413 -23,170<br />
Petrolera<br />
Fuente: Banco <strong>de</strong> México, 2006<br />
La disminución <strong><strong>de</strong>l</strong> déficit <strong>de</strong> la cuenta corriente en 2005 con r<strong>el</strong>ación a su niv<strong>el</strong> en 2004<br />
respondió principalmente a dos factores: un aumento <strong><strong>de</strong>l</strong> saldo superavitario <strong>de</strong> la balanza<br />
comercial <strong>de</strong> productos petroleros y mayores ingresos por concepto <strong>de</strong> remesas familiares.<br />
En 2005 <strong>el</strong> valor <strong>de</strong> las exportaciones ascendió a 213,711 millones <strong>de</strong> dólares, lo que implicó<br />
un crecimiento anual <strong>de</strong> 13.7 por ciento. Dicho incremento se <strong>de</strong>rivó <strong>de</strong> la combinación <strong>de</strong><br />
alzas <strong>de</strong> 34.8 por ciento <strong>de</strong> las exportaciones petroleras y <strong>de</strong> 10.6 por ciento <strong>de</strong> las no<br />
petroleras. El <strong>el</strong>evado crecimiento <strong>de</strong> las petroleras reflejó <strong>el</strong> importante aumento que presentó<br />
en <strong>el</strong> año <strong>el</strong> precio internacional <strong><strong>de</strong>l</strong> petróleo. Por su parte, <strong>el</strong> crecimiento <strong>de</strong> las exportaciones<br />
no petroleras resultó menor al observado en 2004. Ello respondió tanto a un menor dinamismo<br />
<strong>de</strong> la <strong>de</strong>manda externa en <strong>el</strong> conjunto <strong><strong>de</strong>l</strong> año, como a la persistente pérdida <strong>de</strong> competitividad<br />
<strong>de</strong> los productos nacionales en los mercados externos<br />
19
<strong>Potenciales</strong> y <strong>Viabilidad</strong> <strong><strong>de</strong>l</strong> <strong>Uso</strong> <strong>de</strong> <strong>Bioetanol</strong> y <strong>Biodies<strong>el</strong></strong> <strong>para</strong> <strong>el</strong> Transporte en México (SENER-BID-GTZ)<br />
Task 1: Economic Overview<br />
El valor <strong>de</strong> las importaciones <strong>de</strong> mercancías en 2005 sumó 221,270 millones <strong>de</strong> dólares, cifra<br />
que implicó un crecimiento anual <strong>de</strong> 12.4 por ciento, una tasa menor a la registrada <strong>el</strong> año<br />
previo (<strong>de</strong> 15.4 por ciento). Tal evolución reflejó principalmente una <strong>de</strong>sac<strong>el</strong>eración <strong>de</strong> las<br />
adquisiciones <strong>de</strong> bienes intermedios que, a su vez, respondió tanto a un menor dinamismo <strong>de</strong><br />
la producción <strong>para</strong> <strong>el</strong> mercado interno, como a la menor expansión que registraron las<br />
exportaciones manufactureras en cuya fabricación se utilizan insumos importados. Cabe<br />
señalar que <strong>el</strong> incremento <strong>de</strong> las importaciones totales en 2005 se <strong>de</strong>rivó <strong>de</strong> crecimientos<br />
respectivos <strong>de</strong> 9.9, 24 y 16 por ciento <strong>de</strong> las importaciones <strong>de</strong> bienes intermedios, <strong>de</strong> consumo<br />
y <strong>de</strong> capital.<br />
En cuanto a la estructura <strong>de</strong> las exportaciones e importaciones <strong>de</strong> mercancías, tomando como<br />
referencia <strong>el</strong> mes <strong>de</strong> enero <strong>de</strong> 2006, más <strong>de</strong> tres cuartas partes <strong><strong>de</strong>l</strong> valor <strong>de</strong> las exportaciones<br />
que efectuó México estuvieron integradas por productos manufacturados. En enero <strong>de</strong> 2006 <strong>el</strong><br />
valor <strong>de</strong> las importaciones <strong>de</strong> mercancías se ubicó en 18,762 millones <strong>de</strong> dólares, lo que<br />
representó un aumento anual <strong>de</strong> 22.9 por ciento, cifra que implicó un incremento a tasa anual<br />
<strong>de</strong> 22.9 por ciento. En ese mes <strong>el</strong> valor <strong>de</strong> las importaciones <strong>de</strong> bienes intermedios fue <strong>de</strong><br />
14,008 millones <strong>de</strong> dólares, cifra 21.5% superior a la <strong>de</strong> enero <strong>de</strong> 2005.<br />
La composición <strong>de</strong> las exportaciones e importaciones <strong>de</strong> mercancías en enero pasado se ilustra<br />
en la Figura 5.1.:<br />
EXPORTACIONES<br />
IMPORTACIONES<br />
Petroleras<br />
18.1%<br />
Extractivas<br />
0.4%<br />
Agropecuaria<br />
s 4.5%<br />
Bienes <strong>de</strong><br />
Consumo<br />
13.1%<br />
Bienes <strong>de</strong><br />
Capital<br />
12.2%<br />
Manufacture<br />
ras 77%<br />
Bienes<br />
Intermedios<br />
74.7%<br />
Figura 5.1. Composición <strong>de</strong> las exportaciones e importaciones <strong>de</strong> mercancías, enero 2006<br />
Observando la evolución <strong>de</strong> las exportaciones e importaciones petroleras y agropecuarias<br />
(Figura 5.2.), <strong>de</strong>staca <strong>el</strong> hecho <strong>de</strong> que <strong>el</strong> valor tanto <strong>de</strong> las entradas como <strong>de</strong> las salidas <strong>de</strong><br />
productos petrolíferos se sitúa muy por encima <strong>de</strong> las <strong>de</strong> productos agropecuarios, sobre todo a<br />
partir <strong>de</strong> 2000. Las exportaciones agropecuarias entre 2004 y 2006 han ido en aumento, al<br />
contrario que las importaciones. La ten<strong>de</strong>ncia <strong>de</strong> las petroleras, por su parte, ha sido<br />
ascen<strong>de</strong>nte tanto en entradas como en salidas.<br />
20
<strong>Potenciales</strong> y <strong>Viabilidad</strong> <strong><strong>de</strong>l</strong> <strong>Uso</strong> <strong>de</strong> <strong>Bioetanol</strong> y <strong>Biodies<strong>el</strong></strong> <strong>para</strong> <strong>el</strong> Transporte en México (SENER-BID-GTZ)<br />
Task 1: Economic Overview<br />
EXPORTACIONES PETROLERAS Y AGROPECUARIAS (ENERO 1996 -<br />
ENERO 2006) Millones <strong>de</strong> dólares<br />
5,000<br />
4,500<br />
4,000<br />
872.2<br />
3,500<br />
3,000<br />
2,500<br />
2,000<br />
1,500<br />
1,000<br />
500<br />
0<br />
523.9<br />
579.4<br />
497.4<br />
502.7<br />
461.8<br />
462.6<br />
3,474.3<br />
435.4<br />
501.4<br />
448.5<br />
406.2 1,879.3 1,986.4<br />
1,081.5<br />
1,293.9<br />
1,193.0<br />
803.5<br />
906.8<br />
1,729.2<br />
824.0<br />
505.0<br />
1996 1997 1998 1999 2000 2001 2002 2003 2004 2005 2006<br />
Petroleras Agropecuarias<br />
IMPORTACIONES PETROLERAS Y AGROPECUARIAS (ENERO 1996 -<br />
ENERO 2006) Millones <strong>de</strong> dólares<br />
1,600<br />
1,400<br />
1,200<br />
392.8<br />
1,000<br />
800<br />
600<br />
400<br />
200<br />
0<br />
369.5<br />
441.0<br />
433.5<br />
306.0<br />
360.1<br />
362.8<br />
984.6<br />
343.8 264.8<br />
282.9<br />
689.9<br />
650.0 702.2<br />
533.7<br />
396.1<br />
390.9<br />
219.2<br />
276.1<br />
229.6<br />
0<br />
1996 1997 1998 1999 2000 2001 2002 2003 2004 2005 2006<br />
Petroleras Agropecuarias<br />
Fuente: Centro <strong>de</strong> Estudios <strong>de</strong> las Finanzas Públicas, sobre la base <strong>de</strong> información <strong><strong>de</strong>l</strong> Banco <strong>de</strong> México,<br />
INEGI, SHCP y la Secretaría <strong>de</strong> Economía, última actualización 2 <strong>de</strong> marzo <strong>de</strong> 2006<br />
Figura 5.2. Evolución <strong>de</strong> las exportaciones e importaciones petroleras y agropecuarias en<br />
millones <strong>de</strong> dólares (mes <strong>de</strong> enero 1996 – 2006)<br />
21
<strong>Potenciales</strong> y <strong>Viabilidad</strong> <strong><strong>de</strong>l</strong> <strong>Uso</strong> <strong>de</strong> <strong>Bioetanol</strong> y <strong>Biodies<strong>el</strong></strong> <strong>para</strong> <strong>el</strong> Transporte en México (SENER-BID-GTZ)<br />
Task 1: Economic Overview<br />
En 2005 <strong>el</strong> ingreso <strong>de</strong> recursos al país por concepto <strong>de</strong> remesas familiares ascendió a 20,035<br />
millones <strong>de</strong> dólares, con un incremento <strong>de</strong> 20.6 por ciento con respecto al dato <strong>de</strong> 2004. Esta<br />
entrada <strong>de</strong> recursos fue equivalente a 2.6 puntos porcentuales <strong><strong>de</strong>l</strong> PIB y superó al saldo<br />
superavitario <strong>de</strong> la balanza comercial <strong>de</strong> productos petroleros, al igual que al flujo <strong>de</strong> inversión<br />
extranjera directa y a los ingresos provenientes <strong>de</strong> los viajeros internacionales que visitan <strong>el</strong><br />
país.<br />
La cuenta <strong>de</strong> capital <strong>de</strong> la balanza <strong>de</strong> pagos mostró en 2005 un superávit <strong>de</strong> 13,826 millones <strong>de</strong><br />
dólares. Este saldo se <strong>de</strong>rivó en lo principal por entradas <strong>de</strong> 2 recursos provenientes <strong>de</strong><br />
inversión extranjera, tanto directa como <strong>de</strong> cartera, y <strong>de</strong> financiamiento externo dirigido al<br />
sector privado no bancario y a proyectos Pidiregas. En <strong>el</strong> año <strong>de</strong> referencia <strong>el</strong> sector público y<br />
la banca comercial se <strong>de</strong>sen<strong>de</strong>udaron con <strong>el</strong> exterior y hubo un aumento <strong>de</strong> los activos en <strong>el</strong><br />
exterior propiedad <strong>de</strong> resi<strong>de</strong>ntes en México. La economía mexicana recibió en 2005 un flujo<br />
<strong>de</strong> inversión extranjera directa (IED) <strong>de</strong> 17,805 millones <strong>de</strong> dólares, monto muy cercano al<br />
observado en <strong>el</strong> año previo.<br />
En resumen, en 2005 la balanza <strong>de</strong> pagos <strong>de</strong> México se caracterizó en su conjunto por lo<br />
siguiente: déficit <strong>de</strong> la cuenta corriente por 5,708 millones <strong>de</strong> dólares, superávit <strong>de</strong> la cuenta<br />
<strong>de</strong> capital por 13,826 millones, un flujo negativo <strong>de</strong> 953 millones en <strong>el</strong> renglón <strong>de</strong> errores y<br />
omisiones y un incremento <strong>de</strong> la reserva internacional neta <strong><strong>de</strong>l</strong> Banco <strong>de</strong> México por 7,173<br />
millones <strong>de</strong> dólares. Como resultado <strong>de</strong> esto último, <strong>el</strong> saldo <strong>de</strong> dicha reserva se ubicó al cierre<br />
<strong><strong>de</strong>l</strong> año pasado en 68,669 millones <strong>de</strong> dólares.<br />
6. Participación <strong>de</strong> México en tratados <strong>de</strong> libre comercio: oportunidad <strong>para</strong> una<br />
economía con <strong>el</strong> etanol como combustible<br />
México cuenta con acceso seguro y preferencial a los mercados <strong>de</strong> 42 países (consi<strong>de</strong>rando a<br />
los diez países que ingresaron en la Unión Europa <strong>el</strong> 1 <strong>de</strong> mayo <strong>de</strong> 2004) en tres continentes.<br />
En <strong>el</strong> cuadro siguiente se especifican los tratados <strong>de</strong> libre comercio <strong>de</strong> los que México es<br />
miembro <strong>de</strong>s<strong>de</strong> 1986 hasta nuestros días:<br />
22
<strong>Potenciales</strong> y <strong>Viabilidad</strong> <strong><strong>de</strong>l</strong> <strong>Uso</strong> <strong>de</strong> <strong>Bioetanol</strong> y <strong>Biodies<strong>el</strong></strong> <strong>para</strong> <strong>el</strong> Transporte en México (SENER-BID-GTZ)<br />
Task 1: Economic Overview<br />
ALADI<br />
Panamá<br />
GATT<br />
(OMC)<br />
ALADI<br />
Chile<br />
APEC<br />
TLCAN<br />
EUA<br />
Canadá<br />
OCDE<br />
TLC G3<br />
Colombia<br />
Venezu<strong>el</strong>a<br />
TLC<br />
Bolivia<br />
TLC<br />
Costa<br />
Rica<br />
ALADI<br />
Ecuador<br />
ALADI<br />
Cuba<br />
ALADI<br />
Uruguay<br />
TLC<br />
Nicaragua<br />
ALADI<br />
Argentina<br />
TLC<br />
Chile<br />
ALADI<br />
Paraguay<br />
ALADI<br />
Perú<br />
TLC<br />
Isra<strong>el</strong><br />
TLC<br />
UE*<br />
TLC AELC<br />
Islandia<br />
Liechtenstein<br />
Noruega<br />
Suiza<br />
TLC TN<br />
Guatemala<br />
Honduras<br />
Salvador<br />
ALADI<br />
Brasil<br />
ALADI<br />
MERCOSUR<br />
(A. Marco)<br />
ALADI<br />
MERCOSUR<br />
(Automotor)<br />
TLC<br />
Uruguay<br />
1986 1992 1993 1994 1995 1998 1999 2000 2001 2002 2003<br />
*UE: Alemania, Austria, Bélgica, Dinamarca, España, Finlandia, Francia, Grecia, Irlanda, Italia, Luxemburgo,<br />
Países Bajos, Portugal, Reino Unido y Suecia<br />
Figura 6.1. Cronología <strong>de</strong> la política <strong>de</strong> apertura <strong>de</strong> México<br />
En los últimos años, México se ha convertido en la octava potencia comercial mundial y la<br />
primera en América Latina, con una participación <strong><strong>de</strong>l</strong> 44% en las exportaciones y 49% en las<br />
importaciones totales <strong>de</strong> la región.<br />
En 2003, las exportaciones totales <strong>de</strong> bienes mexicanos sumaron 164.9 mil millones <strong>de</strong> dólares<br />
(mmd), un 2.5% más que en 2002 y más <strong><strong>de</strong>l</strong> triple que en 2003. El principal mercado <strong>para</strong> las<br />
exportaciones mexicanas es Estados Unidos, país que participa con un 88.7% <strong><strong>de</strong>l</strong> valor <strong>de</strong><br />
2003, seguido <strong>de</strong> la Unión Europea (3.4%), Canadá (1.7%) y Aruba (0.4%) (SECRETARÍA<br />
DE ECONOMÍA, 2004).<br />
En cuanto a las importaciones, en 2003 los 170.6 mil millones <strong>de</strong> dólares <strong>de</strong> compras totales<br />
que México realizó al resto <strong><strong>de</strong>l</strong> mundo representan un incremento <strong>de</strong> 1.1% en com<strong>para</strong>ción<br />
con 2002, y equivalen a 2.61 veces las registradas en 1993. D<strong>el</strong> valor total <strong>de</strong> las<br />
importaciones mexicanas <strong>de</strong> 2003 <strong>el</strong> 87% correspon<strong>de</strong> a bienes intermedios y bienes <strong>de</strong><br />
capital. Los principales países proveedores <strong>de</strong> México son: Estados Unidos (61.8% <strong><strong>de</strong>l</strong> valor<br />
<strong>de</strong> 2003), la Unión Europea (10.6%), China (5.5%), Japón (4.4%) y Canadá (2.4%).<br />
23
<strong>Potenciales</strong> y <strong>Viabilidad</strong> <strong><strong>de</strong>l</strong> <strong>Uso</strong> <strong>de</strong> <strong>Bioetanol</strong> y <strong>Biodies<strong>el</strong></strong> <strong>para</strong> <strong>el</strong> Transporte en México (SENER-BID-GTZ)<br />
Task 1: Economic Overview<br />
Entre 1993 y 2003 los sectores con mayor participación en las exportaciones mexicanas, son<br />
también los que han presentado las mayores tasas <strong>de</strong> crecimiento promedio anual: Eléctrico y<br />
Electrónico (17.0%), Textil y Confección (16.4%) y Equipos <strong>de</strong> Transporte y Autopartes<br />
(13.0%). Por lo que respecta a las importaciones, los sectores con las mayores tasas <strong>de</strong><br />
crecimiento promedio anual fueron: Eléctrico y Electrónico (10.1%) y Metal básico (11.6%).<br />
En los últimos años, México ha reformado su Ley <strong>de</strong> Inversión Extranjera (LIE) y suscrito<br />
diversos tratados <strong>de</strong> libre comercio y Acuerdos <strong>para</strong> la Promoción y Protección Recíproca <strong>de</strong><br />
las Inversiones (APPRIs) <strong>para</strong> abrir nuevas oportunida<strong>de</strong>s <strong>de</strong> inversión y otorgar mayor<br />
certidumbre y seguridad jurídica a los inversionistas nacionales y extranjeros. Estas medidas<br />
han aumentado significativamente <strong>el</strong> atractivo <strong>de</strong> invertir en <strong>el</strong> país, y han contribuido a<br />
incrementar la r<strong>el</strong>ación retorno-riesgo <strong>para</strong> <strong>el</strong> inversionista.<br />
Como resultado <strong>de</strong> la apertura en <strong>el</strong> comercio y la inversión, en <strong>el</strong> período 1994-2000 las<br />
exportaciones constituyeron un pilar fundamental en <strong>el</strong> crecimiento económico y la generación<br />
<strong>de</strong> empleo en México. El aumento <strong>de</strong> las exportaciones contribuyó con más <strong>de</strong> la mitad <strong><strong>de</strong>l</strong><br />
crecimiento <strong><strong>de</strong>l</strong> PIB y uno <strong>de</strong> cada dos empleos generados estuvo r<strong>el</strong>acionado con la actividad<br />
exportadora. No obstante, la marcha poco favorable <strong>de</strong> las exportaciones durante 2001-2003 y<br />
la <strong>de</strong>pen<strong>de</strong>ncia <strong><strong>de</strong>l</strong> PIB <strong><strong>de</strong>l</strong> comercio exterior (30%) han hecho que las ventas al exterior ya<br />
contribuyan en forma muy <strong>de</strong>terminante a la recuperación y crecimiento <strong>de</strong> la economía en su<br />
conjunto.<br />
Por su pap<strong>el</strong> como instrumento clave <strong>para</strong> incrementar los flujos <strong>de</strong> comercio e inversión entre<br />
México, Estados Unidos y Canadá y convertir a Norteamérica en una <strong>de</strong> las regiones<br />
comerciales más dinámicas e integradas <strong><strong>de</strong>l</strong> mundo, se analiza a continuación más en <strong>de</strong>talle <strong>el</strong><br />
Tratado <strong>de</strong> Libre Comercio <strong>de</strong> América <strong><strong>de</strong>l</strong> Norte (TLCAN) o North American Free Tra<strong>de</strong><br />
Agreement (NAFTA).<br />
Firmado por México, Estados Unidos y Canadá <strong>el</strong> 17 <strong>de</strong> diciembre <strong>de</strong> 1992, si bien no entró<br />
en vigor hasta <strong>el</strong> 1 <strong>de</strong> enero <strong>de</strong> 1994, este Tratado creó una “zona <strong>de</strong> libre comercio” entre<br />
estos tres países al establecer las reglas que <strong>de</strong>finirían la forma y <strong>el</strong> momento <strong>de</strong> <strong>el</strong>iminar las<br />
barreras aranc<strong>el</strong>arias y conseguir así la libre circulación <strong>de</strong> los productos y servicios en<br />
América <strong><strong>de</strong>l</strong> Norte. El Tratado también propugnó la existencia <strong>de</strong> la protección y<br />
cumplimiento <strong>de</strong> los <strong>de</strong>rechos <strong>de</strong> propiedad int<strong>el</strong>ectual.<br />
En los doce años <strong>de</strong> vigencia <strong><strong>de</strong>l</strong> TLCAN <strong>el</strong> comercio trilateral se ha triplicado, situándose en<br />
promedio en más <strong>de</strong> 2,000 millones <strong>de</strong> dólares diarios. En <strong>el</strong> caso <strong>de</strong> México, su economía<br />
creció 39.8% en términos reales, crecimiento impulsado por las exportaciones. Entre 1993 y<br />
2005 <strong>el</strong> valor <strong>de</strong> las exportaciones <strong>de</strong> México a sus socios TLCAN se multiplicó por 4, <strong>para</strong><br />
alcanzar 182 mil millones <strong>de</strong> dólares en 2005. Esto le permitió pasar <strong>de</strong> una balanza comercial<br />
<strong>de</strong>ficitaria a un superávit con respecto a sus socios <strong>de</strong> 57.8 miles <strong>de</strong> millones <strong>de</strong> dólares en<br />
2005 (SECRETARÍA DE ECONOMÍA, 2004).<br />
En cuanto a las importaciones mexicanas provenientes <strong>de</strong> Estados Unidos y Canadá, en 2005<br />
ascendieron a 124.4 mil millones <strong>de</strong> dólares. Esta cifra supone un incremento <strong>de</strong> 168% durante<br />
la vigencia <strong><strong>de</strong>l</strong> Tratado y casi <strong>el</strong> 90% <strong>de</strong> los productos son bienes intermedios y <strong>de</strong> capital. El<br />
TLCAN ha permitido ampliar las opciones <strong>de</strong> consumo en México, propiciando que los<br />
productos ofrezcan una mayor calidad y precios más competitivos. Como contrapartida, y<br />
24
<strong>Potenciales</strong> y <strong>Viabilidad</strong> <strong><strong>de</strong>l</strong> <strong>Uso</strong> <strong>de</strong> <strong>Bioetanol</strong> y <strong>Biodies<strong>el</strong></strong> <strong>para</strong> <strong>el</strong> Transporte en México (SENER-BID-GTZ)<br />
Task 1: Economic Overview<br />
<strong>de</strong>s<strong>de</strong> la perspectiva <strong>de</strong> la producción nacional, <strong>de</strong>be mencionarse la <strong>de</strong>saparición progresiva y<br />
obligada <strong>de</strong> los mercados <strong>de</strong> muchos productos al no po<strong>de</strong>r competir con los precios y calidad<br />
<strong>de</strong> los importados.<br />
Asimismo, los flujos <strong>de</strong> la inversión extranjera directa han registrado un aumento<br />
significativo, concentrándose principalmente en servicios financieros, comercio y la industria<br />
automotriz. Durante la vigencia <strong><strong>de</strong>l</strong> TLCAN la productividad <strong>de</strong> los trabajadores mexicanos en<br />
la industria manufacturera se ha incrementado en 69.6%. En la actualidad, uno <strong>de</strong> cada seis<br />
empleos está r<strong>el</strong>acionado con la actividad exportadora.<br />
Analizando <strong>el</strong> sector agropecuario, <strong>el</strong> hecho <strong>de</strong> que <strong>el</strong> TLCAN fuese <strong>el</strong> primer Tratado<br />
comercial en <strong>el</strong> mundo que integró en un sólo mercado a dos países <strong>de</strong>sarrollados con una<br />
nación en <strong>de</strong>sarrollo, mostró la insuficiencia <strong>de</strong> las negociaciones, pues estas resultaron<br />
asimétricas. En efecto, se incluyó a todo <strong>el</strong> comercio agropecuario y agroindustrial entre las<br />
Partes Contratantes sin distinción, es <strong>de</strong>cir, ningún producto quedó excluido <strong><strong>de</strong>l</strong> Tratado y <strong>para</strong><br />
<strong>el</strong> caso <strong>de</strong> México, los márgenes <strong>de</strong> protección <strong>para</strong> sus bienes agropecuarios estuvieron muy<br />
por <strong>de</strong>bajo <strong>de</strong> los niv<strong>el</strong>es internacionales. En concreto, <strong>el</strong> período <strong>de</strong> transición <strong>para</strong> la<br />
<strong>el</strong>iminación <strong>de</strong> aranc<strong>el</strong>es por parte <strong>de</strong> México a la mayoría <strong>de</strong> los productos agrícolas<br />
proce<strong>de</strong>ntes <strong>de</strong> países <strong><strong>de</strong>l</strong> TLC expiraba a finales <strong>de</strong> 2002. Las únicas excepciones se hicieron<br />
con cuatro productos importantes <strong>para</strong> México, <strong>para</strong> los que la total <strong>el</strong>iminación <strong>de</strong> aranc<strong>el</strong>es<br />
se retrasó hasta 2008: maíz, azúcar, leche en polvo y frijoles secos, mientras que Estados<br />
Unidos incluyó importaciones provenientes <strong>de</strong> México <strong>de</strong> azúcar, cacahuates, concentrado <strong>de</strong><br />
jugo <strong>de</strong> naranja cong<strong>el</strong>ado y jugo <strong>de</strong> naranja no concentrado.<br />
El azúcar es socialmente sensible, pues su producción se concentra ampliamente en unos<br />
cuantos estados, don<strong>de</strong> muchos pequeños productores <strong>de</strong>pen<strong>de</strong>n <strong>de</strong> la producción <strong>de</strong> la caña <strong>de</strong><br />
azúcar. Los exce<strong>de</strong>ntes <strong>de</strong> producción mexicana están engrosando p<strong>el</strong>igrosamente los<br />
inventarios nacionales al grado <strong>de</strong> que <strong>el</strong> precio se <strong>de</strong>splome o comiencen a generarse los<br />
<strong>de</strong>spidos masivos en <strong>el</strong> sector. El sindicato azucarero consi<strong>de</strong>ra que se <strong>de</strong>be exigir <strong>el</strong><br />
cumplimiento <strong>de</strong> los acuerdos pactados en <strong>el</strong> Tratado y que la situación <strong><strong>de</strong>l</strong> sector está<br />
atravesando un momento crítico, sobre todo a raíz <strong>de</strong> que la OMC <strong>de</strong>terminara que es<br />
improce<strong>de</strong>nte <strong>el</strong> impuesto que estableció <strong>el</strong> gobierno <strong>de</strong> México a los productos <strong>el</strong>aborados<br />
con alta fructosa, lo que propiciará que los productores nacionales se inclinen más por este<br />
producto, proce<strong>de</strong>nte en su mayoría <strong>de</strong> Estados Unidos, y se <strong>de</strong>splace al azúcar nacional. Por<br />
<strong>el</strong>lo plantean la necesidad <strong>de</strong> promover la generación <strong>de</strong> nuevos productos <strong>de</strong>rivados <strong>de</strong> la<br />
caña, como <strong>el</strong> etanol.<br />
A pesar <strong>de</strong> los altibajos que ha enfrentado, la industria azucarera y alcoholera en México, aún<br />
mantiene una posición importante en <strong>el</strong> sector agroindustrial, actualmente se cultivan más <strong>de</strong><br />
650 mil hectáreas <strong>de</strong> caña <strong>de</strong> azúcar <strong>de</strong> don<strong>de</strong> se extrae la materia prima <strong>para</strong> la fabricación <strong>de</strong><br />
alcohol etílico. La producción <strong>de</strong> alcohol etílico en México prácticamente mantiene una<br />
ten<strong>de</strong>ncia <strong>de</strong>scen<strong>de</strong>nte en los últimos diez años, en tanto que la <strong>de</strong>manda ha crecido<br />
consi<strong>de</strong>rablemente, por lo que se han tenido que importar cantida<strong>de</strong>s cada vez mayores <strong>de</strong><br />
alcohol originario <strong>de</strong> Estados Unidos.<br />
25
<strong>Potenciales</strong> y <strong>Viabilidad</strong> <strong><strong>de</strong>l</strong> <strong>Uso</strong> <strong>de</strong> <strong>Bioetanol</strong> y <strong>Biodies<strong>el</strong></strong> <strong>para</strong> <strong>el</strong> Transporte en México (SENER-BID-GTZ)<br />
Task 1: Economic Overview<br />
En <strong>el</strong> crecimiento que han registrado las importaciones en los últimos cinco años, la apertura<br />
comercial ha <strong>de</strong>sempeñado un pap<strong>el</strong> importante. Los acuerdos adoptados en <strong>el</strong> TLCAN<br />
permitieron que México <strong>de</strong>sgravara totalmente, aún antes <strong>de</strong> la entrada en vigor <strong><strong>de</strong>l</strong> mismo<br />
Tratado, la fracción 22.07.10.01 (Alcohol etílico sin <strong>de</strong>snaturalizar con un grado alcohólico<br />
volumétrico superior o igual a 80% vol.), por lo que Estados Unidos y Canadá pue<strong>de</strong>n<br />
exportar libremente a México este tipo <strong>de</strong> alcohol. La fracción 22.07.20.01 (Alcohol etílico y<br />
aguardientes <strong>de</strong>snaturalizados, <strong>de</strong> cualquier graduación) se <strong>de</strong>sgravó totalmente en un plazo <strong>de</strong><br />
cinco años a partir <strong>de</strong> la entrada en vigor <strong><strong>de</strong>l</strong> Tratado, es <strong>de</strong>cir, dicha fracción quedó<br />
totalmente liberalizada <strong>para</strong> las importaciones originarias <strong>de</strong> Estados Unidos, a partir <strong><strong>de</strong>l</strong> 1 <strong>de</strong><br />
enero <strong>de</strong> 1998.<br />
En <strong>el</strong> programa <strong>de</strong> diversificación <strong>de</strong> la agroindustria cañera, produciendo etanol <strong>para</strong> fines<br />
tanto energéticos como industriales, es fundamental que se establezca un precio mínimo a la<br />
caña <strong>de</strong> azúcar que se <strong>de</strong>stine a la producción <strong>de</strong> etanol, tomando en consi<strong>de</strong>ración <strong>el</strong><br />
quebranto <strong>de</strong> las exportaciones y la conveniencia <strong>de</strong> no limitar la superficie cañera en cultivo.<br />
A<strong>de</strong>más <strong>de</strong> que los precios dificultan la competitividad <strong><strong>de</strong>l</strong> sector, se necesitaría diversificar,<br />
reconvertir y hacer eficientes sus procesos, <strong>para</strong> po<strong>de</strong>r situar la caña <strong>de</strong> azúcar producida en<br />
México <strong>de</strong> manera competitiva en la apertura total <strong><strong>de</strong>l</strong> mercado azucarero, prevista en <strong>el</strong><br />
TLCAN <strong>para</strong> aplicarse en 2008. Como ejemplo <strong>de</strong> esta situación, la conversión m<strong>el</strong>aza-etanol<br />
en Brasil tiene una eficiencia <strong><strong>de</strong>l</strong> 48% versus 30% como promedio en los procesos mexicanos.<br />
La cuestión <strong>de</strong> la energía se contempla en <strong>el</strong> TLCAN en su capítulo sexto, estableciendo<br />
disposiciones sobre bienes energéticos y petroquímicos básicos, que incluye carbón y gas <strong>de</strong><br />
carbón, petróleo crudo y <strong>de</strong>rivados petroleros, gas natural, uranio, <strong>el</strong>ectricidad, gases <strong>de</strong><br />
petróleo propano, butano y etanol y algunos petroquímicos primarios, etileno, propileno,<br />
butileno y butadieno. El TLCAN <strong>de</strong>fine normas <strong>de</strong> competencia y abre ciertos mercados <strong>de</strong><br />
energía con México, respetando <strong>el</strong> monopolio <strong>de</strong> PEMEX así como señalando ciertas<br />
restricciones; también estimula a los inversionistas con la promesa <strong>de</strong> que México continuará<br />
con la apertura a la inversión extranjera <strong><strong>de</strong>l</strong> sector. Con la intención <strong>de</strong> lograr la <strong>de</strong>sregulación<br />
<strong><strong>de</strong>l</strong> sector en México, <strong>el</strong> Tratado aumentó la competitividad integrando un mercado energético<br />
<strong>de</strong> Norteamérica.<br />
El Gobierno <strong>de</strong> México ha <strong>de</strong>clarado en múltiples ocasiones que no va a privatizar ninguna <strong>de</strong><br />
las compañías manejadas por <strong>el</strong> Estado (PEMEX y CFE); no obstante, existe una apertura a la<br />
inversión privada <strong>para</strong> la construcción <strong>de</strong> plantas en <strong>el</strong> campo <strong><strong>de</strong>l</strong> petróleo o en la generación<br />
<strong>de</strong> energía. Como parte <strong><strong>de</strong>l</strong> programa <strong>de</strong> reestructuración <strong>de</strong> la industria en los próximos diez<br />
años, la posibilidad <strong>de</strong> agregar la producción <strong>de</strong> gasolina o etanol <strong>de</strong> la industria <strong><strong>de</strong>l</strong> azúcar es<br />
contemplada por <strong>el</strong> Gobierno, si bien es clave que la rentabilidad <strong>de</strong> este proceso que<strong>de</strong><br />
constatada.<br />
26
7. Bibliografía<br />
<strong>Potenciales</strong> y <strong>Viabilidad</strong> <strong><strong>de</strong>l</strong> <strong>Uso</strong> <strong>de</strong> <strong>Bioetanol</strong> y <strong>Biodies<strong>el</strong></strong> <strong>para</strong> <strong>el</strong> Transporte en México (SENER-BID-GTZ)<br />
Task 1: Economic Overview<br />
Banco <strong>de</strong> México. 2006. Comunicado <strong>de</strong> prensa 24 <strong>de</strong> febrero <strong>de</strong> 2006 (www.banxico.org.<br />
mx)<br />
Banco Interamericano <strong>de</strong> Desarrollo. Departamento Regional <strong>de</strong> Operaciones II. 2005.<br />
Situación económica y perspectivas. Istmo Centroamericano, México, Haití y República<br />
Dominicana, pp. 51-54.<br />
Centro <strong>de</strong> Estudios <strong>de</strong> las Finanzas Públicas <strong>de</strong> la H. Cámara <strong>de</strong> Diputados:<br />
(www.cefp.gob.mx)<br />
Centro <strong>de</strong> Estudios <strong>de</strong> las Finanzas Públicas <strong>de</strong> la H. Cámara <strong>de</strong> Diputados. 2002. La industria<br />
alcoholera <strong>de</strong> México ante la apertura comercial.<br />
Consejo Nacional <strong>de</strong> Ciencia y Tecnología (CONACYT). 2006. Anexo. Fondo Mixto<br />
CONACYT – Gobierno <strong><strong>de</strong>l</strong> Estado <strong>de</strong> Veracruz <strong>de</strong> Ignacio <strong>de</strong> la Llave. Convocatoria 2006-<br />
01. Demandas específicas. Área 1. Desarrollo y Transferencia <strong>de</strong> Tecnología al sector<br />
agropecuario y pesquero.<br />
Consejo Nacional <strong>de</strong> Población (CONAPO). 2002. Proyecciones <strong>de</strong> la población <strong>de</strong> México y<br />
<strong>de</strong> las entida<strong>de</strong>s fe<strong>de</strong>rativas, 2002 (www.conapo.gob.mx)<br />
Foro OCDE México. 2004. Políticas agrícolas y <strong>el</strong> <strong>de</strong>sarrollo <strong>de</strong> México.<br />
Instituto Nacional <strong>de</strong> Estadística, Geografía e Informática (INEGI (www.inegi.gob.mx)<br />
Instituto Nacional <strong>de</strong> Estadística, Geografía e Informática (INEGI). 2000. XII Censo General<br />
<strong>de</strong> Población y Vivienda 2000.<br />
Instituto Nacional <strong>para</strong> <strong>el</strong> Fe<strong>de</strong>ralismo y <strong>el</strong> Desarrollo Municipal (www.e-local.gob.mx)<br />
Petróleos Mexicanos. 2005. Anuario Estadístico 2005. Com<strong>para</strong>ciones Internacionales.<br />
Presi<strong>de</strong>ncia <strong>de</strong> la República (www.presi<strong>de</strong>ncia.gob.mx)<br />
Secretaría <strong>de</strong> Economía. Subsecretaría <strong>de</strong> Negociaciones Comerciales Internacionales:<br />
(www.economia-snci.gob.mx)<br />
Secretaría <strong>de</strong> Energía. 2004. Balance nacional <strong>de</strong> energía 2004.<br />
Secretaría <strong>de</strong> Energía. 2005. Prospectiva <strong>de</strong> petrolíferos 2005-2014.<br />
Secretaría <strong>de</strong> Energía. 2005. Prospectiva <strong><strong>de</strong>l</strong> mercado <strong>de</strong> gas natural 2005-2014.<br />
Secretaría <strong>de</strong> Medio Ambiente y Recursos Naturales (SEMARNAT). Bases <strong>de</strong> datos <strong><strong>de</strong>l</strong><br />
Sistema Nacional <strong>de</strong> Información Ambiental y <strong>de</strong> Recursos Naturales<br />
The World Bank Group. 2003. Gen<strong>de</strong>rStats Database of gen<strong>de</strong>r statistics.<br />
(http://<strong>de</strong>vdata.worldbank.org/gen<strong>de</strong>rstats/home.asp)<br />
Vázquez Domínguez, E. 2006. Conferencia Comentarios acerca <strong>de</strong> la situación petrolera<br />
actual. Área <strong>de</strong> refinación.<br />
27
Task 2 & Task A: Mexico’s energy picture with regard to<br />
bioethanol and biodies<strong>el</strong><br />
Nicolás Rodríguez Martínez
<strong>Potenciales</strong> y <strong>Viabilidad</strong> <strong><strong>de</strong>l</strong> <strong>Uso</strong> <strong>de</strong> <strong>Bioetanol</strong> y <strong>Biodies<strong>el</strong></strong> <strong>para</strong> <strong>el</strong> Transporte en México (SENER-BID-GTZ)<br />
Task 2 & Task A: Mexico’s energy picture with regard to bioethanol and biodies<strong>el</strong><br />
Índice<br />
1. Introducción<br />
2. Balance Nacional <strong>de</strong> Energía<br />
3. Legislaciones y regulaciones que afectan <strong>el</strong> mercado <strong>de</strong> energía<br />
4. Evolución <strong>de</strong> la oferta y <strong>de</strong>manda <strong>de</strong> combustibles líquidos (gasolinas y dies<strong>el</strong>) <strong>para</strong> <strong>el</strong><br />
transporte en <strong>el</strong> período 2000-2005<br />
4.1 Evolución <strong>de</strong> la oferta y <strong>de</strong>manda <strong>de</strong> gasolinas<br />
4.2 Evolución <strong>de</strong> la oferta y <strong>de</strong>manda <strong>de</strong> dies<strong>el</strong><br />
5. Instalaciones petroleras<br />
5.1 Sistema Nacional <strong>de</strong> refinación (SNR)<br />
5.2 Rendimientos <strong>de</strong> producción observados en <strong>el</strong> SNR<br />
6. Capacidad instalada <strong>de</strong> la producción <strong>de</strong> éteres <strong>para</strong> la oxigenación <strong>de</strong> gasolinas en <strong>el</strong><br />
SNR<br />
7. Evolución <strong>de</strong> los precios <strong>de</strong> importación <strong>de</strong> gasolinas y componentes<br />
8. Mecanismo <strong>para</strong> la <strong>de</strong>terminación <strong>de</strong> los precios al público <strong>de</strong> los combustibles <strong>para</strong> <strong>el</strong><br />
transporte<br />
9. Escenarios <strong>para</strong> la evaluación <strong>de</strong> la factibilidad <strong><strong>de</strong>l</strong> empleo <strong>de</strong> los biocombustibles<br />
9.1 Escenarios <strong><strong>de</strong>l</strong> <strong>Bioetanol</strong><br />
9.1.1 Pronóstico <strong>de</strong> <strong>de</strong>manda <strong>de</strong> gasolinas <strong>para</strong> <strong>el</strong> período 2006-2014<br />
9.1.2 Contenido máximo <strong>de</strong> oxígeno <strong>de</strong> los compuestos oxigenados<br />
9.1.3 Consumo <strong>de</strong> metanol y etanol <strong>para</strong> la producción <strong>de</strong> éteres<br />
9.1.4 Pronóstico <strong>de</strong> <strong>de</strong>manda <strong>de</strong> compuestos oxigenados <strong>para</strong> <strong>el</strong> período<br />
2006-2014<br />
9.1.5 Inversiones <strong>para</strong> la conversión <strong>de</strong> las instalaciones actuales <strong>de</strong><br />
producción <strong>de</strong> éteres en <strong>el</strong> SNR<br />
9.1.6 Implicaciones <strong>de</strong> la formulación <strong>de</strong> mezclas <strong>de</strong> etanol con gasolinas
<strong>Potenciales</strong> y <strong>Viabilidad</strong> <strong><strong>de</strong>l</strong> <strong>Uso</strong> <strong>de</strong> <strong>Bioetanol</strong> y <strong>Biodies<strong>el</strong></strong> <strong>para</strong> <strong>el</strong> Transporte en México (SENER-BID-GTZ)<br />
Task 2 & Task A: Mexico’s energy picture with regard to bioethanol and biodies<strong>el</strong><br />
9.2 Escenarios <strong><strong>de</strong>l</strong> <strong>Biodies<strong>el</strong></strong><br />
9.2.1 Pronóstico <strong>de</strong> <strong>de</strong>manda <strong>de</strong> dies<strong>el</strong> en período 2006-2014<br />
9.2.2 Implicaciones <strong><strong>de</strong>l</strong> mezclado <strong>de</strong> biodies<strong>el</strong> con dies<strong>el</strong> <strong><strong>de</strong>l</strong> petróleo<br />
9.2.3 Evaluación <strong>de</strong> la viabilidad económica<br />
9.2.4 Pronóstico <strong>de</strong> <strong>de</strong>manda <strong>de</strong> biodies<strong>el</strong><br />
10. Conclusiones y recomendaciones<br />
10.1 Recomendaciones<br />
10.1.1 <strong>Bioetanol</strong><br />
10.1.2 <strong>Biodies<strong>el</strong></strong><br />
10.2 Conclusiones<br />
10.2.1 S<strong>el</strong>ección <strong>de</strong> precios <strong>para</strong> la evaluación técnico-económica <strong>de</strong> la<br />
viabilidad <strong><strong>de</strong>l</strong> proyecto <strong>de</strong> biocombustibles<br />
10.2.2 Consumo estimado <strong>de</strong> bioetanol en cada escenario<br />
10.2.3 Consumo estimado <strong>de</strong> biodies<strong>el</strong> en cada escenario<br />
11. Bibliografía<br />
11.1 Sitios en internet<br />
11.2 Presentaciones<br />
11.3 Documentos <strong>el</strong>ectrónicos
<strong>Potenciales</strong> y <strong>Viabilidad</strong> <strong><strong>de</strong>l</strong> <strong>Uso</strong> <strong>de</strong> <strong>Bioetanol</strong> y <strong>Biodies<strong>el</strong></strong> <strong>para</strong> <strong>el</strong> Transporte en México (SENER-BID-GTZ)<br />
Task 2 & Task A: Mexico’s energy picture with regard to bioethanol and biodies<strong>el</strong><br />
1. Introducción<br />
La Secretaría <strong>de</strong> Energía (SENER) en conjunto con <strong>el</strong> Banco Interamericano <strong>de</strong> Desarrollo<br />
(BID), la Agencia Alemana <strong>de</strong> Cooperación Técnica (GTZ), invitaron al Instituto Mexicano<br />
<strong><strong>de</strong>l</strong> Petróleo (IMP), a colaborar en <strong>el</strong> estudio <strong>para</strong> <strong>de</strong>terminar la viabilidad <strong><strong>de</strong>l</strong> empleo <strong>de</strong><br />
biocombustibles en México.<br />
Al IMP se le asignó la actividad 2 concerniente al tema <strong><strong>de</strong>l</strong> consumo <strong>de</strong> energía en México, en<br />
particular la <strong>de</strong>stinada al transporte, <strong>para</strong> <strong>el</strong>lo se incluyó <strong>de</strong>ntro <strong>de</strong> las tareas <strong>el</strong> análisis <strong><strong>de</strong>l</strong><br />
balance <strong>de</strong> energía nacional, las leyes y reglamentos que se aplican al sector <strong>de</strong> los<br />
hidrocarburos.<br />
A<strong>de</strong>más, se requirió analizar la evolución <strong>de</strong> la oferta y <strong>de</strong>manda <strong>de</strong> los combustibles <strong>para</strong> <strong>el</strong><br />
transporte en los últimos cinco años, <strong>el</strong> volumen y composición <strong><strong>de</strong>l</strong> crudo procesado en las<br />
refinerías mexicanas, los rendimientos <strong>de</strong> los <strong>de</strong>rivados <strong><strong>de</strong>l</strong> petróleo obtenidos y la situación<br />
<strong>de</strong> la producción <strong>de</strong> éteres empleados en la formulación <strong>de</strong> las gasolinas.<br />
Para establecer la factibilidad <strong><strong>de</strong>l</strong> empleo <strong>de</strong> biocombustibles se establecieron tres diferentes<br />
escenarios, a través <strong>de</strong> los cuáles se <strong>de</strong>terminaron las necesida<strong>de</strong>s <strong>de</strong> suministro tanto <strong>de</strong><br />
compuestos oxigenados como <strong>de</strong> biodies<strong>el</strong>, tomando como referencia los pronósticos <strong>de</strong><br />
ventas <strong>de</strong> gasolinas y dies<strong>el</strong> proporcionados por PEMEX Refinación, <strong>para</strong> con toda<br />
información establecer los volúmenes <strong>de</strong> biocombustibles que podrían requerirse en México.<br />
Con toda esta información se establecen una serie <strong>de</strong> recomendaciones <strong>de</strong> acciones que se<br />
<strong>de</strong>berían llevar a cabo como complemento a las evaluaciones realizadas, las cuáles tienen<br />
como objetivo establecer con precisión todas aqu<strong>el</strong>las implicaciones que se <strong>de</strong>rivarían <strong><strong>de</strong>l</strong><br />
empleo <strong>de</strong> los biocombustibles.<br />
2. Balance Nacional <strong>de</strong> Energía<br />
El balance nacional <strong>de</strong> energía <strong><strong>de</strong>l</strong> año 2004, publicado en <strong>el</strong> sitio <strong>de</strong> la Secretaría <strong>de</strong> Energía<br />
(SENER), www.energía.gob.mx, indica que en términos <strong>de</strong> la producción <strong>de</strong> energía primaria,<br />
ésta está sustentada en los hidrocarburos, situación similar se refleja en <strong>el</strong> mercado <strong>de</strong><br />
exportación <strong>de</strong> la misma, en don<strong>de</strong> <strong>el</strong> petróleo crudo ocupa <strong>el</strong> mayor niv<strong>el</strong> <strong>de</strong> participación.<br />
Por <strong>el</strong> lado <strong><strong>de</strong>l</strong> comercio exterior neto <strong>de</strong> energía secundaria, los rubros <strong>de</strong> mayor contribución<br />
a la oferta nacional correspon<strong>de</strong>n a las gasolinas y <strong>el</strong> gas natural, seguido <strong><strong>de</strong>l</strong> gas licuado <strong><strong>de</strong>l</strong><br />
petróleo.<br />
Por <strong>el</strong> lado <strong>de</strong> consumo total final <strong>de</strong> energía, los resultados nos indican que <strong>el</strong> uso energético<br />
se sitúa en <strong>el</strong> 93.6 por ciento; en éste se incluye <strong>el</strong> sector resi<strong>de</strong>ncial, comercial y público, <strong>el</strong><br />
<strong>de</strong> transporte, <strong>el</strong> industrial y <strong>el</strong> agrícola. La diferencia 6.4 por ciento, se <strong>de</strong>stina al no<br />
energético, en don<strong>de</strong> su <strong>de</strong>stino son los centros <strong>de</strong> transformación <strong>de</strong> PEMEX Petroquímica y<br />
otras industrias que emplean como materia prima.<br />
1
<strong>Potenciales</strong> y <strong>Viabilidad</strong> <strong><strong>de</strong>l</strong> <strong>Uso</strong> <strong>de</strong> <strong>Bioetanol</strong> y <strong>Biodies<strong>el</strong></strong> <strong>para</strong> <strong>el</strong> Transporte en México (SENER-BID-GTZ)<br />
Task 2 & Task A: Mexico’s energy picture with regard to bioethanol and biodies<strong>el</strong><br />
En términos <strong><strong>de</strong>l</strong> consumo final energético los <strong>de</strong>rivados <strong><strong>de</strong>l</strong> petróleo (gasolinas, dies<strong>el</strong>, gas lp,<br />
gas natural, combustóleo, coque <strong><strong>de</strong>l</strong> petróleo y querosenos), toman cerca <strong><strong>de</strong>l</strong> 76 por ciento <strong>de</strong><br />
la <strong>de</strong>manda; la diferencia 24 por ciento está siendo atendida por la leña, <strong>el</strong> bagazo <strong>de</strong> caña, <strong>el</strong><br />
coque <strong>de</strong> carbón y <strong>el</strong> carbón. En <strong>el</strong> sector no energético, la distribución por área <strong>de</strong> consumo<br />
se ubica <strong>de</strong> la siguiente manera: <strong>el</strong> resi<strong>de</strong>ncial, comercial y público ocupan <strong>el</strong> 21 por ciento, <strong>el</strong><br />
<strong><strong>de</strong>l</strong> transporte <strong>el</strong> 46 por ciento, <strong>el</strong> industrial <strong>el</strong> 30 por ciento y <strong>el</strong> agrícola <strong>el</strong> 3 por ciento.<br />
Así en <strong>el</strong> sector transporte las gasolinas y <strong>el</strong> dies<strong>el</strong> se emplean en <strong>el</strong> 90.5 por ciento y la<br />
diferencia; 9.5 por ciento utilizan querosenos, combustóleo, gas lp y <strong>el</strong>ectricidad.<br />
En las figuras 1.1 a 1.10, así como en las tablas 1.1 a 1.4 se presenta la información <strong>de</strong>tallada<br />
<strong>de</strong> lo <strong>de</strong>scrito en los párrafos anteriores sobre <strong>el</strong> balance <strong>de</strong> energía.<br />
Figura 1.1 Estructura <strong>de</strong> la Producción <strong>de</strong> Energía Primaria<br />
1.9% 100 %<br />
3.4%<br />
4.1 %<br />
90.6 %<br />
Hidrocarburos Electricidad(1) Biomasa(2) Carbón Total<br />
Notas:<br />
Fuente Sistema <strong>de</strong> Información Energética (SIE) SENER<br />
(1) Incluye: hidroenergía 2.5%, nucleoenergía 1.0%, geoenergía 0.6% y energía eólica (no significativa) evaluados en su<br />
equivalente primario.<br />
(2) Incluye: leña 2.5% y bagazo <strong>de</strong> caña 0.0%.<br />
2
<strong>Potenciales</strong> y <strong>Viabilidad</strong> <strong><strong>de</strong>l</strong> <strong>Uso</strong> <strong>de</strong> <strong>Bioetanol</strong> y <strong>Biodies<strong>el</strong></strong> <strong>para</strong> <strong>el</strong> Transporte en México (SENER-BID-GTZ)<br />
Task 2 & Task A: Mexico’s energy picture with regard to bioethanol and biodies<strong>el</strong><br />
Tabla 1.1 Contribución por Fuente a la Producción <strong>de</strong> Energía Primaria<br />
Fuente<br />
Contribución, petajoules<br />
Carbón 198.847<br />
Hidrocarburos:<br />
9,359.645<br />
Petróleo crudo<br />
7,432.559<br />
Con<strong>de</strong>nsados<br />
178.345<br />
Gas no asociado<br />
564.511<br />
Gas asociado<br />
1,184.230<br />
Electricidad primaria:<br />
Nucleoenergía<br />
Hidroenergía<br />
Geoenergía<br />
Energía eólica<br />
421.809<br />
100.634<br />
254.391<br />
66.722<br />
0.061<br />
Biomasa:<br />
350.474<br />
Bagazo <strong>de</strong> caña<br />
92.053<br />
Leña<br />
258.411<br />
Total: 10,330.774<br />
Tabla 1.2 Comercio Exterior <strong>de</strong> Energía Primaria<br />
Exportaciones, petajoules<br />
Importaciones, petajoules<br />
Fuente Contribución Contribución Saldo neto<br />
Carbón 0.032 109.149 - 109.117<br />
Petróleo crudo 4,338.100 0.000 + 4,338.100<br />
Con<strong>de</strong>nsados 2.456 0.000 + 2.456<br />
Totales 4,340.588 109.149 + 4,231.468<br />
La oferta interna <strong>de</strong> energía interna bruta, es <strong>el</strong> resultado <strong>de</strong> la oferta total menos las<br />
exportaciones, la energía no aprovechada y las operaciones <strong>de</strong> maquila-intercambio neto.<br />
3
<strong>Potenciales</strong> y <strong>Viabilidad</strong> <strong><strong>de</strong>l</strong> <strong>Uso</strong> <strong>de</strong> <strong>Bioetanol</strong> y <strong>Biodies<strong>el</strong></strong> <strong>para</strong> <strong>el</strong> Transporte en México (SENER-BID-GTZ)<br />
Task 2 & Task A: Mexico’s energy picture with regard to bioethanol and biodies<strong>el</strong><br />
Figura 1.2 Oferta Interna <strong>de</strong> Energía Bruta (petajoules)<br />
Oferta<br />
Demanda<br />
Producción (+)<br />
Importación (+)<br />
Consumo <strong><strong>de</strong>l</strong> Sector<br />
Energético (+)<br />
Variación <strong>de</strong><br />
inventarios (+)<br />
Exportación (-)<br />
Oferta Interna Bruta <strong>de</strong><br />
Energía = Consumo<br />
Nacional <strong>de</strong> energía<br />
No aprovechable (-)<br />
Maquila intercambio<br />
neto (+)<br />
Consumo Final<br />
Total (+)<br />
Tabla 1.3 Oferta Interna <strong>de</strong> Energía Bruta<br />
Fuente<br />
Producción<br />
Carbón 292.358<br />
Hidrocarburos:<br />
4,985.736<br />
Petróleo crudo<br />
3,107.801<br />
Con<strong>de</strong>nsados<br />
175.717<br />
Gas no asociado<br />
547.707<br />
Gas asociado<br />
1,154.511<br />
Electricidad primaria:<br />
Nucleoenergía<br />
Hidroenergía<br />
Geoenergía<br />
Energía eólica<br />
421.809<br />
100.634<br />
254.391<br />
66.722<br />
0.061<br />
Biomasa:<br />
349.469<br />
Bagazo <strong>de</strong> caña<br />
91.058<br />
Leña<br />
258.411<br />
Total 6,049.372<br />
4
<strong>Potenciales</strong> y <strong>Viabilidad</strong> <strong><strong>de</strong>l</strong> <strong>Uso</strong> <strong>de</strong> <strong>Bioetanol</strong> y <strong>Biodies<strong>el</strong></strong> <strong>para</strong> <strong>el</strong> Transporte en México (SENER-BID-GTZ)<br />
Task 2 & Task A: Mexico’s energy picture with regard to bioethanol and biodies<strong>el</strong><br />
Tabla 1.4 Comercio Exterior <strong>de</strong> Energía Secundaria<br />
Fuente Exportaciones Importaciones Saldo Neto<br />
Coque carbón 0.047 14.011 - 13.963<br />
Coque <strong>de</strong> petróleo 0.000 64.742 - 64.742<br />
Gas licuado 0.340 118.079 - 117.740<br />
Gasolinas y naftas 148.759 374.481 - 225.722<br />
Querosenos 13.775 0.000 13.775<br />
Dies<strong>el</strong> 16.209 7.739 8.470<br />
Combustóleo 140.663 67.348 73.315<br />
Productos no<br />
6.145 0.000 6.145<br />
energéticos<br />
Gas natural 0.000 401.680 - 401.680<br />
Electricidad 0.622 0.169 3.452<br />
Total 329.560 1,048.29 - 718.688<br />
Figura 1.3 Consumo Final Total <strong>de</strong> Energía (petajoules)<br />
4,141.352<br />
93.6 %<br />
282.979 4,424.332<br />
6.4 % 100 %<br />
Energético No Energético Total<br />
5
<strong>Potenciales</strong> y <strong>Viabilidad</strong> <strong><strong>de</strong>l</strong> <strong>Uso</strong> <strong>de</strong> <strong>Bioetanol</strong> y <strong>Biodies<strong>el</strong></strong> <strong>para</strong> <strong>el</strong> Transporte en México (SENER-BID-GTZ)<br />
Task 2 & Task A: Mexico’s energy picture with regard to bioethanol and biodies<strong>el</strong><br />
Figura 1.4 Consumo Final Energético por Tipo <strong>de</strong> Fuente<br />
Consumo Final Energético: 4,141.352 petajoules (93.6%)<br />
10.7%<br />
6.2%<br />
3.4%<br />
2.9%<br />
2.6%<br />
2.1% 1.6% 0.1% 100%<br />
11.0%<br />
14.2%<br />
15.1%<br />
30.0%<br />
Gasolinas y<br />
naftas<br />
Dies<strong>el</strong><br />
Electricidad<br />
Gas LP<br />
Gas Natural<br />
Leña<br />
Combustóleo<br />
Querosenos<br />
Coque <strong>de</strong><br />
petróleo<br />
Bagazo <strong>de</strong><br />
caña<br />
coque <strong>de</strong><br />
carbon<br />
carbon<br />
Total<br />
Figura 1.5 Consumo Final Energético por Sector<br />
29.88%<br />
2.86% 100 %<br />
46.17%<br />
21.09%<br />
Resi<strong>de</strong>ncial,<br />
comercial y<br />
público<br />
Transporte Industrial Agropecuario Total<br />
6
<strong>Potenciales</strong> y <strong>Viabilidad</strong> <strong><strong>de</strong>l</strong> <strong>Uso</strong> <strong>de</strong> <strong>Bioetanol</strong> y <strong>Biodies<strong>el</strong></strong> <strong>para</strong> <strong>el</strong> Transporte en México (SENER-BID-GTZ)<br />
Task 2 & Task A: Mexico’s energy picture with regard to bioethanol and biodies<strong>el</strong><br />
Figura 1.6 Consumo Final Energético: Sector Resi<strong>de</strong>ncial (873.447 petajoules)<br />
24.7%<br />
4.6% 0.4% 0.2%<br />
100%<br />
29.6%<br />
40.5%<br />
Gas LP<br />
Leña<br />
Electricidad<br />
Gas Natural<br />
Dies<strong>el</strong><br />
Queroseno<br />
Total<br />
Figura 1.7 Consumo Final Energético: Sector Transporte (1,911.881 petajoules)<br />
25.5%<br />
6.1%<br />
3.0% 0.2%<br />
0.2%<br />
ns<br />
100%<br />
65.0%<br />
Gasolinas y<br />
naftas<br />
Dies<strong>el</strong><br />
Querosenos<br />
Gas LP<br />
Combustóleo<br />
Electricidad<br />
Gas Natural<br />
Total<br />
7
<strong>Potenciales</strong> y <strong>Viabilidad</strong> <strong><strong>de</strong>l</strong> <strong>Uso</strong> <strong>de</strong> <strong>Bioetanol</strong> y <strong>Biodies<strong>el</strong></strong> <strong>para</strong> <strong>el</strong> Transporte en México (SENER-BID-GTZ)<br />
Task 2 & Task A: Mexico’s energy picture with regard to bioethanol and biodies<strong>el</strong><br />
Figura 1.8 Consumo Final Energético: Sector Industrial (1,237.420 petajoules)<br />
11.1%<br />
8.8%<br />
7.2%<br />
6.5%<br />
0.4%<br />
3.8% 3.0% n. s.<br />
100%<br />
32.4%<br />
27.8%<br />
Gas Natural<br />
Electricidad<br />
Combustóloe<br />
Coque <strong>de</strong><br />
petróleo<br />
Bagazo <strong>de</strong><br />
caña<br />
Coque <strong>de</strong><br />
carbón<br />
Dies<strong>el</strong><br />
Gas LP<br />
Carbón<br />
Querosenos<br />
Total<br />
Figura 1.9 Consumo Final Energético: Sector Agrícola (118.804 petajoules)<br />
21.1%<br />
6.6% n. s.<br />
100%<br />
72.2%<br />
Dies<strong>el</strong> Electricidad Gas LP Querosenos Total<br />
8
<strong>Potenciales</strong> y <strong>Viabilidad</strong> <strong><strong>de</strong>l</strong> <strong>Uso</strong> <strong>de</strong> <strong>Bioetanol</strong> y <strong>Biodies<strong>el</strong></strong> <strong>para</strong> <strong>el</strong> Transporte en México (SENER-BID-GTZ)<br />
Task 2 & Task A: Mexico’s energy picture with regard to bioethanol and biodies<strong>el</strong><br />
Figura 1.10 Consumo Final No Energético por Tipo <strong>de</strong> Fuente (282.979 petajoules)<br />
19.2% 0.7% 0.3% n. s. n. s. 100%<br />
27.5%<br />
52.2%<br />
Productos no<br />
Energéticos<br />
Gas Natural<br />
Gasolinas y<br />
Naftas<br />
Bagazo <strong>de</strong> caña<br />
Gas LP<br />
Querosenos<br />
Coque <strong>de</strong><br />
Petróleo<br />
Total<br />
3. Legislaciones y Regulaciones que Afectan <strong>el</strong> Mercado <strong>de</strong> la Energía<br />
En términos <strong>de</strong> legislaciones y regulaciones aplicables al mercado energético mexicano, se<br />
pue<strong>de</strong>n citar las siguientes:<br />
• Ley Reglamentaria <strong><strong>de</strong>l</strong> Artículo 27 Constitucional en <strong>el</strong> Ramo <strong><strong>de</strong>l</strong> Petróleo<br />
• Ley <strong><strong>de</strong>l</strong> Impuesto Especial sobre Producción y Servicios (IEPS)<br />
• Ley <strong><strong>de</strong>l</strong> Impuesto al Valor Agregado (IVA)<br />
• Ley <strong>de</strong> Energía <strong>para</strong> <strong>el</strong> Campo<br />
• Proyecto <strong>de</strong> Decreto <strong>de</strong> la Ley <strong>para</strong> <strong>el</strong> Desarrollo y Promoción <strong>de</strong> Bioenergéticos<br />
• NOM-086-SEMARNAT-SENER-SCFI-2005, Especificaciones <strong>de</strong> los combustibles<br />
fósiles <strong>para</strong> la protección ambiental<br />
Estas regulaciones establecen las activida<strong>de</strong>s <strong>de</strong> ejercicio exclusivo <strong><strong>de</strong>l</strong> Estado Mexicano por<br />
mandato constitucional, las correspondientes a los gravámenes aplicables a la<br />
9
<strong>Potenciales</strong> y <strong>Viabilidad</strong> <strong><strong>de</strong>l</strong> <strong>Uso</strong> <strong>de</strong> <strong>Bioetanol</strong> y <strong>Biodies<strong>el</strong></strong> <strong>para</strong> <strong>el</strong> Transporte en México (SENER-BID-GTZ)<br />
Task 2 & Task A: Mexico’s energy picture with regard to bioethanol and biodies<strong>el</strong><br />
comercialización en <strong>el</strong> territorio nacional y la importación <strong>de</strong> los combustibles <strong>de</strong>rivados <strong><strong>de</strong>l</strong><br />
petróleo (gasolinas y dies<strong>el</strong>), los apoyos otorgados <strong>para</strong> <strong>el</strong> consumo <strong>de</strong> los combustibles en las<br />
activida<strong>de</strong>s agropecuarias, <strong>el</strong> proyecto sobre <strong>el</strong> <strong>de</strong>sarrollo <strong>de</strong> los bioenergéticos, así como las<br />
especificaciones presentes y futuras que <strong>de</strong>berán cumplir todos los energéticos obtenidos <strong>de</strong><br />
fuentes fósiles, los cuáles se emplean tanto en las fuentes fijas (industria y servicios) como en<br />
las móviles ( vehículos a gasolina y a dies<strong>el</strong>, combustibles <strong>para</strong> aviación, etc.).<br />
Todas éstas tienen un impacto en diferentes ámbitos <strong><strong>de</strong>l</strong> sector energía. En <strong>el</strong> caso <strong>de</strong> la Ley<br />
Reglamentaria <strong><strong>de</strong>l</strong> Artículo 27 Constitucional, se vincula a la facultad <strong><strong>de</strong>l</strong> estado <strong>para</strong> la<br />
transformación <strong><strong>de</strong>l</strong> petróleo crudo en la industria <strong>de</strong> refinación, así como en <strong>el</strong> transporte,<br />
distribución y venta <strong>de</strong> primera mano <strong>de</strong> los productos obtenidos <strong>de</strong> la misma.<br />
Si bien <strong>el</strong> etanol proviene <strong><strong>de</strong>l</strong> sector agrícola, su empleo en forma directa como combustible<br />
no estaría supeditado a estas regulaciones. No así la mezcla <strong>de</strong> etanol con gasolina (en<br />
cualquiera <strong>de</strong> sus proporciones), la cual sólo pue<strong>de</strong> llevarla a cabo Petróleos Mexicanos<br />
(PEMEX), a través <strong>de</strong> su Organismo Subsidiario PEMEX Refinación, quién en primer lugar es<br />
responsable <strong>de</strong> la <strong>el</strong>aboración, transporte, almacenamiento, distribución y las ventas <strong>de</strong><br />
primera mano <strong>de</strong> los <strong>de</strong>rivados <strong><strong>de</strong>l</strong> petróleo, y a<strong>de</strong>más es <strong>el</strong> propietario y administrador <strong>de</strong> la<br />
Franquicia PEMEX, así como <strong>el</strong> único suministrador <strong>de</strong> los combustibles que se comercializan<br />
en la estaciones <strong>de</strong> servicio en <strong>el</strong> país.<br />
La Ley <strong><strong>de</strong>l</strong> IEPS y <strong>el</strong> IVA, se aplican a la comercialización <strong>de</strong> las gasolinas y <strong>el</strong> dies<strong>el</strong> que se<br />
expen<strong>de</strong>n en la red <strong>de</strong> estaciones <strong>de</strong> servicio, así como a las importaciones <strong>de</strong> éstos productos.<br />
En la Ley <strong><strong>de</strong>l</strong> IEPS en su artículo 2o.-A, establece que los precios <strong>de</strong> referencia <strong>de</strong> las<br />
gasolinas y <strong>el</strong> dies<strong>el</strong> importados se ajustaran por la calidad correspondiente, al producto <strong>de</strong><br />
esta operación se <strong>de</strong>berán sumar los costos <strong>de</strong> manejo y <strong>el</strong> costo neto <strong>de</strong> transporte a las<br />
agencias <strong>de</strong> ventas <strong>de</strong> que se trate, éstos valores que se obtengan no incluirán <strong>el</strong> IVA.<br />
En este contexto, la citada legislación establece en <strong>el</strong> articulo 2º, inciso B que <strong>el</strong> alcohol<br />
(solución acuosa <strong>de</strong> etanol con impurezas que lo acompañan con graduación mayor a 55<br />
grados Gay Lussacc, a una temperatura <strong>de</strong> 15 °C), alcohol <strong>de</strong>snaturalizado (solución acuosa <strong>de</strong><br />
etanol con las impurezas que la acompañan, con una graduación mayor a 55 grados Gay<br />
Lussacc, a una temperatura <strong>de</strong> 15 °C, con la adición <strong>de</strong> la sustancias <strong>de</strong>snaturalizantes<br />
autorizadas por la Secretaría <strong>de</strong> Salud) y las mi<strong>el</strong>es incristalizables tienen un gravamen <strong>de</strong> 50<br />
por ciento.<br />
La Ley <strong>de</strong> Energía <strong>para</strong> <strong>el</strong> Campo establece las reglas <strong>para</strong> <strong>el</strong> otorgamiento <strong>de</strong> apoyos a las<br />
activida<strong>de</strong>s agropecuarias, en don<strong>de</strong> se incluye la agricultura, la gana<strong>de</strong>ría, silvicultura,<br />
acuacultura y la pesca ribereña. A través <strong>de</strong> ésta la Secretaría <strong>de</strong> Agricultura, Gana<strong>de</strong>ría,<br />
Desarrollo Rural, Pesca y Alimentación (SAGARPA), establece las cuotas energéticas a cada<br />
una <strong>de</strong> las activida<strong>de</strong>s mencionadas <strong>para</strong> cada ciclo productivo, las cantida<strong>de</strong>s que serán<br />
sujetas a este tratamiento se establecen en <strong>el</strong> Reglamento que <strong>para</strong> tal efecto emitió la<br />
Secretaría.<br />
Con r<strong>el</strong>ación al <strong>de</strong>creto <strong>de</strong> la Ley <strong>para</strong> la Promoción y Desarrollo <strong>de</strong> Bioenergéticos<br />
dictaminada y aprobada en la Cámara <strong>de</strong> Diputados, la cual se encuentra en proceso <strong>de</strong><br />
revisión en la Cámara <strong>de</strong> Senadores, en <strong>el</strong>la se establece la utilización <strong>de</strong> una concentración<br />
máxima <strong>de</strong> 10 por ciento en volumen <strong>de</strong> bioetanol en la formulación <strong>de</strong> las gasolinas a niv<strong>el</strong><br />
10
<strong>Potenciales</strong> y <strong>Viabilidad</strong> <strong><strong>de</strong>l</strong> <strong>Uso</strong> <strong>de</strong> <strong>Bioetanol</strong> y <strong>Biodies<strong>el</strong></strong> <strong>para</strong> <strong>el</strong> Transporte en México (SENER-BID-GTZ)<br />
Task 2 & Task A: Mexico’s energy picture with regard to bioethanol and biodies<strong>el</strong><br />
nacional, <strong>de</strong>terminando <strong>para</strong> <strong>el</strong>lo la necesidad <strong>de</strong> evaluar y cuantificar la inversiones en<br />
infraestructura productiva, así como los requerimientos <strong>de</strong> apoyos <strong>para</strong> la consolidación y<br />
viabilidad <strong>de</strong> esta iniciativa, buscando en todo momento <strong>el</strong> <strong>de</strong>sarrollo agrícola nacional<br />
aparejado a esta medida.<br />
En la NOM-086 publicada en <strong>el</strong> Diario Oficial <strong>de</strong> la Fe<strong>de</strong>ración (DOF) <strong><strong>de</strong>l</strong> 30 <strong>de</strong> enero <strong>de</strong><br />
2006, se <strong>de</strong>finen las especificaciones que <strong>de</strong>berán cumplir cada uno <strong>de</strong> los parámetros tanto <strong>de</strong><br />
las gasolinas (PEMEX Magna y Premium), así como <strong>el</strong> dies<strong>el</strong> <strong>para</strong> servicio automotriz<br />
(PEMEX Dies<strong>el</strong>) y <strong>el</strong> <strong>de</strong>stinado a servicio marino y agrícola.<br />
En <strong>el</strong> caso <strong>de</strong> las gasolinas, en particular la PEMEX Magna comercializadas en las Zonas<br />
Metropolitanas <strong>de</strong> Guadalajara (ZMG), <strong>de</strong> Monterrey (ZMMTY) y <strong><strong>de</strong>l</strong> Valle <strong>de</strong> México<br />
(ZMVM), la norma establece que <strong>de</strong>berán contener en su fórmula un valor máximo <strong>de</strong><br />
oxígeno <strong>de</strong> 2.7 por ciento en peso; a<strong>de</strong>más esta concentración se especifica a niv<strong>el</strong> nacional<br />
<strong>para</strong> la PEMEX Premium, sin establecer <strong>el</strong> tipo <strong>de</strong> compuesto empleado <strong>para</strong> tal fin pero si la<br />
necesidad <strong>de</strong> reportarlo.<br />
La PEMEX Magna que se comercializa en las zonas metropolitanas antes citadas y la PEMEX<br />
Premium, actualmente se oxigenan con éter metil terbutílico y <strong>el</strong> éter metil teramílico<br />
(conocidos por sus siglas en inglés como MTBE y TAME) obtenidos en las refinerías y <strong>el</strong><br />
déficit registrado se obtiene vía importaciones por medio <strong>de</strong> MTBE, producto ampliamente<br />
ofertado en <strong>el</strong> mercado internacional, no así <strong>el</strong> TAME cuya obtención es muy limitada por la<br />
escasa disponibilidad <strong>de</strong> la materia prima empleada <strong>para</strong> su producción (isoamilenos).<br />
Por todo lo expuesto, será necesario efectuar un análisis más profundo <strong>de</strong> las modificaciones<br />
que se requerirán en las leyes <strong><strong>de</strong>l</strong> IEPS, IVA y <strong><strong>de</strong>l</strong> proyecto <strong>de</strong> Bioenergéticos, <strong>para</strong> lograr la<br />
viabilidad <strong><strong>de</strong>l</strong> empleo <strong>de</strong> etanol en la formulación <strong>de</strong> las gasolinas. En este contexto habría que<br />
<strong>de</strong>terminar los apoyos <strong>para</strong> las inversiones en infraestructura <strong>de</strong> producción, almacenamiento y<br />
distribución, así como los impactos en los costos <strong>de</strong> adquisición y <strong>de</strong> los productos finales.<br />
4. Evolución <strong>de</strong> la Oferta y Demanda <strong>de</strong> Combustibles Líquidos <strong>para</strong> <strong>el</strong> Transporte<br />
4.1 Evolución <strong>de</strong> la Oferta y Demanda <strong>de</strong> Gasolinas en <strong>el</strong> Período 2000-2005<br />
En este apartado se presenta la evolución <strong>de</strong> la oferta y <strong>de</strong>manda <strong>de</strong> los dos tipos <strong>de</strong> gasolinas<br />
que se comercializan en <strong>el</strong> país (PEMEX Magna y Premium), en <strong>el</strong> período bajo estudio. Cabe<br />
mencionar que la producción interna correspon<strong>de</strong> a la obtenida <strong><strong>de</strong>l</strong> proceso <strong><strong>de</strong>l</strong> crudo en las<br />
refinerías más <strong>el</strong> producto <strong>de</strong> retorno (es <strong>de</strong>cir, los combustibles líquidos que se reciben como<br />
resultado <strong><strong>de</strong>l</strong> envío <strong>de</strong> crudo pesado tipo Maya a la refinería ubicada en Deer Park, Texas), por<br />
lo cual no se contabiliza en las importaciones registradas.<br />
La evolución <strong>de</strong> las ventas internas <strong>de</strong> ambos productos se muestra en la figura 2.1<br />
11
<strong>Potenciales</strong> y <strong>Viabilidad</strong> <strong><strong>de</strong>l</strong> <strong>Uso</strong> <strong>de</strong> <strong>Bioetanol</strong> y <strong>Biodies<strong>el</strong></strong> <strong>para</strong> <strong>el</strong> Transporte en México (SENER-BID-GTZ)<br />
Task 2 & Task A: Mexico’s energy picture with regard to bioethanol and biodies<strong>el</strong><br />
Figura 4.1 Ventas Internas <strong>de</strong> Gasolinas (1) , 2000-2005<br />
Cifras en Miles <strong>de</strong> Barriles por Día (2)<br />
PEMEX Magna<br />
PEMEX Premium<br />
59.1 73.9 88.5<br />
100.1<br />
110.4<br />
111.9<br />
472.4 476.5 476.5 500.2 525.5 559.6<br />
2000 2001 2002 2003 2004 2005<br />
Fuente:<br />
(1) www. pemex.com.mx, Indicadores Petroleros, Enero 2006.<br />
(2) I barril equivale a 42 galones o 159 litros<br />
La oferta <strong>de</strong> gasolinas pasó <strong>de</strong> estar conformada por un 11.1 por ciento <strong>de</strong> PEMEX Premium y<br />
la diferencia, 88.9 por ciento <strong>de</strong> PEMEX Magna en <strong>el</strong> año 2000; a un 16.7 por ciento y 83.3<br />
por ciento respectivamente en <strong>el</strong> 2005.<br />
La tasa media <strong>de</strong> crecimiento anual <strong>de</strong> la <strong>de</strong>manda <strong>para</strong> <strong>el</strong> período bajo estudio registró un<br />
valor <strong>de</strong> 5.1 por ciento; mientras que la producción reportó un valor <strong>de</strong> 3.9 por ciento; por<br />
otro lado, las importaciones registraron un aumento <strong>de</strong> 5.7 por ciento y <strong>el</strong> producto <strong>de</strong> retorno<br />
<strong>de</strong> maquila un 10.3 por ciento, con lo cual se logró <strong>el</strong> abasto <strong>de</strong> éstos energéticos.<br />
En términos regionales, la <strong>de</strong>manda <strong>de</strong> gasolinas <strong>de</strong> las Zonas Metropolitanas (ZMG,<br />
ZMMTY y ZMVM), ocuparon en <strong>el</strong> período con <strong>el</strong> 30 por ciento <strong>de</strong> la oferta nacional y <strong>el</strong> 70<br />
por ciento restante correspondió al Resto <strong><strong>de</strong>l</strong> País (RP). Con referencia a la oferta nacional,<br />
ésta registró un aumento anualizado <strong>de</strong> 4.8 por ciento.<br />
La tasa media <strong>de</strong> crecimiento anual <strong>de</strong> la <strong>de</strong>manda en estas regiones fue la siguiente: 1.2, 4.3,<br />
4.2 y 5.9 por ciento, ubicadas en las ZMG, ZMMTY, ZMVM y <strong>el</strong> RP, respectivamente.<br />
12
<strong>Potenciales</strong> y <strong>Viabilidad</strong> <strong><strong>de</strong>l</strong> <strong>Uso</strong> <strong>de</strong> <strong>Bioetanol</strong> y <strong>Biodies<strong>el</strong></strong> <strong>para</strong> <strong>el</strong> Transporte en México (SENER-BID-GTZ)<br />
Task 2 & Task A: Mexico’s energy picture with regard to bioethanol and biodies<strong>el</strong><br />
Por <strong>el</strong> lado <strong>de</strong> la <strong>de</strong>manda <strong>de</strong> compuestos oxigenados, las ventas acumuladas en <strong>el</strong> período<br />
registraron los siguientes datos:<br />
• En <strong>el</strong> caso <strong>de</strong> la PEMEX Magna <strong>de</strong> las Zonas Metropolitanas, la oferta paso <strong>de</strong> 176<br />
Miles <strong>de</strong> Barriles por Día (MBD) en 2000 a 197.4 MBD (un barril equivale a 42<br />
galones o 159 litros) en 2005, asumiendo un contenido promedio máximo <strong>de</strong> oxígeno<br />
<strong>de</strong> 1.5 por ciento en peso, correspon<strong>de</strong>ría a una <strong>de</strong>manda <strong>de</strong> MTBE <strong><strong>de</strong>l</strong> or<strong>de</strong>n <strong>de</strong> 14.6<br />
a 16.4 MBD, respectivamente.<br />
• Para la PEMEX Premium, la <strong>de</strong>manda <strong><strong>de</strong>l</strong> RP pasó <strong>de</strong> 39.1 en 2000 a 78.2 MBD en<br />
2005, lo que requirió <strong>para</strong> su formulación en términos <strong>de</strong> MTBE <strong>de</strong> 3.3 a 6.6 MBD,<br />
respectivamente.<br />
En suma la <strong>de</strong>manda nacional <strong>de</strong> compuestos oxigenados <strong>para</strong> aten<strong>de</strong>r los requerimientos<br />
especificados pasó <strong>de</strong> 17.9 a 23.0 MBD, lo que representa un incremento <strong>de</strong> 28.5 por ciento.<br />
La capacidad <strong>de</strong> producción <strong>de</strong> éteres (MTBE + TAME) en <strong>el</strong> Sistema Nacional <strong>de</strong> refinación<br />
(SNR), en <strong>el</strong> período bajo estudio fue <strong>de</strong> 15.6 MBD, lo que da como resultado <strong>para</strong> <strong>el</strong> año<br />
2005, un déficit <strong>de</strong> cerca <strong>de</strong> 7.4 MBD.<br />
Como pue<strong>de</strong> observarse todos estos cambios en la estructura <strong>de</strong> la <strong>de</strong>manda <strong>de</strong> gasolinas, ha<br />
originado un <strong>de</strong>sbalance en la producción <strong><strong>de</strong>l</strong> barril-octano necesario <strong>para</strong> satisfacerla,<br />
situación que se ha venido traduciendo en un incremento <strong>de</strong> las importaciones <strong>de</strong> gasolinas y<br />
componentes <strong>para</strong> su formulación.<br />
En términos <strong>de</strong> su calidad, las gasolinas <strong>de</strong> la ZMVM (Magna y Premium) presentan las<br />
especificaciones más exigentes, fijándose los siguientes valores: azufre 500 partes por millón<br />
en peso (ppmw) máximo y un promedio <strong>de</strong> 300 ppmw, sus límites máximo <strong>de</strong> olefinas,<br />
aromáticos y benceno son 10, 25 y 1, respectivamente, así como un rango <strong>de</strong> presión <strong>de</strong> vapor<br />
Reíd (PVR) a lo largo <strong>de</strong> todo <strong>el</strong> año <strong>de</strong> 45 a 54 kPa (equivalente a un intervalo <strong>de</strong> 6.5 a 7.8<br />
libras por pulgada cuadrada -psi-) y un contenido máximo <strong>de</strong> oxígeno <strong>de</strong> 2.7 por ciento en<br />
peso (equivalente a 15 por ciento en volumen <strong>de</strong> MTBE).<br />
Para <strong>el</strong> caso <strong>de</strong> la ZMG y ZMMTY <strong>el</strong> contenido <strong>de</strong> azufre es <strong>el</strong> mismo que en la ZMVM, los<br />
valores establecidos <strong>para</strong> su composición en aromáticos, olefinas y benceno, 35, 12.5 y 1 por<br />
ciento en volumen máximo, respectivamente. Los energéticos comercializados en la ZMG<br />
tienen durante todo <strong>el</strong> año establecido <strong>el</strong> mismo rango <strong>de</strong> PVR que los <strong><strong>de</strong>l</strong> Valle <strong>de</strong> México; en<br />
<strong>el</strong> caso <strong>de</strong> la ZMMTY este parámetro se fija <strong>de</strong> acuerdo a la estacionalidad <strong><strong>de</strong>l</strong> clima en la<br />
región. Estos límites son <strong>de</strong> aplicación en ambas gasolinas y también se especifica un<br />
contenido máximo <strong>de</strong> oxígeno <strong>de</strong> 2.7 por ciento en peso.<br />
En las gasolinas que se ofertan <strong>para</strong> <strong>el</strong> RP, las características más r<strong>el</strong>evantes <strong>para</strong> la PEMEX<br />
Premium son las siguientes: aromáticos, olefinas y benceno, 32, 15 y 2 por ciento en volumen<br />
máximo, <strong>de</strong> oxígeno <strong>de</strong> 1 a 2.7 por ciento en peso; azufre 300 máximo y 250 promedio ppmw.<br />
En <strong>el</strong> caso <strong>de</strong> la PEMEX Magna la especificación establece: benceno 4.9 máximo, azufre 1000<br />
ppmw y la PVR se fija con la estacionalidad <strong><strong>de</strong>l</strong> clima <strong>de</strong> cada región <strong><strong>de</strong>l</strong> país.<br />
El balance <strong>de</strong> oferta y <strong>de</strong>manda se muestra en la figura 4.2<br />
13
<strong>Potenciales</strong> y <strong>Viabilidad</strong> <strong><strong>de</strong>l</strong> <strong>Uso</strong> <strong>de</strong> <strong>Bioetanol</strong> y <strong>Biodies<strong>el</strong></strong> <strong>para</strong> <strong>el</strong> Transporte en México (SENER-BID-GTZ)<br />
Task 2 & Task A: Mexico’s energy picture with regard to bioethanol and biodies<strong>el</strong><br />
Figura 4.2 Evolución <strong>de</strong> la Oferta y Demanda <strong>de</strong> Gasolinas<br />
Evolución <strong>de</strong> las Ventas Internas, Producción, Importación, Exportación y<br />
Producto <strong>de</strong> Retorno <strong>de</strong> Gasolinas (1)<br />
Cifras en Miles <strong>de</strong> Barriles por Día<br />
800<br />
700<br />
600<br />
500<br />
400<br />
300<br />
200<br />
100<br />
0<br />
2001 2002 2003 2004 2005<br />
Ventas Internas<br />
Importación<br />
Producto <strong>de</strong> Retorno<br />
Producción<br />
Exportación<br />
Fuente:<br />
(1) www.pemex.com, Indicadores Petroleros, enero 2006.<br />
14
<strong>Potenciales</strong> y <strong>Viabilidad</strong> <strong><strong>de</strong>l</strong> <strong>Uso</strong> <strong>de</strong> <strong>Bioetanol</strong> y <strong>Biodies<strong>el</strong></strong> <strong>para</strong> <strong>el</strong> Transporte en México (SENER-BID-GTZ)<br />
Task 2 & Task A: Mexico’s energy picture with regard to bioethanol and biodies<strong>el</strong><br />
En las figuras 4.3 a 4.6, se presentan <strong>de</strong> manera segregada la evolución <strong>de</strong> las ventas <strong>de</strong><br />
gasolinas en México.<br />
Figura 4.3 Evolución <strong>de</strong> la Ventas <strong>de</strong> Gasolinas en la Zona Metropolitana <strong>de</strong> Guadalajara<br />
(ZMG) (1)<br />
Cifras en Miles <strong>de</strong> Barriles por Día<br />
PEMEX Magna<br />
PEMEX Premium<br />
4.3 5.5 6.5 7.3<br />
7.5<br />
7.6<br />
32.5 33 33.6 34.3 35.6 37.8<br />
2000 2001 2002 2003 2004 2005<br />
Fuente:<br />
(1) Fuente: Pemex Refinación<br />
(2) I barril equivale a 42 galones o 159 litros<br />
15
<strong>Potenciales</strong> y <strong>Viabilidad</strong> <strong><strong>de</strong>l</strong> <strong>Uso</strong> <strong>de</strong> <strong>Bioetanol</strong> y <strong>Biodies<strong>el</strong></strong> <strong>para</strong> <strong>el</strong> Transporte en México (SENER-BID-GTZ)<br />
Task 2 & Task A: Mexico’s energy picture with regard to bioethanol and biodies<strong>el</strong><br />
Figura 4.4 Evolución <strong>de</strong> la Ventas <strong>de</strong> Gasolinas en la Zona Metropolitana <strong>de</strong> Monterrey<br />
(ZMMTY (1)<br />
Cifras en Miles <strong>de</strong> Barriles por Día<br />
PEMEX Magna<br />
PEMEX Premium<br />
4.7<br />
6.0<br />
7.3<br />
7.8<br />
7.7<br />
9.0<br />
20.3 20.7 21.6<br />
19.8 21 21.5<br />
2000 2001 2002 2003 2004 2005<br />
Fuente:<br />
(1) Fuente: Pemex Refinación<br />
(2) I barril equivale a 42 galones o 159 litros<br />
16
<strong>Potenciales</strong> y <strong>Viabilidad</strong> <strong><strong>de</strong>l</strong> <strong>Uso</strong> <strong>de</strong> <strong>Bioetanol</strong> y <strong>Biodies<strong>el</strong></strong> <strong>para</strong> <strong>el</strong> Transporte en México (SENER-BID-GTZ)<br />
Task 2 & Task A: Mexico’s energy picture with regard to bioethanol and biodies<strong>el</strong><br />
Figura 4.5 Evolución <strong>de</strong> la Ventas <strong>de</strong> Gasolinas en la Zona Metropolitana <strong>de</strong> Valle <strong>de</strong><br />
México (ZMVM) (1)<br />
Cifras en Miles <strong>de</strong> Barriles por Día<br />
PEMEX Magna<br />
PEMEX Premium<br />
11 12.8 15 16.7 17.3 17.1<br />
103.2 103 101.5 100.8 101.9 104.4<br />
2000 2001 2002 2003 2004 2005<br />
Fuente:<br />
(1) Fuente: Pemex Refinación<br />
(2) I barril equivale a 42 galones o 159 litros<br />
17
<strong>Potenciales</strong> y <strong>Viabilidad</strong> <strong><strong>de</strong>l</strong> <strong>Uso</strong> <strong>de</strong> <strong>Bioetanol</strong> y <strong>Biodies<strong>el</strong></strong> <strong>para</strong> <strong>el</strong> Transporte en México (SENER-BID-GTZ)<br />
Task 2 & Task A: Mexico’s energy picture with regard to bioethanol and biodies<strong>el</strong><br />
Figura 4.6 Evolución <strong>de</strong> la Ventas <strong>de</strong> Gasolinas en <strong>el</strong> Resto <strong><strong>de</strong>l</strong> País (RP) (1)<br />
Cifras en Miles <strong>de</strong> Barriles por Día<br />
ís<br />
PEMEX Magna<br />
PEMEX Premium<br />
39.1 49.8 59.9<br />
68.4<br />
78.1<br />
78.2<br />
316.4 319.8 319.9<br />
345.4 367.0<br />
395.9<br />
2000 2001 2002 2003 2004 2005<br />
Fuente:<br />
(1) Fuente: Pemex Refinación<br />
(2) I barril equivale a 42 galones o 159 litros<br />
4.2 Evolución <strong>de</strong> la Oferta y Demanda <strong>de</strong> Dies<strong>el</strong> en <strong>el</strong> Período 2000-2005<br />
En este rubro en <strong>el</strong> país se comercializan los siguientes productos:<br />
• PEMEX Dies<strong>el</strong>, es <strong>el</strong> producto <strong>de</strong>stinado al uso automotriz<br />
• Dies<strong>el</strong> Industrial <strong>de</strong> Bajo Azufre, <strong>para</strong> <strong>el</strong> empleo en equipos <strong>de</strong> combustión a flama<br />
abierta<br />
• Dies<strong>el</strong> Marino<br />
• Dies<strong>el</strong> Agrícola<br />
La diferencia principal entre <strong>el</strong> combustible <strong>para</strong> uso automotriz y los <strong>de</strong>stinados al servicio<br />
agrícola y marino son su contenido <strong>de</strong> azufre y su índice <strong>de</strong> cetano; con <strong>el</strong> <strong>de</strong> uso industrial la<br />
única diferencia es <strong>el</strong> contenido <strong>de</strong> azufre.<br />
18
<strong>Potenciales</strong> y <strong>Viabilidad</strong> <strong><strong>de</strong>l</strong> <strong>Uso</strong> <strong>de</strong> <strong>Bioetanol</strong> y <strong>Biodies<strong>el</strong></strong> <strong>para</strong> <strong>el</strong> Transporte en México (SENER-BID-GTZ)<br />
Task 2 & Task A: Mexico’s energy picture with regard to bioethanol and biodies<strong>el</strong><br />
La evolución <strong>de</strong> la <strong>de</strong>manda <strong>de</strong> dies<strong>el</strong> se muestra en la figura 4.7<br />
Figura 4.7 Evolución <strong>de</strong> la Ventas Internas <strong>de</strong> Dies<strong>el</strong> (1) , 2000-2005<br />
PEMEX Dies<strong>el</strong> y Dies<strong>el</strong> <strong>para</strong> Otros Servicios<br />
Cifras en Miles <strong>de</strong> Barriles por Día<br />
PEMEX Dies<strong>el</strong><br />
Otros*<br />
49.4 42.7<br />
54<br />
47.3<br />
46.7<br />
226.4 228 240.7<br />
259.4 273.4<br />
2001 2002 2003 2004 2005<br />
PEMEX Dies<strong>el</strong>: Producto <strong>para</strong> uso automotriz<br />
Otros*: se refiere al uso agrícola, marino e industrial<br />
Fuente:<br />
(1) www.pemex.com<br />
, Indicadores Petroleros, enero 2006.<br />
La <strong>de</strong>manda <strong>de</strong> dies<strong>el</strong> en México creció en <strong>el</strong> período estudiado a un ritmo <strong>de</strong> 2.4 por ciento<br />
por año; <strong>de</strong>notando <strong>el</strong> mayor aumento la <strong><strong>de</strong>l</strong> producto <strong>de</strong>stinado al servicio automotriz <strong>el</strong> cual<br />
registró un valor <strong>de</strong> 3.6 por ciento anual.<br />
Cabe mencionar que a niv<strong>el</strong> nacional sólo se comercializa una calidad única <strong>para</strong> <strong>el</strong> uso<br />
automotriz, la que actualmente presenta entre sus características más r<strong>el</strong>evantes un contenido<br />
<strong>de</strong> azufre <strong>de</strong> 300 partes por millón en peso (ppmw), un índice <strong>de</strong> cetano mínimo <strong>de</strong> 48 y un<br />
valor máximo <strong>de</strong> aromáticos <strong>de</strong> 30 por ciento.<br />
En las figuras 4.8 a 4.12, se muestra la oferta <strong>de</strong>sagregada <strong><strong>de</strong>l</strong> dies<strong>el</strong> consumido en México en<br />
<strong>el</strong> período bajo estudio.<br />
19
<strong>Potenciales</strong> y <strong>Viabilidad</strong> <strong><strong>de</strong>l</strong> <strong>Uso</strong> <strong>de</strong> <strong>Bioetanol</strong> y <strong>Biodies<strong>el</strong></strong> <strong>para</strong> <strong>el</strong> Transporte en México (SENER-BID-GTZ)<br />
Task 2 & Task A: Mexico’s energy picture with regard to bioethanol and biodies<strong>el</strong><br />
Figura 4.8 Evolución <strong>de</strong> Oferta y Demanda <strong>de</strong> Dies<strong>el</strong> (1)<br />
Evolución <strong>de</strong> las Ventas Internas, Producción, Importaciones, Exportaciones y<br />
Producto <strong>de</strong> Retorno <strong>de</strong> Dies<strong>el</strong><br />
Cifras en Miles <strong>de</strong> Barriles por Día<br />
350<br />
300<br />
250<br />
200<br />
150<br />
100<br />
50<br />
0<br />
2000.5 2001 2001.5 2002 2002.5 2003 2003.5 2004 2004.5 2005 2005.5<br />
Ventas Internas Producción Importación<br />
Exportación<br />
Producto <strong>de</strong> Rertorno<br />
Fuente:<br />
(1) www.pemex.com, Indicadores Petroleros, enero 2006.<br />
20
<strong>Potenciales</strong> y <strong>Viabilidad</strong> <strong><strong>de</strong>l</strong> <strong>Uso</strong> <strong>de</strong> <strong>Bioetanol</strong> y <strong>Biodies<strong>el</strong></strong> <strong>para</strong> <strong>el</strong> Transporte en México (SENER-BID-GTZ)<br />
Task 2 & Task A: Mexico’s energy picture with regard to bioethanol and biodies<strong>el</strong><br />
Figura 4.9 Evolución <strong>de</strong> las Ventas <strong>de</strong> Dies<strong>el</strong> en la Zona Metropolitana <strong>de</strong> Guadalajara<br />
(ZMG)<br />
Cifras en Miles <strong>de</strong> Barriles por Día<br />
Pemex Dies<strong>el</strong><br />
Dies<strong>el</strong> Industrial<br />
1.4<br />
0.6<br />
0.8 1.4<br />
2.9 2<br />
18.0 17.7 17.4 17.5<br />
17.9<br />
19.4<br />
2000 2001 2002 2003 2004 2005<br />
Fuente:<br />
PEMEX Refinación<br />
21
<strong>Potenciales</strong> y <strong>Viabilidad</strong> <strong><strong>de</strong>l</strong> <strong>Uso</strong> <strong>de</strong> <strong>Bioetanol</strong> y <strong>Biodies<strong>el</strong></strong> <strong>para</strong> <strong>el</strong> Transporte en México (SENER-BID-GTZ)<br />
Task 2 & Task A: Mexico’s energy picture with regard to bioethanol and biodies<strong>el</strong><br />
Figura 4.10 Evolución <strong>de</strong> las Ventas <strong>de</strong> Dies<strong>el</strong> en la Zona Metropolitana <strong>de</strong> Monterrey<br />
(ZMMTY)<br />
Cifras en Miles <strong>de</strong> Barriles por Día<br />
Pemex Dies<strong>el</strong><br />
Dies<strong>el</strong> Industrial<br />
1.3 2 2.3 4.2 2.9<br />
2.7<br />
9.8 9.8 10.0 9.2 10.0 10.6<br />
2000 2001 2002 2003 2004 2005<br />
Fuente:<br />
PEMEX Refinación<br />
22
<strong>Potenciales</strong> y <strong>Viabilidad</strong> <strong><strong>de</strong>l</strong> <strong>Uso</strong> <strong>de</strong> <strong>Bioetanol</strong> y <strong>Biodies<strong>el</strong></strong> <strong>para</strong> <strong>el</strong> Transporte en México (SENER-BID-GTZ)<br />
Task 2 & Task A: Mexico’s energy picture with regard to bioethanol and biodies<strong>el</strong><br />
Figura 4.11 Evolución <strong>de</strong> las Ventas <strong>de</strong> Dies<strong>el</strong> en la Zona Metropolitana <strong><strong>de</strong>l</strong> Valle <strong>de</strong><br />
México (ZMVM)<br />
Cifras en Miles <strong>de</strong> Barriles por Día<br />
Pemex Dies<strong>el</strong><br />
Dies<strong>el</strong> Industrial<br />
5.8<br />
2.1<br />
4.7 4.7<br />
4.8<br />
4.1<br />
23.9 24.4 24.9 25.8 26.8 28.4<br />
2000 2001 2002 2003 2004 2005<br />
Fuente:<br />
PEMEX Refinación<br />
23
<strong>Potenciales</strong> y <strong>Viabilidad</strong> <strong><strong>de</strong>l</strong> <strong>Uso</strong> <strong>de</strong> <strong>Bioetanol</strong> y <strong>Biodies<strong>el</strong></strong> <strong>para</strong> <strong>el</strong> Transporte en México (SENER-BID-GTZ)<br />
Task 2 & Task A: Mexico’s energy picture with regard to bioethanol and biodies<strong>el</strong><br />
Figura 4.12 Evolución <strong>de</strong> las Ventas <strong>de</strong> Dies<strong>el</strong> en <strong>el</strong> Resto <strong><strong>de</strong>l</strong> País (RP)<br />
Cifras en Miles <strong>de</strong> Barriles por Día<br />
Pemex Dies<strong>el</strong> Dies<strong>el</strong> Industrial Dies<strong>el</strong> Marino<br />
21.0 18.2 13.6<br />
27.4 23.3 20.7<br />
14.1 13.5<br />
24<br />
28.1<br />
14.7<br />
23.8<br />
176.9 174.5 175.7 188.3 200.8 215.0<br />
2000 2001 2002 2003 2004 2005<br />
Fuente:<br />
PEMEX Refinación<br />
24
<strong>Potenciales</strong> y <strong>Viabilidad</strong> <strong><strong>de</strong>l</strong> <strong>Uso</strong> <strong>de</strong> <strong>Bioetanol</strong> y <strong>Biodies<strong>el</strong></strong> <strong>para</strong> <strong>el</strong> Transporte en México (SENER-BID-GTZ)<br />
Task 2 & Task A: Mexico’s energy picture with regard to bioethanol and biodies<strong>el</strong><br />
5. Instalaciones Petroleras y <strong>el</strong> Sistema Nacional <strong>de</strong> Refinación (SNR)<br />
La infraestructura <strong>de</strong> la industria petrolera nacional y la correspondiente <strong><strong>de</strong>l</strong> Sistema Nacional<br />
<strong>de</strong> Refinación (SNR), se muestra en las figuras 5.1 y 5.2.<br />
Figura 5.1 Instalaciones Petroleras (1)<br />
(1) Fuente: www.pemex.com, Statistical Yearbook 2005<br />
25
<strong>Potenciales</strong> y <strong>Viabilidad</strong> <strong><strong>de</strong>l</strong> <strong>Uso</strong> <strong>de</strong> <strong>Bioetanol</strong> y <strong>Biodies<strong>el</strong></strong> <strong>para</strong> <strong>el</strong> Transporte en México (SENER-BID-GTZ)<br />
Task 2 & Task A: Mexico’s energy picture with regard to bioethanol and biodies<strong>el</strong><br />
Figura 5.2 Sistema Nacional <strong>de</strong> Refinación (SNR) (2)<br />
(2) Fuente: www.pemex.com, Statistical Yearbook 2005<br />
5.1 Sistema Nacional <strong>de</strong> Refinación (SNR)<br />
El esquema <strong>de</strong> proceso <strong>de</strong> las instalaciones correspon<strong>de</strong> a las siguientes configuraciones: dos<br />
<strong>de</strong> complejidad media (una <strong>de</strong> tipo FCC, otra FCC+ alquilación +éteres), dos <strong>de</strong> alta<br />
complejidad (<strong><strong>de</strong>l</strong> tipo FCC, con unida<strong>de</strong>s <strong>de</strong> alquilación y éteres, así como con instalaciones<br />
<strong>de</strong> hidrotratamiento <strong>de</strong> residuales -conocidas como H-Oil-) y dos <strong><strong>de</strong>l</strong> tipo fondo <strong>de</strong> barril (las<br />
que incluyen plantas <strong>de</strong> coquización retardada). Lo anterior se traduce en índices <strong>de</strong><br />
complejidad que se sitúan <strong>de</strong>s<strong>de</strong> 7.8 hasta 15 puntos.<br />
En términos <strong>de</strong> la dieta <strong>de</strong> crudo suministrada a las refinerías, ésta muestra composiciones<br />
diferentes en función <strong>de</strong> su complejidad, así los datos reportados en <strong>el</strong> período 2003-2005 en<br />
<strong>el</strong> sitio www.pemex.com.mx, en su sección <strong>de</strong> informes, en particular <strong>el</strong> <strong>de</strong>nominado “Informe<br />
Estadístico <strong>de</strong> Labores”, correspondiente al año 2005, esta información se incluye en la tabla<br />
5.1.<br />
26
<strong>Potenciales</strong> y <strong>Viabilidad</strong> <strong><strong>de</strong>l</strong> <strong>Uso</strong> <strong>de</strong> <strong>Bioetanol</strong> y <strong>Biodies<strong>el</strong></strong> <strong>para</strong> <strong>el</strong> Transporte en México (SENER-BID-GTZ)<br />
Task 2 & Task A: Mexico’s energy picture with regard to bioethanol and biodies<strong>el</strong><br />
Tabla 5.1 Estadísticas <strong>de</strong> Proceso <strong>de</strong> Crudo en <strong>el</strong> SNR<br />
Estadisticas <strong>de</strong> Proceso <strong>de</strong> Crudo en <strong>el</strong> SNR (1)<br />
Refineria 2003, MBD Porcentaje 2004, MBD Porcentaje 2005, MBD Porcentaje<br />
Cadreyta: 209 100 213 100 194 100<br />
Pesado 77 36.8 88 41.3 102 52.6<br />
Ligero 117 56.0 97 45.5 90 46.4<br />
Superligero 0 0.0 1 0.5<br />
Reconstituido 12 5.7 25 11.7<br />
Otras Corrientes 3 1.4 2 0.9 2 1.0<br />
Ma<strong>de</strong>ro: 142 100 145 100 142 100<br />
Pesado 71 50.0 102 70.3 122 85.9<br />
Ligero 53 37.3 31 21.4 16 11.3<br />
Superligero 0 0<br />
Reconstituido 18 12.7 12 8.3 4 2.8<br />
Otras Corrientes<br />
Minatitlán: 176 100 166 100 163 100<br />
Pesado 56 31.8 54 32.5 54 33.1<br />
Ligero 120 68.2 112 67.5 109 66.9<br />
Superligero<br />
Reconstituido<br />
Otras Corrientes<br />
Salamanca: 185 100 199 100 197 100<br />
Pesado 41 22.2 48 24.1 50 25.4<br />
Ligero 138 74.6 149 74.9 131 66.5<br />
Superligero 5 2.7 1 0.5 14 7.1<br />
Reconstituido 1 0.5 1 0.5 2 1.0<br />
Otras Corrientes<br />
Salina Cruz: 306 100 288 100 293 100<br />
Pesado 103 33.7 106 36.8 105 35.8<br />
Ligero 194 63.4 174 60.4 187 63.8<br />
Superligero 1 0.3<br />
Reconstituido 9 2.9 7 2.4 1 0.3<br />
Otras Corrientes<br />
Tula: 267 100 292 100 295 100<br />
Pesado 76 28.5 96 32.9 99 33.6<br />
Ligero 189 70.8 194 66.4 195 66.1<br />
Superligero 1 0.3<br />
Reconstituido 2 0.7 1 0.3 1 0.3<br />
Otras Corrientes<br />
Totales: 1285 100 1303 100 1284 100<br />
Pesado 424 33.0 494 37.9 532 41.4<br />
Ligero 811 63.1 757 58.1 728 56.7<br />
Superligero 5 0.4 4 0.3 14 1.1<br />
Reconstituido 42 3.3 46 3.5 8 0.6<br />
Otras Corrientes 3 0.2 2 0.2 2 0.2<br />
Fuente:<br />
(1) www.pemex.com.mx, Informe Estadistico <strong>de</strong> Labores 2005, Cuadro 33, página 49<br />
27
<strong>Potenciales</strong> y <strong>Viabilidad</strong> <strong><strong>de</strong>l</strong> <strong>Uso</strong> <strong>de</strong> <strong>Bioetanol</strong> y <strong>Biodies<strong>el</strong></strong> <strong>para</strong> <strong>el</strong> Transporte en México (SENER-BID-GTZ)<br />
Task 2 & Task A: Mexico’s energy picture with regard to bioethanol and biodies<strong>el</strong><br />
5.2 Rendimientos <strong>de</strong> Productos Observados en <strong>el</strong> Sistema Nacional <strong>de</strong> Refinación<br />
(SNR)<br />
De los datos reportados <strong>el</strong> 41 por ciento <strong><strong>de</strong>l</strong> total procesado en 2005, correspondió al crudo<br />
pesado tipo Maya, seguido por cerca <strong><strong>de</strong>l</strong> 57 por ciento <strong><strong>de</strong>l</strong> ligero tipo Istmo y <strong>el</strong> 2 por ciento<br />
restante, estuvo ocupado principalmente por <strong>el</strong> superligero y reconstituido.<br />
Con base en esta canasta <strong>de</strong> crudos procesados <strong>el</strong> rendimiento promedio <strong>de</strong> gasolinas se situó<br />
en cerca <strong><strong>de</strong>l</strong> 35 por ciento; mientras que <strong>el</strong> dies<strong>el</strong> registró valores cercanos al 25 por ciento y <strong>el</strong><br />
Combustóleo (equivalente al Fu<strong>el</strong> Oil No. 6) con 27 por ciento, en suma estos tres productos<br />
contabilizaron <strong>el</strong> 87 por ciento <strong><strong>de</strong>l</strong> total <strong><strong>de</strong>l</strong> petróleo crudo procesado, la diferencia <strong>el</strong> 13 por<br />
ciento, lo ocuparon <strong>el</strong> gas licuado, <strong>el</strong> asfalto, las bases <strong>para</strong> aceites lubricantes entre otros,<br />
éstos datos se presentan en la tabla 5.2.<br />
28<br />
Tabla 5.2 Elaboración <strong>de</strong> Productos en <strong>el</strong> SNR<br />
Elaboración <strong>de</strong> productos petroliferos (1)<br />
Cifras en Miles <strong>de</strong> Barriles por Día<br />
2003 Porcentaje 2004 Porcentaje 2005 Porcentaje<br />
Proceso <strong>de</strong> Crudo: 1286 1303 1284<br />
Total petrolíferos: 1343 193.9 1361 193.4 1337 191.7<br />
Gas seco (2) 51 4.0 50 3.8 52 4.0<br />
Gas licuado 34 2.6 28 2.1 31 2.4<br />
Gasolinas: 446 34.7 466 35.8 455 35.4<br />
PEMEX Magna 397 30.9 418 32.1 412 32.1<br />
PEMEX Premium 38 3.0 44 3.4 38 3.0<br />
Base 10 0.8 4 0.3 5 0.4<br />
Otras 1 0.1<br />
Querosenos: 60 4.7 62 4.8 63 4.9<br />
Trubosina 60 62 63<br />
Dies<strong>el</strong>: 308 24.0 325 24.9 318 24.8<br />
PEMEX Dies<strong>el</strong> 291 22.6 320 24.6 312 24.3<br />
Carga HDS 16 1.2 5 0.4 6 0.5<br />
Desulfurado 1 0.1<br />
Combustóleo (3) : 396 30.8 368 28.2 350 27.3<br />
Pesado 396 30.8 368 28.2 350 27.3<br />
Intermedio 15 1 0.1<br />
Asfaltos 26 2.0 27 2.1 29 2.3<br />
Lubricantes 5 0.4 5 0.4 5 0.4<br />
Coque 16 1.2 28 2.1 29 2.3<br />
Otros 1 0.1 2 0.2 5 0.4<br />
Retorno <strong>de</strong> productos por maquila 94 80 65<br />
Gasolinas (4) 87 79 62<br />
Dies<strong>el</strong> 5 1 3<br />
Otros 2<br />
Notas:<br />
(1) www.pemex.com.mx, Informe Estadistico <strong>de</strong> Labores 2005, Cuadro 33, página 50<br />
(2) Miles <strong>de</strong> barriles <strong>de</strong> petroleo crudo equivalente por dia<br />
(3) Incluye transferencia <strong>de</strong> <strong>de</strong>spuntado <strong>de</strong> La Cangrejera a combustóleo<br />
(4) Incluye componentes
<strong>Potenciales</strong> y <strong>Viabilidad</strong> <strong><strong>de</strong>l</strong> <strong>Uso</strong> <strong>de</strong> <strong>Bioetanol</strong> y <strong>Biodies<strong>el</strong></strong> <strong>para</strong> <strong>el</strong> Transporte en México (SENER-BID-GTZ)<br />
Task 2 & Task A: Mexico’s energy picture with regard to bioethanol and biodies<strong>el</strong><br />
6. Capacidad <strong>de</strong> Producción <strong>de</strong> Éteres en <strong>el</strong> SNR<br />
La capacidad <strong>de</strong> producción <strong><strong>de</strong>l</strong> éter metil terbutílico y <strong><strong>de</strong>l</strong> éter metil teramílico (conocidos por<br />
sus siglas en inglés como MTBE y TAME, respectivamente), se presenta la tabla 6.1<br />
Tabla 6.1 Capacidad Instalada <strong>de</strong> Producción <strong>de</strong> Éteres en <strong>el</strong> SNR(1)<br />
Cifras en Miles <strong>de</strong> Barriles por Día<br />
Refinería MTBE TAME<br />
Ca<strong>de</strong>reyta 2.9 0.0<br />
Ma<strong>de</strong>ro 2.5 2.3<br />
Minatitlán 0.0 0.0<br />
Salamanca 1.1 0.0<br />
Salina Cruz 0.7 1.5<br />
Tula 2.3 2.3<br />
Total 9.5 6.1<br />
Fuente:<br />
(1) Foro: Etanol, Caña <strong>de</strong> Azúcar y Energía: PEMEX Refinación, Etanol <strong>de</strong> origen agrícola como<br />
oxigenante <strong>para</strong> combustible, CANACINTRA Xalapa, Veracruz, 24 <strong>de</strong> noviembre <strong>de</strong> 2005.<br />
La capacidad <strong>de</strong> producción nacional <strong>de</strong> éstos oxigenantes es <strong><strong>de</strong>l</strong> or<strong>de</strong>n <strong>de</strong> 15.6 MBD. En<br />
términos <strong>de</strong> requerimientos <strong>de</strong> alcohol <strong>para</strong> su obtención (en la actualidad se usa metanol), se<br />
<strong>de</strong>mandan <strong>de</strong> 0.3 a 0.4 barriles por cada barril <strong>de</strong> éter, por tanto, <strong>el</strong> suministro <strong>de</strong> metanol<br />
diario es <strong><strong>de</strong>l</strong> or<strong>de</strong>n <strong>de</strong> 6,240 barriles, los cuáles son proporcionado a PEMEX Refinación por<br />
PEMEX Petroquímica que los produce en sus instalaciones localizadas en San Martín<br />
Texm<strong>el</strong>úcan, Puebla.<br />
Como se mencionó anteriormente, la <strong>de</strong>manda <strong>de</strong> compuestos oxigenados se ubicó <strong>el</strong> año<br />
pasado en <strong>el</strong> or<strong>de</strong>n <strong>de</strong> 23 mil barriles por día (MBD), situación que se tradujo en déficit <strong>de</strong><br />
cerca <strong>de</strong> 8 MBD, los cuáles se suministraron vía importaciones.<br />
29
<strong>Potenciales</strong> y <strong>Viabilidad</strong> <strong><strong>de</strong>l</strong> <strong>Uso</strong> <strong>de</strong> <strong>Bioetanol</strong> y <strong>Biodies<strong>el</strong></strong> <strong>para</strong> <strong>el</strong> Transporte en México (SENER-BID-GTZ)<br />
Task 2 & Task A: Mexico’s energy picture with regard to bioethanol and biodies<strong>el</strong><br />
7. Evolución <strong>de</strong> los Precios <strong>de</strong> Importación <strong>de</strong> Gasolinas y Componentes<br />
El valor <strong>de</strong> las importaciones <strong>de</strong> gasolinas y componentes (incluyendo <strong>el</strong> MTBE), se muestra<br />
en la figura 7.1.<br />
Figura 7.1 Evolución <strong>de</strong> los Precios <strong>de</strong> Importación <strong>de</strong> Gasolinas y Componentes (1)<br />
2,500<br />
60<br />
2,000<br />
1,500<br />
39.6<br />
1,346<br />
1,931<br />
37.8<br />
34.1<br />
41.7<br />
2,137<br />
52.4<br />
50<br />
40<br />
30<br />
1,000<br />
1,192<br />
1,033<br />
20<br />
500<br />
10<br />
0<br />
2000 2001 2002 2003 2004<br />
0<br />
Millones <strong>de</strong> Dólares<br />
Dólares/barril<br />
Fuente:<br />
(1) www.pemex.com.mx, PEMEX: Statistical Yearbook. páginas 5 y 53.<br />
De esta información se pue<strong>de</strong> establecer que entre <strong>el</strong> año 2004 y 2005, <strong>el</strong> valor <strong>de</strong> las<br />
importaciones <strong>de</strong> gasolinas y componentes se incrementó en más <strong>de</strong> 100 por ciento, como<br />
resultado <strong><strong>de</strong>l</strong> aumento en <strong>el</strong> precio y <strong>el</strong> volumen registrado en <strong>el</strong> mismo período, <strong>el</strong> cual pasó<br />
<strong>de</strong> 69 a 113 MBD (en esta cifra se incluye <strong>el</strong> MTBE).<br />
30
<strong>Potenciales</strong> y <strong>Viabilidad</strong> <strong><strong>de</strong>l</strong> <strong>Uso</strong> <strong>de</strong> <strong>Bioetanol</strong> y <strong>Biodies<strong>el</strong></strong> <strong>para</strong> <strong>el</strong> Transporte en México (SENER-BID-GTZ)<br />
Task 2 & Task A: Mexico’s energy picture with regard to bioethanol and biodies<strong>el</strong><br />
8. Mecanismo <strong>para</strong> la Determinación <strong>de</strong> los Precios al Público <strong>de</strong> los Combustibles<br />
<strong>para</strong> <strong>el</strong> Transporte<br />
El proceso mediante <strong>el</strong> cual se establecen los precios al público en México, es en cierta<br />
medida complicado por los componentes que lo integran. Para los fines <strong><strong>de</strong>l</strong> estudio en<br />
comento, lo importante es <strong>el</strong> valor que PEMEX recibe <strong>de</strong> cada litro <strong>de</strong> combustible que<br />
comercializa, a éste se le <strong>de</strong>nomina en la formula Precio PEMEX (i<strong>de</strong>ntificado en la tabla<br />
como Precio Ventas Producto).<br />
El criterio que es aplicado es <strong>el</strong> siguiente: <strong>el</strong> precio al público <strong>de</strong> un mes en particular<br />
(llamémosle al mes t o ), lo fija la Secretaría <strong>de</strong> Hacienda y Crédito Público (SHCP), tomando<br />
como base al porcentaje <strong>de</strong> inflación anualizada y la correspondiente <strong><strong>de</strong>l</strong> mes, teniendo como<br />
referencia <strong>el</strong> precio al público <strong><strong>de</strong>l</strong> último mes anterior.<br />
Así, <strong>el</strong> precio al público <strong><strong>de</strong>l</strong> mes t o <strong><strong>de</strong>l</strong> año “x”, se <strong>de</strong>terminaría partiendo <strong><strong>de</strong>l</strong> valor<br />
<strong>de</strong>terminado por la SHCP <strong>para</strong> ese mes, por tanto, <strong>el</strong> resultado se ilustra en la tabla 8.1.<br />
Tabla 8.1 Determinación <strong><strong>de</strong>l</strong> precio al público <strong>de</strong> productos, datos en pesos por metro<br />
cúbico (1)<br />
Concepto<br />
Producto: PEMEX<br />
Magna Premium Dies<strong>el</strong><br />
Precio Ventas Producto (PRef) (1) 5,165.62 6,113.75 4,349.18<br />
IEPS (2) 0.00 0.00 0.00<br />
Precio PEMEX (PPX) 5,165.62 6,113.75 4,349.18<br />
IVA (3)<br />
(PPX*0.15)=<br />
774.84<br />
(PPX*0.15)=<br />
917.06<br />
(PPX*0.15)=<br />
652.38<br />
Flete (FL) (4) 36.92 36.92 36.92<br />
IVA Flete (IVA FL )<br />
(FL*0.15)=<br />
5.54<br />
(FL*0.15)=<br />
5.54<br />
(FL*0.15)=<br />
5.54<br />
Precio Facturación Cliente E.S.<br />
(PFC)<br />
(PFM+ ME)=<br />
5,938.65<br />
(PFM+ ME)=<br />
7,020.93<br />
(PFM+ ME)=<br />
5,044.01<br />
Merma 0.74% (ME) (5)<br />
(PFM*0.0074)= (PFM*0.0074)=<br />
No aplica<br />
- 44.27<br />
- 52.34<br />
Precio Facturación con<br />
merma(PFM)<br />
(PP-MC- IVA MC )=<br />
5,982.93<br />
(PP-MC- IVA MC )=<br />
7,073.27<br />
(PP-MC- IVA MC )=<br />
5,044.01<br />
Margen comercial(MC) (6)<br />
(PP*0.0592)=<br />
380.06<br />
(PP*0.0592)=<br />
449.33<br />
(PP*0.042)=<br />
222.60<br />
IVA Margen comercial (IVA MC )<br />
(MC*0.15)=<br />
57.01<br />
(MC*0.15)=<br />
67.40<br />
(MC*0.15)=<br />
33.39<br />
Precio Público (PP) (7)<br />
PP =<br />
(PRef+IEPS+IVA+FL+IVA FL +MC+IVA MC )<br />
6,420.00 7,590.00 5,300.00<br />
(1) Fuente: PEMEX Refinación, Subdirección <strong>de</strong> Planeación, Coordinación y Evaluación<br />
Notas:<br />
(1) Precio Spot en la Costa Norteamericana <strong><strong>de</strong>l</strong> Golfo <strong>de</strong> México<br />
(2) Impuesto Especial sobre Producción y Servicios, <strong>el</strong> valor lo establece cada vez la SHCP<br />
(3) Impuesto al Valor Agregado, en todo <strong>el</strong> país se grava con <strong>el</strong> 15 por ciento, a excepción <strong>de</strong> la Frontera Sur que la tasa<br />
es <strong><strong>de</strong>l</strong> 10 por ciento.<br />
(4) El flete se establece como un valor fijo <strong>de</strong> 36.90 pesos por metro cúbico, asumiendo una distancia máxima <strong>de</strong> la<br />
terminal <strong>de</strong> almacenamiento al sitio <strong>de</strong> entrega <strong>de</strong> 20 kilómetros.<br />
(5) El factor <strong>de</strong> merma <strong>de</strong> 0.74 por ciento sólo se aplica a las gasolinas.<br />
(6) El margen comercial <strong>para</strong> <strong>el</strong> caso <strong>de</strong> las gasolinas es <strong>de</strong> 5.92 por ciento y <strong>para</strong> <strong>el</strong> dies<strong>el</strong> es <strong>de</strong> 4.20 por ciento.<br />
(7) Valor establecido <strong>para</strong> <strong>el</strong> mes t o por la SHCP<br />
31
<strong>Potenciales</strong> y <strong>Viabilidad</strong> <strong><strong>de</strong>l</strong> <strong>Uso</strong> <strong>de</strong> <strong>Bioetanol</strong> y <strong>Biodies<strong>el</strong></strong> <strong>para</strong> <strong>el</strong> Transporte en México (SENER-BID-GTZ)<br />
Task 2 & Task A: Mexico’s energy picture with regard to bioethanol and biodies<strong>el</strong><br />
Por tanto, <strong>para</strong> la evaluación <strong>de</strong> la factibilidad <strong><strong>de</strong>l</strong> empleo <strong>de</strong> los biocombustibles sólo se<br />
<strong>de</strong>berá consi<strong>de</strong>rar <strong>el</strong> Precio Ventas Producto (marcado con rojo en la tabla), que se convierte<br />
<strong>para</strong> todo fin práctico en <strong>el</strong> precio <strong>de</strong> oportunidad ya sea <strong>de</strong> la gasolina y <strong>el</strong> dies<strong>el</strong>, así como <strong>de</strong><br />
los compuestos oxigenantes como <strong>el</strong> MTBE y <strong>el</strong> TAME.<br />
Si al <strong>de</strong>terminar <strong>el</strong> precio ventas producto <strong>de</strong> los biocombustibles este resultase superior al <strong>de</strong><br />
las gasolinas y <strong>el</strong> dies<strong>el</strong>, sería necesario <strong>de</strong>terminar a quién se le <strong>de</strong>berá otorgar <strong>el</strong> apoyo <strong>para</strong><br />
la s<strong>el</strong>ección <strong><strong>de</strong>l</strong> compuesto oxigenante sea indiferente al precio (es <strong>de</strong>cir, <strong>de</strong>cidir entre <strong>el</strong> uso<br />
<strong>de</strong> MTBE y TAME, versus ETBE y TAEE, o etanol).<br />
9. Escenarios <strong>para</strong> la Evaluación <strong>de</strong> la Factibilidad <strong><strong>de</strong>l</strong> Empleo <strong>de</strong> los Biocombustibles<br />
9.1 <strong>Bioetanol</strong><br />
En la reunión c<strong>el</strong>ebrada en la Secretaría <strong>de</strong> Energía (SENER), <strong>el</strong> pasado 14 y 15 <strong>de</strong> marzo <strong><strong>de</strong>l</strong><br />
2006, se aceptaron por las diferentes entida<strong>de</strong>s participantes los siguientes:<br />
• Escenario No.1 :<br />
Sustitución <strong>de</strong> la producción nacional <strong>de</strong> MTBE y TAME por ETBE y TAEE,<br />
manteniendo las importaciones <strong>de</strong> MTBE necesarias <strong>para</strong> satisfacer la <strong>de</strong>manda <strong>de</strong> las<br />
gasolinas oxigenadas <strong>de</strong> las Zonas Metropolitanas <strong>de</strong> Guadalajara, Monterrey y Valle<br />
<strong>de</strong> México.<br />
• Escenario No. 2 :<br />
Eliminación <strong><strong>de</strong>l</strong> empleo <strong>de</strong> éteres en la formulación <strong>de</strong> gasolinas, manteniéndose la<br />
exigencia <strong>de</strong> oxigenación <strong>de</strong> gasolinas en las Zonas Metropolitanas, lo que se lograría a<br />
través <strong><strong>de</strong>l</strong> empleo <strong>de</strong> etanol.<br />
• Escenario No.3 :<br />
En éste se incorporaría a<strong>de</strong>más <strong><strong>de</strong>l</strong> empleo <strong>de</strong> etanol como oxigenante, la sustitución<br />
<strong><strong>de</strong>l</strong> 10 por ciento <strong>de</strong> la diferencia en volumen <strong>de</strong> las ventas nacionales <strong>de</strong> gasolinas<br />
menos <strong>el</strong> volumen consi<strong>de</strong>rado en <strong>el</strong> escenario no.2.<br />
Consi<strong>de</strong>rando que <strong>el</strong> volumen resultante <strong>de</strong> la operación anterior emplearía una mezcla<br />
<strong>de</strong> 10 por ciento etanol y 90 por ciento <strong>de</strong> gasolina)<br />
32
<strong>Potenciales</strong> y <strong>Viabilidad</strong> <strong><strong>de</strong>l</strong> <strong>Uso</strong> <strong>de</strong> <strong>Bioetanol</strong> y <strong>Biodies<strong>el</strong></strong> <strong>para</strong> <strong>el</strong> Transporte en México (SENER-BID-GTZ)<br />
Task 2 & Task A: Mexico’s energy picture with regard to bioethanol and biodies<strong>el</strong><br />
9.1.1 Pronóstico <strong>de</strong> Demanda <strong>de</strong> Gasolinas en <strong>el</strong> Período 2006 – 2014<br />
Se consi<strong>de</strong>ró que <strong>el</strong> período don<strong>de</strong> se evaluarían los escenarios propuestos, sería <strong>el</strong><br />
correspondiente <strong>de</strong> 2006 a 2012, la información proporcionada por PEMEX Refinación a<br />
través <strong>de</strong> la Subdirección <strong>de</strong> Planeación, Evaluación y Coordinación cubre <strong>el</strong> período <strong>de</strong> 2006<br />
a 2014.<br />
En las figuras 9.1 y 9.2 se presentan <strong>el</strong> pronóstico <strong>de</strong> la oferta y <strong>de</strong>manda esperada, así como<br />
la <strong>de</strong>manda segregada por tipo <strong>de</strong> gasolina.<br />
Figura 9.1 Pronóstico <strong>de</strong> Oferta y Demanda <strong>de</strong> Gasolinas<br />
Pronóstico <strong>de</strong> Oferta y Demanda <strong>de</strong> Gasolinas, 2006-2014 (1)<br />
Cifras en Miles <strong>de</strong> Barriles por Día<br />
676.6<br />
696.5<br />
716.8<br />
737.6<br />
759.2<br />
781.8<br />
805.0<br />
829.1<br />
854.6<br />
583.8 515.4 546.7<br />
764.8<br />
650.7 652.0 690.2 690.2 596.2<br />
2006 2007 2008 2009 2010 2011 2012 2013 2014<br />
Producción<br />
Ventas Internas<br />
Fuente:<br />
(1) PEMEX Refinación, Subdirección <strong>de</strong> Planeación, Evaluación y Coordinación<br />
33
<strong>Potenciales</strong> y <strong>Viabilidad</strong> <strong><strong>de</strong>l</strong> <strong>Uso</strong> <strong>de</strong> <strong>Bioetanol</strong> y <strong>Biodies<strong>el</strong></strong> <strong>para</strong> <strong>el</strong> Transporte en México (SENER-BID-GTZ)<br />
Task 2 & Task A: Mexico’s energy picture with regard to bioethanol and biodies<strong>el</strong><br />
Figura 9.2 Pronóstico <strong>de</strong> la Demanda por Tipo <strong>de</strong> Gasolinas<br />
Evolución <strong>de</strong> las Ventas Internas <strong>de</strong> Gasolinas, 2006 – 2014 (1)<br />
Cifras en Miles <strong>de</strong> Barriles por Día<br />
134.4<br />
141.5 147.7 153.7 160.2 165 169.9 174.9 180.1<br />
542.2 555.1 569.2 583.9 599.1 616.8 635.2 654.2 673.5<br />
2006 2007 2008 2009 2010 2011 2012 2013 2014<br />
PEMEX Magna<br />
PEMEX Premium<br />
Fuente:<br />
PEMEX Refinación, Subdirección <strong>de</strong> Planeación, Evaluación y<br />
Coordinación<br />
Con base en esta información, asumiendo que la <strong>de</strong>manda <strong>de</strong> las Zonas Metropolitanas <strong>para</strong> <strong>el</strong><br />
período 2006-2014, representaría <strong>el</strong> 30 por ciento <strong><strong>de</strong>l</strong> total <strong>de</strong> las gasolinas comercializadas en<br />
<strong>el</strong> país, situación que ha sucedido en los últimos 5 años, nos da como resultado la oferta <strong>de</strong><br />
gasolinas oxigenadas <strong>para</strong> estas regiones en <strong>el</strong> caso <strong>de</strong> la PEMEX Magna y a esta se suma <strong>el</strong><br />
total <strong>de</strong> la PEMEX Premium, lo que nos daría la distribución que se ilustra en la figura 9.3.<br />
34
<strong>Potenciales</strong> y <strong>Viabilidad</strong> <strong><strong>de</strong>l</strong> <strong>Uso</strong> <strong>de</strong> <strong>Bioetanol</strong> y <strong>Biodies<strong>el</strong></strong> <strong>para</strong> <strong>el</strong> Transporte en México (SENER-BID-GTZ)<br />
Task 2 & Task A: Mexico’s energy picture with regard to bioethanol and biodies<strong>el</strong><br />
Figura 9.3 Pronóstico <strong>de</strong> Ventas <strong>de</strong> Gasolinas Oxigenadas<br />
Pronóstico <strong>de</strong> las Ventas Internas <strong>de</strong> Gasolinas Oxigenadas, 2006-2014 (1)<br />
Cifras en Miles <strong>de</strong> Barriles por Día<br />
134.4 141.5 147.7 153.7 160.2 165.0<br />
169.9 174.9 180.1<br />
162.66 166.53 170.76 175.17 179.73 185.04 190.56 196.26 202.5<br />
2006 2007 2008 2009 2010 2011 2012 2013 2014<br />
PEMEX Magna<br />
PEMEX Premium<br />
Fuente:<br />
(1) PEMEX Refinación, Subdirección <strong>de</strong> Planeación, Evaluación y<br />
Coordinación<br />
35
<strong>Potenciales</strong> y <strong>Viabilidad</strong> <strong><strong>de</strong>l</strong> <strong>Uso</strong> <strong>de</strong> <strong>Bioetanol</strong> y <strong>Biodies<strong>el</strong></strong> <strong>para</strong> <strong>el</strong> Transporte en México (SENER-BID-GTZ)<br />
Task 2 & Task A: Mexico’s energy picture with regard to bioethanol and biodies<strong>el</strong><br />
9.1.2 Contenido <strong>de</strong> Oxígeno Máximo <strong>de</strong> los Compuestos Oxigenados<br />
En la figura 9.4, se presenta un gráfico que nos muestra <strong>el</strong> contenido máximo en peso <strong>de</strong><br />
oxígeno <strong>de</strong> cada uno <strong>de</strong> los compuestos oxigenados empleados en la formulación <strong>de</strong> las<br />
gasolinas.<br />
Figura 9.4 Contenido Máximo <strong>de</strong> Oxígeno<br />
Contenido Máximo <strong>de</strong> Oxígeno<br />
Datos en Porciento en Peso<br />
34.8<br />
18.2<br />
15.7<br />
15.7<br />
13.8<br />
MTBE TAME ETBE TAEE Etanol<br />
36
<strong>Potenciales</strong> y <strong>Viabilidad</strong> <strong><strong>de</strong>l</strong> <strong>Uso</strong> <strong>de</strong> <strong>Bioetanol</strong> y <strong>Biodies<strong>el</strong></strong> <strong>para</strong> <strong>el</strong> Transporte en México (SENER-BID-GTZ)<br />
Task 2 & Task A: Mexico’s energy picture with regard to bioethanol and biodies<strong>el</strong><br />
9.1.3 Consumo <strong>de</strong> Metanol y Etanol <strong>para</strong> la Producción <strong>de</strong> Éteres<br />
En la figura 9.5, se ilustra <strong>el</strong> consumo <strong>de</strong> alcoholes requerido <strong>para</strong> la producción <strong>de</strong> cada barril<br />
<strong>de</strong> éter (pudiéndose emplear metanol o etano según sea <strong>el</strong> caso).<br />
Figura 9.5 Consumo <strong>de</strong> Alcohol <strong>para</strong> la Producción <strong>de</strong> Éteres<br />
Consumo <strong>de</strong> Metanol y Etanol <strong>para</strong> la Producción <strong>de</strong> Éteres<br />
Datos en barril <strong>de</strong> alcohol por barril <strong>de</strong> éter<br />
0.34<br />
0.3<br />
0.46<br />
0.41<br />
MTBE TAME ETBE TAEE<br />
Metanol<br />
Etanol<br />
9.1.4 Pronóstico <strong>de</strong> Demanda <strong>de</strong> Compuestos Oxigenados<br />
Consi<strong>de</strong>rando <strong>el</strong> niv<strong>el</strong> promedio <strong>de</strong> contenido <strong>de</strong> oxígeno en 1.5 por ciento en peso, los<br />
requerimientos <strong>de</strong> compuestos oxigenados <strong>para</strong> cada escenario, estimados con base al MTBE<br />
(expresados <strong>para</strong> <strong>el</strong> caso <strong><strong>de</strong>l</strong> estudio en términos <strong>de</strong> ETBE) que es <strong>el</strong> producto más<br />
ampliamente ofertado en <strong>el</strong> mercado, en las tablas 9.1 a 9.4 se resumen los pronósticos <strong>de</strong><br />
<strong>de</strong>manda <strong>de</strong> compuestos oxigenados <strong>para</strong> cada escenario.<br />
37
<strong>Potenciales</strong> y <strong>Viabilidad</strong> <strong><strong>de</strong>l</strong> <strong>Uso</strong> <strong>de</strong> <strong>Bioetanol</strong> y <strong>Biodies<strong>el</strong></strong> <strong>para</strong> <strong>el</strong> Transporte en México (SENER-BID-GTZ)<br />
Task 2 & Task A: Mexico’s energy picture with regard to bioethanol and biodies<strong>el</strong><br />
Tabla 9.1 Pronóstico <strong>de</strong> Demanda <strong>de</strong> Compuestos Oxigenados<br />
Caso: 1.5 por ciento <strong>de</strong> oxígeno máximo<br />
Escenario Oxigenante empleado Demanda esperada, MBD<br />
2006 2010 2014<br />
No.1 ETBE 28.5 32.6 36.7<br />
No.2 Etanol 12.8 14.6 16.5<br />
No.3 Etanol 16.6 18.8 21.2<br />
Si estimamos una concentración máxima <strong>de</strong> oxígeno <strong>de</strong> 2 por ciento en peso, <strong>el</strong> resultado<br />
esperado se ilustra en la tabla 9.2.<br />
Tabla 9.2 Pronóstico <strong>de</strong> Demanda <strong>de</strong> Compuestos Oxigenados<br />
Caso: 2.0 por ciento <strong>de</strong> oxígeno máximo<br />
Escenario Oxigenante empleado Demanda esperada, MBD<br />
2006 2010 2014<br />
No.1 ETBE 37.7 43.2 48.6<br />
No.2 Etanol 16.9 19.4 21.8<br />
No.3 Etanol 20.7 23.6 26.5<br />
Para <strong>el</strong> caso <strong><strong>de</strong>l</strong> escenario 1, <strong>el</strong> balance esperado entre la <strong>de</strong>manda <strong>de</strong> oxigenantes y capacidad<br />
<strong>de</strong> producción instalada en <strong>el</strong> SNR, se presenta en la tabla 9.3.<br />
Tabla 9.3 Balance <strong>de</strong> Demanda <strong>de</strong> Oxigenantes<br />
Caso: Escenario 1<br />
Concepto Por ciento <strong>de</strong> 2006 2010 2014<br />
oxígeno<br />
Producción 1.5 15.6 15.6 15.6<br />
Demanda 28.5 32.6 36.7<br />
Déficit 12.9 17.0 21.1<br />
Producción 2.0 15.6 15.6 15.6<br />
Demanda 37.7 43.2 48.6<br />
Déficit 22.1 27.6 33.0<br />
Como pue<strong>de</strong> observarse <strong>el</strong> déficit <strong>de</strong> compuestos oxigenantes que se presentaría en <strong>el</strong> período<br />
bajo estudio se ubicaría entre los 13 y los 33 MBD, según sea <strong>el</strong> contenido <strong>de</strong> oxígeno<br />
empleado en la formulación <strong>de</strong> las gasolinas en comento, cantida<strong>de</strong>s que serían abastecidas<br />
por la vía <strong>de</strong> importaciones <strong>de</strong> MTBE y/o <strong>de</strong> ETBE. Éste último es una <strong>de</strong> las alternativas que<br />
38
<strong>Potenciales</strong> y <strong>Viabilidad</strong> <strong><strong>de</strong>l</strong> <strong>Uso</strong> <strong>de</strong> <strong>Bioetanol</strong> y <strong>Biodies<strong>el</strong></strong> <strong>para</strong> <strong>el</strong> Transporte en México (SENER-BID-GTZ)<br />
Task 2 & Task A: Mexico’s energy picture with regard to bioethanol and biodies<strong>el</strong><br />
están siguiendo los refinadores en <strong>el</strong> entorno mundial, al consi<strong>de</strong>rarse <strong>de</strong>ntro <strong>de</strong> los<br />
combustibles renovables por <strong>el</strong> empleo <strong><strong>de</strong>l</strong> bioetanol en su producción.<br />
Para satisfacer la producción nacional <strong>de</strong> ETBE y TAEE; consi<strong>de</strong>rando que <strong>para</strong> producir cada<br />
barril <strong>de</strong> éstos éteres se requieren 0.46 y 0.41 barriles <strong><strong>de</strong>l</strong> alcohol, respectivamente, serán<br />
necesarios los volúmenes <strong>de</strong> etanol que se presentan en la tabla 9.4.<br />
Tabla 9.4 Demanda Esperada <strong>de</strong> Etanol <strong>para</strong> la Producción <strong>de</strong> Éteres<br />
Concepto<br />
Etanol <strong>para</strong> la<br />
producción <strong>de</strong><br />
éteres<br />
Por ciento <strong>de</strong><br />
oxígeno<br />
2006 2010 2014<br />
1.5 13.1 15.0 16.9<br />
2.0 17.4 19.9 22.4<br />
En las tablas 9.5 y 9.6 se presentan los pronósticos <strong>de</strong> <strong>de</strong>manda anualizados tanto <strong>de</strong> MTBE y<br />
TAME, como <strong>de</strong> ETBE y TAEE, los correspondientes <strong>de</strong> metanol y etanol <strong>para</strong> su producción,<br />
así como <strong>el</strong> <strong>de</strong> éste último en <strong>el</strong> caso <strong>de</strong> usarse <strong>para</strong> <strong>el</strong> mezclado con gasolinas <strong>para</strong> obtener <strong>el</strong><br />
mismo contenido <strong>de</strong> oxígeno.<br />
Tabla 9.5 Pronóstico <strong>de</strong> Demanda <strong>de</strong> Éteres y Etanol<br />
2006 2007 2008 2009 2010 2011 2012 2013 2014<br />
Demanda <strong>de</strong> Gasolinas, MBD 297.1 308.0 318.5 328.9 339.9 350.0 365.4 371.2 382.6<br />
Requerimientos <strong>de</strong> Oxigenantes, MBD:<br />
Asumiendo 1.5 por ciento en peso <strong>de</strong> oxigeno<br />
MTBE 24.5 25.4 26.2 27.1 28.0 28.8 30.1 30.6 31.5<br />
TAME 28.5 29.6 30.6 31.6 32.6 33.6 35.1 35.6 36.7<br />
ETBE 28.5 29.6 30.6 31.6 32.6 33.6 35.1 35.6 36.7<br />
TAEE 32.4 33.6 34.7 35.8 37.1 38.2 39.8 40.5 41.7<br />
Etanol 12.8 13.2 13.7 14.1 14.6 15.1 15.7 16.0 16.5<br />
Requerimientos <strong>de</strong> Oxigenantes, MBD:<br />
Asumiendo 2.0 por ciento en peso <strong>de</strong> oxigeno<br />
Demanda Esperada <strong>de</strong> Éteres y Etanol como Oxigenante (1)<br />
MTBE 32.7 33.9 35.0 36.2 37.4 38.5 40.2 40.8 42.1<br />
TAME 37.7 39.1 40.4 41.8 43.2 44.5 46.4 47.1 48.6<br />
ETBE 37.7 39.1 40.4 41.8 43.2 44.5 46.4 47.1 48.6<br />
TAEE 43.1 44.7 46.2 47.7 49.3 50.8 53.0 53.8 55.5<br />
Etanol 16.9 17.6 18.2 18.7 19.4 20.0 20.8 21.2 21.8<br />
(1) Cifras estimadas con base a la información proporcionada por la Subdirección <strong>de</strong> Planeación, Evaluación y Coordinación <strong>de</strong> PEMEX Refinación<br />
39
<strong>Potenciales</strong> y <strong>Viabilidad</strong> <strong><strong>de</strong>l</strong> <strong>Uso</strong> <strong>de</strong> <strong>Bioetanol</strong> y <strong>Biodies<strong>el</strong></strong> <strong>para</strong> <strong>el</strong> Transporte en México (SENER-BID-GTZ)<br />
Task 2 & Task A: Mexico’s energy picture with regard to bioethanol and biodies<strong>el</strong><br />
Tabla 9.6 Pronóstico <strong>de</strong> Demanda <strong>de</strong> Metanol y Etanol <strong>para</strong> la Producción <strong>de</strong> Éteres<br />
Requerimientos <strong>de</strong> Oxigenantes, MBD: 2006 2007 2008 2009 2010 2011 2012 2013 2014<br />
Asumiendo 1.5 por ciento en peso <strong>de</strong> oxigeno<br />
MTBE 24.5 25.4 26.2 27.1 28.0 28.8 30.1 30.6 31.5<br />
TAME 28.5 29.6 30.6 31.6 32.6 33.6 35.1 35.6 36.7<br />
ETBE 28.5 29.6 30.6 31.6 32.6 33.6 35.1 35.6 36.7<br />
TAEE 32.4 33.6 34.7 35.8 37.1 38.2 39.8 40.5 41.7<br />
Demanda <strong>de</strong> Metanol, MBD:<br />
MTBE 8.3 8.6 8.9 9.2 9.5 9.8 10.2 10.4 10.7<br />
TAME 8.6 8.9 9.2 9.5 9.8 10.1 10.5 10.7 11.0<br />
Demanda <strong>de</strong> Etanol, MBD:<br />
ETBE 13.1 13.6 14.1 14.5 15.0 15.5 16.1 16.4 16.9<br />
TAEE 13.3 13.8 14.2 14.7 15.2 15.6 16.3 16.6 17.1<br />
Requerimientos <strong>de</strong> Oxigenantes, MBD:<br />
Asumiendo 2.0 por ciento en peso <strong>de</strong> oxigeno<br />
Estimacion <strong>de</strong> los requerimientos <strong>de</strong> Metanol y Etanol <strong>para</strong> la producción <strong>de</strong> éteres (1)<br />
MTBE 32.7 33.9 35.0 36.2 37.4 38.5 40.2 40.8 42.1<br />
TAME 37.7 39.1 40.4 41.8 43.2 44.5 46.4 47.1 48.6<br />
ETBE 37.7 39.1 40.4 41.8 43.2 44.5 46.4 47.1 48.6<br />
TAEE 43.1 44.7 46.2 47.7 49.3 50.8 53.0 53.8 55.5<br />
Demanda <strong>de</strong> Metanol, MBD:<br />
MTBE 11.1 11.5 11.9 12.3 12.7 13.1 13.7 13.9 14.3<br />
TAME 11.3 11.7 12.1 12.5 13.0 13.3 13.9 14.1 14.6<br />
Demanda <strong>de</strong> Etanol, MBD:<br />
ETBE 17.4 18.0 18.6 19.2 19.9 20.4 21.3 21.7 22.4<br />
TAEE 17.7 18.3 18.9 19.6 20.2 20.8 21.7 22.1 22.7<br />
(1) Cifras estimadas con base a la información proporcionada por la Subdirección <strong>de</strong> Planeación, Evaluación y Coordinación <strong>de</strong> PEMEX Refinación<br />
Estos volúmenes <strong>de</strong> etanol <strong>de</strong>berán presentar <strong>el</strong> mismo costo que <strong>el</strong> metanol en <strong>el</strong> período bajo<br />
estudio a la puerta <strong>de</strong> cada refinería, datos que se muestran en la figura 9.6.<br />
40
<strong>Potenciales</strong> y <strong>Viabilidad</strong> <strong><strong>de</strong>l</strong> <strong>Uso</strong> <strong>de</strong> <strong>Bioetanol</strong> y <strong>Biodies<strong>el</strong></strong> <strong>para</strong> <strong>el</strong> Transporte en México (SENER-BID-GTZ)<br />
Task 2 & Task A: Mexico’s energy picture with regard to bioethanol and biodies<strong>el</strong><br />
Figura 9.6 Precios <strong>de</strong> Largo Plazo <strong>de</strong> Metanol en cada Refinería<br />
Precios Largo Plazo <strong>de</strong> Metanol en cada Refinería, 2006-2012 (1)<br />
Cifras en US Dólar por Barril<br />
40.28 40.28 41.16 40.34 40.9 41.16<br />
42.75 42.75 43.63 42.81 43.37 43.62<br />
39.65<br />
42.12<br />
40.5 40.49 41.38 40.56 41.12 41.37 39.87<br />
42.75 42.75 43.63 42.81 43.37 43.62 42.12<br />
44.51 44.51 45.39 44.58 45.14 45.39 43.88<br />
44.51 44.51 45.39 44.58 45.14 45.39 43.88<br />
2006 2007 2008 2009 2010 2011 2012<br />
Ca<strong>de</strong>reyta Ma<strong>de</strong>ro Minatitlán<br />
Salamanca S. Cruz Tula<br />
Fuente:<br />
(1) PEMEX Refinación, Subdirección <strong>de</strong> Planeación, Coordinación y Evaluación.<br />
41
<strong>Potenciales</strong> y <strong>Viabilidad</strong> <strong><strong>de</strong>l</strong> <strong>Uso</strong> <strong>de</strong> <strong>Bioetanol</strong> y <strong>Biodies<strong>el</strong></strong> <strong>para</strong> <strong>el</strong> Transporte en México (SENER-BID-GTZ)<br />
Task 2 & Task A: Mexico’s energy picture with regard to bioethanol and biodies<strong>el</strong><br />
Con referencia a los escenarios 2 y 3, <strong>el</strong> valor <strong><strong>de</strong>l</strong> etanol <strong>de</strong>bería ser <strong>el</strong> esperado <strong>para</strong> <strong>el</strong> caso<br />
<strong><strong>de</strong>l</strong> MTBE a la puerta <strong>de</strong> cada refinería, datos que se ilustran en la figura 9.7.<br />
Figura 9.7 Precios <strong>de</strong> Largo Plazo <strong>de</strong> MTBE en cada Refinería<br />
Precios Largo Plazo <strong>de</strong> Importaciones <strong>de</strong> MTBE en cada Refinería, 2006-2012 (1)<br />
Cifras en US Dólar por Barril<br />
75.62<br />
75.44<br />
76.09<br />
75.12<br />
75.06<br />
75.99<br />
62<br />
61.82<br />
62.47<br />
61.49<br />
61.44<br />
62.37<br />
51.38 50.14<br />
47.9 47.95 49.16<br />
51.2 49.96<br />
47.72 47.77 48.98<br />
51.85 50.61 48.37 48.42 49.63<br />
50.87 49.63 47.39 47.44 48.65<br />
50.82 49.58 47.34 47.39 48.6<br />
51.75 50.51 48.27 48.32 49.53<br />
2006 2007 2008 2009 2010 2011 2012<br />
Ca<strong>de</strong>reyta Ma<strong>de</strong>ro Minatitlán<br />
Salamanca S. Cruz Tula<br />
Fuente:<br />
(1) PEMEX Refinación, Subdirección <strong>de</strong> Planeación, Coordinación y Evaluación.<br />
9.1.5 Inversiones <strong>para</strong> la Conversión <strong>de</strong> las Instalaciones Actuales <strong>de</strong> Producción <strong>de</strong><br />
Éteres <strong><strong>de</strong>l</strong> SNR<br />
Los datos que se presentan en la tabla 9.7 fueron proporcionados por la compañía CD Tech,<br />
unos <strong>de</strong> los tecnólogos <strong>de</strong> los procesos <strong>para</strong> la obtención <strong>de</strong> MTBE y TAME. Las cifras están<br />
expresadas en dólares por cada barril <strong>de</strong> capacidad instalada e indican la inversión necesaria<br />
modificar estas unida<strong>de</strong>s <strong>para</strong> la producción <strong>de</strong> ETBE y TAEE.<br />
Adicionalmente, se reporta en las mismas unida<strong>de</strong>s los valores correspondientes <strong>para</strong> la<br />
conversión <strong>de</strong> las plantas <strong>de</strong> MTBE en isooctano.<br />
42
<strong>Potenciales</strong> y <strong>Viabilidad</strong> <strong><strong>de</strong>l</strong> <strong>Uso</strong> <strong>de</strong> <strong>Bioetanol</strong> y <strong>Biodies<strong>el</strong></strong> <strong>para</strong> <strong>el</strong> Transporte en México (SENER-BID-GTZ)<br />
Task 2 & Task A: Mexico’s energy picture with regard to bioethanol and biodies<strong>el</strong><br />
Tabla 9.7 Inversiones <strong>para</strong> la Conversión <strong>de</strong> Plantas <strong>de</strong> Éteres<br />
Planta<br />
Capacidad<br />
instalada,<br />
MBD<br />
Inversión <strong>para</strong> conversión a, en<br />
Dólares por Barril<br />
ETBE TAEE Isooctano<br />
MTBE 9.5 240 150<br />
TAME 6.1 480<br />
Inversión Total,<br />
MM Dólares<br />
2.3 2.9 1.4<br />
Los recursos necesarios producir este tipo <strong>de</strong> éteres representan <strong><strong>de</strong>l</strong> or<strong>de</strong>n <strong>de</strong> 5.2 millones <strong>de</strong><br />
dólares, cantidad que repercutiría en <strong>el</strong> costo <strong>de</strong> producción <strong>de</strong> las gasolinas oxigenadas en<br />
cerca <strong>de</strong> 0.90 dólares por barril.<br />
A<strong>de</strong>más, es necesario consi<strong>de</strong>rar <strong>el</strong> período <strong>para</strong> la modificación <strong>de</strong> las instalaciones, <strong>el</strong> cual se<br />
estima en cerca <strong>de</strong> dos años, consi<strong>de</strong>rando <strong>de</strong>s<strong>de</strong> su inicio que incluye <strong>el</strong> proceso <strong>de</strong> licitación<br />
hasta la conclusión <strong>de</strong> los cambios necesarios en cada unidad <strong>de</strong> proceso y la puesta en<br />
operación <strong>de</strong> la misma.<br />
9.1.6 Implicaciones <strong>de</strong> la Formulación <strong>de</strong> Mezclas <strong>Bioetanol</strong> con Gasolina<br />
Con base en las formulaciones actuales, los éteres (MTBE y TAME), amén <strong>de</strong> usarse <strong>para</strong><br />
aportar <strong>el</strong> contenido <strong>de</strong> oxígeno especificado, contribuyen en promedio con <strong>el</strong> 8.3 por ciento al<br />
volumen total <strong>de</strong> las gasolinas producidas en <strong>el</strong> país.<br />
El mezclado <strong>de</strong> gasolinas con etanol en <strong>el</strong> escenario 2, en <strong>el</strong> cual se plantea la prohibición <strong><strong>de</strong>l</strong><br />
uso <strong>de</strong> éteres, implicaría que se afectaría <strong>el</strong> volumen <strong>de</strong> gasolinas producidas; ya que <strong>para</strong><br />
aportar <strong>el</strong> 1.5 por ciento en peso <strong>de</strong> oxígeno se requieren <strong><strong>de</strong>l</strong> or<strong>de</strong>n <strong>de</strong> 4.3 por ciento en<br />
volumen <strong>de</strong> etanol, lo cual reduciría en 4 por ciento <strong>el</strong> total obtenido, cantidad que se tendría<br />
que sustituir con otro u otros componentes <strong>para</strong> lograr <strong>el</strong> cumplimiento <strong>de</strong> las especificaciones,<br />
incrementando <strong>el</strong> costo <strong>de</strong> producción en función <strong><strong>de</strong>l</strong> producto empleado <strong>para</strong> lograrlo.<br />
En <strong>el</strong> caso particular <strong>de</strong> las gasolinas PEMEX Magna y Premium que se comercializan en las<br />
Zonas Metropolitanas <strong>de</strong> Guadalajara y <strong>el</strong> Valle <strong>de</strong> México (ZMG y ZMVM), se sumaría la<br />
reducción en la producción que se tendría <strong>para</strong> ajustar la base <strong>para</strong> mezcla por cuanto a la<br />
PVR, ya que la mezcla <strong>de</strong> ésta con etanol <strong>de</strong>berá satisfacer <strong>el</strong> rango especificado <strong>de</strong> 6.5 a 7.8<br />
psi, a lo largo <strong>de</strong> todo <strong>el</strong> año.<br />
Al respecto, PEMEX ha <strong>de</strong>terminado que esta situación tendría un costo adicional <strong>de</strong> entre 2 a<br />
4 dólares por barril, asumiendo que etanol y <strong>el</strong> MTBE tuviesen <strong>el</strong> mismo precio a la puerta <strong>de</strong><br />
cada refinería 1 .<br />
1 PEMEX, Dirección Corporativa <strong>de</strong> Operaciones: Evaluación <strong><strong>de</strong>l</strong> uso <strong>de</strong> etanol <strong>para</strong> la producción <strong>de</strong> gasolinas, Enero 2006.<br />
43
<strong>Potenciales</strong> y <strong>Viabilidad</strong> <strong><strong>de</strong>l</strong> <strong>Uso</strong> <strong>de</strong> <strong>Bioetanol</strong> y <strong>Biodies<strong>el</strong></strong> <strong>para</strong> <strong>el</strong> Transporte en México (SENER-BID-GTZ)<br />
Task 2 & Task A: Mexico’s energy picture with regard to bioethanol and biodies<strong>el</strong><br />
La información disponible sobre los valores <strong>de</strong> mezclado <strong>de</strong> PVR y <strong>de</strong> octano <strong>de</strong> los<br />
compuestos mencionados, se muestran en la tabla 9.8.<br />
Tabla 9.8 Valores <strong>de</strong> Mezclado <strong>de</strong> Compuestos Oxigenados<br />
Producto<br />
Valor <strong>de</strong> Mezclado<br />
Octano, (R+M)/2 (1) PVR, psi (2)<br />
MTBE 110 8<br />
TAME 105 2<br />
ETBE 111 4<br />
TAEE 100 2<br />
Etanol 115 18<br />
(1) R = Research Octane Number; M = Motor Octane Number.<br />
(2) El valor <strong>de</strong> mezclado <strong>de</strong> PVR correspon<strong>de</strong> a un contenido <strong>de</strong> oxígeno <strong>de</strong> 2.7 por ciento en peso en la gasolina<br />
terminada.<br />
En la tabla anterior se pue<strong>de</strong> observar que si bien <strong>el</strong> etanol presenta un valor <strong>de</strong> octano <strong>de</strong><br />
mezclado superior a los éteres, pero en términos <strong>de</strong> PVR éste muestra datos <strong>de</strong> más <strong><strong>de</strong>l</strong> doble<br />
con respecto al MTBE, <strong>de</strong> 9 veces <strong>para</strong> <strong>el</strong> TAME y TAEE; así como <strong>de</strong> más <strong>de</strong> 4 veces <strong>para</strong> <strong>el</strong><br />
ETBE, lo que hace necesario reducir en este parámetro la base que se utilice <strong>para</strong> su mezcla<br />
<strong>para</strong> po<strong>de</strong>r así cumplir con la especificación vigente en cada caso, teniéndose <strong>el</strong> mayor<br />
impacto cuando <strong>el</strong> valor <strong>de</strong> la PVR está fijo como es <strong>el</strong> caso <strong>de</strong> las ZMG y ZMVM.<br />
En términos <strong>de</strong> formulación <strong>de</strong> gasolinas, la incorporación <strong><strong>de</strong>l</strong> etanol en su producción,<br />
implica <strong>el</strong>iminar en su pre<strong>para</strong>ción corrientes como los butanos y pentanos, las cuáles son <strong>de</strong><br />
bajo costo y alto octano, <strong>para</strong> sustituirlas por otras <strong>de</strong> mayor valor, lo cual incrementa <strong>el</strong> valor<br />
<strong>de</strong> cada barril <strong>de</strong> combustible.<br />
Por lo antes expuesto, la contribución <strong><strong>de</strong>l</strong> 8.3 por ciento en volumen <strong>de</strong> los éteres en la<br />
formulación <strong>de</strong> gasolinas se incrementa entre 10 a 12 por ciento cuando se sustituyen éstos por<br />
etanol.<br />
A<strong>de</strong>más, <strong>el</strong> mezclado <strong>de</strong> gasolinas con alcohol no pue<strong>de</strong> ser llevado a cabo en las refinerías,<br />
por lo que se <strong>de</strong>berán consi<strong>de</strong>rar las inversiones <strong>para</strong> po<strong>de</strong>r realizar esta operación en cada una<br />
<strong>de</strong> las terminales <strong>de</strong> almacenamiento y distribución, esto representa una erogación por cada<br />
instalación <strong><strong>de</strong>l</strong> or<strong>de</strong>n <strong>de</strong> 6.7 millones <strong>de</strong> dólares 2 , cifra que incluye <strong>el</strong> tanque <strong>de</strong><br />
almacenamiento <strong><strong>de</strong>l</strong> etanol, <strong>el</strong> sistema <strong>de</strong> mezclado, la a<strong>de</strong>cuaciones a las instalaciones, entre<br />
otros.<br />
Por tanto, con base en <strong>el</strong> precio estimado <strong>de</strong> producción <strong><strong>de</strong>l</strong> etanol a partir ya sea <strong>de</strong> caña <strong>de</strong><br />
azúcar, <strong>de</strong> remolacha o <strong><strong>de</strong>l</strong> cultivo que en <strong>el</strong> apartado agrícola se <strong>de</strong>termine más viable, se<br />
<strong>de</strong>berán establecer los apoyos que se otorgaran tanto al sector agrícola como al petrolero,<br />
estableciéndose los montos anualizados y sobre todo, la <strong>de</strong>pen<strong>de</strong>ncia que los negociará con la<br />
2 Ibi<strong>de</strong>m<br />
44
<strong>Potenciales</strong> y <strong>Viabilidad</strong> <strong><strong>de</strong>l</strong> <strong>Uso</strong> <strong>de</strong> <strong>Bioetanol</strong> y <strong>Biodies<strong>el</strong></strong> <strong>para</strong> <strong>el</strong> Transporte en México (SENER-BID-GTZ)<br />
Task 2 & Task A: Mexico’s energy picture with regard to bioethanol and biodies<strong>el</strong><br />
SHCP; así como los tiempos que se requerirían <strong>para</strong> consolidar la producción <strong>de</strong>mandada <strong>de</strong><br />
etanol, ya sea que se <strong>de</strong>stine <strong>para</strong> la producción <strong>de</strong> éteres o <strong>para</strong> <strong>el</strong> mezclado con gasolinas.<br />
Cabe mencionar que la mezcla <strong>de</strong> éteres (ETBE y TAEE) con gasolinas, no requiere <strong>de</strong><br />
infraestructura adicional, porque éstos se pue<strong>de</strong>n producir e incorporar en las refinerías,<br />
minimizando <strong>de</strong> esta forma los costos que se incurrirían al sustituir <strong>el</strong> metanol por <strong>el</strong> etanol y<br />
los correspondientes <strong>para</strong> la modificación <strong>de</strong> las instalaciones existentes (MTBE y TAME).<br />
9.2 <strong>Biodies<strong>el</strong></strong><br />
En la reunión c<strong>el</strong>ebrada en la Secretaría <strong>de</strong> Energía (SENER), <strong>el</strong> pasado 14 y 15 <strong>de</strong> marzo <strong><strong>de</strong>l</strong><br />
2006, se aceptaron por las diferentes entida<strong>de</strong>s participantes los siguientes:<br />
• Escenario No. 1 :<br />
Se plantea <strong>el</strong> uso <strong>de</strong> una mezcla <strong>de</strong> 5 por ciento <strong>de</strong> biodies<strong>el</strong> y <strong>el</strong> 95 por ciento restante<br />
<strong>de</strong> PEMEX Dies<strong>el</strong>.<br />
• Escenario No. 2 :<br />
En este se usa <strong>de</strong> una mezcla <strong>de</strong> 10 por ciento <strong>de</strong> biodies<strong>el</strong> y <strong>el</strong> 90 por ciento restante<br />
<strong>de</strong> PEMEX Dies<strong>el</strong>.<br />
• Escenario No. 3 :<br />
Se evaluará <strong>el</strong> uso <strong>de</strong> una mezcla <strong>de</strong> 20 por ciento <strong>de</strong> biodies<strong>el</strong> y <strong>el</strong> 80 por ciento<br />
restante <strong>de</strong> PEMEX Dies<strong>el</strong>.<br />
45
<strong>Potenciales</strong> y <strong>Viabilidad</strong> <strong><strong>de</strong>l</strong> <strong>Uso</strong> <strong>de</strong> <strong>Bioetanol</strong> y <strong>Biodies<strong>el</strong></strong> <strong>para</strong> <strong>el</strong> Transporte en México (SENER-BID-GTZ)<br />
Task 2 & Task A: Mexico’s energy picture with regard to bioethanol and biodies<strong>el</strong><br />
9.2.1 Pronóstico <strong>de</strong> Demanda <strong>de</strong> Dies<strong>el</strong> en <strong>el</strong> Período 2006-2014<br />
En <strong>el</strong> período bajo estudio, <strong>el</strong> pronóstico <strong>de</strong> oferta y <strong>de</strong>manda la <strong>de</strong> dies<strong>el</strong> se muestra en la<br />
figura 9.8.<br />
Figura 9.8 Pronóstico <strong>de</strong> Oferta y Demanda <strong>de</strong> Dies<strong>el</strong> ,2006-2014<br />
Pronóstico <strong>de</strong> Oferta y Demanda <strong>de</strong> Dies<strong>el</strong>, 2006-2014 (1)<br />
Cifras en Miles <strong>de</strong> Barriles por Día<br />
318.9<br />
327.8<br />
337.3<br />
347.7<br />
357.9<br />
368.9<br />
380.4<br />
392.0<br />
404.6<br />
331.9 341.9 370.9 355.4 375.3 379.2 387.5 392.1 414.1<br />
2006 2007 2008 2009 2010 2011 2012 2013 2014<br />
Producción<br />
Ventas Internas<br />
Fuente:<br />
(1) PEMEX Refinación, Subdirección <strong>de</strong> Planeación, Coordinación y Evaluación.<br />
De los datos se pue<strong>de</strong> observar que prácticamente la <strong>de</strong>manda estará atendida en su totalidad y<br />
que en algunos años se tendrán exce<strong>de</strong>ntes que podrán ser <strong>de</strong>stinados a la exportación.<br />
Por tanto, los escenarios <strong>de</strong> empleo <strong>de</strong> biodies<strong>el</strong> <strong>de</strong>berán ser evaluados como incremento <strong>de</strong><br />
exportaciones, usando <strong>para</strong> <strong>el</strong>lo los precios spot en la Costa Norteamericana <strong><strong>de</strong>l</strong> Golfo <strong>de</strong><br />
México (CNGM), estos datos se muestran en la figura 9.9.<br />
46
<strong>Potenciales</strong> y <strong>Viabilidad</strong> <strong><strong>de</strong>l</strong> <strong>Uso</strong> <strong>de</strong> <strong>Bioetanol</strong> y <strong>Biodies<strong>el</strong></strong> <strong>para</strong> <strong>el</strong> Transporte en México (SENER-BID-GTZ)<br />
Task 2 & Task A: Mexico’s energy picture with regard to bioethanol and biodies<strong>el</strong><br />
Figura 9.9 Cotizaciones Spot <strong>de</strong> Largo Plazo <strong>de</strong> Dies<strong>el</strong> en la CNGM<br />
Cotizaciones <strong>de</strong> Referencia <strong>de</strong> Dies<strong>el</strong> Importado (CNGM), 2006-2012 (1)<br />
Cifras en US Dólar por Barril<br />
57.06<br />
44.05<br />
32.95<br />
31.55<br />
29.27<br />
29.3<br />
30.51<br />
2006 2007 2008 2009 2010 2011 2012<br />
Dies<strong>el</strong> No.2 LS*<br />
Fuente:<br />
LS* = Low Sulfur Dies<strong>el</strong><br />
(1) PEMEX Refinación, Subdirección <strong>de</strong> Planeación, Coordinación y Evaluación, Datos referidos a la<br />
Costa Norteamericana <strong><strong>de</strong>l</strong> Golfo <strong>de</strong> México.<br />
47
<strong>Potenciales</strong> y <strong>Viabilidad</strong> <strong><strong>de</strong>l</strong> <strong>Uso</strong> <strong>de</strong> <strong>Bioetanol</strong> y <strong>Biodies<strong>el</strong></strong> <strong>para</strong> <strong>el</strong> Transporte en México (SENER-BID-GTZ)<br />
Task 2 & Task A: Mexico’s energy picture with regard to bioethanol and biodies<strong>el</strong><br />
Para <strong>el</strong> caso en que se presentase déficit en la producción <strong>de</strong> dies<strong>el</strong>, la incorporación <strong><strong>de</strong>l</strong><br />
biodies<strong>el</strong> en la formulación <strong><strong>de</strong>l</strong> PEMEX Diese <strong>de</strong>berá ser evaluado al precio que tendría <strong>el</strong><br />
dies<strong>el</strong> importado a la puerta <strong>de</strong> cada refinería, valores que se muestran en las figuras 9.10, 9.11<br />
y 9.12<br />
Figura 9.10 Precios <strong>de</strong> Largo Plazo <strong><strong>de</strong>l</strong> Dies<strong>el</strong> Importado en cada Refinería<br />
Precios Largo Plazo <strong>de</strong> Importación <strong>de</strong> Dies<strong>el</strong> en cada Refinería, 2006-2012 (1)<br />
Cifras en US Dólar por Barril<br />
60.0<br />
57.5<br />
55.0<br />
52.5<br />
50.0<br />
47.5<br />
45.0<br />
42.5<br />
40.0<br />
37.5<br />
35.0<br />
32.5<br />
30.0<br />
27.5<br />
25.0<br />
57.99<br />
57.06<br />
44.98<br />
44.05<br />
33.88<br />
32.48<br />
32.95<br />
31.55<br />
30.2<br />
30.23<br />
31.44<br />
29.27<br />
29.3<br />
30.51<br />
2006 2007 2008 2009 2010 2011 2012<br />
Ca<strong>de</strong>reyta<br />
Ma<strong>de</strong>ro<br />
Fuente:<br />
(1) PEMEX Refinación, Subdirección <strong>de</strong> Planeación, Coordinación y Evaluación.<br />
48
<strong>Potenciales</strong> y <strong>Viabilidad</strong> <strong><strong>de</strong>l</strong> <strong>Uso</strong> <strong>de</strong> <strong>Bioetanol</strong> y <strong>Biodies<strong>el</strong></strong> <strong>para</strong> <strong>el</strong> Transporte en México (SENER-BID-GTZ)<br />
Task 2 & Task A: Mexico’s energy picture with regard to bioethanol and biodies<strong>el</strong><br />
Figura 9.11 Precios <strong>de</strong> Largo Plazo <strong>de</strong> Importación <strong>de</strong> Dies<strong>el</strong> en cada Refinería<br />
Precios Largo Plazo <strong>de</strong> Importación <strong>de</strong> Dies<strong>el</strong> en cada Refinería, 2006-2012 (1)<br />
Cifras en US Dólar por Barril<br />
60.0<br />
57.5<br />
55.0<br />
52.5<br />
50.0<br />
47.5<br />
45.0<br />
42.5<br />
40.0<br />
37.5<br />
35.0<br />
32.5<br />
30.0<br />
27.5<br />
25.0<br />
58.09<br />
57.11<br />
45.08<br />
44.1<br />
33.99<br />
32.58<br />
31.54<br />
30.31<br />
30.34<br />
33.01<br />
31.6<br />
29.33 29.36<br />
30.56<br />
2006 2007 2008 2009 2010 2011 2012<br />
Minatitlan<br />
Salamanca<br />
Fuente:<br />
(1) PEMEX Refinación, Subdirección <strong>de</strong> Planeación, Coordinación y Evaluación.<br />
49
<strong>Potenciales</strong> y <strong>Viabilidad</strong> <strong><strong>de</strong>l</strong> <strong>Uso</strong> <strong>de</strong> <strong>Bioetanol</strong> y <strong>Biodies<strong>el</strong></strong> <strong>para</strong> <strong>el</strong> Transporte en México (SENER-BID-GTZ)<br />
Task 2 & Task A: Mexico’s energy picture with regard to bioethanol and biodies<strong>el</strong><br />
Figura 9.12 Precios <strong>de</strong> Largo Plazo <strong>de</strong> Importación <strong>de</strong> Dies<strong>el</strong> en cada Refinería<br />
Precios Largo Plazo <strong>de</strong> Importación <strong>de</strong> Dies<strong>el</strong> en cada Refinería, 2006-2012 (1)<br />
Cifras en US Dólar por Barril<br />
60.0<br />
57.5<br />
55.0<br />
52.5<br />
50.0<br />
47.5<br />
45.0<br />
42.5<br />
40.0<br />
37.5<br />
35.0<br />
32.5<br />
30.0<br />
27.5<br />
25.0<br />
57.43<br />
57.62<br />
44.42<br />
44.61<br />
33.33<br />
31.93<br />
30.89<br />
33.51<br />
29.65<br />
29.68<br />
32.11<br />
29.84<br />
29.87<br />
31.07<br />
2006 2007 2008 2009 2010 2011 2012<br />
Salina Cruz<br />
Tula<br />
Fuente:<br />
(1) PEMEX Refinación, Subdirección <strong>de</strong> Planeación, Coordinación y Evaluación<br />
9.2.2 Implicaciones <strong><strong>de</strong>l</strong> Mezclado <strong>de</strong> <strong>Biodies<strong>el</strong></strong> con Dies<strong>el</strong> <strong><strong>de</strong>l</strong> Petróleo<br />
En términos generales este tipo <strong>de</strong> mezclas no requiere <strong>de</strong> una infraestructura particular, sólo<br />
se necesita <strong>de</strong> un sistema <strong>de</strong> mezclado y <strong>de</strong> un tanque <strong>para</strong> almacenar <strong>el</strong> biodies<strong>el</strong>.<br />
El monto <strong>de</strong> inversiones necesarias <strong>para</strong> llevar a cabo esto en las refinerías, se estima sería<br />
necesario un sistema con capacidad <strong>de</strong> almacenamiento <strong>de</strong> máximo <strong>el</strong> 20 por ciento <strong>de</strong> la<br />
producción <strong>de</strong> PEMEX Dies<strong>el</strong> en centro <strong>de</strong> trabajo, lo que representaría disponer <strong>de</strong> al menos<br />
<strong>de</strong> dos tanques <strong><strong>de</strong>l</strong> or<strong>de</strong>n <strong>de</strong> 40,000 barriles <strong>para</strong> garantizar <strong>de</strong> esta manera <strong>el</strong> abasto <strong>de</strong><br />
biodies<strong>el</strong> <strong>de</strong> 7 días.<br />
Cada tanque, sus tuberías y <strong>el</strong> sistema <strong>de</strong> mezclado representarían una inversión <strong><strong>de</strong>l</strong> or<strong>de</strong>n <strong>de</strong> 7<br />
millones <strong>de</strong> dólares, cifra que se tendría que precisar en cada refinería, ya que <strong>de</strong>pen<strong>de</strong> <strong>de</strong> su<br />
ubicación, las características <strong><strong>de</strong>l</strong> terreno y la infraestructura necesaria <strong>para</strong> su integración con<br />
la existente.<br />
Estos sistemas se <strong>de</strong>berán construir en cada una <strong>de</strong> las seis refinerías y se podría consi<strong>de</strong>rar<br />
que una sola instalación sería suficiente <strong>para</strong> llevar a cabo <strong>el</strong> mezclado en cada centro <strong>de</strong><br />
producción.<br />
50
<strong>Potenciales</strong> y <strong>Viabilidad</strong> <strong><strong>de</strong>l</strong> <strong>Uso</strong> <strong>de</strong> <strong>Bioetanol</strong> y <strong>Biodies<strong>el</strong></strong> <strong>para</strong> <strong>el</strong> Transporte en México (SENER-BID-GTZ)<br />
Task 2 & Task A: Mexico’s energy picture with regard to bioethanol and biodies<strong>el</strong><br />
9.2.3. Evaluación <strong>de</strong> la <strong>Viabilidad</strong> Económica<br />
Para llevar a cabo este proceso, es necesario <strong>de</strong>terminar <strong>de</strong> manera experimental en cada<br />
refinería, la mezcla que se <strong>de</strong>berá realizar <strong>para</strong> que se obtenga como producto final PEMEX<br />
Dies<strong>el</strong> con las especificaciones vigentes.<br />
Esto implica <strong>de</strong>sarrollar dos o tres fórmulas con las corrientes con las que actualmente se<br />
produce <strong>el</strong> PEMEX Dies<strong>el</strong>, a la que se sumaría <strong>el</strong> porcentaje <strong>de</strong> biodies<strong>el</strong> a emplear y la o las<br />
mezclas resultantes realizarles los ajustes <strong>de</strong> calidad con un producto <strong>de</strong> menor valor (como es<br />
<strong>el</strong> caso <strong><strong>de</strong>l</strong> aceite cíclico ligero), buscando con esto reducir <strong>el</strong> costo <strong>de</strong> la pre<strong>para</strong>ción <strong>para</strong> así<br />
<strong>de</strong>terminar <strong>el</strong> costo <strong>de</strong> oportunidad <strong><strong>de</strong>l</strong> biodies<strong>el</strong>.<br />
Cabe mencionar que en <strong>el</strong> momento que en <strong>el</strong> SNR se produjese <strong>el</strong> Dies<strong>el</strong> <strong>de</strong> Ultra Bajo<br />
Azufre (ULSD por sus siglas en inglés), <strong>el</strong> empleo <strong><strong>de</strong>l</strong> biodies<strong>el</strong> permitiría cumplir con <strong>el</strong><br />
límite especificado <strong>de</strong> lubricidad <strong>de</strong>terminado por <strong>el</strong> método HFRR (High Frecuency<br />
Reciprocating Rig), cuyo valor máximo recomendado es <strong>de</strong> 460 micrones.<br />
9.2.4. Pronóstico <strong>de</strong> Demanda <strong>de</strong> <strong>Biodies<strong>el</strong></strong><br />
Tomando como base la información <strong><strong>de</strong>l</strong> pronóstico <strong>de</strong> producción <strong>para</strong> <strong>el</strong> período bajo estudio<br />
y asumiendo los porcentajes <strong>de</strong> biodies<strong>el</strong> propuestos en cada escenario, la <strong>de</strong>manda esperada<br />
<strong>de</strong> este producto se ilustra en la figura 9.13.<br />
Figura 9.13 Pronóstico <strong>de</strong> Demanda <strong>de</strong> <strong>Biodies<strong>el</strong></strong><br />
Demanda Esperada <strong>de</strong> <strong>Biodies<strong>el</strong></strong>, 2006-2012 (1)<br />
Cifras en Miles <strong>de</strong> Barriles por Día<br />
66.4 68.4<br />
74.2<br />
71.1<br />
75.1 75.8 77.5<br />
33.2 34.2<br />
37.1 35.5 37.5 37.9 38.7<br />
16.6<br />
17.1 18.5 17.8 18.8 19 19.4<br />
2006 2007 2008 2009 2010 2011 2012<br />
Escenario 1 Escenario 2 Escenario 3<br />
Fuente:<br />
(1) Información estimada como datos <strong>de</strong> PEMEX Refinación, Subdirección <strong>de</strong> Planeación, Coordinación y Evaluación<br />
51
<strong>Potenciales</strong> y <strong>Viabilidad</strong> <strong><strong>de</strong>l</strong> <strong>Uso</strong> <strong>de</strong> <strong>Bioetanol</strong> y <strong>Biodies<strong>el</strong></strong> <strong>para</strong> <strong>el</strong> Transporte en México (SENER-BID-GTZ)<br />
Task 2 & Task A: Mexico’s energy picture with regard to bioethanol and biodies<strong>el</strong><br />
10. Conclusiones y Recomendaciones<br />
10.1 Recomendaciones<br />
Con base en <strong>el</strong> escenario que resultase <strong>el</strong> más viable tanto <strong>para</strong> gasolinas como dies<strong>el</strong>, sería<br />
necesario posteriormente llevar a cabo a <strong>de</strong>talle las siguientes evaluaciones que se <strong>de</strong>scriben a<br />
continuación:<br />
10.1.1 <strong>Bioetanol</strong><br />
a) Determinar en cada refinería la formulación típica <strong>de</strong> la base que se emplearía <strong>para</strong><br />
mezclar con <strong>el</strong> etanol en la concentración que se <strong>de</strong>termine, con <strong>el</strong> fin <strong>de</strong> obtener un<br />
producto final que satisfaga las especificaciones establecidas en la NOM-086.<br />
b) Realizar la evaluación com<strong>para</strong>tiva <strong>de</strong> emisiones <strong>de</strong> una población <strong>de</strong> vehículos<br />
representativa <strong><strong>de</strong>l</strong> acervo nacional, con <strong>el</strong> fin <strong>de</strong> establecer si la mezcla propuesta<br />
representa un beneficio ambiental en com<strong>para</strong>ción con las gasolinas actuales, no sólo<br />
<strong>de</strong>terminando las emisiones reguladas (CO, HC, NO x ), sino incluir la especiación <strong>de</strong> los<br />
hidrocarburos en <strong>el</strong> tubo <strong>de</strong> escape <strong>para</strong> estimar si no se generan mayor cantidad <strong>de</strong><br />
precursores <strong>de</strong> ozono y a su vez medir la contribución a las emisiones evaporativas.<br />
c) Consultar a la industria automotriz (AMIA), si la población <strong>de</strong> automóviles podría emplear<br />
la mezcla <strong>de</strong> gasolinas con etanol sin verse afectados los componentes plásticos.<br />
d) Evaluar los impactos a los sistemas <strong>de</strong> manejo, transporte y comercialización <strong>de</strong> las<br />
gasolinas <strong>para</strong> establecer que no se verán afectados los polímeros usados en su operación<br />
por la presencia <strong><strong>de</strong>l</strong> etanol.<br />
10.1.2 <strong>Biodies<strong>el</strong></strong><br />
i) Evaluar en cada refinería la base susceptible a mezclar <strong>para</strong> cada volumen <strong>de</strong> biodies<strong>el</strong> a<br />
mezclar con <strong>el</strong> PEMEX Dies<strong>el</strong>, garantizando las especificaciones contenidas en la<br />
NOM086.<br />
ii) Llevar a cabo una medición com<strong>para</strong>tiva <strong>de</strong> emisiones <strong>de</strong> las mezclas <strong>de</strong> biodies<strong>el</strong> con<br />
PEMEX Dies<strong>el</strong> contra éste en una muestra representativa <strong>de</strong> automotores <strong><strong>de</strong>l</strong> país,<br />
analizando las emisiones reguladas (HC, NOx y Partículas), así como la distribución <strong><strong>de</strong>l</strong><br />
tamaño <strong>de</strong> las partículas <strong>para</strong> <strong>de</strong>terminar si no se incrementan la fracción fina (PM10 y<br />
PM2.5).<br />
iii) Consultar a los fabricantes <strong>de</strong> vehículos (ANPACT), si las o las mezclas susceptibles <strong>de</strong><br />
usar no afectarían a los vehículos en circulación en <strong>el</strong> país. Solicitarles que especificación<br />
sería la que se <strong>de</strong>bería cumplir al emplear la o las mezclas.<br />
iv) Evaluar los impactos a los sistemas <strong>de</strong> manejo, transporte y comercialización <strong>de</strong> las<br />
gasolinas <strong>para</strong> establecer que no se verán afectados los polímeros usados en su operación<br />
por la presencia <strong><strong>de</strong>l</strong> biodies<strong>el</strong>.<br />
52
<strong>Potenciales</strong> y <strong>Viabilidad</strong> <strong><strong>de</strong>l</strong> <strong>Uso</strong> <strong>de</strong> <strong>Bioetanol</strong> y <strong>Biodies<strong>el</strong></strong> <strong>para</strong> <strong>el</strong> Transporte en México (SENER-BID-GTZ)<br />
Task 2 & Task A: Mexico’s energy picture with regard to bioethanol and biodies<strong>el</strong><br />
10.2 Conclusiones<br />
10.2.1 S<strong>el</strong>ección <strong>de</strong> Precios <strong>para</strong> la Evaluación Técnico-Económica <strong>de</strong> la <strong>Viabilidad</strong> <strong><strong>de</strong>l</strong><br />
Proyecto <strong>de</strong> Biocombustibles<br />
En <strong>el</strong> período bajo estudio (2006-2012), se observa una reducción en los precios spot <strong>de</strong><br />
referencias <strong>de</strong> las gasolinas, <strong>el</strong> dies<strong>el</strong> y <strong>el</strong> MTBE, esto se <strong>de</strong>be a que se consi<strong>de</strong>ra que <strong>de</strong>rivado<br />
<strong>de</strong> las alzas registradas en <strong>el</strong> precio <strong><strong>de</strong>l</strong> crudo y los productos en los años prece<strong>de</strong>ntes, se<br />
<strong>de</strong>tonaran inversiones en refinerías <strong>para</strong> capturar la ventaja competitiva que se presentará al<br />
inicio <strong><strong>de</strong>l</strong> período bajo estudio los precios <strong>el</strong>evados que se pronostican, situación que al<br />
finalizar <strong>el</strong> escenario propiciará un sobreoferta <strong>de</strong> <strong>de</strong>rivados <strong><strong>de</strong>l</strong> petróleo 3 .<br />
Por lo expuesto se sugiere que las evaluaciones <strong>de</strong> la factibilidad técnico-económica <strong>de</strong> los<br />
escenarios <strong>para</strong> <strong>el</strong> caso <strong><strong>de</strong>l</strong> bioetanol, se realicen empleando dos conjuntos <strong>de</strong> precios: <strong>el</strong><br />
primero integrado <strong>el</strong> valor máximo <strong>de</strong> los productos a la puerta <strong>de</strong> cada refinería o en <strong>el</strong><br />
mercado spot y <strong>el</strong> segundo, compuesto por <strong>el</strong> precio promedio <strong><strong>de</strong>l</strong> ciclo (2006-2012).<br />
Con base en lo anterior, en las tablas 10. 1 a 10.5, se presentan los precios recomendados <strong>para</strong><br />
emplearse en las evaluaciones técnico-económicas.<br />
Tabla 10.1 Cotización <strong>de</strong> Referencia<br />
Producto<br />
Precio en dólares por barril<br />
Promedio<br />
Máximo<br />
MTBE 47.7 68.4<br />
Metanol 34.9 36.9<br />
Gasolina Regular (Magna) 36.6 57.7<br />
Gasolina Premium 39.0 59.6<br />
Dies<strong>el</strong> No. 2 LS 36.4 57.1<br />
Tabla 10.2 Precio <strong>de</strong> Importación <strong><strong>de</strong>l</strong> MTBE en cada Refinería<br />
Refinería<br />
Precio en dólares por barril<br />
Promedio<br />
Máximo<br />
Ca<strong>de</strong>reyta 55.2 76.0<br />
Ma<strong>de</strong>ro 54.3 75.1<br />
Minatitlán 54.4 75.1<br />
Salamanca 55.3 76.1<br />
Salina Cruz 54.7 75.4<br />
Tula 54.9 75.6<br />
3 Fuente: PEMEX Refinación, Subdirección <strong>de</strong> Planeación, Evaluación y Coordinación.<br />
53
<strong>Potenciales</strong> y <strong>Viabilidad</strong> <strong><strong>de</strong>l</strong> <strong>Uso</strong> <strong>de</strong> <strong>Bioetanol</strong> y <strong>Biodies<strong>el</strong></strong> <strong>para</strong> <strong>el</strong> Transporte en México (SENER-BID-GTZ)<br />
Task 2 & Task A: Mexico’s energy picture with regard to bioethanol and biodies<strong>el</strong><br />
Tabla 10.3 Precio <strong>de</strong> Importación <strong>de</strong> Metanol en cada Refinería<br />
Refinería<br />
Precio en dólares por barril<br />
Promedio<br />
Máximo<br />
Ca<strong>de</strong>reyta 44.8 45.4<br />
Ma<strong>de</strong>ro 44.8 45.4<br />
Minatitlán 43.0 43.6<br />
Salamanca 40.8 41.4<br />
Salina Cruz 43.0 43.6<br />
Tula 40.5 41.2<br />
Tabla 10.4 Precio <strong>de</strong> Importación <strong>de</strong> Gasolina Premium en cada Refinería<br />
Refinería<br />
Precio en dólares por barril<br />
Promedio<br />
Máximo<br />
Ca<strong>de</strong>reyta 45.1 65.6<br />
Ma<strong>de</strong>ro 44.1 64.7<br />
Minatitlán 44.2 64.7<br />
Salamanca 45.2 65.7<br />
Salina Cruz 44.5 65.1<br />
Tula 44.7 65.3<br />
Tabla 10.5 Precio <strong>de</strong> Importación <strong>de</strong> Gasolina Regular (Magna) en cada Refinería<br />
Refinería<br />
Precio en dólares por barril<br />
Promedio<br />
Máximo<br />
Ca<strong>de</strong>reyta 42.6 63.7<br />
Ma<strong>de</strong>ro 41.7 62.7<br />
Minatitlán 41.7 62.8<br />
Salamanca 42.7 63.8<br />
Salina Cruz 42.1 63.1<br />
Tula 42.2 63.3<br />
Tabla 10.6 Precio <strong>de</strong> Importación <strong>de</strong> Dies<strong>el</strong> No. 2 LS en cada Refinería<br />
Refinería<br />
Precio en dólares por barril<br />
Promedio<br />
Máximo<br />
Ca<strong>de</strong>reyta 37.3 58.0<br />
Ma<strong>de</strong>ro 36.4 57.1<br />
Minatitlán 36.4 57.1<br />
Salamanca 37.4 58.1<br />
Salina Cruz 36.8 57.4<br />
Tula 36.9 58.1<br />
54
<strong>Potenciales</strong> y <strong>Viabilidad</strong> <strong><strong>de</strong>l</strong> <strong>Uso</strong> <strong>de</strong> <strong>Bioetanol</strong> y <strong>Biodies<strong>el</strong></strong> <strong>para</strong> <strong>el</strong> Transporte en México (SENER-BID-GTZ)<br />
Task 2 & Task A: Mexico’s energy picture with regard to bioethanol and biodies<strong>el</strong><br />
10.2.2 Consumo Estimado <strong>de</strong> <strong>Bioetanol</strong> en cada Escenario<br />
En la figuras 10.1 y 10.2, se presentan los consumos estimados <strong>de</strong> etanol <strong>para</strong> cada uno <strong>de</strong> los<br />
escenarios, asumiendo un contenido <strong>de</strong> oxígeno máximo <strong>de</strong> 1.5 y 2.0 por ciento en peso.<br />
Figura 10.1 Consumo Estimado <strong>de</strong> Etanol<br />
Demanda Esperada <strong>de</strong> Etanol<br />
Caso: 1.5 por ciento <strong>de</strong> oxígeno<br />
Cifras en Miles <strong>de</strong> Barriles por Día<br />
16.6<br />
13.1<br />
12.8<br />
17.1<br />
13.6<br />
13.2<br />
17.7<br />
14.1<br />
13.7<br />
18.2<br />
14.5<br />
14.1<br />
18.8<br />
15<br />
14.6<br />
19.4<br />
15.5<br />
15.1<br />
20.1<br />
16.1<br />
15.7<br />
2006 2007 2008 2009 2010 2011 2012<br />
Escenario 1 Escenario 2 Escenario 3<br />
55
<strong>Potenciales</strong> y <strong>Viabilidad</strong> <strong><strong>de</strong>l</strong> <strong>Uso</strong> <strong>de</strong> <strong>Bioetanol</strong> y <strong>Biodies<strong>el</strong></strong> <strong>para</strong> <strong>el</strong> Transporte en México (SENER-BID-GTZ)<br />
Task 2 & Task A: Mexico’s energy picture with regard to bioethanol and biodies<strong>el</strong><br />
Figura 10.2 Consumo Estimado <strong>de</strong> Etanol<br />
Demanda Esperada <strong>de</strong> Etanol<br />
Caso: 2.0 por ciento <strong>de</strong> oxígeno<br />
Cifras en Miles <strong>de</strong> Barriles por Día<br />
20.7<br />
17.4<br />
16.9<br />
21.5<br />
18<br />
17.6<br />
22.2<br />
18.6<br />
18.2<br />
22.8<br />
19.2<br />
18.7<br />
23.6<br />
19.9<br />
19.4<br />
24.3<br />
20.4<br />
20<br />
25.2<br />
21.3<br />
20.8<br />
2006 2007 2008 2009 2010 2011 2012<br />
Escenario 1 Escenario 2 Escenario 3<br />
Con r<strong>el</strong>ación a los resultados <strong>de</strong> la <strong>de</strong>manda esperada <strong>de</strong> etanol, <strong>el</strong> escenario 2, presenta la<br />
menor cantidad <strong>de</strong> etanol, <strong>de</strong>bido a que como se mencionó en <strong>el</strong> apartado correspondiente, en<br />
éste sólo se sustituye <strong>el</strong> empleo <strong>de</strong> los éteres por etanol como oxigenante. Por tanto, <strong>para</strong><br />
aportar <strong>el</strong> contenido especificado <strong>de</strong> oxígeno a las gasolinas (PEMEX Magna y Premium), se<br />
requiere <strong>de</strong> un menor volumen <strong>de</strong> etanol, esta situación se observa tanto ambas figuras.<br />
56
<strong>Potenciales</strong> y <strong>Viabilidad</strong> <strong><strong>de</strong>l</strong> <strong>Uso</strong> <strong>de</strong> <strong>Bioetanol</strong> y <strong>Biodies<strong>el</strong></strong> <strong>para</strong> <strong>el</strong> Transporte en México (SENER-BID-GTZ)<br />
Task 2 & Task A: Mexico’s energy picture with regard to bioethanol and biodies<strong>el</strong><br />
10.2.3 Consumo Estimado <strong>de</strong> <strong>Biodies<strong>el</strong></strong> en cada Escenario<br />
En la figura 10.3, se muestran los datos <strong>de</strong> la <strong>de</strong>manda esperada <strong>de</strong> biodies<strong>el</strong>, los que se<br />
estimaron usando la producción pronosticada <strong>para</strong> <strong>el</strong> período bajo estudio (correspon<strong>de</strong> a la<br />
figura 9.13) y consi<strong>de</strong>rando <strong>el</strong> porcentaje <strong>de</strong> biodies<strong>el</strong> que se mezclaría con <strong>el</strong> PEMEX Dies<strong>el</strong>.<br />
Figura 10.3 Demanda Esperada <strong>de</strong> <strong>Biodies<strong>el</strong></strong> en cada Escenario<br />
Demanda Esperada <strong>de</strong> <strong>Biodies<strong>el</strong></strong>, 2006-2012 (1)<br />
Cifras en Miles <strong>de</strong> Barriles por Día<br />
66.4 68.4<br />
74.2<br />
71.1<br />
75.1 75.8 77.5<br />
33.2 34.2<br />
37.1 35.5 37.5 37.9 38.7<br />
16.6<br />
17.1 18.5 17.8 18.8 19 19.4<br />
2006 2007 2008 2009 2010 2011 2012<br />
Escenario 1 Escenario 2 Escenario 3<br />
Fuente:<br />
(1) Información estimada como datos <strong>de</strong> PEMEX Refinación, Subdirección <strong>de</strong> Planeación, Coordinación y Evaluación<br />
57
<strong>Potenciales</strong> y <strong>Viabilidad</strong> <strong><strong>de</strong>l</strong> <strong>Uso</strong> <strong>de</strong> <strong>Bioetanol</strong> y <strong>Biodies<strong>el</strong></strong> <strong>para</strong> <strong>el</strong> Transporte en México (SENER-BID-GTZ)<br />
Task 2 & Task A: Mexico’s energy picture with regard to bioethanol and biodies<strong>el</strong><br />
11. Bibliografía<br />
11.1 Sitios en Internet<br />
www.energia.gob.mx, Balance Nacional <strong>de</strong> Energía 2004<br />
www.camaradiputados.gob.mx, Leyes Fe<strong>de</strong>rales y Estatales<br />
www.pemex.com, PEMEX Statistical Yearbook 2005<br />
www.pemex.com, Indicadores Petroleros, Enero 2006<br />
www.pemex.com, Informe <strong>de</strong> Labores 2005<br />
11.2 Presentaciones<br />
PEMEX Refinación, Etanol <strong>de</strong> Origen Agrícola como Oxigenante <strong>para</strong> Combustible,<br />
CACINTRA Xalapa, Foro: Etanol, Caña <strong>de</strong> Azúcar y Energía, , Xalapa, Veracruz,<br />
Noviembre 24 <strong>de</strong> 2005.<br />
PEMEX, Dirección Corporativa <strong>de</strong> Operaciones, Evaluación <strong><strong>de</strong>l</strong> uso <strong>de</strong> Etanol <strong>para</strong> la<br />
Producción <strong>de</strong> Gasolinas, Enero <strong>de</strong> 2006.<br />
Drogos, Donna L., P.E., MTBE vs. Other Oxygenates, Mealey´s MTBE Conference,<br />
Molino <strong><strong>de</strong>l</strong> Rey, CA, May 11-12, 2000.<br />
11.3 Documentación Electrónica<br />
PEMEX Refinación, Subdirección <strong>de</strong> Planeación, Coordinación y Evaluación, Precios<br />
<strong>de</strong> Referencia, Información <strong>de</strong> Precios SENER.xls<br />
PEMEX Refinación, Subdirección <strong>de</strong> Planeación, Coordinación y Evaluación,<br />
Cotizaciones <strong>de</strong> Referencia, precios_s<strong>el</strong>ec_06-12.xls<br />
PEMEX Refinación, Subdirección <strong>de</strong> Planeación, Coordinación y Evaluación,<br />
Prospectiva <strong>de</strong> Proceso <strong>de</strong> Crudo y Producciones, prospectiva<strong>para</strong>SENER.xls<br />
PEMEX Refinación, Subdirección <strong>de</strong> Planeación, Coordinación y Evaluación, PR-<br />
VENTAS 2000, 2001, 2002, 2003, 2004 y 2005, PR-Ventas.xls<br />
PEMEX Refinación, Subdirección <strong>de</strong> Planeación, Coordinación y Evaluación,<br />
Mecanismo <strong>para</strong> la Determinación <strong>de</strong> Precios al Público,<br />
FormulasPrecioPublicoGasolinaDies<strong>el</strong>.ppt<br />
58
Task 3: Overview of agricultural aspects<br />
Ignacio Lazcano Martínez
<strong>Potenciales</strong> y <strong>Viabilidad</strong> <strong><strong>de</strong>l</strong> <strong>Uso</strong> <strong>de</strong> <strong>Bioetanol</strong> y <strong>Biodies<strong>el</strong></strong> <strong>para</strong> <strong>el</strong> Transporte en México (SENER-BID-GTZ)<br />
Task 3: Overview of agricultural aspects<br />
Índice<br />
1. De lo General<br />
1.1 El entorno físico<br />
2. Agroclimatología<br />
2.1 El clima en la Republica Mexicana<br />
2.2 La Temperatura<br />
2.3 El Agua<br />
2.3.1 El Riego<br />
2.3.2 La Evapotranspiración<br />
3. <strong>Uso</strong> <strong><strong>de</strong>l</strong> Su<strong>el</strong>o<br />
4. Las Regiones agrícolas<br />
5. Principales cultivos en las Regiones Agrícola<br />
6. Principales cultivos en la República Mexicana<br />
7. Calificación tecnológica <strong>de</strong> la agricultura en las regiones agrícolas <strong>de</strong> México<br />
8. Los Seres Humanos<br />
8.1 Sobre <strong>el</strong> Ejido, antes y <strong>de</strong>spués<br />
9. La Organización <strong>de</strong> la agricultura en México<br />
9.1 La autosuficiencia alimentaria<br />
9.2 La Productividad.<br />
9.3 Los Insumos: Los fertilizantes<br />
9.4 Extensión Agrícola<br />
9.5 Programas <strong>de</strong> Irrigación, Avenidas y Drenaje<br />
10. Exportaciones e Importaciones agrícolas <strong>de</strong> México<br />
11. Cultivos Energéticos<br />
12. Problemas en la penetración al mercado <strong><strong>de</strong>l</strong> <strong>Bioetanol</strong><br />
13. Anexo<br />
14. Bibliografía
<strong>Potenciales</strong> y <strong>Viabilidad</strong> <strong><strong>de</strong>l</strong> <strong>Uso</strong> <strong>de</strong> <strong>Bioetanol</strong> y <strong>Biodies<strong>el</strong></strong> <strong>para</strong> <strong>el</strong> Transporte en México (SENER-BID-GTZ)<br />
Task 3: Overview of agricultural aspects<br />
Indice <strong>de</strong> Figuras<br />
Fig 2.1 Principales tipos <strong>de</strong> clima en México<br />
Fig 2.2 Temperaturas medias anuales<br />
Fig 2.3 Precipitación total anual<br />
Indice <strong>de</strong> Tablas<br />
Tabla 2.1 Superficie (%) por grupo climático en la Republica Mexicana<br />
Tabla 5.1 Principales cultivos en las regiones agrícolas<br />
Tabla 6.1 Cultivos cíclicos años agrícola 2004<br />
Tabla 6.1 Principales cultivos perennes en la Republica Mexicana 2004<br />
Tabla 7.1 Calificación tecnológica <strong>de</strong> la agricultura en las regiones Agrícolas <strong>de</strong> México<br />
Tabla 9.1 Grado <strong>de</strong> autosuficiencia <strong>de</strong> los principales productos Agrícolas <strong>para</strong> <strong>el</strong> año 2004
1. De lo general<br />
1.1. El Entorno físico<br />
<strong>Potenciales</strong> y <strong>Viabilidad</strong> <strong><strong>de</strong>l</strong> <strong>Uso</strong> <strong>de</strong> <strong>Bioetanol</strong> y <strong>Biodies<strong>el</strong></strong> <strong>para</strong> <strong>el</strong> Transporte en México (SENER-BID-GTZ)<br />
Task 3: Overview of agricultural aspects<br />
La República Mexicana, ocupa una superficie continental <strong>de</strong> 1’967,183 kilómetros cuadrados;<br />
4,612 en las islas <strong><strong>de</strong>l</strong> Océano Pacífico y 752 en las Islas <strong><strong>de</strong>l</strong> golfo y <strong><strong>de</strong>l</strong> Caribe.<br />
El territorio se extien<strong>de</strong> entre los <strong>para</strong>l<strong>el</strong>os 14º32’45” N y 32º43’05”N y los meridianos 86º<br />
46W y 117º 08W <strong>de</strong> Greenwich.<br />
Colinda en la frontera norte con los Estados Unidos <strong>de</strong> América en un <strong>de</strong>sarrollo que alcanza<br />
2,597 kilómetros y en la frontera sur limita con Guatemala y B<strong>el</strong>ice mediante una línea<br />
fronteriza sinuosa que alcanza 1,138 kilómetros.<br />
En cuanto a la orografía, la superficie nacional se distribuye por lo que hace a la altitud s.n.m.,<br />
<strong>de</strong> la siguiente manera:<br />
Metros<br />
% sup nacional<br />
0 - 300 29.11<br />
301 - 900 17.43<br />
901 - 2100 42.90<br />
2001 - 2700 9.74<br />
2701 – 3900 0.82<br />
La topografía es vigorosa y movida y se divi<strong>de</strong> así:<br />
Área con pendientes <strong>de</strong> hasta 2% - 15.3%<br />
2 a 10% - 20.5%<br />
10 a 25% - 35.9%<br />
mas <strong>de</strong> 25% - 28.3%<br />
Fuente: SAGARPA.”El uso <strong><strong>de</strong>l</strong> su<strong>el</strong>o en la República Mexicana”<br />
2. Agroclimatología<br />
2.1 El clima en la República Mexicana<br />
De acuerdo al criterio <strong>de</strong> la Convención <strong>de</strong> las Naciones Unidas <strong>de</strong> Lucha contra la<br />
Desertificación en países afectados por sequía grave o <strong>de</strong>sertificación, México cuenta con una<br />
superficie <strong>de</strong> 1’197,991 km2 con déficit <strong>de</strong> humedad muy severo, severo o mo<strong>de</strong>rado durante<br />
<strong>el</strong> año. Lo anterior representa <strong>el</strong> 61% <strong>de</strong> la República Mexicana, distribuidos en áreas <strong>de</strong><br />
todos los estados <strong><strong>de</strong>l</strong> país.<br />
Las zonas con déficit <strong>de</strong> humedad muy severo (clima árido) ocupan 233,767 Km2 que<br />
representan <strong>el</strong> 12% <strong><strong>de</strong>l</strong> territorio. Estas áreas son las más agobiadas por los problemas <strong>de</strong><br />
sequía y las más susceptibles <strong>de</strong> tener problemas <strong>de</strong> erosión eólica, ensalitramiento y<br />
1
<strong>Potenciales</strong> y <strong>Viabilidad</strong> <strong><strong>de</strong>l</strong> <strong>Uso</strong> <strong>de</strong> <strong>Bioetanol</strong> y <strong>Biodies<strong>el</strong></strong> <strong>para</strong> <strong>el</strong> Transporte en México (SENER-BID-GTZ)<br />
Task 3: Overview of agricultural aspects<br />
sobrepastoreo, siempre y cuando sean sometidas a manejos ina<strong>de</strong>cuados <strong>de</strong> uso <strong><strong>de</strong>l</strong> su<strong>el</strong>o.<br />
Los estados que agrupan la mayor parte <strong>de</strong> esta superficie son: Sonora, Baja California, Baja<br />
California Sur, Chihuahua y Coahuila.<br />
Las zonas con déficit <strong>de</strong> humedad severo (climas árido y semiárido), ocupan 659,156 km2<br />
que representan <strong>el</strong> 33% <strong><strong>de</strong>l</strong> país. Estas áreas cuentan con períodos <strong>de</strong> humedad cortos, sujetas<br />
a variaciones climáticas acentuadas que repercuten en un aprovechamiento principalmente<br />
pecuario y silvícola <strong>de</strong> especies no ma<strong>de</strong>rables. Los ecosistemas <strong>de</strong> estas áreas son muy<br />
frágiles, ya que si son <strong>de</strong>gradados, su tiempo <strong>de</strong> recuperación es r<strong>el</strong>ativamente largo. Los<br />
estados que agrupan la mayor parte <strong>de</strong> esta superficie son: Sonora, Chihuahua, Nuevo León,<br />
Durango, San Luis Potosí, Zacatecas, Tamaulipas, Sinaloa, Guanajuato y Aguascalientes.<br />
Figura 2.1. Principales tipos <strong>de</strong> clima <strong>de</strong> México.<br />
Las zonas con déficit <strong>de</strong> humedad mo<strong>de</strong>rado (clima semiárido húmedo) ocupan 305,068 km2<br />
que representan <strong>el</strong> 16% <strong>de</strong> México. Abarcan una gran cantidad <strong>de</strong> condiciones físicas,<br />
caracterizadas normalmente por un período <strong>de</strong> humedad bien <strong>de</strong>finido que hace posible en la<br />
mayoría <strong>de</strong> los casos una agricultura <strong>de</strong> temporal marginal, sin embargo, <strong>de</strong>pendiendo <strong>de</strong> los<br />
cultivos, son necesarios riegos <strong>de</strong> auxilio o <strong>de</strong> punta que permitan asegurar una cosecha, Los<br />
estados que agrupan la mayor parte <strong>de</strong> esta superficie son; Yucatán, Zacatecas, Guanajuato,<br />
Aguascalientes, Campeche, Guerrero, Michoacán, Querétaro, Hidalgo, Mor<strong>el</strong>os, Oaxaca,<br />
Colima, Puebla y Jalisco.<br />
2
<strong>Potenciales</strong> y <strong>Viabilidad</strong> <strong><strong>de</strong>l</strong> <strong>Uso</strong> <strong>de</strong> <strong>Bioetanol</strong> y <strong>Biodies<strong>el</strong></strong> <strong>para</strong> <strong>el</strong> Transporte en México (SENER-BID-GTZ)<br />
Task 3: Overview of agricultural aspects<br />
Tabla 2.1. Superficie por grupo climático <strong>para</strong> <strong>el</strong><br />
Clima anual <strong>de</strong> la República Mexicana,<br />
Bajo Thorntwaite modificado V III<br />
Clima Superficie %<br />
Aridos y semiáridos 61.15<br />
Subhúmedos 21.93<br />
Húmedos 9.61<br />
Super húmedo 3.23<br />
Otros 4.08<br />
T o t a l 100.00<br />
2.2 La temperatura<br />
La radiación solar media anual en la República Mexicana es aproximadamente <strong>de</strong> 450<br />
cal/cm2/día o sea 164 Kcal/cm2/año. Esta radiación es 50% mayor que la media <strong><strong>de</strong>l</strong> globo<br />
terráqueo que es <strong>de</strong> 300 cal/cm2/día (la eficiencia en la utilización <strong>de</strong> esta radiación por los<br />
cultivos, es con frecuencia menor al 1%; <strong>de</strong>staca la caña <strong>de</strong> azúcar con una eficiencia <strong>de</strong><br />
1.43% y una producción <strong>de</strong> materia seca doce veces superior al maíz por ciclo <strong>de</strong> cosecha).<br />
La temperatura <strong><strong>de</strong>l</strong> aire, que clásicamente se consi<strong>de</strong>ra como la esencia <strong><strong>de</strong>l</strong> clima, es quizás <strong>el</strong><br />
<strong>el</strong>emento más estudiado y <strong><strong>de</strong>l</strong> que mejor se conocen sus r<strong>el</strong>aciones con <strong>el</strong> <strong>de</strong>sarrollo <strong>de</strong> las<br />
plantas, controlando las proporciones <strong>de</strong> las reacciones bioquímicas <strong>de</strong> varios procesos <strong><strong>de</strong>l</strong><br />
crecimiento y <strong><strong>de</strong>l</strong> metabolismo <strong>de</strong> los vegetales. Aquí nos encontramos con indicadores<br />
valiosos como las “Constantes térmicas” o sea las cantida<strong>de</strong>s <strong>de</strong> calor que las plantas necesitan<br />
<strong>para</strong> su pleno <strong>de</strong>sarrollo (según especie y cultivar) cuando los <strong>de</strong>más factores climáticos y<br />
edafológicos se presentan en condiciones óptimas, basándose en <strong>el</strong> método <strong>de</strong> la Ley <strong>de</strong> Van’t<br />
Of, que indica que la v<strong>el</strong>ocidad <strong>de</strong> reacción <strong>de</strong> un organismo se duplica por cada 10º C en la<br />
temperatura.<br />
Estas “Constantes térmicas” se calculan a partir <strong>de</strong> los datos <strong>de</strong> temperaturas diarias <strong>de</strong>s<strong>de</strong> la<br />
siembra hasta la maduración <strong>de</strong> un cultivo como en <strong>el</strong> método <strong>de</strong> Reamur y obtenemos los<br />
valores <strong>de</strong> la “constante” los cuales <strong>para</strong> algunas gramíneas son:<br />
Cebada: 1700º C; trigo: 2000º C; maíz: 2500º C.<br />
Así, en diferentes regiones <strong>el</strong> maíz, por ejemplo, a una temperatura media <strong><strong>de</strong>l</strong> ciclo <strong>de</strong> 15º C<br />
nos daría una duración <strong>de</strong> 166 días (2500/15); mientras que en otra región con 20º C <strong>de</strong><br />
temperatura duraría 125 días.<br />
Los datos <strong>de</strong> temperatura, también nos ayuda a prever, prevenir y hasta cierto punto controlar<br />
casi siempre con medidas preventivas <strong>de</strong> planeación y programación, las bajas temperaturas,<br />
las h<strong>el</strong>adas, los lapsos libres <strong>de</strong> h<strong>el</strong>adas, las temperaturas “cardinales”.<br />
En México, la carta <strong>de</strong> isotermas anuales nos muestra (Fig.2.2) que al sur <strong><strong>de</strong>l</strong> <strong>para</strong>l<strong>el</strong>o 20º N <strong>el</strong><br />
territorio con una altitud máxima <strong>de</strong> 1000 m.s.n.m. queda comprendido <strong>de</strong>ntro <strong><strong>de</strong>l</strong> área<br />
3
<strong>Potenciales</strong> y <strong>Viabilidad</strong> <strong><strong>de</strong>l</strong> <strong>Uso</strong> <strong>de</strong> <strong>Bioetanol</strong> y <strong>Biodies<strong>el</strong></strong> <strong>para</strong> <strong>el</strong> Transporte en México (SENER-BID-GTZ)<br />
Task 3: Overview of agricultural aspects<br />
limitada por la isoterma <strong>de</strong> 20º C o sea que, en general, <strong>de</strong>ntro <strong>de</strong> esa porción <strong><strong>de</strong>l</strong> país, la<br />
temperatura media anual es superior a 20º C. (anexo I. apartado 1)<br />
En esta zona, en su mayor parte <strong>de</strong>ntro <strong><strong>de</strong>l</strong> trópico la temperatura es bastante uniforme.<br />
Al norte <strong><strong>de</strong>l</strong> <strong>para</strong>l<strong>el</strong>o 20º N, las áreas comprendidas <strong>de</strong>s<strong>de</strong> la orilla <strong><strong>de</strong>l</strong> mar hasta la altitud <strong>de</strong><br />
1000 m, con excepción <strong>de</strong> la región <strong>de</strong> “La Huasteca” don<strong>de</strong> la temperatura media es <strong>de</strong> 26º<br />
C, tienen una temperatura media anual comprendida entre 20º C y 24º C, que incluye <strong>el</strong> norte<br />
<strong>de</strong> Veracruz, Tamaulipas, Nuevo León, San Luis Potosí, parte <strong>de</strong> Jalisco, Nayarit, Sinaloa, y<br />
las porciones bajas <strong>de</strong> Sonora, así como <strong>el</strong> sur y <strong>el</strong> oriente <strong>de</strong> la península <strong>de</strong> Baja California.<br />
Figura 2.2 Temperaturas medias anuales<br />
Po<strong>de</strong>mos afirmar que en la zona <strong>de</strong> altitud menor <strong>de</strong> 1000 m y comprendida al sur <strong><strong>de</strong>l</strong> <strong>para</strong>l<strong>el</strong>o<br />
20º, las variaciones mensuales en <strong>el</strong> curso <strong><strong>de</strong>l</strong> año son muy reducidas (5º C) y, en cambio, en<br />
las partes bajas extra tropicales la diferencia oscila, <strong>de</strong> 5º C en las cercanías <strong>de</strong> la costa, a 10º<br />
C en los puntos alejados.<br />
Es importante mencionar con r<strong>el</strong>ación a las temperaturas medias anuales en México, en una<br />
serie <strong>de</strong> tiempos <strong>de</strong> 40 años que las máximas se alcanzaron en Atoyac, Gro. 28.9º C y en<br />
Apatzingán, Mich 28.3º C y las mínimas en El Salto, Dgo. 12.3º C y en Cd. Guerrero, Chih<br />
con 12.8º C.<br />
4
<strong>Potenciales</strong> y <strong>Viabilidad</strong> <strong><strong>de</strong>l</strong> <strong>Uso</strong> <strong>de</strong> <strong>Bioetanol</strong> y <strong>Biodies<strong>el</strong></strong> <strong>para</strong> <strong>el</strong> Transporte en México (SENER-BID-GTZ)<br />
Task 3: Overview of agricultural aspects<br />
2.3 El agua<br />
2.3.1 La Precipitación pluvial (como sinónimo <strong>de</strong> lluvia), se presenta también en <strong>el</strong> (anexo<br />
I.1)<br />
Cantidad y distribución <strong><strong>de</strong>l</strong> agua <strong>de</strong> lluvia.<br />
Los extremos absolutos <strong>de</strong> la cantidad <strong>de</strong> lluvia anual, en nuestro planeta son:<br />
0.6 mm en Arica (Chile) y 12990 mm en <strong>el</strong> Monte Waialeale (Hawai)<br />
En nuestro país son: ( 40 años)<br />
50 mm en Mexicali B.C. y 5500 mm en Covadonga, Chis; 5720 mm en<br />
Tenango, Oax. (Alto Papaloapan).<br />
Figura 2.3 Precipitación total anual<br />
En México <strong>el</strong> total anual <strong>de</strong> agua disponible alcanza 472 Km3. Contamos con una capacidad<br />
<strong>de</strong> almacenamiento <strong>de</strong> 180 Km3, po<strong>de</strong>mos regular un volumen <strong>de</strong> 84 Km3 <strong><strong>de</strong>l</strong> total anual <strong><strong>de</strong>l</strong><br />
agua disponible.<br />
Aproximadamente dos tercios <strong>de</strong> la superficie nacional es árida o semiárida. Las regiones <strong>de</strong><br />
buena lluvia <strong>para</strong> propósitos agrícolas se encuentran en las siguientes entida<strong>de</strong>s: Tabasco,<br />
Veracruz, Jalisco, Nayarit, Mor<strong>el</strong>os, Chiapas, Colima, Campeche, México y las regiones en<br />
don<strong>de</strong> la agricultura solo es próspera por <strong>el</strong> riego, se encuentran en Baja California, Sonora,<br />
Sinaloa, Chihuahua, Coahuila, Durango, Tamaulipas, Guanajuato, Querétaro y Puebla.<br />
5
<strong>Potenciales</strong> y <strong>Viabilidad</strong> <strong><strong>de</strong>l</strong> <strong>Uso</strong> <strong>de</strong> <strong>Bioetanol</strong> y <strong>Biodies<strong>el</strong></strong> <strong>para</strong> <strong>el</strong> Transporte en México (SENER-BID-GTZ)<br />
Task 3: Overview of agricultural aspects<br />
2.3.2. El Riego<br />
Para las aproximadamente 6 millones <strong>de</strong> hectáreas que se consi<strong>de</strong>ran <strong>de</strong> riego, se utilizan 54<br />
Km3 <strong>de</strong> agua por año: <strong>el</strong> 66% es proveniente <strong>de</strong> aguas superficiales y <strong>el</strong> 34% <strong>de</strong> aguas<br />
subterráneas (9 millones <strong>de</strong> litros por hectárea regada, como lámina bruta por ciclo).<br />
Es oportuno mencionar <strong>el</strong> agua consumida por sectores:<br />
Irrigación 84%; Industria 12%; Agua potable 4%.<br />
Y en tratándose <strong><strong>de</strong>l</strong> agua subterránea:<br />
Agricultura 70%; 25% industria; 5% uso doméstico.<br />
Fuente: Comisión Nacional <strong><strong>de</strong>l</strong> Agua. (CNA)<br />
2.3.3 La Evapotranspiración<br />
La evapotranspiración, representa la cantidad <strong>de</strong> agua perdida por las plantas durante su ciclo<br />
vegetativo y se com<strong>para</strong> con la lluvia o <strong>el</strong> riego disponible o necesario a fin <strong>de</strong> efectuar un<br />
balance hídrico en cualquier región. Se mi<strong>de</strong> como la suma <strong>de</strong> las cantida<strong>de</strong>s <strong>de</strong> agua<br />
evaporada <strong>de</strong>s<strong>de</strong> <strong>el</strong> su<strong>el</strong>o y la transpirada por las plantas.<br />
A manera <strong>de</strong> ejemplo <strong>de</strong> evapotranspiración potencial calculada por <strong>el</strong> método <strong>de</strong> Thornhwaite<br />
<strong>para</strong> 6 estaciones metereológicas tenemos los siguientes datos anuales.-<br />
Estación<br />
Evapotranspiración<br />
Potencial anual (mm)*<br />
Guadalajara, Jal 877<br />
Guaymas, Son 1392<br />
Salina Cruz, Oax 1748<br />
Monterrey, N.L. 1185<br />
Mor<strong>el</strong>ia, Mich. 814<br />
Mérida, Yuc. 1522<br />
* Se daría a plena satisfacción <strong>de</strong> agua disponible.<br />
3. <strong>Uso</strong> <strong><strong>de</strong>l</strong> Su<strong>el</strong>o<br />
Como se muestra en <strong>el</strong> anexo I.2, <strong>de</strong> la superficie total <strong><strong>de</strong>l</strong> país, los bosques ocupan <strong>el</strong> 18%,<br />
las s<strong>el</strong>vas una extensión similar, <strong>el</strong> matorral aproximadamente <strong>el</strong> 30% <strong><strong>de</strong>l</strong> área, los pastizales<br />
<strong>el</strong> 14%, otros tipos <strong>de</strong> vegetación y los asentamientos humanos representan <strong>el</strong> 4% <strong>para</strong> <strong>de</strong>jar<br />
una proporción cercana al 16% como superficie susceptible <strong>de</strong> cultivarse en la tecnología <strong><strong>de</strong>l</strong><br />
riego o <strong><strong>de</strong>l</strong> temporal (secano).<br />
6
<strong>Potenciales</strong> y <strong>Viabilidad</strong> <strong><strong>de</strong>l</strong> <strong>Uso</strong> <strong>de</strong> <strong>Bioetanol</strong> y <strong>Biodies<strong>el</strong></strong> <strong>para</strong> <strong>el</strong> Transporte en México (SENER-BID-GTZ)<br />
Task 3: Overview of agricultural aspects<br />
La superficie <strong>de</strong> riego que actualmente se aprovecha, es <strong>de</strong> aproximadamente 6 millones <strong>de</strong><br />
hectáreas, <strong>de</strong> las cuales 2 millones se riegan con aguas subterráneas mediante bombeo y 4<br />
millones con aguas superficiales <strong>de</strong> presas <strong>de</strong> almacenamiento o presas <strong>de</strong>rivadotas <strong>de</strong> los ríos.<br />
La superficie agrícola <strong>de</strong> temporal es <strong>de</strong> aproximadamente 21 millones <strong>de</strong> hectáreas.<br />
En cinco entida<strong>de</strong>s <strong>de</strong> la república ubicadas en <strong>el</strong> sur-sureste: Veracruz, Chiapas. Tabasco,<br />
Campeche y Yucatán, la superficie ocupada por pastizales alcanza aproximadamente 7<br />
millones <strong>de</strong> hectáreas <strong>de</strong>ntro <strong>de</strong> las cuales, si combinamos las condiciones climáticas, edáficas,<br />
sociales y económicas, encontramos los espacios que nos permiten un amplio <strong>de</strong>sarrollo <strong>de</strong><br />
los cultivos <strong>para</strong> producir Biocombustibles, sin <strong>de</strong>mérito <strong>de</strong> aqu<strong>el</strong>las áreas que se <strong>de</strong>stinan a la<br />
producción <strong>de</strong> alimentos básicos. ( anexo I.3)<br />
Cabe mencionar que si bien la llamada “frontera agrícola” se acerca a los 30 millones <strong>de</strong><br />
hectáreas, son precisamente las condiciones <strong><strong>de</strong>l</strong> clima las que establecen los límites año con<br />
año, principalmente la lluvia y con menor frecuencia las h<strong>el</strong>adas.<br />
Así, en <strong>el</strong> año agrícola <strong>de</strong> 2001 la superficie cultivada alcanzó 21.6 millones <strong>de</strong> hectáreas; 16.7<br />
millones <strong>de</strong> temporal y 4.9 millones <strong>de</strong> riego. En <strong>el</strong> año agrícola <strong><strong>de</strong>l</strong> 2003 la superficie<br />
cultivada fue <strong>de</strong> 21.8 millones <strong>de</strong> hectáreas, <strong>de</strong> las cuales 16.7 millones fueron <strong>de</strong> temporal y<br />
5.1 millones <strong>de</strong> riego.<br />
Vale la pena <strong>de</strong>stacar que <strong>el</strong> valor <strong>de</strong> la producción agrícola, por hectárea, a pesos <strong><strong>de</strong>l</strong> 2003,<br />
fue como sigue:<br />
Riego $20,493<br />
Temporal 5,834<br />
En términos globales una hectárea <strong>de</strong> temporal en la agricultura mexicana produce en valor<br />
monetario solo un poco más <strong><strong>de</strong>l</strong> 25% <strong>de</strong> lo que produce una hectárea <strong>de</strong> riego. Sin embargo,<br />
también la incertidumbre <strong><strong>de</strong>l</strong> clima y los siniestros pocas veces previsibles que provocan en la<br />
agricultura pérdidas totales y parciales, hacen <strong>de</strong> la agricultura <strong>de</strong> temporal, una muy difícil<br />
actividad que merece apoyos tecnológicos, financieros, <strong>de</strong> comercialización mucho más<br />
sólidos que los que hasta ahora se les ha brindado, <strong>para</strong> mejorar su condición actual o<br />
propiciar la diversificación <strong>de</strong> cultivos.<br />
Cabe <strong>de</strong>stacar que en 1975 la superficie ocupada por asentamientos humanos, áreas<br />
industriales y <strong>de</strong> recreo, alcanzaba en <strong>el</strong> país 451 mil hectáreas. En <strong>el</strong> año <strong>de</strong> 2004 esta<br />
superficie se <strong>el</strong>evó a 1 millón 120 mil hectáreas, un incremento <strong><strong>de</strong>l</strong> 148%. .<br />
El significado es claro, un éxodo <strong><strong>de</strong>l</strong> campo a las ciuda<strong>de</strong>s <strong>de</strong>ntro y fuera <strong><strong>de</strong>l</strong> país.<br />
Fuentes: INEGI, SAGARPA, Investigaciones <strong><strong>de</strong>l</strong> autor.<br />
7
<strong>Potenciales</strong> y <strong>Viabilidad</strong> <strong><strong>de</strong>l</strong> <strong>Uso</strong> <strong>de</strong> <strong>Bioetanol</strong> y <strong>Biodies<strong>el</strong></strong> <strong>para</strong> <strong>el</strong> Transporte en México (SENER-BID-GTZ)<br />
Task 3: Overview of agricultural aspects<br />
4. Las Regiones agrícolas<br />
1) Mar <strong>de</strong> Cortés.<br />
a) Valle <strong>de</strong> Mexicali y San Luis Rio Colorado (B.C. y Son)<br />
b) Valles <strong>de</strong> los ríos Yaqui y Mayo (Son)<br />
c) Valles <strong><strong>de</strong>l</strong> Fuerte y <strong>de</strong> Culiacán. (Sin)<br />
2) Occi<strong>de</strong>nte (Sur Sin., Nay, Jal., sur Mich., Col)<br />
3) Pacífico Sur (Costas <strong>de</strong> Chiapas, Oaxaca y Guerrero)<br />
4) Norte (Chihuahua, Coahuila, Durango, Nuevo León, Zacatecas norte y San Luis Potosí<br />
sin Huasteca).<br />
5) El Bajío (Guanajuato sin <strong>el</strong> norte <strong><strong>de</strong>l</strong> estado), Querétaro sin Huasteca, Michoacán sin <strong>el</strong><br />
norte, Aguascalientes y sur <strong>de</strong> Zacatecas)<br />
6) Centro-Valles Altos (México, Puebla sin Huasteca, Hidalgo sin Huasteca, Tlaxcala,<br />
Mor<strong>el</strong>os norte)<br />
7) La Laguna (Coahuila suroeste y Durango este)<br />
8) Golfo Norte (Tamaulipas sin Huasteca).<br />
9) Huastecas (Limites <strong>de</strong> los estados vecinos <strong>de</strong> Tamaulipas, Veracruz, San Luis Potosí,<br />
Puebla, Hidalgo y Querétaro).<br />
10) Golfo Centro ( Veracruz centro)<br />
11) Cuenca <strong><strong>de</strong>l</strong> Papaloapan (Sur <strong>de</strong> Veracruz, noreste <strong>de</strong> Oaxaca)<br />
12) Valles Centrales <strong>de</strong> Chiapas y Oaxaca<br />
13) Peninsular (Yucatán, Quintana Roo, Campeche y Tabasco)<br />
Fuente: IMF, A.C. “Las Regiones Agrícolas <strong>de</strong> México”. 2005<br />
8
<strong>Potenciales</strong> y <strong>Viabilidad</strong> <strong><strong>de</strong>l</strong> <strong>Uso</strong> <strong>de</strong> <strong>Bioetanol</strong> y <strong>Biodies<strong>el</strong></strong> <strong>para</strong> <strong>el</strong> Transporte en México (SENER-BID-GTZ)<br />
Task 3: Overview of agricultural aspects<br />
5. Principales cultivos en las regiones agrícolas<br />
Tabla 5.1 Principales cultivos en las regiones agrícolas<br />
Región Agrícola Zona Cultivos<br />
1) Mar <strong>de</strong> Cortés a)Valle <strong>de</strong> Mexicali y San Luis<br />
Río Colorado<br />
b) Valles ríos Yaqui y Mayo<br />
c) Valles <strong><strong>de</strong>l</strong> Fuerte y Culiacán, Sin<br />
Trigo y algodón<br />
Trigo y cártamo<br />
Maíz, hortalizas y frijol<br />
2) Occi<strong>de</strong>nte Sur Sin, Nay, Jal, sur Mich, Colima Maíz, caña <strong>de</strong> azúcar, aguacate y<br />
agave tequilero.<br />
3) Pacífico Sur Costas <strong>de</strong> Chis, Oax y Guerrero Café, frutales (plátano, mango)<br />
copra.<br />
4) Norte Chih, Coah, Dgo, N.León, Zacs norte y<br />
SLP sin huasteca<br />
5) El Bajío Gto sin <strong>el</strong> norte <strong><strong>de</strong>l</strong> estado, Qro sin<br />
huasteca, Mich sin <strong>el</strong> norte, Ags y sur <strong>de</strong><br />
Zacs<br />
Maíz, frijol y avena<br />
Maíz, sorgo y hortalizas<br />
6)Centro-Valles Altos México, Pue e Hgo, sin huasteca, Tlax y<br />
Mor<strong>el</strong>os norte<br />
7) La Laguna Coah sureste y Dgo este Forrajes y maíz<br />
8) Golfo Norte Tamaulipas sin huasteca Maíz y sorgo<br />
9) Huastecas Limites <strong>de</strong> los edos vecinos <strong>de</strong> Tamp,<br />
Maíz, avena y cebada<br />
Ver, SLP, Pue, Hgo y Qro<br />
Maíz, caña <strong>de</strong> azúcar y café<br />
10) Golfo Centro Veracruz centro Caña <strong>de</strong> azúcar, café y cítricos<br />
11)Cuenca <strong><strong>de</strong>l</strong> Sur <strong>de</strong> Veracruz, NO <strong>de</strong> Oaxaca<br />
Papaloapan<br />
Caña <strong>de</strong> azúcar y maíz<br />
12) Valles Centrales <strong>de</strong><br />
Chis y Oax Valles centrales <strong>de</strong> Chis y Oax Maíz y frijol<br />
13) Peninsular Yucatán, Q. Roo, Campeche y Tabasco Maíz, cacao, caña <strong>de</strong> azúcar y<br />
cítricos<br />
Nota.- El criterio <strong>de</strong> s<strong>el</strong>ección estuvo representado por la extensión <strong>de</strong> las superficies sembradas.<br />
FUENTE. SAGARPA<br />
9
<strong>Potenciales</strong> y <strong>Viabilidad</strong> <strong><strong>de</strong>l</strong> <strong>Uso</strong> <strong>de</strong> <strong>Bioetanol</strong> y <strong>Biodies<strong>el</strong></strong> <strong>para</strong> <strong>el</strong> Transporte en México (SENER-BID-GTZ)<br />
Task 3: Overview of agricultural aspects<br />
6. Principales cultivos en la República Mexicana<br />
Tabla 6.1 Cultivos cíclicos, año agrícola 2004, superficie, tecnologías riego y temporal.<br />
Producción - Valor<br />
(miles <strong>de</strong> hectáreas, miles <strong>de</strong> ton<strong>el</strong>adas y millones <strong>de</strong> pesos)<br />
Cultivos<br />
Maíz<br />
grano<br />
Frijol<br />
Sorgo<br />
Grano<br />
Trigo<br />
Cebada<br />
Cártamo<br />
TOTAL<br />
Superficie<br />
Temporal<br />
Producción Superficie<br />
Riego<br />
Producción<br />
Superficie<br />
Total<br />
Producción<br />
Total<br />
Valor<br />
Total<br />
7077 13251 1327 8433 8404 21684 36401<br />
1633 897 189 268 1822 1165 6662<br />
1603 4826 351 2178 1954 7004 9308<br />
143 225 392 2095 535 2320 3852<br />
245 457 87 475 332 932 1668<br />
98 61 126 170 224 231 544<br />
10799 19717 2472 13619 13271 33336 58435<br />
La superficie total sembrada con cultivos cíclicos en <strong>el</strong> año <strong>de</strong> 2004, alcanzó 16 millones <strong>de</strong><br />
hectáreas; 3 millones 619 mil <strong>de</strong> riego y 12 millones 455 mil <strong>de</strong> temporal.<br />
El valor total <strong>de</strong> la producción ascendió a 125 mil millones <strong>de</strong> pesos, tomando <strong>para</strong> todos los<br />
productos <strong>el</strong> precio medio rural.<br />
La superficie total cosechada, llegó a 14 millones 800 mil hectáreas, <strong>de</strong> modo que se perdió<br />
por diversas causas, principalmente siniestros ocasionados por <strong>el</strong> clima, <strong>el</strong> 8% <strong>de</strong> la superficie<br />
sembrada.<br />
10
<strong>Potenciales</strong> y <strong>Viabilidad</strong> <strong><strong>de</strong>l</strong> <strong>Uso</strong> <strong>de</strong> <strong>Bioetanol</strong> y <strong>Biodies<strong>el</strong></strong> <strong>para</strong> <strong>el</strong> Transporte en México (SENER-BID-GTZ)<br />
Task 3: Overview of agricultural aspects<br />
Tabla 6.2 Principales cultivos perennes en la República Mexicana. 2004<br />
Miles <strong>de</strong> hectáreas, miles <strong>de</strong> ton<strong>el</strong>adas y millones <strong>de</strong> pesos.<br />
Cultivo<br />
Superficie Producción<br />
Valor<br />
cosechada<br />
Caña <strong>de</strong> azúcar 657 50,893 20,205<br />
Cítricos 509 6,704 7,140<br />
Aguacate 100 987 6,086<br />
Alfalfa 354 20,112 7,313<br />
Café cereza 761 1,697 2,866<br />
Nuez Pecanera 50 79 2,848<br />
Plátano 79 2,361 3,392<br />
Uva 33 305 2,400<br />
Manzana 59 573 2,036<br />
Mango 166 1,575 3,411<br />
|TOTAL 2,768 85,286 57,697<br />
La superficie total sembrada con cultivos perennes en <strong>el</strong> país alcanzó 5 millones 780 mil<br />
hectáreas, <strong>de</strong> las cuales 1 millón 462 mil son <strong>de</strong> riego y 4 millones 338 mil <strong>de</strong> temporal.<br />
La superficie cosechada fue <strong>de</strong> 5 millones 385 mil hectáreas.<br />
El valor <strong>de</strong> la producción se <strong>el</strong>evó a 85 mil 520 millones <strong>de</strong> pesos.<br />
Es interesante mencionar que en <strong>el</strong> riego, <strong>el</strong> valor <strong>de</strong> la producción por hectárea fue <strong>de</strong><br />
$30,455.00 y en <strong>el</strong> temporal <strong>el</strong> valor fue <strong>de</strong> $10,950.00 por hectárea cosechada.<br />
Fuente: Sagarpa-Siap.<br />
7. Calificación tecnológica <strong>de</strong> la agricultura en las regiones<br />
agrícolas <strong>de</strong> México<br />
Hemos s<strong>el</strong>eccionado como factores <strong>de</strong> clasificación los siguientes:<br />
a) Origen <strong><strong>de</strong>l</strong> agua: lluvia (temporal). Riego: presa, pozo, río, laguna.<br />
b) <strong>Uso</strong> <strong>de</strong> semilla: mejorada y no mejorada<br />
c) Fertilización: alta, media y baja. Se refiere a la cantidad <strong>de</strong> nutrientes por unidad <strong>de</strong><br />
superficie y ciclo. No está r<strong>el</strong>acionada con su calidad.<br />
En casi todo <strong>el</strong> territorio nacional, la fertilización es <strong>de</strong>ficiente, no balanceada. Su<br />
aplicación física, manual y con máquina <strong>de</strong>ja mucho que <strong>de</strong>sear.<br />
d) Mecanización: alta media y baja. Consi<strong>de</strong>ra tractores, cosechadoras, implementos.<br />
11
<strong>Potenciales</strong> y <strong>Viabilidad</strong> <strong><strong>de</strong>l</strong> <strong>Uso</strong> <strong>de</strong> <strong>Bioetanol</strong> y <strong>Biodies<strong>el</strong></strong> <strong>para</strong> <strong>el</strong> Transporte en México (SENER-BID-GTZ)<br />
Task 3: Overview of agricultural aspects<br />
Tabla 7.1 Calificación tecnológica <strong>de</strong> la agricultura en las regiones agrícolas <strong>de</strong> Mexico.<br />
REGION AGUA SEMILLA FERTILIZACION MECANIZACION<br />
Mar <strong>de</strong> Cortés Riego Mejorada Alta Alta<br />
Occi<strong>de</strong>nte Temporal Ambas Media Media<br />
Pacifico Sur Temporal Ambas Baja Baja<br />
Norte Temporal Ambas Baja Baja<br />
El Bajío Ambos Mejorada Baja Media<br />
Centro Temporal No mejorada Baja Baja<br />
La Laguna Riego Mejorada Media Alta<br />
Golfo Norte Ambos Mejorada Baja Media<br />
Huastecas Ambos No mejorada Baja Baja<br />
Golfo Centro Ambos Ambas Baja Baja<br />
Papaloapan Temporal No mejorada Media Baja<br />
Valles<br />
Oax<br />
Chis,<br />
Temporal Ambas Media Baja<br />
Peninsular Temporal No mejorada Baja Baja<br />
Es importante mencionar que la región <strong>de</strong> la Cuenca <strong><strong>de</strong>l</strong> Papaloapan, hoy prácticamente en su<br />
totalidad con régimen <strong>de</strong> temporal, podrá acce<strong>de</strong>r en superficies importantes al riego ya que la<br />
veda <strong>para</strong> <strong>de</strong>rivar aguas <strong><strong>de</strong>l</strong> río Papaloapan, está por levantarse.<br />
Las regiones que persisten en <strong>el</strong> uso <strong>de</strong> semillas no mejoradas (criollas), lo hacen en virtud <strong>de</strong><br />
una magnífica adaptación al medio <strong>de</strong> este material genético, que si bien no les garantiza altos<br />
rendimientos como las semillas mejoradas, sí les garantiza que prácticamente en cualquier<br />
condición <strong>de</strong> clima van a tener cosecha y por lo tanto alimento <strong>para</strong> su familia.<br />
En las regiones con baja fertilización, esta condición se <strong>de</strong>be a la falta <strong>de</strong> crédito y al gran<br />
incremento en <strong>el</strong> precio <strong>de</strong> los fertilizantes que son ahora en México importados en un 80%.<br />
En las regiones con bajo índice <strong>de</strong> mecanización, esto se <strong>de</strong>be a la orografía, falta <strong>de</strong> crédito,<br />
<strong>el</strong> diseño y la potencia <strong>de</strong> la maquinaria e implementos que se hizo <strong>para</strong> condiciones distintas<br />
tanto <strong>de</strong> carácter físico como <strong>de</strong> carácter social. El minifundio que es una realidad en nuestro<br />
país, <strong>de</strong>be contar con las máquinas idóneas. No es difícil observar en la agricultura <strong>de</strong> baja<br />
<strong>de</strong>nsidad económica, temporalera, minifundista, a una máquina trilladora con motor <strong>de</strong> mas <strong>de</strong><br />
300 caballos <strong>de</strong> potencia, costosísima, levantando “la cosecha <strong>de</strong> cebada o trigo <strong>de</strong> temporal,<br />
con un rendimiento <strong>de</strong> mil o mil quinientos kilos por hectárea: Como es normal, la maquinota<br />
se lleva las pocas utilida<strong>de</strong>s <strong><strong>de</strong>l</strong> agricultor.<br />
12
<strong>Potenciales</strong> y <strong>Viabilidad</strong> <strong><strong>de</strong>l</strong> <strong>Uso</strong> <strong>de</strong> <strong>Bioetanol</strong> y <strong>Biodies<strong>el</strong></strong> <strong>para</strong> <strong>el</strong> Transporte en México (SENER-BID-GTZ)<br />
Task 3: Overview of agricultural aspects<br />
8. Los seres humanos<br />
Con base en <strong>el</strong> XII Censo General <strong>de</strong> Población y Vivienda 2000 <strong><strong>de</strong>l</strong> INEGI, la CONAPO,<br />
proyectó la población en México <strong>para</strong> <strong>el</strong> año <strong>de</strong> 2005 y este cálculo nos indica que <strong>para</strong> finales<br />
<strong><strong>de</strong>l</strong> año mencionado habitábamos en México 106 millones 306 mil personas. De esta<br />
población, <strong>el</strong> 25% se ubicaba en las zonas rurales.<br />
En <strong>el</strong> sector rural encontramos según INEGI, 3 millones 770 mil unida<strong>de</strong>s <strong>de</strong> producción <strong>de</strong><br />
las cuales pertenecen al sector ejidal 2 millones 619 mil, al sector privado 1 millón 21 mil y<br />
son mixtas 131 mil.<br />
Al analizar los datos, queda claro <strong>el</strong> minifundismo <strong>de</strong> la agricultura mexicana, ya que por<br />
ejemplo en <strong>el</strong> sector ejidal las unida<strong>de</strong>s menores <strong>de</strong> 5 hectáreas representan <strong>el</strong> 62% <strong><strong>de</strong>l</strong> total <strong>de</strong><br />
las unida<strong>de</strong>s.<br />
Para <strong>el</strong> caso <strong>de</strong> la pequeña propiedad, las unida<strong>de</strong>s con una superficie menor <strong>de</strong> 5 hectáreas<br />
representan <strong>el</strong> 68%<br />
Los seres humanos que trabajan en estas unida<strong>de</strong>s <strong>de</strong> producción, alcanzan <strong>para</strong> todo <strong>el</strong> sector<br />
rural 10 millones 831mil, <strong>de</strong> los cuales son hombres 9 millones 357 mil. De este total, en <strong>el</strong><br />
sector ejidal y mixto laboran 7 millones 719 mil personas <strong>de</strong> las cuales son mujeres 1 millón<br />
57 mil.<br />
Esta mano <strong>de</strong> obra se divi<strong>de</strong> en No remunerada y remunerada. La primera alcanza <strong>el</strong> 79% y a<br />
su vez la componen la mano <strong>de</strong> obra familiar y la no familiar, siendo la primera la <strong>de</strong> mayor<br />
peso <strong>de</strong>ntro <strong>de</strong> esta clasificación.<br />
En cuanto a la mano <strong>de</strong> obra remunerada, que alcanza a los 2.3 millones <strong>de</strong> personas hombres<br />
y mujeres, se divi<strong>de</strong> en permanente y eventual, siendo ésta última la <strong>de</strong> mayor proporción<br />
(82%) con 1.7 millones <strong>de</strong> hombres y 160 mil mujeres. (anexo I.4)<br />
También <strong>el</strong> INEGI nos informa que <strong>para</strong> <strong>el</strong> año 2001 existían en México, 30,305 Ejidos y<br />
Comunida<strong>de</strong>s agrarias, con una superficie parc<strong>el</strong>ada <strong>de</strong> 34 millones 436 mil hectáreas y una<br />
superficie total, incluida la anterior, que había sido dotada y restituida, <strong>de</strong> aproximadamente<br />
105 millones <strong>de</strong> hectáreas, <strong>de</strong> las cuales 69 millones son <strong>de</strong> uso común. Estos 105 millones<br />
representaban en <strong>el</strong> año mencionado, la propiedad social en México. (anexo I.5)<br />
La población <strong>de</strong> ejidatarios en la República alcanzaba aproximadamente 3.5 millones <strong>de</strong><br />
personas en usufructo <strong>de</strong> la tierra y la dotación ejidal promedio per cápita se aproxima a cuatro<br />
hectáreas, cuando parc<strong>el</strong>ada.<br />
En estas tierras se compren<strong>de</strong>n espacios <strong>de</strong> bosques, s<strong>el</strong>vas, áreas cerriles con agosta<strong>de</strong>ros<br />
naturales <strong>para</strong> gana<strong>de</strong>ría extensiva; pra<strong>de</strong>ras <strong>para</strong> gana<strong>de</strong>ría intensiva; terrenos agrícolas <strong>de</strong><br />
temporal y <strong>de</strong> riego.<br />
Aquí, consi<strong>de</strong>ramos importante analizar las condiciones generales <strong>de</strong> la agricultura en México,<br />
antes <strong>de</strong> las modificaciones al artículo 27 Constitucional, en materia agraria, ocurridas en <strong>el</strong><br />
año <strong>de</strong> 1992.<br />
13
<strong>Potenciales</strong> y <strong>Viabilidad</strong> <strong><strong>de</strong>l</strong> <strong>Uso</strong> <strong>de</strong> <strong>Bioetanol</strong> y <strong>Biodies<strong>el</strong></strong> <strong>para</strong> <strong>el</strong> Transporte en México (SENER-BID-GTZ)<br />
Task 3: Overview of agricultural aspects<br />
Estas modificaciones son un verda<strong>de</strong>ro parteaguas en lo que se refiere a las políticas hacia <strong>el</strong><br />
campo mexicano.<br />
Antes <strong>de</strong> las modificaciones, la banca oficial, <strong><strong>de</strong>l</strong> Gobierno Fe<strong>de</strong>ral, habilitaba un poco más <strong>de</strong><br />
8.0 millones <strong>de</strong> hectáreas por año, y aseguraba 8.4 millones <strong>de</strong> hectáreas, principalmente en<br />
zonas <strong>de</strong> regular y buen temporal. Ahora, la banca oficial habilita alre<strong>de</strong>dor <strong>de</strong> un millón <strong>de</strong><br />
hectáreas y las aseguradoras privadas al campo protegen una superficie aún menor que ésta y<br />
<strong>de</strong>s<strong>de</strong> luego principalmente en áreas <strong>de</strong> riego y <strong>de</strong> buen temporal.<br />
El apoyo mencionado, hoy significativamente reducido, ha golpeado fuertemente a los<br />
agricultores más débiles, con frecuencia minifundistas <strong>de</strong> temporal <strong>de</strong> cultivos básicos y los ha<br />
obligado a rentar sus parc<strong>el</strong>as y aún a ven<strong>de</strong>rlas <strong>de</strong>spués <strong>de</strong> llenar los requisitos establecidos<br />
por la ley.<br />
Todo lo anterior se menciona porque hoy no es fácil conocer ni <strong>el</strong> número ni la superficie <strong>de</strong><br />
ejidatarios y tierras ejidales que <strong>el</strong>los trabajan ya que, aunque la renta y la venta <strong>de</strong> parc<strong>el</strong>as ya<br />
se permite, también se oculta.<br />
¿Cuántos <strong>de</strong> los millones <strong>de</strong> migrantes han abandonado sus parc<strong>el</strong>as en los últimos diez años?<br />
nos lo indica la <strong>de</strong>spoblación y la feminización <strong><strong>de</strong>l</strong> campo, aún en la áreas <strong>de</strong> riego.<br />
8. 1 Sobre <strong>el</strong> Ejido, antes y <strong>de</strong>spués<br />
Los campesinos <strong>de</strong> México con toda su compleja herencia, pesada vivencia y sometimiento,<br />
llegan a la segunda mitad <strong><strong>de</strong>l</strong> siglo XIX y principios <strong><strong>de</strong>l</strong> XX y logran integrar al hombre, los<br />
pueblos y la tierra, en una unidad <strong>de</strong> convivencia, producción y trascen<strong>de</strong>ncia que se llama<br />
Ejido, forma <strong>de</strong> organización social, que en México, realmente nunca ha sido entendida por las<br />
otras partes <strong>de</strong> la comunidad nacional.<br />
Se supuso la restitución <strong>de</strong> las tierras a sus poseedores originales, como un acto <strong>de</strong> justicia, ya<br />
que éstas les habían sido arrebatadas por los conquistadores-colonizadores<br />
La entrega <strong>de</strong> tierras como consecuencia <strong>de</strong> la Revolución Mexicana, abarca también,<br />
necesariamente, a la población mestiza <strong><strong>de</strong>l</strong> sector rural con <strong>el</strong> objetivo principal <strong>de</strong> que una<br />
parc<strong>el</strong>a generalmente pequeña fuera trabajada por <strong>el</strong> titular y su familia <strong>para</strong> su sostenimiento<br />
o bien, en los ejidos colectivos <strong>para</strong> la convivencia y <strong>de</strong>sarrollo <strong>de</strong> los pueblos.<br />
Los Ejidos, con personalidad jurídica propia, se conciben y organizan legalmente como<br />
imprescriptibles, inalienables, inembargables, obviamente estas tierras no se pue<strong>de</strong>n ven<strong>de</strong>r, ni<br />
rentar, se pue<strong>de</strong>n heredar cumpliendo reglas y quien no cumpla con trabajarlas y con su<br />
responsabilidad social, se le inicia un juicio <strong>de</strong> privación <strong>de</strong> <strong>de</strong>rechos agrarios. Se atien<strong>de</strong> así,<br />
al <strong>para</strong>digma <strong>de</strong> que “la tierra es <strong>de</strong> quien la trabaja”.<br />
El Ejido cumplió sobradamente con su cometido y produjo gran<strong>de</strong>s exce<strong>de</strong>ntes <strong>de</strong> productos<br />
agropecuarios y forestales en tanto tuvo apoyos crediticios, técnicos y <strong>de</strong> comercialización.<br />
Estos apoyos le fueron retirados <strong>para</strong> que las radicales modificaciones al Artículo 27<br />
14
<strong>Potenciales</strong> y <strong>Viabilidad</strong> <strong><strong>de</strong>l</strong> <strong>Uso</strong> <strong>de</strong> <strong>Bioetanol</strong> y <strong>Biodies<strong>el</strong></strong> <strong>para</strong> <strong>el</strong> Transporte en México (SENER-BID-GTZ)<br />
Task 3: Overview of agricultural aspects<br />
Constitucional en materia agraria, hicieran posibles gran<strong>de</strong>s cambios en la materia a partir <strong>de</strong><br />
1992.<br />
Ahora, la parc<strong>el</strong>a ejidal, las tierras ejidales, pue<strong>de</strong>n, siguiendo un procedimiento que mucho<br />
apoya <strong>el</strong> Gobierno, pasar a ser propiedad privada (ya no social) y ven<strong>de</strong>rse, rentarse,<br />
enajenarse. Estos cambios se impusieron a las comunida<strong>de</strong>s y ejidos. Tal vez la más objetiva<br />
y clara expresión <strong><strong>de</strong>l</strong> agrarismo en México pertenece a un norteamericano, cuando dice en su<br />
libro sobre Emiliano Zapata: “Este es un libro acerca <strong>de</strong> unos campesinos que no querían<br />
cambiar y que, por eso mismo, hicieron una revolución”.- “Womach”.<br />
9. La Organización <strong>de</strong> la Agricultura en México<br />
La organización <strong>de</strong> la agricultura en México ha transitado como es natural, por varias etapas<br />
legales, institucionales, sociales y económicas.<br />
Las que se refieren a los aspectos legales <strong>de</strong> carácter histórico se han plasmado en las tres<br />
formas <strong>de</strong> propiedad <strong>de</strong> la tierra que establece la Constitución Política <strong>de</strong> los Estados Unidos<br />
Mexicanos, que son <strong>el</strong> ejido, la comunidad y la propiedad privada.<br />
Estas formas <strong>de</strong> organización son aún vigentes, con los cambios sustantivos ya mencionados.<br />
La Constitución Política <strong>de</strong> los Estados Unidos Mexicanos, las sucesivas Leyes Agrarias, las<br />
Leyes <strong>de</strong> Crédito Agropecuario y <strong><strong>de</strong>l</strong> Seguro Agrícola y Gana<strong>de</strong>ro, la Ley <strong>de</strong> Instituciones<br />
Auxiliares <strong><strong>de</strong>l</strong> Crédito, la Ley <strong>de</strong> Desarrollo Rural Sustentable, hasta llegar a la más reciente<br />
ley gremial: Ley <strong>de</strong> Desarrollo Sustentable <strong>de</strong> la Caña <strong>de</strong> Azúcar, dan cuenta <strong>de</strong> los esfuerzos<br />
<strong>de</strong> los distintos gobiernos por dar marco jurídico a la organización <strong><strong>de</strong>l</strong> campo,<br />
in<strong>de</strong>pendientemente <strong>de</strong> los giros a veces <strong>de</strong> ciento ochenta grados <strong>de</strong> la filosofía que las ha<br />
inspirado.<br />
Des<strong>de</strong> <strong>el</strong> punto <strong>de</strong> vista institucional, la organización <strong>de</strong> la agricultura en México se apoyo en<br />
las Secretarias <strong>de</strong> Agricultura y Recursos Hidráulicos; Secretaria <strong>de</strong> la Reforma Agraria <strong><strong>de</strong>l</strong><br />
Ejecutivo Fe<strong>de</strong>ral; <strong>el</strong> crédito y <strong>el</strong> financiamiento <strong>de</strong> tres gran<strong>de</strong>s bancos en apoyo <strong><strong>de</strong>l</strong><br />
<strong>de</strong>sarrollo <strong><strong>de</strong>l</strong> sector, que financiaban aproximadamente <strong>el</strong> 40% <strong>de</strong> la <strong>de</strong>manda nacional <strong>de</strong><br />
crédito, in<strong>de</strong>pendientemente <strong>de</strong> las financieras e institutos que acreditaban a los productores <strong>de</strong><br />
caña y <strong>de</strong> café<br />
Con <strong>el</strong> propósito <strong>de</strong> r<strong>el</strong>evar al agricultor <strong>de</strong> los riesgos principalmente climáticos que conlleva<br />
la agricultura, principalmente la <strong>de</strong> temporal, la nación mexicana con base en la Ley <strong><strong>de</strong>l</strong><br />
Seguro Agrícola, instituyó a la Aseguradora Nacional Agrícola y Gana<strong>de</strong>ra.<br />
A<strong>de</strong>más, instituciones como la CONASUPO, hacían posible la operación <strong>de</strong> los precios <strong>de</strong><br />
garantía <strong>para</strong> los productos básicos, <strong>el</strong> ágil pago <strong>de</strong> las cosechas y un sistema <strong>de</strong><br />
almacenamiento y distribución que aseguraba <strong>el</strong> abasto <strong>para</strong> la población bajo la<br />
responsabilidad <strong>de</strong> una institución especializada <strong><strong>de</strong>l</strong> Gobierno Fe<strong>de</strong>ral <strong>de</strong>nominada Almacenes<br />
Nacionales <strong>de</strong> Depósito. Los Ferrocarriles que hasta hace pocos años pertenecían a la nación,<br />
15
<strong>Potenciales</strong> y <strong>Viabilidad</strong> <strong><strong>de</strong>l</strong> <strong>Uso</strong> <strong>de</strong> <strong>Bioetanol</strong> y <strong>Biodies<strong>el</strong></strong> <strong>para</strong> <strong>el</strong> Transporte en México (SENER-BID-GTZ)<br />
Task 3: Overview of agricultural aspects<br />
se encargaban <strong><strong>de</strong>l</strong> transporte <strong>de</strong> los productos agrícolas <strong>de</strong> las zonas <strong>de</strong> producción a los<br />
gran<strong>de</strong>s centros <strong>de</strong> consumo.<br />
Una población que crecía con un dinamismo que llegó a alcanzar <strong>el</strong> 3.5% anual, <strong>de</strong>mandaba<br />
<strong>de</strong> un <strong>para</strong>l<strong>el</strong>o esfuerzo <strong>de</strong> incremento en la productividad y en las superficies cultivadas,<br />
principalmente <strong>el</strong> primero ya que la incorporación <strong>de</strong> nuevas áreas a la agricultura no pue<strong>de</strong><br />
ser tan dinámica y su frontera límite en <strong>el</strong> caso <strong>de</strong> nuestro país ha sido muy cercana. En tal<br />
virtud, se apoyó la creación <strong>de</strong> Institutos nacionales, principalmente <strong>de</strong> investigación<br />
agropecuaria y forestal; <strong>de</strong> la industria azucarera; <strong>para</strong> <strong>el</strong> mejoramiento <strong>de</strong> la cafeticultura y <strong>de</strong><br />
las zonas áridas.<br />
A partir <strong>de</strong> la etapa presi<strong>de</strong>ncial <strong><strong>de</strong>l</strong> Gral. Lázaro Cár<strong>de</strong>nas <strong><strong>de</strong>l</strong> Río, se fomenta la educación<br />
agrícola media y superior en toda la república.<br />
De todos los apoyos institucionales mencionados, po<strong>de</strong>mos <strong>de</strong>cir que se conserva poco, tanto<br />
en sus objetivos como en su capacidad <strong>de</strong> operación, baste mencionar que <strong>el</strong> servicio <strong>de</strong><br />
extensión agrícola y transferencia <strong>de</strong> tecnología, prácticamente no existe en <strong>el</strong> país.<br />
Las instituciones <strong>de</strong> crédito se encuentran gran<strong>de</strong>mente disminuidas. La Aseguradora<br />
Nacional opera como reaseguradota muy reducida. La Conasupo y Almacenes Nacionales <strong>de</strong><br />
Depósito <strong>de</strong>saparecieron por completo. Los Ferrocarriles se privatizaron y no han crecido en<br />
su cobertura absolutamente nada. El reparto agrario se dio por terminado y las gran<strong>de</strong>s obras<br />
<strong>de</strong> irrigación son prácticamente las mismas que hace 30 años.<br />
Cuando se intensifico <strong>el</strong> reparto <strong>de</strong> la tierra en la década <strong>de</strong> los treinta <strong><strong>de</strong>l</strong> siglo pasado, se<br />
organizaron los gran<strong>de</strong>s ejidos colectivos en Yucatán, Michoacán, La Laguna y Sonora y <strong>de</strong><br />
menor tamaño se hicieron los esfuerzos en toda la república. Sin embargo con <strong>el</strong> <strong>de</strong>venir <strong>de</strong><br />
los años, se <strong>de</strong>scubrió que la vocación <strong>de</strong> la mayor parte <strong>de</strong> los campesinos <strong>de</strong> México, no<br />
comulgaba con la organización colectiva. La excepción y <strong>de</strong>s<strong>de</strong> luego a su manera, está aun<br />
representada por las comunida<strong>de</strong>s indígenas.<br />
El Gobierno <strong>de</strong> la República intentó apoyar la organización económica <strong>de</strong> la agricultura al<br />
través <strong>de</strong> Uniones <strong>de</strong> Ejidos, Socieda<strong>de</strong>s <strong>de</strong> crédito, Grupos solidarios, Socieda<strong>de</strong>s <strong>de</strong><br />
producción rural, sin buenos resultados ya que, por ejemplo, ni siquiera pudo aplicarse en lo<br />
que al crédito se refiere, la famosa responsabilidad solidaria.<br />
Hemos tardado <strong>de</strong>masiado tiempo en darnos cuenta que las formas <strong>de</strong> organización<br />
económica, y <strong><strong>de</strong>l</strong> trabajo, en <strong>el</strong> sector campesino <strong>de</strong> México, <strong>de</strong>be ser inmanente <strong>de</strong> los propios<br />
campesinos y que la intención política que se aplicó en <strong>el</strong> pasado <strong>para</strong> organizar a los<br />
productores <strong><strong>de</strong>l</strong> campo, fracasó por su propia esencia.<br />
En nuestra opinión es claro que <strong>de</strong>berán ser <strong>el</strong>los, los productores los que encuentren las<br />
formas <strong>de</strong> organización y a la luz <strong>de</strong> algunos resultados vigentes, es la organización<br />
cooperativa como la <strong>de</strong> los cañeros, la que con diversas modalida<strong>de</strong>s pudiera prosperar.<br />
Al referirnos a la organización económica, actualmente parecen progresar los Fondos <strong>de</strong><br />
Inversión y Capitalización (FINCAS) y en una etapa superior las SOFOLES Socieda<strong>de</strong>s<br />
Financieras <strong>de</strong> Objeto Limitado, integradas por los propios productores <strong><strong>de</strong>l</strong> campo.<br />
16
<strong>Potenciales</strong> y <strong>Viabilidad</strong> <strong><strong>de</strong>l</strong> <strong>Uso</strong> <strong>de</strong> <strong>Bioetanol</strong> y <strong>Biodies<strong>el</strong></strong> <strong>para</strong> <strong>el</strong> Transporte en México (SENER-BID-GTZ)<br />
Task 3: Overview of agricultural aspects<br />
Como un hito <strong>de</strong> éxito organizativo en <strong>el</strong> campo mexicano, <strong>de</strong>bemos distinguir a los Fondos<br />
<strong>de</strong> Auto-aseguramiento que integrados únicamente por agricultores, ofrecen ya una creciente<br />
seguridad en <strong>el</strong> campo digna <strong>de</strong> mayor apoyo.<br />
Las Ca<strong>de</strong>nas Sistema-Producto previstas por la Ley <strong>de</strong> Desarrollo Sustentable y que se han<br />
intentado poner en práctica, parecen no prosperar ya que tratan equivocadamente <strong>de</strong> aglutinar<br />
intereses y culturas muy diferentes.<br />
9.1. La autosuficiencia alimentaria<br />
México hoy, gracias principalmente al petróleo y a las remesas <strong>de</strong> nuestros emigrados, tiene<br />
soberanía alimentaria, ya que pue<strong>de</strong> importar sus gran<strong>de</strong>s faltantes <strong>de</strong> productos básicos <strong>para</strong><br />
la nutrición <strong><strong>de</strong>l</strong> pueblo. Lo que obviamente no alcanza es la autosuficiencia alimentaria, <strong>de</strong><br />
eso, estamos muy lejos, véase si no:<br />
En <strong>el</strong> año 2004-2005 importamos 6 millones <strong>de</strong> ton<strong>el</strong>adas <strong>de</strong> maíz, 2.9 <strong>de</strong> sorgo, 3.7 <strong>de</strong> trigo,<br />
0.55 <strong>de</strong> arroz, 3.5 <strong>de</strong> soya; 287,000 ton<strong>el</strong>adas <strong>de</strong> carne <strong>de</strong> res, 458,000 <strong>de</strong> carne <strong>de</strong> cerdo.<br />
También importamos aunque en menor proporción, carne <strong>de</strong> pollo.<br />
La información anterior que proce<strong>de</strong> <strong><strong>de</strong>l</strong> Departamento <strong>de</strong> Agricultura <strong>de</strong> los Estados Unidos<br />
<strong>de</strong> América, <strong>de</strong> su informe <strong>de</strong> marzo <strong><strong>de</strong>l</strong> 2006, es claramente alarmante, pero lo es más aún, la<br />
ten<strong>de</strong>ncia en las importaciones <strong>de</strong> estos productos proyectada al año 2015-16 que sólo por<br />
mencionar <strong>el</strong> maíz, al trigo y al sorgo, alcanzarán si nosotros no hacemos lo pertinente, los<br />
13.5 millones <strong>de</strong> ton<strong>el</strong>adas <strong><strong>de</strong>l</strong> primero, 5 millones <strong><strong>de</strong>l</strong> segundo y 3.3 millones <strong>de</strong> ton<strong>el</strong>adas <strong>de</strong><br />
sorgo.<br />
Se calculó <strong>el</strong> grado <strong>de</strong> autosuficiencia <strong>de</strong> los principales cultivos <strong>el</strong> cual se presenta en la<br />
siguiente:<br />
17
<strong>Potenciales</strong> y <strong>Viabilidad</strong> <strong><strong>de</strong>l</strong> <strong>Uso</strong> <strong>de</strong> <strong>Bioetanol</strong> y <strong>Biodies<strong>el</strong></strong> <strong>para</strong> <strong>el</strong> Transporte en México (SENER-BID-GTZ)<br />
Task 3: Overview of agricultural aspects<br />
Tabla 9.1 Grado <strong>de</strong> autosuficiencia <strong>de</strong> los principales productos agrícolas <strong>para</strong> <strong>el</strong> año <strong>de</strong> 2004.<br />
(a precios corrientes y en miles <strong>de</strong> dólares)<br />
Cultivo<br />
Valor <strong>de</strong><br />
producción 1/<br />
(a)<br />
Importaciones<br />
2/<br />
(b)<br />
Exportaciones<br />
2/<br />
(c)<br />
Consumo<br />
Aparente<br />
d=a+b-c<br />
% <strong>de</strong> auto<br />
suficiencia<br />
e=a/d*100<br />
Trigo 345,4432 617,766 49,212 913,996 37.8<br />
Maíz 3’244,212 745,124 7,417 3’981,919 81.5<br />
Arroz 45,345 184,953 230,299 19.7<br />
Sorgo<br />
grano<br />
Frijol<br />
común<br />
834,810 423,992 1’258,802 66.3<br />
597,608 40,918 638,526 93.6<br />
Soya 32,519 1’107,990 1’140,509 2.9<br />
Colza 722 362,486 363,208 0.2<br />
Chiles 882,517 576,692 305,825 288.6<br />
Tomates 1’512,403 23,087 909,387 626,103 241.6<br />
Cebollas 295,095 214,091 81,004 364.3<br />
T o t a l 7’790,674 3’506,316 1’756,799 9’540,191 81.7<br />
Fuente: 1/ Sagarpa<br />
2/ Banco <strong>de</strong> México<br />
Es oportuno <strong>de</strong>stacar, <strong>el</strong> que, <strong>para</strong> los productos que integran la alimentación básica <strong><strong>de</strong>l</strong> pueblo<br />
<strong>de</strong> México como lo son <strong>el</strong> maíz, <strong>el</strong> trigo, <strong>el</strong> arroz y las oleaginosas, la <strong>de</strong>pen<strong>de</strong>ncia <strong>de</strong> las<br />
importaciones es claramente excesiva. Aquí <strong>el</strong> indicador <strong>de</strong> autosuficiencia es <strong><strong>de</strong>l</strong> 60 %.<br />
El 82% <strong>de</strong> autosuficiencia que se muestra en <strong>el</strong> cuadro anterior, se alcanza al tomar en cuenta<br />
la producción y <strong>el</strong> consumo <strong>de</strong> productos hortícolas en los cuales somos claramente<br />
autosuficientes y exportadores.<br />
9. 2 La productividad<br />
La información <strong>de</strong> la SAGARPA, nos indica que en <strong>el</strong> lapso comprendido entre 1995 y 2004,<br />
la productividad creció <strong>para</strong> los granos básicos en un 21% a una tasa promedio <strong>de</strong> 2.29%<br />
anual. Si este incremento <strong>de</strong> productividad sostenido llama la atención por su magnitud, más<br />
aún llama la atención, <strong>el</strong> aumento <strong>de</strong> la productividad <strong><strong>de</strong>l</strong> maíz grano que fue <strong><strong>de</strong>l</strong> 23%.<br />
Consi<strong>de</strong>rando los aumentos <strong>de</strong> la productividad en <strong>el</strong> maíz <strong>de</strong> las buenas zonas <strong>de</strong> riego <strong>de</strong><br />
Sinaloa, resulta interesante conocer que aún en etapas en que se han retirado los apoyos<br />
18
<strong>Potenciales</strong> y <strong>Viabilidad</strong> <strong><strong>de</strong>l</strong> <strong>Uso</strong> <strong>de</strong> <strong>Bioetanol</strong> y <strong>Biodies<strong>el</strong></strong> <strong>para</strong> <strong>el</strong> Transporte en México (SENER-BID-GTZ)<br />
Task 3: Overview of agricultural aspects<br />
institucionales <strong><strong>de</strong>l</strong> crédito y la asistencia técnica a los agricultores, pudimos sostener en <strong>el</strong><br />
alimento básico <strong><strong>de</strong>l</strong> pueblo muy buenas tasas en <strong>el</strong> incremento <strong>de</strong> la productividad.<br />
En este sentido y con la información disponible, preocupa <strong>el</strong> bajo aumento en la<br />
productividad <strong>de</strong> la soya, <strong>el</strong> ajonjolí y <strong>el</strong> cártamo.<br />
De los cultivos perennes, la caña <strong>de</strong> azúcar es con mucho, <strong>el</strong> cultivo que produce <strong>el</strong> más alto<br />
valor <strong>para</strong> la nación y resulta conveniente recordar que en términos <strong>de</strong> productividad esta se ha<br />
incrementado en <strong>el</strong> lapso <strong>de</strong> análisis en lo que se refiere al rendimiento <strong>de</strong> tallos por hectárea<br />
en un 11.23% o sea un promedio <strong>de</strong> 1.25% anual. El azúcar producido por hectárea, aumentó<br />
su productividad en un 16.29% o sea 1.81% anual.<br />
Si observamos <strong>el</strong> incremento com<strong>para</strong>tivo en la productividad <strong><strong>de</strong>l</strong> maíz y <strong>de</strong> la caña, vemos<br />
que <strong>el</strong> primero creció a una tasa doble que <strong>el</strong> segundo Si por otra parte sabemos bien que la<br />
caña <strong>de</strong> azúcar es <strong>el</strong> cultivo más rentable <strong>de</strong> la agricultura <strong>de</strong> cultivos básicos y aún <strong>de</strong> cultivos<br />
industriales y frutales y también <strong>el</strong> que se fertiliza casi en la totalidad <strong>de</strong> sus superficie, la cual<br />
se riega en un 35%, entonces, se justifica aún más <strong>el</strong> análisis cuidadoso <strong>de</strong> las condiciones que<br />
han permitido <strong>el</strong> mejoramiento <strong>de</strong> la productividad en <strong>el</strong> cultivo <strong><strong>de</strong>l</strong> maíz <strong>para</strong> extrapolarlas en<br />
lo posible a los cultivos <strong>de</strong> arroz, frijol y oleaginosas.<br />
9. 3 Los insumos: Los fertilizantes<br />
Después <strong><strong>de</strong>l</strong> agua <strong>de</strong> riego, cuando esta es la tecnología, <strong>el</strong> fertilizante es <strong>el</strong> insumo más<br />
importante <strong>para</strong> conservar la fertilidad <strong>de</strong> los su<strong>el</strong>os y <strong>el</strong>evar la producción y productividad<br />
agrícolas. En <strong>el</strong> caso <strong>de</strong> la agricultura <strong>de</strong> temporal, <strong>el</strong> fertilizante es <strong>el</strong> insumo <strong>de</strong> mayor<br />
importancia.<br />
A partir <strong>de</strong> compren<strong>de</strong>r y justipreciar las experiencias claramente <strong>de</strong>mostradas en <strong>el</strong> mundo<br />
entero, que se expresan como sigue:<br />
a) Aún más <strong><strong>de</strong>l</strong> 40% <strong><strong>de</strong>l</strong> gran incremento en la producción <strong>de</strong> cereales en las últimas<br />
décadas, en <strong>el</strong> mundo, se atribuye al aumento en <strong>el</strong> uso <strong><strong>de</strong>l</strong> nitrógeno fertilizante<br />
(FAO).<br />
b) Sin fertilizante las varieda<strong>de</strong>s con alto potencial <strong>de</strong> rendimiento y calidad, no producen<br />
más, ni mejor, que las varieda<strong>de</strong>s tradicionales.<br />
c) El cultivo <strong>de</strong> la tierra con las tecnologías apropiadas, entre las cuales <strong>de</strong>staca la<br />
nutrición vegetal ha propiciado <strong>el</strong> que, si hace 30 años <strong>el</strong> abastecimiento mundial <strong>de</strong><br />
alimentos representaba 2,360 calorías diarias por persona; a mediados <strong>de</strong> los años 90 se<br />
alcanzaron 2,740 calorías diarias por persona. (FAO)<br />
Concluimos que, la casi <strong>de</strong>saparición <strong>de</strong> la planta industrial productora <strong>de</strong> fertilizantes en<br />
México, en su tiempo aún exportadora, según <strong>el</strong> simplista razonamiento <strong>de</strong> aplicar al gas<br />
natural, materia prima principal, producido por PEMEX, <strong>el</strong> precio más alto <strong>de</strong> mundo, será<br />
resu<strong>el</strong>ta, con <strong>el</strong> apoyo <strong>de</strong> la “Ley <strong>de</strong> Gas Natural <strong>de</strong> Proceso, Amoníaco y Fertilizantes<br />
Nitrogenados”.<br />
19
<strong>Potenciales</strong> y <strong>Viabilidad</strong> <strong><strong>de</strong>l</strong> <strong>Uso</strong> <strong>de</strong> <strong>Bioetanol</strong> y <strong>Biodies<strong>el</strong></strong> <strong>para</strong> <strong>el</strong> Transporte en México (SENER-BID-GTZ)<br />
Task 3: Overview of agricultural aspects<br />
Esta Ley permitirá evitar <strong>el</strong> absurdo <strong>de</strong> tener una gran planta industrial productora <strong>de</strong><br />
amoníaco, en manos <strong><strong>de</strong>l</strong> Estado (PEMEX) operada a menos <strong><strong>de</strong>l</strong> 20% <strong>de</strong> su capacidad (una <strong>de</strong><br />
seis plantas) y reactivar las industrias mexicanas <strong>de</strong> urea, nitrato <strong>de</strong> amonio, sulfato <strong>de</strong><br />
amonio, fosfato <strong>de</strong> amonio y complejos.<br />
Ha sido muy grave la disminución real <strong><strong>de</strong>l</strong> uso <strong>de</strong> fertilizantes en los últimos años, al<br />
com<strong>para</strong>rse con <strong>el</strong> año <strong>de</strong> 1996, en <strong>el</strong> cual todavía operaba nuestra industria. En ese año la<br />
aplicación <strong>de</strong> nitrógeno fue <strong>de</strong> 70 kilos por hectárea, abatiéndose a solo 53 kilos por ha<br />
cultivada en <strong>el</strong> año <strong>de</strong> 2003.<br />
En <strong>el</strong> anexo I.6 encontramos que <strong>el</strong> consumo nacional <strong>de</strong> fertilizantes nitrogenados, amoniaco<br />
equivalente <strong>para</strong> <strong>el</strong> año <strong>de</strong> 2003 alcanzó 1 millón 434 mil ton<strong>el</strong>adas, lo cual representó una<br />
disminución <strong>de</strong> 388 mil ton<strong>el</strong>adas, al com<strong>para</strong>r este consumo con <strong>el</strong> <strong><strong>de</strong>l</strong> año 1996 que fue <strong>de</strong> 1<br />
millón 822 mil ton<strong>el</strong>adas <strong>de</strong> amoniaco equivalente. Así será muy difícil aumentar la<br />
productividad y evitar <strong>el</strong> <strong>de</strong>terioro <strong>de</strong> los su<strong>el</strong>os agrícolas <strong><strong>de</strong>l</strong> país.<br />
Aquí, es <strong>de</strong> importancia mencionar que a los <strong>el</strong>evados precios <strong>de</strong> los fertilizantes que hoy se<br />
consumen en <strong>el</strong> país, este insumo representa entre <strong>el</strong> 25 y <strong>el</strong> 35% <strong><strong>de</strong>l</strong> costo <strong>de</strong> producción <strong>de</strong><br />
los granos básicos, según se trate <strong>de</strong> tecnologías <strong>de</strong> riego o <strong>de</strong> temporal.<br />
Es en nuestra opinión <strong>de</strong> una claridad meridiana, <strong>el</strong> ejemplo <strong>de</strong> las r<strong>el</strong>aciones <strong>de</strong> intercambio<br />
<strong><strong>de</strong>l</strong> maíz, con <strong>el</strong> nitrógeno fertilizante <strong>para</strong> <strong>el</strong> caso <strong>de</strong> los distritos <strong>de</strong> riego <strong>de</strong> Sinaloa que son<br />
los más eficientes productores <strong>de</strong> maíz en la República. Aquí, a pesar <strong><strong>de</strong>l</strong> incremento <strong>de</strong> la<br />
productividad en los rendimientos <strong><strong>de</strong>l</strong> maíz que pasó ene <strong>el</strong> lapso <strong>de</strong> 1997 a 2004 <strong>de</strong> 7.49 a<br />
8.72 ton<strong>el</strong>adas por hectárea, es <strong>de</strong>cir, 16.4% <strong>de</strong> aumento, las r<strong>el</strong>aciones <strong>de</strong> cambio <strong>para</strong> este<br />
grano con <strong>el</strong> nitrógeno se <strong>de</strong>terioraron en contra <strong><strong>de</strong>l</strong> agricultor en un 66%.<br />
En Veracruz, <strong>para</strong> este mismo cultivo que no ha tenido incrementos <strong>de</strong> productividad<br />
significativos, las r<strong>el</strong>aciones <strong>de</strong> intercambio con <strong>el</strong> nitrógeno se <strong>de</strong>terioraron en un 76%.<br />
En lo que se refiere a los productos agroquímicos, es satisfactorio conocer <strong>el</strong> que nuestros<br />
agricultores cuentan con los productos más mo<strong>de</strong>rnos y a precios similares al que los<br />
adquieren los agricultores <strong>de</strong> otros países como los propios EUA y América Latina.<br />
El insumo genético representado por las semillas, sean estas criollas ó híbridas, tiene la sola<br />
limitación com<strong>para</strong>tiva con otros países <strong><strong>de</strong>l</strong> mundo en las restricciones, razonadas, <strong>de</strong> las<br />
transgénicas y genéticamente modificadas.<br />
En <strong>el</strong> caso <strong>de</strong> los materiales vegetativos <strong>para</strong> la reproducción, se <strong>de</strong>be reconocer <strong>el</strong> atraso en la<br />
producción <strong>de</strong> materiales, pero sobretodo <strong>de</strong> la investigación y experimentación agrícola.<br />
En <strong>el</strong> caso <strong>de</strong> los combustibles particularmente <strong>el</strong> dies<strong>el</strong>, <strong>el</strong> incremento <strong>de</strong> los precios en los<br />
últimos años que se ha tratado <strong>de</strong> paliar con éxito solo mediano, con programas <strong>de</strong> subsidio<br />
gubernamental, a favor <strong>de</strong> los agricultores, no <strong>de</strong>be seguirse agravando, seria <strong>de</strong>masiado<br />
oneroso. De seguir <strong>el</strong> aumento <strong>de</strong> precios, como parece ser según la ten<strong>de</strong>ncia, <strong><strong>de</strong>l</strong> aumento<br />
en los precios <strong><strong>de</strong>l</strong> petróleo crudo, los agricultores organizados se verán obligados <strong>para</strong> su<br />
propio beneficio, a ac<strong>el</strong>erar la producción <strong><strong>de</strong>l</strong> <strong>Biodies<strong>el</strong></strong> y cubrir así su <strong>de</strong>manda.<br />
20
<strong>Potenciales</strong> y <strong>Viabilidad</strong> <strong><strong>de</strong>l</strong> <strong>Uso</strong> <strong>de</strong> <strong>Bioetanol</strong> y <strong>Biodies<strong>el</strong></strong> <strong>para</strong> <strong>el</strong> Transporte en México (SENER-BID-GTZ)<br />
Task 3: Overview of agricultural aspects<br />
Las tarifas <strong>de</strong> la energía <strong>el</strong>éctrica también han incrementado su costo <strong>de</strong> manera significativa a<br />
pesar <strong>de</strong> los programas gubernamentales, ya que si bien estos impi<strong>de</strong>n <strong>el</strong>evadas tasas <strong>de</strong><br />
aumento, solo cubren consumos limitados <strong>de</strong> tal modo que <strong>el</strong> alumbramiento real <strong>de</strong> agua en<br />
los pozos, necesario <strong>para</strong> <strong>el</strong> buen riego, supera con mucho <strong>el</strong> limite <strong>de</strong> las tarifas subsidiadas y<br />
así los costos <strong>de</strong> este insumo siguen repercutiendo negativamente sobre las utilida<strong>de</strong>s <strong>de</strong> los<br />
productores.<br />
9.4 Extensión agrícola<br />
Esta sustantiva actividad es entendida como un proceso continuo <strong>para</strong> hacer llegar información<br />
útil a la población, <strong>para</strong> luego ayudarla a adquirir los conocimientos técnicos y aptitu<strong>de</strong>s<br />
necesarias <strong>para</strong> aprovechar eficazmente esa información tecnológica.<br />
“El objetivo <strong><strong>de</strong>l</strong> proceso extensionista, es hacer posible que la gente utilice esas técnicas y<br />
conocimientos, así como la información <strong>para</strong> mejorar sus condiciones <strong>de</strong> vida “(Swanson).<br />
Así, se podría pasar con la aceptación <strong>de</strong> los agricultores y gana<strong>de</strong>ros, <strong>de</strong> los métodos<br />
tradicionales <strong>de</strong> producción a nuevos <strong>el</strong>ementos técnicos, nuevos cultivos y hasta nuevos<br />
sistemas agrícolas.<br />
En México, <strong>el</strong> concepto <strong>de</strong> extensión ha sido siempre más limitado sobre todo en los últimos<br />
tiempos, en los que <strong>el</strong> Gobierno ha modificado su pap<strong>el</strong> en la extensión agrícola <strong>para</strong><br />
concentrarse en apoyar programas <strong>de</strong> transferencia <strong>de</strong> tecnología, a través <strong>de</strong> agentes externos.<br />
El Gobierno fe<strong>de</strong>ral asumió durante muchos años la tarea <strong><strong>de</strong>l</strong> extensionismo agrícola (más<br />
bien, programas <strong>de</strong> tecnología) en los cuales la vertiente <strong>de</strong> capacitación resultó fallida, porque<br />
primero había que enseñar a leer y hacer cuentas a los capacitandos.<br />
Los técnicos, con frecuencia sin formación universitaria eran servidores públicos mas<br />
entusiastas que pre<strong>para</strong>dos y trabajaban <strong>para</strong> las Secretarias <strong>de</strong> Agricultura y Reforma Agraria,<br />
los bancos <strong>de</strong> crédito agrícolas oficiales y los pocos institutos <strong>de</strong> investigación agropecuaria y<br />
forestal. En esta materia las universida<strong>de</strong>s han brillado por su ausencia.<br />
Para sus limitados recursos, se lograron buenos resultados en la adopción por una alta<br />
proporción <strong>de</strong> campesinos y agricultores <strong>de</strong> las técnicas <strong>para</strong> la fertilización <strong>de</strong> cultivos<br />
básicos, <strong>el</strong> uso <strong>de</strong> semillas mejoradas y agroquímicos, así como control integrado <strong>de</strong> plagas y<br />
métodos mo<strong>de</strong>rnos <strong>de</strong> riego. En lo pecuario se avanzo en la nutrición animal y en <strong>el</strong><br />
mejoramiento genético <strong>de</strong> los hatos y por <strong>el</strong>lo, en la productividad.<br />
Sin embargo, estas sustantivas tareas han sido prácticamente abandonadas por <strong>el</strong> estado <strong>para</strong><br />
quedar en manos, si acaso <strong>de</strong> las empresas ven<strong>de</strong>doras <strong>de</strong> semillas, agroquímicos, equipos <strong>de</strong><br />
riego y alimentos balanceados <strong>para</strong> animales, siempre con la parcialidad <strong>de</strong> los intereses<br />
comerciales. Aquí vale la pena subrayar los esfuerzos que están ya realizando las<br />
organizaciones locales <strong>de</strong> cañicultores <strong>para</strong> iniciar en cada zona <strong>de</strong> abastecimiento la<br />
estructuración <strong>de</strong> sus “oficinas técnicas <strong>de</strong> campo”<br />
21
<strong>Potenciales</strong> y <strong>Viabilidad</strong> <strong><strong>de</strong>l</strong> <strong>Uso</strong> <strong>de</strong> <strong>Bioetanol</strong> y <strong>Biodies<strong>el</strong></strong> <strong>para</strong> <strong>el</strong> Transporte en México (SENER-BID-GTZ)<br />
Task 3: Overview of agricultural aspects<br />
9.5 Programas <strong>de</strong> irrigación, control <strong>de</strong> avenidas y drenaje (anexo I.7)<br />
La información <strong>de</strong> INEGI, nos da cuenta <strong>de</strong> las principales presas según capacidad <strong>de</strong><br />
almacenamiento y uso, 2004, en don<strong>de</strong>, quedan claros los propósitos <strong>de</strong> esta obras en lo<br />
r<strong>el</strong>ativo al control <strong>de</strong> avenidas, <strong>para</strong> evitar inundaciones. Son muchas las gran<strong>de</strong>s obras<br />
hidráulicas que tienen ese cometido.<br />
En lo que se refiere al problema <strong><strong>de</strong>l</strong> drenaje en gran escala, no así <strong>el</strong> parc<strong>el</strong>ario, es importante<br />
mencionar que este problema seguirá creciendo en la medida en que la <strong>de</strong>forestación lo haga.<br />
La tala <strong>de</strong> los bosques <strong>de</strong> la nación ha sido una <strong>de</strong> las gran<strong>de</strong>s calamida<strong>de</strong>s que hemos<br />
pa<strong>de</strong>cido, pues no es solo <strong>el</strong> gravísimo daño a nuestros bosques y s<strong>el</strong>vas sino la erosión <strong>de</strong><br />
nuestros su<strong>el</strong>os y <strong>el</strong> azolvamiento <strong>de</strong> ríos que se salen <strong>de</strong> madre con mucho mas frecuencia, <strong>de</strong><br />
cuerpos <strong>de</strong> agua que disminuyen su capacidad, sobre todo <strong>de</strong> las presas <strong>de</strong> almacenamiento,<br />
que ya no guardan los volúmenes originales y reducen así su capacidad <strong>de</strong> riego.<br />
10. Exportaciones e Importaciones agrícolas <strong>de</strong> México (anexo I.8)<br />
El valor <strong>de</strong> las exportaciones agrícolas <strong><strong>de</strong>l</strong> año 2005 con cifras pr<strong>el</strong>iminares, ascendió a 4,967<br />
millones <strong>de</strong> dólares <strong>el</strong> cual refleja un incremento <strong>de</strong> 10.6% con r<strong>el</strong>ación al año anterior. Este<br />
valor también representa <strong>el</strong> 42% <strong><strong>de</strong>l</strong> total <strong>de</strong> las exportaciones agroalimentarias cuyo monto<br />
total es <strong>de</strong> 11,856 millones <strong>de</strong> dólares.<br />
Las exportaciones agrícolas son principalmente <strong>de</strong> hortalizas y frutas, <strong>de</strong>stacando por su valor<br />
las siguientes:<br />
Tomate fresco o refrigerado; otras legumbres y hortalizas frescas; pimiento; aguacate; m<strong>el</strong>ón,<br />
sandia y papaya frescos; pepino y pepinillo; cebolla; café sin tostar y <strong>de</strong>scafeinar; cítricos<br />
frescos; uvas frescas o secas, pasas; almendras, nueces y pistaches, alcanzando estos productos<br />
<strong>el</strong> 78% <strong>de</strong> las exportaciones agrícolas.<br />
En cuanto a las importaciones agrícolas que ascien<strong>de</strong>n a 5,022 millones <strong>de</strong> dólares, son<br />
principalmente <strong>de</strong> granos básicos y oleaginosas: trigo; maíz; arroz; sorgo grano; soya; colza y<br />
algodón que representan <strong>el</strong> 70.3% <strong>de</strong> este valor.<br />
El valor total <strong>de</strong> las importaciones agrícolas representa <strong>el</strong> 35% <strong><strong>de</strong>l</strong> valor total <strong>de</strong> las<br />
importaciones agroalimentarias que ascendieron a 14,293 millones <strong>de</strong> dólares.<br />
Nótese las diferentes proporciones <strong>de</strong> lo exportado e importado en materia <strong>de</strong> productos<br />
agroalimentarios, es evi<strong>de</strong>nte que <strong>de</strong> <strong>de</strong> las importaciones agroalimentarias, nosotros<br />
recibimos <strong><strong>de</strong>l</strong> extranjero mayor valor agregado.<br />
22
<strong>Potenciales</strong> y <strong>Viabilidad</strong> <strong><strong>de</strong>l</strong> <strong>Uso</strong> <strong>de</strong> <strong>Bioetanol</strong> y <strong>Biodies<strong>el</strong></strong> <strong>para</strong> <strong>el</strong> Transporte en México (SENER-BID-GTZ)<br />
Task 3: Overview of agricultural aspects<br />
11. Cultivos energéticos<br />
En México, en virtud <strong>de</strong> las características <strong>de</strong> su producción agrícola, su bajo grado <strong>de</strong><br />
autosuficiencia alimentaria, <strong>de</strong> la organización social en la producción <strong>de</strong> maíz y sus<br />
generosos trópicos, <strong>de</strong>bemos mencionar en primer lugar a la caña <strong>de</strong> azúcar, a la remolacha<br />
azucarera y a la yuca como materias primas prioritarias <strong>para</strong> la producción <strong>de</strong> <strong>Bioetanol</strong>.<br />
También, en <strong>de</strong>terminadas zonas con problemas puntuales <strong>de</strong> calidad <strong>de</strong> su<strong>el</strong>os o <strong>de</strong> carácter<br />
climático, que se reflejan en baja productividad y <strong>de</strong>sperdicio <strong>de</strong> recursos, se podrían<br />
consi<strong>de</strong>rar los cultivos <strong><strong>de</strong>l</strong> trigo y <strong><strong>de</strong>l</strong> sorgo.<br />
De caña <strong>de</strong> azúcar se cultivan actualmente en México un poco mas <strong>de</strong> 750 mil hectáreas en 15<br />
estados <strong>de</strong> la República y hasta ahora con propósitos exclusivos <strong>de</strong> producción <strong>de</strong> azúcar.<br />
La remolacha azucarera se ha cultivado en la Región <strong><strong>de</strong>l</strong> Mar <strong>de</strong> Cortés, con propósitos<br />
exitosos <strong>de</strong> <strong>de</strong>mostración, pero actualmente estos esfuerzos están suspendidos. La remolacha<br />
forrajera se cultiva en superficies mo<strong>de</strong>radas en las cuencas lecheras <strong>de</strong> la nación.<br />
De yuca, en <strong>el</strong> año <strong>de</strong> 2004 se sembraron 1,336 has, principalmente en <strong>el</strong> estado <strong>de</strong> Tabasco.<br />
Vale la pena mencionar los esfuerzos realizados en esa entidad por <strong>el</strong> FIRA y los productores<br />
<strong>de</strong> la región, que lamentablemente no prosperaron por razones ajenas a los aspectos agrícolas.<br />
En <strong>el</strong> caso <strong>de</strong> cereales, <strong>de</strong> los que somos <strong>de</strong>ficitarios <strong>para</strong> la alimentación humana y que sin<br />
embargo podrían usarse como materia prima <strong>para</strong> la producción <strong>de</strong> <strong>Bioetanol</strong>, en condiciones<br />
específicas, con problemas locales <strong>de</strong> carácter técnico, económico y social, encontramos <strong>el</strong><br />
trigo <strong>de</strong> Mexicali B.C, que por ubicarse muy lejano <strong>de</strong> los centros <strong>de</strong> consumo <strong>de</strong>be ser<br />
subsidiado sobre todo <strong>para</strong> su transporte. Así, la solución podría ser <strong>el</strong> darle valor agregado en<br />
<strong>el</strong> sitio a la producción <strong><strong>de</strong>l</strong> grano y la paja <strong>para</strong> la fabricación <strong>de</strong> <strong>Bioetanol</strong> <strong>para</strong> su consumo en<br />
<strong>el</strong> estado, mezclado con las gasolinas, a par y paso que se <strong>de</strong>sarrollan las tecnologías <strong>para</strong><br />
mejorar los su<strong>el</strong>os y <strong>el</strong>evar la productividad <strong><strong>de</strong>l</strong> cultivo.<br />
12. Problemas en la penetración al mercado <strong><strong>de</strong>l</strong> <strong>Bioetanol</strong> y <strong><strong>de</strong>l</strong><br />
ETBE<br />
México como país petrolero, <strong>de</strong>scuidó <strong>el</strong> <strong>de</strong>sarrollo <strong>de</strong> sus recursos renovables <strong>para</strong> la<br />
producción <strong>de</strong> energía. Así, aquéllos que se pue<strong>de</strong>n obtener <strong><strong>de</strong>l</strong> sol, <strong>el</strong> viento, la biomasa, no<br />
han sido apoyados o lo han sido tímidamente, hasta ahora.<br />
Quizás las razones mas importantes que explican <strong>el</strong> <strong>de</strong>scuido en <strong>el</strong> <strong>de</strong>sarrollo <strong>de</strong> la biomasa, lo<br />
ha sido PEMEX y la falta <strong>de</strong> investigación y <strong>de</strong>sarrollo científico y tecnológico alre<strong>de</strong>dor <strong>de</strong><br />
este recurso.<br />
A PEMEX que es un monopolio constitucional, sólo le interesa ven<strong>de</strong>r sus combustibles<br />
crecientemente <strong>de</strong> importación y en realidad ha <strong>de</strong>salentado siempre los esfuerzos aislados que<br />
se han hecho en nuestro país <strong>para</strong> avanzar en la fabricación <strong><strong>de</strong>l</strong> <strong>Bioetanol</strong>. Los industriales <strong><strong>de</strong>l</strong><br />
azúcar y las autorida<strong>de</strong>s, sin visión: ni científica, ni ecológica, ni social, ni económica, en fin<br />
23
<strong>Potenciales</strong> y <strong>Viabilidad</strong> <strong><strong>de</strong>l</strong> <strong>Uso</strong> <strong>de</strong> <strong>Bioetanol</strong> y <strong>Biodies<strong>el</strong></strong> <strong>para</strong> <strong>el</strong> Transporte en México (SENER-BID-GTZ)<br />
Task 3: Overview of agricultural aspects<br />
sin visión <strong>de</strong> futuro, han cerrado instituciones <strong>de</strong> investigación y retirado presupuestos <strong>para</strong> <strong>el</strong><br />
propósito.<br />
Los cañicultores por su parte, con su buen mercado <strong>de</strong> los últimos años y su buen precio, no<br />
ven la tormenta que se avecina con la interpretación <strong>de</strong> los norteamericanos al Tratado <strong>de</strong><br />
Libre Comercio en materia <strong>de</strong> edulcorantes.<br />
24
13. Anexo<br />
<strong>Potenciales</strong> y <strong>Viabilidad</strong> <strong><strong>de</strong>l</strong> <strong>Uso</strong> <strong>de</strong> <strong>Bioetanol</strong> y <strong>Biodies<strong>el</strong></strong> <strong>para</strong> <strong>el</strong> Transporte en México (SENER-BID-GTZ)<br />
Task 3: Overview of agricultural aspects<br />
I. Clima <strong>de</strong> la República Mexicana<br />
Principales tipos <strong>de</strong> climas, rangos <strong>de</strong> temperatura media anual y <strong>de</strong><br />
entidad fe<strong>de</strong>rativa.<br />
precipitación total anual por<br />
Entidad Fe<strong>de</strong>rativa Tipo <strong>de</strong> clima<br />
Rango <strong>de</strong> temperatura Rango <strong>de</strong> precipitación<br />
media anua (°C)<br />
total anual (mm)<br />
Aguascalientes Seco 10 a 18 300 a 600<br />
Baja California Seco y muy seco 10 a 26 0 a 300<br />
Baja California sur Seco y muy seco 18 a 26 0 a 600<br />
Campeche Cálido subhúmedo Mas <strong>de</strong> 26 1000 a 2000<br />
Coahuila Seco y muy seco 10 a 26 100 a 600<br />
Colima Cálido subhúmedo 22 a mas <strong>de</strong> 26 600 a 2000<br />
Chiapas<br />
Cálido húmedo<br />
Cálido subhúmedo<br />
Templado subhúmedo 10 a mas <strong>de</strong> 26 1000 a mas <strong>de</strong> 4000<br />
Chihuahua<br />
Templado subhúmedo<br />
Seco y muy seco Menos <strong>de</strong> 10 a 22 100 a 2000<br />
Distrito Fe<strong>de</strong>ral Templado subhúmedo 10 a 18 600 a 2000<br />
Durango<br />
Templado subhúmedo<br />
Y seco Menos <strong>de</strong> 10 a 22 300 a 2000<br />
Guanajuato<br />
Templado subhúmedo<br />
Y seco 10 a 22 300 a 1000<br />
Guerrero<br />
Cálido subhúmedo<br />
Templado subhúmedo<br />
Y seco 10 a mas <strong>de</strong> 26 600 a 2000<br />
Hidalgo<br />
Templado subhúmedo<br />
Templado subhúmedo<br />
Y seco 18 a 22 600 a 4000<br />
Jalisco<br />
Cálido subhúmedo<br />
Templado subhúmedo<br />
Y seco 10 a mas <strong>de</strong> 26 300 a 2000<br />
México<br />
Calido subhúmedo y<br />
Templado subhúmedo Menos <strong>de</strong> 10 a 26 600 a 2000<br />
Michoacán<br />
Cálido subhúmedo y<br />
Templado subhúmedo<br />
Y seco 10 a mas <strong>de</strong> 26 300 a 2000<br />
Mor<strong>el</strong>os<br />
Cálido subhúmedo y<br />
Templado subhúmedo 10 a 26 1000 a 2000<br />
Nayarit Cálido subhúmedo 18 a mas <strong>de</strong> 26 1000 a 2000<br />
Nuevo León<br />
Templado subhúmedo<br />
Y seco 10 a 6 600 a 1000<br />
Oaxaca<br />
(continua)<br />
Cálido húmedo<br />
Calido subhúmedo<br />
Templado húmedo<br />
Templado subhúmedo<br />
Y seco<br />
10 a mas <strong>de</strong> 26 300 a mas <strong>de</strong> 4000<br />
Fuente: INEGI. Datos básicos <strong>de</strong> Geografía <strong>de</strong> México 1991.<br />
25
<strong>Potenciales</strong> y <strong>Viabilidad</strong> <strong><strong>de</strong>l</strong> <strong>Uso</strong> <strong>de</strong> <strong>Bioetanol</strong> y <strong>Biodies<strong>el</strong></strong> <strong>para</strong> <strong>el</strong> Transporte en México (SENER-BID-GTZ)<br />
Task 3: Overview of agricultural aspects<br />
Principales tipos <strong>de</strong> climas, rangos <strong>de</strong> temperatura media anual y <strong>de</strong> precipitación total anual por<br />
entidad fe<strong>de</strong>rativa.<br />
Entidad Fe<strong>de</strong>rativa<br />
Puebla<br />
Tipo <strong>de</strong> clima<br />
Cálido húmedo<br />
Cálido subhúmedo<br />
Templado subhúmedo<br />
Templado suhúmedo y<br />
seco<br />
Rango <strong>de</strong> temperatura<br />
media anua (°C)<br />
Rango <strong>de</strong> precipitación<br />
total anual (mm)<br />
10 a 26 300 a 4000<br />
Querétaro<br />
Templado subhúmedo y<br />
seco 10 a 22 300 a 1000<br />
Quintana Roo Cálido subhúmedo 22 a mas <strong>de</strong> 26 1000 a 2000<br />
San Luis Potosí<br />
Templado subhúmedo<br />
Templado subhúmedo<br />
Y seco<br />
10 a 22 300 a 2000<br />
Sinaloa<br />
Cálido subhúmedo seco<br />
y muy seca 18 a 26 300 a 2000<br />
Sonora Seco y muy seco 10 a 26 0 a 600<br />
Tabasco Cálido húmedo Mas <strong>de</strong> 26 2000 a mas <strong>de</strong> 4000<br />
Tamaulipas<br />
Cálido subhúmedo<br />
Templado subhúmedo<br />
Y seco 18 a 26 300 a 2000<br />
Tlaxcala<br />
Templado subhúmedo y<br />
seco Menos <strong>de</strong> 10 a 18 300 a 1000<br />
Veracruz<br />
Cálido subhúmedo y<br />
cálido subhúmedo y<br />
templado húmedo 10 a 26 1000 a 4000<br />
Yacatán Cálido subhúmedo 22 a mas <strong>de</strong> 26 300 a 2000<br />
Zacatecas<br />
Templado subhúmedo y<br />
seco<br />
Fuente: INEGI. Datos básicos <strong>de</strong> Geografía <strong>de</strong> México 1991<br />
10 a 22 300 a 1000<br />
26
II. <strong>Uso</strong> <strong><strong>de</strong>l</strong> Su<strong>el</strong>o<br />
<strong>Potenciales</strong> y <strong>Viabilidad</strong> <strong><strong>de</strong>l</strong> <strong>Uso</strong> <strong>de</strong> <strong>Bioetanol</strong> y <strong>Biodies<strong>el</strong></strong> <strong>para</strong> <strong>el</strong> Transporte en México (SENER-BID-GTZ)<br />
Task 3: Overview of agricultural aspects<br />
Superficie por principal uso <strong><strong>de</strong>l</strong> su<strong>el</strong>o y tipo <strong>de</strong> vegetación, 2002<br />
Superficie<br />
(Kilómetros<br />
Porcentaje<br />
<strong>Uso</strong> <strong><strong>de</strong>l</strong> su<strong>el</strong>o y tipo <strong>de</strong> vegetación<br />
cuadrados)<br />
Total a/ 1,934,194 100<br />
Arbolado 690,185 35.7<br />
Bosque 258,449 13.4<br />
Bosque perturbado 88,175 4.6<br />
S<strong>el</strong>vas 131,144 6.8<br />
S<strong>el</strong>vas perturbadas 212,417 11<br />
Vegetación <strong>de</strong> zonas áridas 576,344 29.8<br />
Matorral, huizachal y mezquital 525,074 27.2<br />
Matorral, huizachal y mezquital con vegetación se 51,269 2.7<br />
Pastizales 277,858 14.4<br />
Naturales 102,167 5.3<br />
Cultivados e inducidos 175,691 9.1<br />
Agricultura 302,016 15.6<br />
Riego 88,578 4.6<br />
Temporal y cultivos forestales 213,438 11<br />
Otros tipo <strong>de</strong> vegetación b/ 76,589 4<br />
Asentamientos humanos 11,201 0.6<br />
Nota: Los totales correspon<strong>de</strong>n a las clases principales y pudieran no coincidir con<br />
las sumas <strong>de</strong>bido al redon<strong>de</strong>o <strong>de</strong> las cifras<br />
a/ Con base en la superficie total nacional, sin consi<strong>de</strong>rar cuerpos <strong>de</strong> agua.<br />
b/ Incluye: Áreas sin vegetación aparente, bosque <strong>de</strong> galería, manglar, palmar, veget<br />
acuática, vegetación <strong>de</strong> <strong>de</strong>sieros arenosos, vegetacion <strong>de</strong> dunas costeras, veg <strong>de</strong><br />
galería, vegetación <strong>de</strong> gipsófila y halófila<br />
SEMARNAT. Compendio <strong>de</strong> Estadísticas Ambientales, 2002. México, D.F., 2003.<br />
27
<strong>Potenciales</strong> y <strong>Viabilidad</strong> <strong><strong>de</strong>l</strong> <strong>Uso</strong> <strong>de</strong> <strong>Bioetanol</strong> y <strong>Biodies<strong>el</strong></strong> <strong>para</strong> <strong>el</strong> Transporte en México (SENER-BID-GTZ)<br />
Task 3: Overview of agricultural aspects<br />
III. Principales usos <strong><strong>de</strong>l</strong> su<strong>el</strong>o y tipos <strong>de</strong> vegetación por entidad fe<strong>de</strong>rativa (2002)<br />
(Kilómetros cuadrados)<br />
Entidad fe<strong>de</strong>rative Total Bosques S<strong>el</strong>vas Matorral Pastizal<br />
Otros<br />
tipos <strong>de</strong><br />
vegetación<br />
Cultivos<br />
Asentamientos<br />
humanos<br />
Estados Unidos<br />
Mexicanos 1,934,194 346,624 343,561 576,344 277,858 76,589 302,016 11,201<br />
Aguascalientes 5,590 1,005 349 396 1,400 0 2,336 103<br />
Baja California 71,098 1,744 0 57,125 749 3,772 7,220 488<br />
Baja California Sur 71,234 520 3,909 56,203 114 7,677 2,695 117<br />
Campeche 55,539 0 42,853 0 6,246 4,244 2,062 134<br />
Coahuila <strong>de</strong> Zaragoza 151,062 5,148 0 118,726 8,623 9,840 8,319 408<br />
Colima 5,545 530 2,382 0 511 194 1,847 82<br />
Chiapas 72,177 18,726 23,121 29 16,160 1,245 12,643 253<br />
Chihuahua 246,686 71,773 5,253 88,598 45,761 17,061 17,589 651<br />
Distrito Fe<strong>de</strong>ral 1,480 383 0 7 109 16 375 590<br />
Durango 123,020 53,218 5,489 29,476 19,443 2,945 12,214 235<br />
Guanajuato 30,338 4,577 2,425 2,475 5,890 31 14,597 344<br />
Guerrero 63,129 22,665 22,569 0 7,922 568 9,211 195<br />
Hidalgo 20,749 5,024 1,226 2,815 2,579 9 8,941 153<br />
Jalisco 77,138 24,430 19,650 174 13,458 327 18,372 728<br />
México 22,144 6,307 1,095 184 3,620 142 10,004 792<br />
Michoacán <strong>de</strong> Ocampo 57,862 16,485 18,623 32 5,765 203 16,253 502<br />
Mor<strong>el</strong>os 4,878 500 1,202 2 408 0 2,603 161<br />
Nayarit 27,380 9,166 8,153 0 3,584 1,507 4,819 151<br />
Nuevo León 64,069 5,713 0 37,427 10,851 1,651 7,803 624<br />
Oaxaca 91,759 34,745 29,176 491 12,068 879 14,066 336<br />
Puebla 49,998 7,944 8,052 2,863 7,458 586 22,375 720<br />
Querétaro Arteaga 11,613 2,771 1,420 2,724 976 0 3,589 133<br />
Quintana Roo 42,545 0 36,224 0 1,060 4,225 913 122<br />
San Luis Potosí 60,995 4,594 3,985 31,436 7,598 1,308 11,726 346<br />
Sinaloa 54,727 8,929 21,095 1,785 869 2,693 18,913 443<br />
Sonora 178,375 20,422 33,399 90,121 16,527 3,953 13,435 518<br />
Tabasco 23,720 61 2,151 0 13,627 5,104 2,655 123<br />
Tamaulipas 76,574 5,990 7,190 24,639 16,070 2,529 19,505 651<br />
Tlaxcala 3,976 673 0 89 322 5 2,850 38<br />
Veracruz <strong>de</strong> Ignacio<br />
<strong>de</strong> la Llave 54,059 1,623 9,728 137 27,967 1,787 12,388 430<br />
Yucatán 39,435 0 29,042 0 6,289 1,148 2,583 373<br />
Zacatecas 75,300 10,958 3,800 28,391 13,835 940 17,115 260<br />
Nota Cultivos <strong>de</strong> riego, <strong>de</strong> temporal y cultivos forestales. Bosques: incluye bosque perturbado. S<strong>el</strong>vas:incluye<br />
s<strong>el</strong>va y s<strong>el</strong>va perturbada; Matorrales incluye matorral, huizachal, mezquital y mezquital con vegetación<br />
secundaria. Pastizales incluye naturales y cultivados o inducidos. Otros tipos <strong>de</strong> vegetación incluye áreas sin<br />
vegetación aparente, bosque <strong>de</strong> galeria, manglar, palmar, vegetación acuática, <strong>de</strong> <strong>de</strong>siertos arenosos, <strong>de</strong> dunas<br />
costeras, <strong>de</strong> galaria, gipsófila y halófila. No se incluyen los cuerpos <strong>de</strong> agua.<br />
FUENTE: SEMARNAT. Compendio <strong>de</strong> Estadísticas Ambientales. 2002. México, D.F. 2003.<br />
28
<strong>Potenciales</strong> y <strong>Viabilidad</strong> <strong><strong>de</strong>l</strong> <strong>Uso</strong> <strong>de</strong> <strong>Bioetanol</strong> y <strong>Biodies<strong>el</strong></strong> <strong>para</strong> <strong>el</strong> Transporte en México (SENER-BID-GTZ)<br />
Task 3: Overview of agricultural aspects<br />
IV. Número y superficie <strong>de</strong> las propieda<strong>de</strong>s sociales según parc<strong>el</strong>amiento y distribución<br />
<strong>de</strong> la tierra no parc<strong>el</strong>ada<br />
(hectáreas)<br />
Entidad<br />
fe<strong>de</strong>rativa<br />
Prpieda<strong>de</strong>s<br />
sociales<br />
número<br />
superficie<br />
total<br />
superficie<br />
parc<strong>el</strong>ada<br />
supeficie<br />
total<br />
Parc<strong>el</strong>amiento<br />
uso comun<br />
y<br />
distribución<br />
<strong>de</strong> superficie<br />
asentamiento<br />
humano<br />
No<br />
parc<strong>el</strong>ada<br />
reserva <strong>de</strong><br />
crecimiento<br />
Otras<br />
superficies<br />
Estados Unidos<br />
Mexicanos 30305 105052369.6 34436973.21 70329036.69 69076861.67 1111542.29 140632.73 286359.67<br />
Aguascalientes 186 275586.49 116775 152418.43 142749.27 7594.84 2074.32 6393.06<br />
Baja California 233 5948592.28 1512248.47 4436142.81 4411567.52 22994.16 1581.14 201.01<br />
Baja California<br />
Sur 96 4895535.9 241459.51 4653231.75 4641392.31 8008.58 3830.87 844.63<br />
Campeche 385 3360188.92 854455.83 2500144.09 2469805.66 24376.54 5961.89 5589<br />
Coahuila <strong>de</strong><br />
Zaragoza 877 6816690.96 1602197.79 5199173.46 5158603.66 34836.59 5733.21 15319.71<br />
Colima 161 336146.1 250942.47 82912.35 79459.33 3245.23 207.8 2291.28<br />
Chiapas 2057 3611312.24 2607717.52 1001037.99 942998.23 52954.69 5085.06 2556.72<br />
Chihuahua 983 10369763.65 890433.48 9474231.05 9412809.07 55161.93 6260.05 5099.12<br />
Distrito Fe<strong>de</strong>ral 38 58236.79 7861.5 50375.29 47813.79 2547.5 14 0<br />
Durango 1114 8651178.7 929697.78 7711589.06 7668869.67 38040.62 4678.77 9891.86<br />
Guanajuato 1504 1325132.13 700787.09 611114.89 573773.79 35203.9 2137.2 13230.15<br />
Guerrero 1236 5079379.42 2789179.17 2271234.94 2200651.74 67186.98 3396.23 18965.3<br />
Hidalgo 1189 1104276.86 539287.35 555878.33 513028.23 37932.76 4917.34 9111.18<br />
Jalisco 1408 3322959.77 1777654.17 1532279.28 1502790.48 27920.98 1567.81 13026.32<br />
México 1233 1271792.44 713123.74 546643.53 476900.3 62772.01 6971.23 12025.16<br />
Michoacán <strong>de</strong><br />
Ocampo 1812 2910599.12 1612737.92 1290809.79 1243140.23 43868.33 3801.23 7051.41<br />
Mor<strong>el</strong>os 233 395570.12 184318.55 203855.92 177081.39 25205.24 1569.29 7395.66<br />
Nayarit 403 2279803.78 879499.81 1395013.58 1375026.72 18590.52 1396.34 5290.39<br />
Nuevo León 608 2115221.1 535204.81 1580005.92 1547895.23 25808.11 6302.58 10.37<br />
Oaxaca 1600 8112308.66 2990235.54 5110927.81 5004549.2 98518.19 7860.43 11145.31<br />
Puebla 1166 1613820.02 754750.7 840568.51 801746.49 36045.2 2776.82 18500.81<br />
Querétaro<br />
Arteaga 370 582240.74 187549.63 394542.49 378256.83 14982.2 1303.46 148.63<br />
Quintana Roo 278 2919219.55 506790.66 2411447.54 2373618.4 19777.17 18051.97 981.35<br />
San Luis Potosí 1347 4155800.51 1243675.63 2898185.59 2808520.33 78598 11067.26 13939.28<br />
Sinaloa 1288 3955759.21 1807170.44 2130537.95 2087262.53 41435.47 1839.96 18050.82<br />
Sonora 986 6527174.08 1492209.98 5029672.08 4993866.57 27988.45 7817.06 5292.02<br />
Tabasco 757 1115689.09 897736.98 202012.97 189127.86 12678.87 206.25 15939.14<br />
Tamaulipas 1390 2627268.87 1421709.34 1187300.6 1152215.54 31651.53 3433.53 18258.93<br />
Tlaxcala 242 201739.02 147381.49 46930.32 42972.12 3663.57 294.63 7427.21<br />
Veracruz <strong>de</strong><br />
Ignacio <strong>de</strong> la<br />
Llave 3624 2929834.92 2570284.89 330321.87 249318.03 78189.82 2814.02 29228.17<br />
Yucatán 728 2339154.82 531868.9 1802909.07 1768541.68 27955.24 6412.15 4376.85<br />
Zacatecas 773 3844393.34 1140027.08 2695587.43 2640509.5 45809.08 9268.85 8778.84<br />
Fuente: INEGI. Estados Unidos Mexicanos. Resumen Nacional por Entidad. VIII Censo Ejidal, 2001.<br />
29
<strong>Potenciales</strong> y <strong>Viabilidad</strong> <strong><strong>de</strong>l</strong> <strong>Uso</strong> <strong>de</strong> <strong>Bioetanol</strong> y <strong>Biodies<strong>el</strong></strong> <strong>para</strong> <strong>el</strong> Transporte en México (SENER-BID-GTZ)<br />
Task 3: Overview of agricultural aspects<br />
V. Fertilizantes<br />
Fertilizantes nitrogenados, año 2003, cifras en ton<strong>el</strong>adas <strong>de</strong> amoniaco equivalente.<br />
PRODUCTO<br />
(A)<br />
1.Amoniaco<br />
2. Amoniaco<br />
aplicación<br />
directa<br />
3. Urea<br />
4.-Nitrato <strong>de</strong><br />
amonio**<br />
5. Sulfato <strong>de</strong><br />
amonio<br />
6. Fosfato <strong>de</strong><br />
amonio<br />
7. Nitrofosfatos<br />
abono NPK<br />
Total Solidos<br />
(3 a 7)<br />
Suma (incluye<br />
NH3 aplic<br />
directa)<br />
CONSUMO<br />
NACIONAL<br />
(B)<br />
CAPACIDAD<br />
INSTALADA<br />
(C)<br />
PRODUCCION<br />
NACIONAL<br />
(D)<br />
IMPORTA<br />
CIONES<br />
(E)<br />
1’914,000 524,519 35,163 *<br />
SUMA DE<br />
LA<br />
OFERTA<br />
(F)<br />
CONSUMO<br />
NACIONAL<br />
1996<br />
(G)<br />
192,256 192,256 192,256 192,256 326,189<br />
DIFERENCIA<br />
(H=B-G)<br />
(133,933)<br />
740,004 974,639 0 740,004 740,004 819,024 ( 79,020)<br />
56,915 311879 0 56,915 56,915 142,882 ( 85,967)<br />
291,961 489,144 278,888 13,073 291,961 424,338 (132,377)<br />
120,257<br />
173,438 0<br />
120,257 120,257<br />
109,756 10,501<br />
32,793 38,130 0 32,793 32,793 En fosfatos 32,793<br />
1’241,930 1’985,231 278,868 963,042 1’241,930 1’496,000 (254,070)<br />
1’434,186 2’177,487 471,144 1’434,186 1’822,189 (388,003)<br />
Reducción <strong><strong>de</strong>l</strong> consumo nacional 2003 vs 1996 = -21.3%; 2003- 2002 = -3.0%<br />
*2003 ya sumada en “D”<br />
** No suma producto <strong>para</strong> explosivos<br />
Fuentes: Dirección Aduana SHCP; PEMEX; Sagarpa; IMF<br />
30
<strong>Potenciales</strong> y <strong>Viabilidad</strong> <strong><strong>de</strong>l</strong> <strong>Uso</strong> <strong>de</strong> <strong>Bioetanol</strong> y <strong>Biodies<strong>el</strong></strong> <strong>para</strong> <strong>el</strong> Transporte en México (SENER-BID-GTZ)<br />
Task 3: Overview of agricultural aspects<br />
VI. Exportaciones e Importaciones <strong>de</strong> productos agrícolas<br />
EXPORTACIONES AGROALIMENTARIAS<br />
COMPARATIVO DE ENE – DIC 2005 VS ENE – DIC 2004<br />
VALOR<br />
(Miles <strong>de</strong> dólares)<br />
ENE - DIC 2004 ENE–DIC 2005 p VARIACION %<br />
2005/04<br />
AGROALIMENTARIA 10,387,912 11,856,046 14.1<br />
AGROALIMENTARIA Y PESCA 5,683,896 6,127,072 7.8<br />
AGROPECUARIA 5,118,828 5,556,066 8.5<br />
AGRICULTURA 4,492,072 4,966,671 10.6<br />
O7O2 Tomate fresco o refrigerado 909,387 983,018 8.1<br />
-- Otras legumbres y hortalizas fre 583,261 601,146 3.1<br />
070310 Cebolla 214,091 286,346 33.7<br />
0707 Pepino y pepinillo 343,055 280,572 -18.2<br />
070960 Pimiento 576,692 577,950 0.2<br />
0802 Almendras , nueces y pistache 140,057 110,973 -20.8<br />
080440 Aguacate 211,256 386,860 83.1<br />
0805 Cítricos frescos o secos 176,280 178,692 1.4<br />
0806 uvas frescas y secas pasas 111,913 159,630 42.6<br />
0807 m<strong>el</strong>ón,sandia papaya 285,212 286,956 0.6<br />
090111 café sin tostar 173,611 187,048 7.7<br />
Resto <strong>de</strong> productos (diferencia)<br />
GANADERIA Y APICULTURA 626,766 589,396 -6.0<br />
PESCA 565,068 571,006 1.1<br />
ALIMENTOS Y BEBIDAS 4,704,016 5,728,974 21.8<br />
p/ cifras pr<strong>el</strong>iminares<br />
Fuentes: Banco <strong>de</strong> México; INEGI<br />
31
<strong>Potenciales</strong> y <strong>Viabilidad</strong> <strong><strong>de</strong>l</strong> <strong>Uso</strong> <strong>de</strong> <strong>Bioetanol</strong> y <strong>Biodies<strong>el</strong></strong> <strong>para</strong> <strong>el</strong> Transporte en México (SENER-BID-GTZ)<br />
Task 3: Overview of agricultural aspects<br />
VI. Exportaciones e Importaciones <strong>de</strong> productos agrícolas<br />
IMPORTACIONES AGROALIMENTARIAS<br />
COMPARATIVO DE ENE – DIC 2005 VS ENE – DIC 2004<br />
VALOR<br />
(Miles <strong>de</strong> dólares)<br />
ENE - DIC 2004 ENE–DIC 2005 p VARIACION %<br />
2005/04<br />
AGROALIMENTARIA 13,602,692 14,292,520 5.8<br />
AGROALIMENTARIA Y PESCA 6,355,140 6,175,681 -2.8<br />
AGROPECUARIA 6,141,733 5,941,186 -3.3<br />
AGRICULTURA 5,426,531 5,022,482 -7.4<br />
0802 Almendras , nueces y pistache 83,030 103,280 24.4<br />
0806 uvas frescas y secas pasas 106,867 115,767 8.3<br />
0808 manzanas, peras, membrillos 204,525 227,478 11.2<br />
1001 Trigo 617,766 612,760 -0.8<br />
1005 Maíz 745,124 714,051 -4.2<br />
1006 Arroz 184,953 164,643 -11.0<br />
1007 Sorgo <strong>de</strong> grano 423,992 340,177 -19.8<br />
1201 Habas <strong>de</strong> Soya 1,107,990 949,966 -14.3<br />
1205 Semillas <strong>de</strong> nabo o colza 362,486 289,063 -20.3<br />
5201 Algodón sin cardar ni peinar 566,139 458,196 -19.1<br />
Resto <strong>de</strong> productos (diferencia)<br />
GANADERIA Y APICULTURA 715,202 918,704 28.5<br />
PESCA 213,407 234,495 9.9<br />
ALIMENTOS Y BEBIDAS 7,147,552 8,116,839 13.6<br />
p/ cifras pr<strong>el</strong>iminares<br />
Fuentes: Banco <strong>de</strong> México; INEGI<br />
32
14. Bibliografía<br />
<strong>Potenciales</strong> y <strong>Viabilidad</strong> <strong><strong>de</strong>l</strong> <strong>Uso</strong> <strong>de</strong> <strong>Bioetanol</strong> y <strong>Biodies<strong>el</strong></strong> <strong>para</strong> <strong>el</strong> Transporte en México (SENER-BID-GTZ)<br />
Task 3: Overview of agricultural aspects<br />
BBI International Consulting Division. “Feasibility Study for Ethanol Production in Mexico<br />
from Sugar Cane and Maize”. Abril 2005.<br />
Banco <strong>de</strong> Crédito Rural <strong><strong>de</strong>l</strong> Noroeste, S.A. El cultivo <strong>de</strong> la remolacha azucarera utilizada<br />
como forraje. Mayo <strong>de</strong> 1984.<br />
Banco <strong>de</strong> México.- www.banco<strong>de</strong>mexico.gob.mx<br />
Comisión Nacional <strong>de</strong> las Zonas Aridas (CONAZA). “Escenarios climatológicos <strong>de</strong> la<br />
República Mexicana ante <strong>el</strong> cambio climático” 2004<br />
Comité <strong>de</strong> la Agroindustria Azucarera. “Desarrollo Operativo Campo-fábrica. Zafra 2003-04”.<br />
Cuadri <strong>de</strong> la Torre, Gabri<strong>el</strong>. “Elementos <strong>para</strong> la introducción <strong>de</strong> Etanol en las gasolinas<br />
mexicanas”. Octubre 2004<br />
Ethanol Producer Magazine. Abril 2006<br />
Imperial County. “Agricultural Crop & Livestock Report” 2004.<br />
Instituto Nacional <strong>de</strong> Estadística, Geografía e Informática (INEGI) www.inegi.gob.mx<br />
Kosaric, N; Vardar-Sukan, F; Pieper, H.J. “The Biotechnology of Ethanol. 2001.<br />
Matthews, R and Mortimer, D. “Carbon and energy balances for range of biofu<strong>el</strong>s<br />
options.2003.<br />
Purdue University. Department of Agronomy. “National Corn Handbook” 1988<br />
Secretaria <strong>de</strong> Agricultura, Gana<strong>de</strong>ría, Desarrollo Rural, Pesca y Alimentación. Anuario<br />
Estadístico <strong>de</strong> la producción agrícola. Año 2004. www.sagarpa.gob.mx<br />
Secretaria <strong>de</strong> Agricultura, Gana<strong>de</strong>ría, Desarrollo Rural, Pesca y Alimentación. “El uso <strong><strong>de</strong>l</strong><br />
su<strong>el</strong>o en la República Mexicana”<br />
Servicio <strong>de</strong> Información y Estadística Agroalimentaria y pesquera.(SIAP).<br />
www.siap.sagarpa.gob.mx<br />
Unión Nacional <strong>de</strong> Cañeros. CNPR. “Estadísticas <strong>de</strong> la Agroindustria <strong>de</strong> la Caña <strong>de</strong><br />
Azúcar”.2005.<br />
University of California. “Gui<strong><strong>de</strong>l</strong>ines to production cost and practices Imperial County. Fi<strong>el</strong>d<br />
Crops 2004-2005.<br />
USDA Bas<strong>el</strong>ine. Proyecciones <strong>de</strong> largo plazo <strong><strong>de</strong>l</strong> sector agrícola 2006-2015. Marzo 2005<br />
33
3 Bioethanol in Mexico
Task 4: Ethanol feedstocks<br />
Ignacio Lazcano Martínez
<strong>Potenciales</strong> y <strong>Viabilidad</strong> <strong><strong>de</strong>l</strong> <strong>Uso</strong> <strong>de</strong> <strong>Bioetanol</strong> y <strong>Biodies<strong>el</strong></strong> <strong>para</strong> <strong>el</strong> Transporte en México (SENER-BID-GTZ)<br />
Task 4: Ethanol feedstocks<br />
1. Consi<strong>de</strong>raciones Generales<br />
Índice<br />
2. La Caña <strong>de</strong> Azúcar<br />
2.1 Composición <strong>de</strong> la Caña <strong>de</strong> Azúcar<br />
2.2 Ten<strong>de</strong>ncias <strong>de</strong> interés <strong>de</strong> la Caña <strong>de</strong> Azúcar en Mexico<br />
2.3 Censo <strong>de</strong> varieda<strong>de</strong>s<br />
2.4 Regiones cañeras en la República Mexicana<br />
2.5 Precios <strong>de</strong> la Caña <strong>de</strong> Azúcar<br />
2.6 Costos <strong>de</strong> Producción<br />
2.7 El Costo primo en la producción <strong>de</strong> <strong>Bioetanol</strong><br />
2.8 Financiamiento <strong><strong>de</strong>l</strong> cultivo<br />
2.9 Servicio <strong>de</strong> extensión agrícola, Transferencia <strong>de</strong> tecnología e Investigación <strong>de</strong><br />
tecnología en la Cañicultura <strong>de</strong> México<br />
2.10 Oportunida<strong>de</strong>s <strong>de</strong> reducción <strong>de</strong> costos en Caña <strong>para</strong> <strong>Bioetanol</strong><br />
2.11 Las plantaciones <strong>de</strong> Caña, captura <strong>de</strong> dióxido <strong>de</strong> carbono y los Bonos <strong>de</strong><br />
Carbono.<br />
3. El Maíz<br />
3.1 Composición <strong><strong>de</strong>l</strong> grano <strong>de</strong> maíz<br />
3.2 Costos <strong>de</strong> producción en Sinaloa<br />
3.3 Análisis económico (sin renta <strong>de</strong> tierra)<br />
3.4 El Costo Primo en la producción <strong>de</strong> <strong>Bioetanol</strong><br />
4. El Trigo<br />
4.1 El Trigo grano<br />
4.1.1 Composición <strong><strong>de</strong>l</strong> grano <strong>de</strong> Trigo<br />
4.1.2 Costos <strong>de</strong> Producción. Valle <strong>de</strong> Mexicali, B.C.<br />
4.1.3 Análisis económico (sin renta <strong>de</strong> tierra)<br />
4.1.4 El Costo Primo en la producción <strong>de</strong> <strong>Bioetanol</strong><br />
4.2 Paja <strong>de</strong> Trigo<br />
4.2.1 Composición <strong>de</strong> la Paja <strong>de</strong> Trigo<br />
4.2.2 Costos <strong>de</strong> producción Valle <strong>de</strong> Mexicali, B.C.<br />
4.2.3 Costo Primo en la producción <strong>de</strong> <strong>Bioetanol</strong><br />
4.2.4 Costo Primo integrado <strong>de</strong> Trigo mas Paja
<strong>Potenciales</strong> y <strong>Viabilidad</strong> <strong><strong>de</strong>l</strong> <strong>Uso</strong> <strong>de</strong> <strong>Bioetanol</strong> y <strong>Biodies<strong>el</strong></strong> <strong>para</strong> <strong>el</strong> Transporte en México (SENER-BID-GTZ)<br />
Task 4: Ethanol feedstocks<br />
5. La Remolacha Azucarera<br />
5.1 Composición <strong>de</strong> la raíz <strong>de</strong> la Remolacha<br />
5.2 Costo <strong>de</strong> producción <strong>de</strong> la Remolacha en Mexicali, B.C.<br />
5.3 Costo Primo en la producción <strong>de</strong> <strong>Bioetanol</strong><br />
6. Sorgo Grano<br />
6.1 Composición <strong><strong>de</strong>l</strong> grano <strong>de</strong> Sorgo<br />
6.2 Costos <strong>de</strong> producción en San Fernando, Tamps.<br />
6.3 Análisis económico<br />
6.4 El Costo Primo en la producción <strong>de</strong> <strong>Bioetanol</strong><br />
7. La Yuca<br />
7.1 Composición química <strong>de</strong> la Yuca<br />
7.2 Costo <strong>de</strong> producción. Estado <strong>de</strong> Tabasco.<br />
7.3 Análisis económico<br />
7.4 El Costo Primo en la producción <strong>de</strong> <strong>Bioetanol</strong><br />
8. Sorgo Dulce<br />
8.1 Composición <strong>de</strong> la planta completa<br />
8.2 Sorgo <strong>de</strong> riego en Sinaloa<br />
8.2.1. Costo <strong>de</strong> Producción<br />
8.2.2 Análisis económico (sin renta <strong>de</strong> tierra)<br />
8.2.3 Costo Primo en la producción <strong>de</strong> <strong>Bioetanol</strong><br />
8.3 Sorgo Dulce <strong>de</strong> temporal en Tamaulipas<br />
8.3.1 Costo <strong>de</strong> producción<br />
8.3.2 Análisis económico<br />
8.3.3 Costo Primo en la producción <strong>de</strong> <strong>Bioetanol</strong><br />
8.4 Resumen <strong>de</strong> Costos Primos<br />
9. Determinación <strong>de</strong> la superficie a cultivar y ton<strong>el</strong>adas <strong>de</strong> caña necesarias, <strong>para</strong> los<br />
escenarios consi<strong>de</strong>rados en <strong>el</strong> presente estudio<br />
10. Anexo<br />
11. Bibliografía
<strong>Potenciales</strong> y <strong>Viabilidad</strong> <strong><strong>de</strong>l</strong> <strong>Uso</strong> <strong>de</strong> <strong>Bioetanol</strong> y <strong>Biodies<strong>el</strong></strong> <strong>para</strong> <strong>el</strong> Transporte en México (SENER-BID-GTZ)<br />
Task 4: Ethanol feedstocks<br />
1. Consi<strong>de</strong>raciones generales<br />
“Nuestra meta es hacer competitiva esta nueva forma <strong>de</strong> producir etanol, <strong>de</strong>ntro <strong>de</strong> los<br />
próximos seis años. El etanol obtenido <strong>de</strong> la c<strong>el</strong>ulosa será comercializado <strong>de</strong>ntro <strong><strong>de</strong>l</strong> lapso<br />
mencionado. Apoyaremos más investigación en otros métodos <strong>para</strong> producir etanol, no<br />
precisamente <strong><strong>de</strong>l</strong> maíz sino también <strong>de</strong> ma<strong>de</strong>ra, tallos <strong>de</strong> gramíneas, esquilmos agrícolas y así<br />
tendremos la posibilidad, <strong>el</strong> potencial, <strong>para</strong> sustituir más <strong><strong>de</strong>l</strong> 30% <strong>de</strong> las actuales<br />
importaciones <strong>de</strong> los combustibles que ahora realizamos <strong>para</strong> la nación”.<br />
Así se expresó, <strong>el</strong> Presi<strong>de</strong>nte George Bush, al informar a su pueblo sobre <strong>el</strong> estado <strong>de</strong> la<br />
nación, <strong>el</strong> pasado 31 <strong>de</strong> enero.<br />
La nación <strong>de</strong> la Unión Americana, atendió <strong>el</strong> reto y programó la producción <strong>de</strong> <strong>Bioetanol</strong><br />
combustible según las siguientes metas:<br />
Año<br />
Producción<br />
Millones <strong>de</strong> litros<br />
2006 15,140<br />
2007 17,790<br />
2008 20,439<br />
2009 23,089<br />
2010 25,738<br />
2011 28,009<br />
2012 28,388<br />
2013 28,388, incluyendo 946 millones <strong>de</strong> litros, <strong>de</strong> c<strong>el</strong>ulosa<br />
Fuente: Asociación <strong>de</strong> Combustibles Renovables <strong>de</strong> los EUA.<br />
En México, se cultivan <strong>de</strong>s<strong>de</strong> siempre, hace siglos, hace décadas, <strong>el</strong> maíz, la caña <strong>de</strong> azúcar, <strong>el</strong><br />
trigo, la yuca, la remolacha y <strong>el</strong> sorgo. No se tiene experiencia con la remolacha tropical.<br />
De las especies mencionadas, se cultivan: millones; cientos <strong>de</strong> miles; miles <strong>de</strong> hectáreas cada<br />
año con tecnología <strong>de</strong> “Temporal” y <strong>de</strong> riego, mayoritariamente la primera en una r<strong>el</strong>ación <strong>de</strong><br />
superficie <strong>de</strong> cuatro a uno.<br />
De las especies agrícolas citadas, <strong>de</strong>s<strong>de</strong> hace décadas somos importadores <strong>de</strong> millones <strong>de</strong><br />
ton<strong>el</strong>adas <strong>de</strong> maíz, trigo y sorgo cada año. Por <strong>el</strong> contrario, <strong>de</strong> azúcar <strong>de</strong> caña, somos<br />
exportadores.<br />
En <strong>el</strong> grupo <strong>de</strong> trabajo (SENER-BID-GTZ-Consultores) se <strong>de</strong>cidió que <strong>de</strong>bieran estudiarse en<br />
este esfuerzo, las posibilida<strong>de</strong>s y conveniencias <strong>de</strong> los siguientes cultivos como materias<br />
primas <strong>para</strong> la fabricación <strong>de</strong> <strong>Bioetanol</strong> combustible:<br />
Caña <strong>de</strong> azúcar<br />
Maíz grano<br />
Trigo grano y paja<br />
1
<strong>Potenciales</strong> y <strong>Viabilidad</strong> <strong><strong>de</strong>l</strong> <strong>Uso</strong> <strong>de</strong> <strong>Bioetanol</strong> y <strong>Biodies<strong>el</strong></strong> <strong>para</strong> <strong>el</strong> Transporte en México (SENER-BID-GTZ)<br />
Task 4: Ethanol feedstocks<br />
Sorgo grano<br />
Remolacha azucarera<br />
Yuca<br />
Sorgo dulce<br />
En las regiones:<br />
Caña <strong>de</strong> azúcar: Bajo Papaloapan, Huastecas, Balsas.<br />
Maíz grano: Mar <strong>de</strong> Cortés<br />
Trigo grano y paja: Mar <strong>de</strong> Cortés<br />
Sorgo grano: Golfo Norte<br />
Remolacha azucarera: Mar <strong>de</strong> Cortés<br />
Remolacha tropical: Bajo Papaloapan y Peninsular<br />
Yuca: Bajo Papaloapan y Peninsular.<br />
Tecnologías en <strong>el</strong> uso <strong><strong>de</strong>l</strong> agua:<br />
Caña <strong>de</strong> azúcar: Temporal y Riego<br />
Maíz: Riego<br />
Trigo: Riego<br />
Sorgo: Temporal<br />
Remolacha azucarera: Riego<br />
Remolacha tropical: temporal<br />
Yuca: Temporal<br />
En la toma <strong>de</strong> <strong>de</strong>cisiones sobre los cultivos a estudiar, se tomó en cuenta <strong>el</strong> hecho <strong>de</strong> que<br />
México es un gran importador <strong>de</strong> los granos aquí consi<strong>de</strong>rados:<br />
De maíz se importaron 6 millones <strong>de</strong> ton<strong>el</strong>adas en <strong>el</strong> año agrícola 2004-2005 y <strong>el</strong><br />
Departamento <strong>de</strong> Agricultura <strong>de</strong> los Estados Unidos <strong>de</strong> América proyecta 13 millones <strong>de</strong><br />
ton<strong>el</strong>adas <strong>de</strong> importación <strong>para</strong> México en <strong>el</strong> año 2015-2016.<br />
Para <strong>el</strong> caso <strong><strong>de</strong>l</strong> trigo, se importaron 3.7 millones <strong>de</strong> ton<strong>el</strong>adas en <strong>el</strong> año base y se proyectan 5<br />
millones <strong>para</strong> <strong>el</strong> 2015-2016.<br />
Para <strong>el</strong> sorgo se importaron 2.9 millones <strong>de</strong> ton<strong>el</strong>adas en <strong>el</strong> año base y se proyectan 3.3<br />
millones <strong>para</strong> <strong>el</strong> 2015-2016.<br />
Sin embargo, sí se presentan en nuestra agricultura condiciones específicas <strong>de</strong> naturaleza<br />
técnica, económica, social y ecológica que podrían hacer viable, razonable y conveniente<br />
utilizar estos cultivos como materias primas en la producción <strong>de</strong> bioetanol y usar tierras <strong>de</strong><br />
riego <strong>para</strong> <strong>el</strong> propósito, que normalmente se <strong>de</strong>ben <strong>de</strong>dicar a la producción <strong>de</strong> alimentos <strong>para</strong><br />
la población.<br />
Estas condiciones específicas se podrían <strong>de</strong>rivar <strong>de</strong> razones como: “asociación <strong>de</strong> cultivos”;<br />
fuentes <strong>de</strong> energía gratuita; recuperación <strong>de</strong> su<strong>el</strong>os; aprovechamiento <strong>de</strong> agua sin valor;<br />
aprovechamiento <strong>de</strong> su<strong>el</strong>os marginales y logística.<br />
2
<strong>Potenciales</strong> y <strong>Viabilidad</strong> <strong><strong>de</strong>l</strong> <strong>Uso</strong> <strong>de</strong> <strong>Bioetanol</strong> y <strong>Biodies<strong>el</strong></strong> <strong>para</strong> <strong>el</strong> Transporte en México (SENER-BID-GTZ)<br />
Task 4: Ethanol feedstocks<br />
2. La caña <strong>de</strong> azúcar (Saccharum officinarum L.)<br />
La caña <strong>de</strong> azúcar fue establecida en México en <strong>el</strong> año <strong>de</strong> 1522, la primera plantación se<br />
<strong>de</strong>sarrollo en <strong>el</strong> Estado <strong>de</strong> Veracruz. Incluida en la familia <strong>de</strong> las gramíneas con gran número<br />
<strong>de</strong> varieda<strong>de</strong>s que se <strong>de</strong>nominan también “cañas nobles” y que ya no se cultivan<br />
comercialmente pero por supuesto se conservan en centros <strong>de</strong> hibridación <strong>para</strong> los trabajos <strong>de</strong><br />
cruzamiento.<br />
Alre<strong>de</strong>dor <strong>de</strong> 1920, cruzas <strong>de</strong> S.Officinarum con S. Spontanium <strong>para</strong> obtener resistencia a la<br />
<strong>de</strong>structiva enfermedad <strong><strong>de</strong>l</strong> mosaico, consiguieron los famosos híbridos POJ que muy pronto<br />
se incorporaron a la producción mundial <strong>de</strong> azúcar y dieron origen al mo<strong>de</strong>rno mejoramiento<br />
<strong>de</strong> la caña.<br />
2.1 Composición <strong>de</strong> la caña <strong>de</strong> azúcar<br />
Componentes Tallos % Cogollos y hojas %<br />
Materia seca 29.00 26.00<br />
Azúcares 15.43 2.18<br />
Lignoc<strong>el</strong>ulosa 12.21 19.80<br />
Materia a <strong>Bioetanol</strong> 27.64 21.98<br />
Cenizas y otros comp. 1.36 4.02<br />
Agua 71.00 74.00<br />
Total: 100.00 100.00<br />
Fuente: GEPLACEA.<br />
Un rendimiento <strong>de</strong> 75 ton<strong>el</strong>adas <strong>de</strong> tallos <strong>de</strong> caña por hectárea, que fue <strong>el</strong> rendimiento medio<br />
nacional en la zafra <strong>de</strong> 2005, caña neta, conlleva aproximadamente 25 ton<strong>el</strong>adas <strong>de</strong> cogollos y<br />
hojas, o sea, la cosecha <strong>de</strong> caña integral <strong>de</strong> 100 ton<strong>el</strong>adas por hectárea, entendida como caña<br />
ver<strong>de</strong> o cruda, no quemada.<br />
Composición química <strong><strong>de</strong>l</strong> bagazo <strong>de</strong> caña<br />
Análisis Bagazo entero seco %<br />
C<strong>el</strong>ulosa 51.23<br />
Hemic<strong>el</strong>ulosa 24.11<br />
Lignina 20.67<br />
Cenizas y otros compuestos 3.99<br />
Suma: 100.00<br />
Fuente: Instituto Cubano <strong>de</strong> Investigaciones <strong>de</strong> los <strong>de</strong>rivados <strong>de</strong> la caña <strong>de</strong> azúcar<br />
3
<strong>Potenciales</strong> y <strong>Viabilidad</strong> <strong><strong>de</strong>l</strong> <strong>Uso</strong> <strong>de</strong> <strong>Bioetanol</strong> y <strong>Biodies<strong>el</strong></strong> <strong>para</strong> <strong>el</strong> Transporte en México (SENER-BID-GTZ)<br />
Task 4: Ethanol feedstocks<br />
2.2 Ten<strong>de</strong>ncias <strong>de</strong> interés sobre la caña <strong>de</strong> azúcar en México<br />
• Incremento <strong>de</strong> la producción <strong>de</strong> tallos por ha 1996-2005 11.23%<br />
• Incremento <strong>de</strong> la producción <strong>de</strong> azúcar por ha 16.29<br />
• Incremento <strong>de</strong> sacarosa en caña 0.21<br />
• Disminución <strong>de</strong> la fibra en caña - 4.00<br />
• Incremento <strong>de</strong> la superficie en cultivo 13.86<br />
• Incremento <strong>de</strong> la superficie industrializada 13.00<br />
• Incremento <strong>de</strong> la caña molida bruta 26.64<br />
• Incremento <strong>de</strong> la producción <strong>de</strong> azúcar 32.00<br />
• Incremento <strong><strong>de</strong>l</strong> rendimiento <strong>de</strong> fábrica 4.59<br />
Fuente: Comité <strong>de</strong> la Agroindustria Azucarera<br />
2.3 Censo <strong>de</strong> Varieda<strong>de</strong>s en México<br />
El censo <strong>de</strong> varieda<strong>de</strong>s <strong>de</strong> caña <strong>de</strong> azúcar en México, se encuentra en <strong>el</strong> (anexo I.1). Justo es<br />
<strong>de</strong>stacar que aproximadamente la mitad <strong>de</strong> la superficie cultivada con caña en la nación, esta<br />
plantada con varieda<strong>de</strong>s mexicanas, sobre todo: Mex 69-290 y Mex 68-P23. De las varieda<strong>de</strong>s<br />
extranjeras <strong>de</strong>staca la CP 72-2086 con <strong>el</strong> 17% <strong>de</strong> la superficie aproximadamente.<br />
2.4 Regiones Cañeras <strong>de</strong> la República Mexicana<br />
El Prof. Alfonso Contreras Arias, clasificó la superficie cultivada en XIV regiones cañeras<br />
(anexo I.2) <strong>de</strong>ntro <strong>de</strong> las cuales operan ahora, 58 ingenios azucareros en 15 estados <strong>de</strong> la<br />
república.<br />
Con excepción <strong>de</strong> los tres ingenios <strong>de</strong> Sinaloa, enmarcados entre latitu<strong>de</strong>s 26º y 24º norte,<br />
todos los <strong>de</strong>más se encuentran al sur <strong><strong>de</strong>l</strong> trópico <strong>de</strong> Cáncer, entre las latitu<strong>de</strong>s 23º y 14.5º N y<br />
altura sobre <strong>el</strong> niv<strong>el</strong> <strong>de</strong> mar que va <strong>de</strong>s<strong>de</strong> solo siete metros como es <strong>el</strong> caso <strong>de</strong> los ingenios <strong><strong>de</strong>l</strong><br />
Dorado, Huixtla, La Gloria, El Mo<strong><strong>de</strong>l</strong>o, hasta los 1,350 como es <strong>el</strong> caso <strong>de</strong> B<strong>el</strong>lavista y Sta<br />
Clara.<br />
La superficie cultivada en <strong>el</strong> país supera las 750 mil hectáreas <strong>de</strong> las cuales en la zafra pasada<br />
2004-05, se industrializó la caña producida en 657 mil hectáreas. La diferencia <strong>de</strong> superficie<br />
significa aqu<strong>el</strong>la <strong>de</strong> las plantaciones <strong><strong>de</strong>l</strong> 2004 que se encuentran en crecimiento.<br />
Los ciclos <strong><strong>de</strong>l</strong> cultivo <strong>de</strong> la caña se i<strong>de</strong>ntifican como “Plantillas” <strong>para</strong> aquéllas <strong>de</strong> primer corte<br />
con eda<strong>de</strong>s <strong>de</strong> 14 a 18 meses, según varieda<strong>de</strong>s tempranas o tardías; “Socas” que son las cañas<br />
<strong>para</strong> <strong>el</strong> segundo corte y “Resocas” cañas <strong><strong>de</strong>l</strong> tercer corte hasta <strong>el</strong> final <strong>de</strong> la vida útil <strong><strong>de</strong>l</strong><br />
cultivo, que en México en su mayor superficie alcanza siete cortes en ocho años, sin perjuicio<br />
<strong>de</strong> que es posible encontrar cañas <strong>de</strong> 20 y hasta 30 años <strong>de</strong> plantadas. Naturalmente los<br />
cañales disminuyen su producción en función <strong><strong>de</strong>l</strong> tiempo transcurrido y por <strong>el</strong>lo, ocurren los<br />
“volteos” <strong>de</strong> “cañas viejas” y las nuevas plantaciones.<br />
De la superficie cultivada, aproximadamente <strong>el</strong> 35% es <strong>de</strong> riego y <strong>el</strong> resto recibe <strong>el</strong> agua <strong>de</strong> la<br />
lluvia, es <strong>de</strong>cir, es <strong>de</strong> temporal, obviamente en su totalidad <strong>de</strong>ntro <strong>de</strong> las zonas tropicales.<br />
4
<strong>Potenciales</strong> y <strong>Viabilidad</strong> <strong><strong>de</strong>l</strong> <strong>Uso</strong> <strong>de</strong> <strong>Bioetanol</strong> y <strong>Biodies<strong>el</strong></strong> <strong>para</strong> <strong>el</strong> Transporte en México (SENER-BID-GTZ)<br />
Task 4: Ethanol feedstocks<br />
2.5 Precios <strong>de</strong> la Caña <strong>de</strong> azúcar<br />
Estos precios se entien<strong>de</strong>n Libre a Bordo Batey <strong><strong>de</strong>l</strong> ingenio y sobre caña neta, es <strong>de</strong>cir, ya<br />
habiéndose <strong>de</strong>ducido <strong>el</strong> castigo por materia extraña y calidad <strong>de</strong> la caña si los hay. Es<br />
oportuno mencionar que <strong>el</strong> precio que recibe <strong>el</strong> agricultor por ton<strong>el</strong>ada <strong>de</strong> caña es único, no<br />
diferenciado con otros cañeros y correspon<strong>de</strong> al 57% <strong><strong>de</strong>l</strong> valor <strong><strong>de</strong>l</strong> azúcar vendido por <strong>el</strong><br />
ingenio, calidad estándar LAB ingenio.<br />
Es importante mencionar que estos precios <strong>de</strong> la caña obe<strong>de</strong>cen a los <strong>de</strong>cretos y a la Ley <strong>de</strong><br />
Desarrollo Sustentable <strong>de</strong> la Caña <strong>de</strong> Azúcar y que solamente se pue<strong>de</strong>n aplicar <strong>para</strong> la caña<br />
que se transformará en azúcar. Los algoritmos <strong>para</strong> <strong>de</strong>terminar los precios y calida<strong>de</strong>s <strong>de</strong> esta<br />
materia prima, no se pue<strong>de</strong>n ni se <strong>de</strong>ben aplicar en la misma forma cuando se trata <strong>de</strong> cañas<br />
<strong>para</strong> la producción <strong>de</strong> <strong>Bioetanol</strong>.<br />
En tal virtud, las r<strong>el</strong>aciones <strong>de</strong> los proveedores <strong>de</strong> caña con los fabricantes <strong>de</strong> <strong>Bioetanol</strong>,<br />
<strong>de</strong>berán establecer sus propias reglas y métodos <strong>de</strong> cálculo.<br />
A continuación se presenta la evolución <strong>de</strong> los precios al agricultor, por ton<strong>el</strong>ada <strong>de</strong> caña <strong>para</strong><br />
azúcar en <strong>el</strong> lapso 1996-2005.<br />
Precio a<br />
Precio a<br />
Año Pesos corrientes** Pesos constantes 1996<br />
1996 171.98 171.98<br />
1997 216.68 181.03<br />
1998 236.60 171.27<br />
1999 243.10 150.35<br />
2000 288.05 163.27<br />
2001 298.30 159.68<br />
2002 310.96 157.66<br />
2003 324.70 158.20<br />
2004 353.79 164.97<br />
2005 397.26 177.32<br />
**Fuente: Comité <strong>de</strong> la Agroindustria Azucarera.(COAAZUCAR)<br />
En una percepción superficial y por <strong>el</strong>lo obviamente <strong>de</strong>safortunada, muchas personas<br />
involucradas en análisis económicos y técnicos <strong>de</strong> la agricultura y <strong>de</strong> la agroindustria<br />
azucarera, se equivocan al afirmar que en México se paga mucho por la caña y que ésta ha<br />
subido mucho <strong>de</strong> precio en los últimos años solo al observar los precios corrientes <strong>de</strong> la<br />
ton<strong>el</strong>ada <strong>de</strong> caña. Sin embargo, <strong>el</strong> cuadro anterior nos muestra que <strong>de</strong> 1996 a 2005,<br />
<strong>de</strong>bidamente <strong>de</strong>flacionados, los precios son los mismos, prácticamente sin cambio.<br />
Esta condición <strong>de</strong> precios, nos lleva sin gran<strong>de</strong>s complicaciones a concluir que <strong>el</strong><br />
mejoramiento <strong><strong>de</strong>l</strong> negocio <strong>de</strong> los cañicultores, si acaso ha sucedido, se <strong>de</strong>be al incremento <strong>de</strong><br />
la productividad en sus tareas como cañicultores y también a la <strong>el</strong>evación <strong>de</strong> la eficiencia <strong>de</strong><br />
5
<strong>Potenciales</strong> y <strong>Viabilidad</strong> <strong><strong>de</strong>l</strong> <strong>Uso</strong> <strong>de</strong> <strong>Bioetanol</strong> y <strong>Biodies<strong>el</strong></strong> <strong>para</strong> <strong>el</strong> Transporte en México (SENER-BID-GTZ)<br />
Task 4: Ethanol feedstocks<br />
los ingenios en tanto la recuperación <strong>de</strong> azúcar. En efecto, la producción <strong>de</strong> caña en ton<strong>el</strong>adas<br />
por hectárea se ha incrementado y <strong>el</strong> recobrado <strong>de</strong> los ingenios también.<br />
La interrogante que se expresa “si acaso” es en razón <strong>de</strong> que asi como se <strong>el</strong>eva <strong>el</strong> rendimiento<br />
<strong>de</strong> caña por hectárea, también se <strong>el</strong>evan los costos <strong>de</strong> producción, cosecha y transporte, baste<br />
señalar <strong>el</strong> exagerado crecimiento <strong>de</strong> los precios <strong>de</strong> los fertilizantes y combustibles.<br />
2.6 Costos <strong>de</strong> producción (cultivo, cosecha y acarreo por ton<strong>el</strong>ada <strong>de</strong> caña; r<strong>el</strong>ación<br />
Beneficio-Costo y rendimiento por peso invertido, Zafra 2004-05)<br />
La información <strong>de</strong> labores realizadas, insumos y servicios se obtuvo <strong>de</strong> los cañicultores y <strong>de</strong><br />
los técnicos <strong>de</strong> los ingenios. Se analizó “por ciclos”: plantillas, socas y resocas hasta cinco y<br />
seis. El rendimiento en ton<strong>el</strong>adas <strong>de</strong> caña entregada por hectárea, se obtuvo <strong><strong>de</strong>l</strong> productor y <strong><strong>de</strong>l</strong><br />
ingenio, así como <strong>el</strong> precio pagado por ton<strong>el</strong>ada <strong>de</strong> caña.<br />
a) Los resultados promedio son los siguientes:<br />
Caña <strong>de</strong> temporal. Regiones Huastecas y Veracruz Centro:<br />
Costo <strong>de</strong> producción (cultivo) por ton <strong>de</strong> caña $103.47*<br />
Costo <strong>de</strong> cosecha y acarreo 133.00<br />
Costo total por ton<strong>el</strong>ada <strong>de</strong> caña LAB Batey <strong><strong>de</strong>l</strong> ingenio 236.47<br />
Precio al agricultor por ton<strong>el</strong>ada <strong>de</strong> caña 392.00<br />
Rendimiento <strong>de</strong> la caña ton/ha 61<br />
R<strong>el</strong>ación Beneficio-Costo 1.66<br />
Rendimiento por peso invertido $3.79**<br />
b) Los resultados promedio son los siguientes en caña <strong>de</strong> riego, regiones Huatecas y Balsas:<br />
Costo <strong>de</strong> producción (cultivo) por ton <strong>de</strong> caña $ 92.39*<br />
Costo <strong>de</strong> cosecha y acarreo 118.35<br />
Costo total por ton<strong>el</strong>ada <strong>de</strong> caña LAB Batey <strong><strong>de</strong>l</strong> ingenio 210.74<br />
Precio al agricultor por ton<strong>el</strong>ada <strong>de</strong> caña 425.25<br />
Rendimiento <strong>de</strong> la caña ton/ha 111.50<br />
R<strong>el</strong>ación Beneficio-Costo 2.018<br />
Rendimiento por peso invertido $ 4.60**<br />
* El costo <strong>de</strong> producción no consi<strong>de</strong>ra renta <strong>de</strong> tierra. Parc<strong>el</strong>a ejidal.<br />
**La inversión no es igual al costo <strong>de</strong> cultivo ya que <strong>el</strong> importe <strong><strong>de</strong>l</strong> corte, alce,<br />
administración <strong>de</strong> cosecha y acarreo, en términos <strong>de</strong> flujo lo aporta <strong>el</strong> ingenio, en<br />
virtud <strong>de</strong> su sistema contable que dura “<strong>de</strong> un día <strong>para</strong> otro”. Hoy se recibe la caña y<br />
mañana esta <strong>el</strong> azúcar en <strong>el</strong> almacén”.<br />
6<br />
Fuente: Cañicultores y técnicos en las zonas productoras.
<strong>Potenciales</strong> y <strong>Viabilidad</strong> <strong><strong>de</strong>l</strong> <strong>Uso</strong> <strong>de</strong> <strong>Bioetanol</strong> y <strong>Biodies<strong>el</strong></strong> <strong>para</strong> <strong>el</strong> Transporte en México (SENER-BID-GTZ)<br />
Task 4: Ethanol feedstocks<br />
2.7 El costo primo <strong>de</strong> la caña <strong>de</strong> azúcar en la producción <strong>de</strong> <strong>Bioetanol</strong><br />
Se analizan dos tecnologías en la producción <strong>de</strong> <strong>Bioetanol</strong>. (no se consi<strong>de</strong>ra la que usa m<strong>el</strong>aza<br />
<strong>de</strong> caña en virtud <strong>de</strong> que en una visión <strong>de</strong> largo plazo, sería efímera y <strong>de</strong> r<strong>el</strong>ativo poco<br />
“cuantum”) según <strong>el</strong> material y <strong>el</strong> proceso.<br />
Los rendimientos esperados en litros <strong>de</strong> <strong>Bioetanol</strong> por ton <strong>de</strong> caña, en cada una <strong>de</strong> las dos<br />
tecnologías, serían los siguientes:<br />
a) Jugo <strong>de</strong> caña (guarapo)<br />
(14.5% <strong>de</strong> azúcares fermentables en tallos)<br />
80 litros <strong>de</strong> <strong>Bioetanol</strong> por ton<strong>el</strong>ada <strong>de</strong> caña *<br />
Costo primo con caña <strong>de</strong> temporal por litro $236.47/80 litros = $ 2.96<br />
Costo primo con caña <strong>de</strong> riego por litro <strong>de</strong> <strong>Bioetanol</strong> $210.74/80 = $ 2.63<br />
*Se abonaría a los costos <strong>el</strong> valor <strong><strong>de</strong>l</strong> bagazo sobrante (no se hace azúcar la caña<br />
<strong>de</strong>stinada a <strong>Bioetanol</strong>) <strong>para</strong> cogeneración u otros productos.<br />
b) Cosechando caña integral, <strong>el</strong> esquilmo**, se<strong>para</strong>do en centro <strong>de</strong> limpieza y acopio, nos<br />
<strong>de</strong>ja caña completa (jugo más bagazo) con un rendimiento esperado <strong>de</strong> 138 litros <strong>de</strong><br />
<strong>Bioetanol</strong> por ton<strong>el</strong>ada <strong>de</strong> caña completa.<br />
Costo primo por litro <strong>de</strong> <strong>Bioetanol</strong> con caña <strong>de</strong> temporal $236.47/138 litros = $1.71<br />
Costo primo por litro <strong>de</strong> <strong>Bioetanol</strong> con caña <strong>de</strong> riego $210.74 / 138 litros = $1.53<br />
** Esquilmo como fuente <strong>de</strong> energía <strong>para</strong> <strong>el</strong> proceso, en adición a la lignina se<strong>para</strong>da<br />
<strong>de</strong> las c<strong>el</strong>ulosas <strong><strong>de</strong>l</strong> bagazo.<br />
Se tomó <strong>el</strong> costo <strong>de</strong> la caña <strong>para</strong> los ejercicios arriba explicados en <strong>el</strong> cálculo <strong><strong>de</strong>l</strong> costo primo o<br />
costo <strong>de</strong> la materia prima <strong>para</strong> producir <strong>Bioetanol</strong>, en <strong>el</strong> <strong>de</strong>seable supuesto <strong>de</strong> que las<br />
organizaciones locales <strong>de</strong> productores <strong>de</strong> caña, tal como suce<strong>de</strong> en otro países, conformando<br />
cooperativas, fueran propietarios <strong>de</strong> la planta industrial, obteniendo así sus utilida<strong>de</strong>s al través<br />
<strong><strong>de</strong>l</strong> valor agregado a la materia prima.<br />
2.8 Financiamiento <strong><strong>de</strong>l</strong> cultivo, integración, intermediación, reparto beneficios<br />
proporcional entre cultivadores y procesadores, canales <strong>de</strong> merca<strong>de</strong>o y distribución<br />
Caña <strong>de</strong> azúcar.- Tradicionalmente <strong>el</strong> financiamiento venia siendo otorgado por los ingenios<br />
azucareros, con recursos <strong>de</strong> FINASA (Financiera Nacional Azucarera). Al <strong>de</strong>saparecer ésta,<br />
los ingenios tuvieron que recurrir a la banca comercial <strong>para</strong> conseguir recursos y aviar al<br />
campo cañero tal como lo señalaba <strong>el</strong> Decreto Cañero <strong>de</strong> 1991.<br />
A partir <strong>de</strong> entonces, se han hecho múltiples esfuerzos por parte <strong>de</strong> los productores a través <strong>de</strong><br />
sus organizaciones locales <strong>para</strong> recibir crédito directamente <strong>de</strong> la banca, pero participando en<br />
7
<strong>Potenciales</strong> y <strong>Viabilidad</strong> <strong><strong>de</strong>l</strong> <strong>Uso</strong> <strong>de</strong> <strong>Bioetanol</strong> y <strong>Biodies<strong>el</strong></strong> <strong>para</strong> <strong>el</strong> Transporte en México (SENER-BID-GTZ)<br />
Task 4: Ethanol feedstocks<br />
la mayoría <strong>de</strong> los casos los ingenios, ya sean como dispersores <strong><strong>de</strong>l</strong> crédito y sobre todo como<br />
retenedores <strong>de</strong> los recursos <strong>de</strong> los cañeros <strong>para</strong> pagar <strong>el</strong> crédito recibido.<br />
Con motivo <strong>de</strong> la expropiación <strong>de</strong> 27 ingenios en <strong>el</strong> año 2001, este proceso se ac<strong>el</strong>eró al<br />
habilitar diversas figuras jurídicas, por lo general las Uniones Locales <strong>de</strong> Productores <strong>de</strong> Caña,<br />
como entida<strong>de</strong>s dispersoras <strong><strong>de</strong>l</strong> crédito que se recibió principalmente <strong>de</strong> la banca comercial.<br />
Una vez <strong>de</strong>terminada la entidad dispersora, se constituyeron Fi<strong>de</strong>icomisos <strong>de</strong> Garantía con <strong>el</strong><br />
apoyo <strong><strong>de</strong>l</strong> Gobierno Fe<strong>de</strong>ral a través <strong>de</strong> la Sagarpa- Firco, otorgando aportaciones con <strong>el</strong><br />
propósito <strong>de</strong> capitalización las cuales fueron en un principio <strong><strong>de</strong>l</strong> 5% y se incrementó al 10%<br />
con la condición <strong>de</strong> que <strong>el</strong> productor aportara un porcentaje igual, esto con base al crédito<br />
recibido en cada ciclo, <strong>para</strong> así integrar <strong>el</strong> fondo requerido por las instituciones bancarias<br />
como fi<strong>de</strong>icomiso <strong>de</strong> garantía <strong><strong>de</strong>l</strong> 30% en <strong>el</strong> caso <strong>de</strong> los bancos privados y 20% en <strong>el</strong> caso <strong>de</strong><br />
la Financiera Rural.<br />
Los recursos <strong>de</strong> la banca comercial, son fon<strong>de</strong>ados por <strong>el</strong> FIRA, en <strong>el</strong> caso <strong>de</strong> la Financiera<br />
Rural actualmente esta operando con los cañeros como banca <strong>de</strong> primer piso, haciendo llegar<br />
los recursos al campo, a través <strong>de</strong> las organizaciones locales <strong>de</strong> productores <strong>de</strong> caña <strong>de</strong> las dos<br />
Uniones Nacionales que existen actualmente (CNC y CNPR). Cabe señalar que <strong>el</strong> crédito que<br />
se recibe es solo <strong>para</strong> labores <strong>de</strong> cultivo e insumos (costo <strong>de</strong> producción), en <strong>el</strong> caso <strong>de</strong> los<br />
recursos necesarios <strong>para</strong> la cosecha siguen siendo proporcionados por los ingenios ya que<br />
éstos no se consi<strong>de</strong>ran crédito, sino anticipo a cuenta <strong>de</strong> la materia prima.<br />
En cuanto a la integración, los productores están integrados verticalmente pues cuentan con<br />
maquinaria agrícola, equipo <strong>de</strong> cosecha y transporte <strong>de</strong>ntro <strong>de</strong> las localida<strong>de</strong>s <strong>de</strong> cada ingenio<br />
y en la mayoría <strong>de</strong> los casos son propiedad <strong>de</strong> los mismos productores.<br />
No existe intermediación ya que cada productor <strong>de</strong>be contar con un contrato firmado con <strong>el</strong><br />
ingenio <strong>para</strong> entregar su producción <strong>de</strong> caña y es respetado en lo general <strong>para</strong> protección <strong><strong>de</strong>l</strong><br />
ingenio y <strong><strong>de</strong>l</strong> cañero.<br />
Los beneficios <strong><strong>de</strong>l</strong> campo son solo <strong>para</strong> <strong>el</strong> productor agrícola y en virtud <strong>de</strong> la fórmula<br />
existente <strong>para</strong> <strong>el</strong> pago <strong>de</strong> la caña, <strong>el</strong> productor recibe por Decreto <strong>el</strong> 57% <strong><strong>de</strong>l</strong> valor <strong><strong>de</strong>l</strong><br />
producto final azúcar.<br />
Los canales <strong>de</strong> merca<strong>de</strong>o y distribución <strong>de</strong> la caña son directos <strong><strong>de</strong>l</strong> productor al ingenio, no<br />
hay intermediarios, mediante la organización <strong>de</strong> la cosecha por <strong>el</strong> Comité <strong>de</strong> producción<br />
cañera que es quien hace la programación <strong>de</strong> la zafra.<br />
En cuanto al producto final azúcar, los canales <strong>de</strong> merca<strong>de</strong>o y distribución son por lo general a<br />
través <strong>de</strong> 4 o 5 gran<strong>de</strong>s empresas comercializadoras a niv<strong>el</strong> nacional asentadas en las plazas <strong>de</strong><br />
la ciudad <strong>de</strong> México (Central <strong>de</strong> abastos), Guadalajara, Puebla, Monterrey a don<strong>de</strong> ven<strong>de</strong>n <strong>el</strong><br />
azúcar los ingenios o sus corporativos, que son los que comercializan <strong>el</strong> azúcar.<br />
8
<strong>Potenciales</strong> y <strong>Viabilidad</strong> <strong><strong>de</strong>l</strong> <strong>Uso</strong> <strong>de</strong> <strong>Bioetanol</strong> y <strong>Biodies<strong>el</strong></strong> <strong>para</strong> <strong>el</strong> Transporte en México (SENER-BID-GTZ)<br />
Task 4: Ethanol feedstocks<br />
2.9 Servicios <strong>de</strong> extensión agrícola, transferencia <strong>de</strong> tecnología e investigación agrícola<br />
en la cañicultura <strong>de</strong> México<br />
En <strong>el</strong> apartado pertinente <strong>de</strong> la actividad 3., tratamos lo que ha ocurrido y la condición en que<br />
se encuentra en lo Nacional <strong>el</strong> servicio <strong>de</strong> extensión agrícola y transferencia <strong>de</strong> tecnología.<br />
Al referirnos al cultivo <strong>de</strong> la caña <strong>de</strong> azúcar en lo particular, tenemos que reconocer que<br />
prácticamente nunca han recibo <strong>el</strong> apoyo institucional <strong>de</strong> las autorida<strong>de</strong>s fe<strong>de</strong>rales a través <strong>de</strong><br />
la Secretaria <strong>de</strong> Agricultura. La atención técnica en condiciones <strong>de</strong> medianía la han recibido<br />
los cañicultores, <strong>de</strong> los agrónomos contratados por los ingenios azucareros y eventualmente <strong>de</strong><br />
los ven<strong>de</strong>dores <strong>de</strong> insumos.<br />
Como se menciono con anterioridad, se inician los esfuerzos <strong>de</strong> cañeros <strong>para</strong> establecer sus<br />
oficinas técnicas y sus mezcladoras <strong>de</strong> fertilizantes. A fuer <strong>de</strong> ser sincero, <strong>el</strong> sistema <strong>de</strong> apoyo<br />
técnico en su conjunto ha sido <strong>de</strong>scuidado.<br />
En cuanto a la investigación y experimentación agrícolas, durante algunas décadas <strong>el</strong> Instituto<br />
<strong>para</strong> <strong>el</strong> Mejoramiento <strong>de</strong> la producción azucarera IMPA, realizo un trabajo meritorio en<br />
cuestión <strong>de</strong> varieda<strong>de</strong>s, fertilización, riego, tecnología <strong>de</strong> producción. Sin embargo, hace ya<br />
cerca <strong>de</strong> 20 años que le fue retirado <strong>el</strong> apoyo y pronto <strong>de</strong>sapareció, <strong>de</strong> tal manera que ahora<br />
solo se hacen mo<strong>de</strong>stos esfuerzos en la Universidad <strong>de</strong> Veracruz y en <strong>el</strong> Colegio <strong>de</strong><br />
Postgraduados <strong>de</strong> Chapingo. Po<strong>de</strong>mos resumir que poca es la tecnología por transferir, menor<br />
aún la tecnología generada en México en los últimos años y por supuesto que no existe sistema<br />
alguno <strong>de</strong> extensión agrícola que opere en los campos cañeros mexicanos.<br />
2.10 Oportunida<strong>de</strong>s <strong>de</strong> reducción <strong>de</strong> costos en la caña <strong>para</strong> <strong>Bioetanol</strong><br />
En este sentido, es claro <strong>el</strong> imperativo <strong>de</strong> generar tecnologías específicas ya que en México y<br />
probablemente en otros países tropicales, se ha trabajado poco en esto. Por ejemplo, las<br />
épocas <strong>de</strong> corte se dan <strong>de</strong> acuerdo con los indicadores <strong>de</strong> madurez industrial <strong>de</strong> la caña, es<br />
<strong>de</strong>cir, <strong>de</strong> su acumulación <strong>de</strong> sacarosa y disminución <strong>de</strong> azucares reductores y <strong>de</strong> humedad. Sin<br />
embargo, cuando la caña se va a <strong>de</strong>stinar a producir <strong>Bioetanol</strong> procesando sus jugos, nos<br />
interesa la glucosa y la sacarosa, fermentan prácticamente igual y en tal virtud, la madurez <strong>de</strong><br />
la caña <strong>para</strong> nuestros propósitos será <strong>de</strong>terminada <strong>de</strong> manera diferente.<br />
Tomando en cuenta lo anterior, nos interesa producir mucha biomasa con su glucosa y<br />
cosecharla en menos tiempo, en lo cual tendrá una influencia <strong>de</strong>terminante, la fertilización<br />
balanceada, con acento en <strong>el</strong> nitrógeno. He aquí oportunida<strong>de</strong>s <strong>para</strong> <strong>el</strong> abatimiento <strong>de</strong> costos<br />
<strong>de</strong> caña <strong>para</strong> <strong>Bioetanol</strong>.<br />
Otra vertiente está representada por <strong>el</strong> aprovechamiento cabal <strong>de</strong> la biomasa producida, al<br />
través <strong>de</strong> la cosecha <strong>de</strong> caña integral y por supuesto sin quemar: ver<strong>de</strong> o cruda, lo cual<br />
representa obtener aproximadamente <strong>el</strong> 30% más <strong>de</strong> biomasa que cuando se cosechan solo<br />
tallos y como la obtención <strong>de</strong> <strong>Bioetanol</strong> hacia <strong>el</strong> futuro próximo se apoyará en <strong>el</strong><br />
procesamiento <strong>de</strong> c<strong>el</strong>ulosas y azúcares, resulta claro <strong>el</strong> abatimiento <strong>de</strong> los costos <strong>de</strong> la materia<br />
prima y <strong><strong>de</strong>l</strong> producto final. En este sentido, se <strong>de</strong>be trabajar en experimentación y en<br />
programas piloto con las varieda<strong>de</strong>s <strong>de</strong> alto contenido <strong>de</strong> fibra (energéticas), ante la evi<strong>de</strong>ncia<br />
9
<strong>Potenciales</strong> y <strong>Viabilidad</strong> <strong><strong>de</strong>l</strong> <strong>Uso</strong> <strong>de</strong> <strong>Bioetanol</strong> y <strong>Biodies<strong>el</strong></strong> <strong>para</strong> <strong>el</strong> Transporte en México (SENER-BID-GTZ)<br />
Task 4: Ethanol feedstocks<br />
<strong>de</strong> transformar más c<strong>el</strong>ulosas y azúcares por ton<strong>el</strong>ada <strong>de</strong> caña en <strong>Bioetanol</strong> y en cosechar mas<br />
biomasa por unidad <strong>de</strong> superficie.<br />
La <strong>de</strong>nsidad <strong>de</strong> población <strong>de</strong> los cañales también <strong>de</strong>berá experimentarse con <strong>el</strong> propósito <strong>de</strong><br />
generar mas biomasa por unidad <strong>de</strong> superficie, pero sin <strong>de</strong>scuidar <strong>el</strong> binomio que se plantea <strong>de</strong><br />
cosechar caña ver<strong>de</strong> con máquina combinada. Cada vez se ve más necesario acordar con la<br />
industria la fabricación <strong>de</strong> maquinas ad-hoc <strong>de</strong> caña <strong>para</strong> bioetanol, <strong>para</strong> empezar no<br />
<strong>de</strong>sechando las puntas o cogollos y cortando más <strong>de</strong> un surco a menor distancia y por <strong>el</strong>lo,<br />
tener la potencia suficiente <strong>para</strong> cosechar alto ton<strong>el</strong>aje <strong>de</strong> biomasa.<br />
2.11 Las plantaciones <strong>de</strong> caña <strong>de</strong> azúcar, captura <strong>de</strong> dióxido <strong>de</strong> carbono y los bonos <strong>de</strong><br />
carbono<br />
Las plantaciones nuevas <strong>de</strong> caña, cosechadas en ver<strong>de</strong> o cruda y cuya biomasa se <strong>de</strong>stine a la<br />
fabricación <strong>de</strong> <strong>Bioetanol</strong>, podrían calificar <strong>para</strong> entrar en <strong>el</strong> mercado <strong>de</strong> los llamados “Bonos<br />
<strong>de</strong> Carbono”.<br />
La cantidad <strong>de</strong> dióxido <strong>de</strong> carbono capturado por una plantación vgr en la zona <strong>de</strong><br />
abastecimiento <strong><strong>de</strong>l</strong> Ingenio De Atencingo (Región Balsas) con una producción <strong>de</strong> 966<br />
ton<strong>el</strong>adas <strong>de</strong> tallos en su vida útil <strong>de</strong> siete cortes, equivalentes a 1,256 ton<strong>el</strong>adas <strong>de</strong> caña<br />
integral por hectárea (la mejor <strong>de</strong> México), alcanzaría teóricamente 512 ton<strong>el</strong>adas (CO2).<br />
Se han realizado operaciones <strong>de</strong> certificados <strong>de</strong> reducción <strong>de</strong> emisiones en un precio <strong>de</strong><br />
mercado <strong>de</strong> aproximadamente 10 dólares por ton<strong>el</strong>ada <strong>de</strong> CO2 absorbido por la plantación y<br />
por <strong>el</strong>lo, <strong>el</strong> ingreso <strong>de</strong> los productores <strong>de</strong> ese ingenio al ven<strong>de</strong>r su captura sería <strong>de</strong> 5,120<br />
dólares en <strong>el</strong> período <strong>de</strong> 8 años (siete cortes) o sea $56,320 pesos por hectárea, igual a $7,040<br />
pesos por hectárea por año. Por ton<strong>el</strong>ada <strong>de</strong> caña se obtendrían $58.30.<br />
Si se gestionara con éxito esta operación solo por un período <strong>de</strong> plantación <strong>de</strong> caña, con <strong>el</strong><br />
contrato se podría obtener financiamiento bancario <strong>para</strong> apoyar la construcción en cooperativa<br />
<strong>de</strong> la fábrica <strong>de</strong> <strong>Bioetanol</strong>.<br />
3. El Maíz (Zea mays L, familia <strong>de</strong> las gramíneas)<br />
Originario <strong>de</strong> México, encontrado en <strong>el</strong> Valle <strong>de</strong> Tehuacan, con antigüedad <strong>de</strong> hace<br />
aproximadamente 7,000 años. Su progenitor silvestre lo fue <strong>el</strong> Teosinte (Zea mexicana).<br />
Se produce en todas las regiones agrícolas <strong><strong>de</strong>l</strong> país; representa <strong>el</strong> principal alimento <strong>de</strong> los<br />
mexicanos (500 gr por persona, por día, promedio).<br />
La producción nacional ronda los 20 millones <strong>de</strong> ton<strong>el</strong>adas anuales, con un déficit <strong>de</strong><br />
aproximadamente 7 millones <strong>de</strong> ton<strong>el</strong>adas <strong>para</strong> abastecer la <strong>de</strong>manda industrial y pecuaria.<br />
10
<strong>Potenciales</strong> y <strong>Viabilidad</strong> <strong><strong>de</strong>l</strong> <strong>Uso</strong> <strong>de</strong> <strong>Bioetanol</strong> y <strong>Biodies<strong>el</strong></strong> <strong>para</strong> <strong>el</strong> Transporte en México (SENER-BID-GTZ)<br />
Task 4: Ethanol feedstocks<br />
La <strong>de</strong>manda interna se pue<strong>de</strong> dividir así en <strong>el</strong> año <strong>de</strong> 2005:<br />
Consumo humano 18’620,000 ton<br />
Autoconsumo menos: (7’335,000) ton<br />
Consumo pecuario 4’609,000 ton<br />
Consumo industrial 3’676,000 ton<br />
Consumo total<br />
6’905,000 ton<br />
Fuente: SIAP-SAGARPA<br />
En <strong>el</strong> ámbito mundial, es <strong>el</strong> principal grano forrajero. Los Estados Unidos produjeron en <strong>el</strong><br />
ciclo pasado un poco más <strong>de</strong> 300 millones <strong>de</strong> ton<strong>el</strong>adas, <strong>de</strong> las cuales <strong>de</strong>dicaron a la<br />
producción <strong>de</strong> <strong>Bioetanol</strong>, aprox. 39 millones <strong>de</strong> ton<strong>el</strong>adas. De maíz. Para 2012,<br />
aproximadamente 70 millones <strong>de</strong> ton<strong>el</strong>adas <strong>de</strong> maíz serán necesarias <strong>para</strong> producir 28 mil<br />
millones <strong>de</strong> litros <strong>de</strong> <strong>Bioetanol</strong>.<br />
Fuente: Renevable Fu<strong>el</strong>s Assoc. (RFA) USA.<br />
Según <strong>el</strong> SIAP-Sagarpa, la productividad <strong><strong>de</strong>l</strong> maíz a crecido en <strong>el</strong> lapso <strong>de</strong> 1990 a 2004, en un<br />
38.0% es <strong>de</strong>cir al 2.7% anual en promedio, al pasar <strong>de</strong> 2 ton por ha a 2.77 ton por ha.<br />
Para nuestros análisis, hemos s<strong>el</strong>eccionado la región <strong><strong>de</strong>l</strong> Mar <strong>de</strong> Cortés, específicamente<br />
Sinaloa, primer productor <strong>de</strong> maíz en México con alta tecnología <strong>de</strong> riego en los Valles <strong>de</strong><br />
Culiacán y <strong><strong>de</strong>l</strong> Fuerte. El grueso <strong>de</strong> su producción <strong>de</strong>be enviarse al centro <strong><strong>de</strong>l</strong> país con alto<br />
costo <strong>de</strong> transporte. En <strong>el</strong> sitio (centro-norte <strong>de</strong> Sinaloa) se podría fabricar, <strong>de</strong> ser factible, <strong>el</strong><br />
<strong>Bioetanol</strong> con esta materia prima.<br />
Sinaloa produjo en 2004, 3 millones 900 mil ton <strong>de</strong> maíz grano blanco con un rendimiento <strong>de</strong><br />
9,154 kilos por hectárea y siniestros menores al 5% <strong>de</strong> la superficie sembrada.<br />
De 1997 a 2004 <strong>el</strong> incremento <strong>de</strong> la productividad fue <strong><strong>de</strong>l</strong> 16.4% es <strong>de</strong>cir 2.34% anual en<br />
promedio, al pasar <strong>de</strong> 7,864 kg/ha a los 9,154 kg/ha <strong><strong>de</strong>l</strong> 2004.<br />
Los precios corrientes pasaron <strong>de</strong> $1,335 a $1,765 por ton en <strong>el</strong> lapso. A pesos constantes <strong>de</strong><br />
1997; $985 ton. La productividad creció 16.4%; <strong>el</strong> precio bajó 26.2%<br />
11
<strong>Potenciales</strong> y <strong>Viabilidad</strong> <strong><strong>de</strong>l</strong> <strong>Uso</strong> <strong>de</strong> <strong>Bioetanol</strong> y <strong>Biodies<strong>el</strong></strong> <strong>para</strong> <strong>el</strong> Transporte en México (SENER-BID-GTZ)<br />
Task 4: Ethanol feedstocks<br />
3.1 Composición <strong><strong>de</strong>l</strong> grano <strong>de</strong> maíz<br />
Análisis <strong><strong>de</strong>l</strong> grano <strong>de</strong> maíz <strong>para</strong> fabricación <strong>de</strong> <strong>Bioetanol</strong><br />
Componente<br />
Valores medios % en peso<br />
Agua 15.1<br />
Almidón 62.6<br />
Otros E.L.N. 6.7<br />
Grasa 3.7<br />
Proteína cruda 8.4<br />
Fibra cruda 2.0<br />
Cenizas 1.5<br />
Con 626 kilos <strong>de</strong> almidón contenidos en una ton<strong>el</strong>ada <strong>de</strong> maíz, se pue<strong>de</strong>n producir 400 litros<br />
<strong>de</strong> <strong>Bioetanol</strong>, 333 kilos <strong>de</strong> granos <strong>de</strong> <strong>de</strong>stilería con 10% <strong>de</strong> humedad y 285 kg <strong>de</strong> dióxido <strong>de</strong><br />
carbono.<br />
3.2 Costos <strong>de</strong> producción (Sinaloa) por hectárea y por ton<strong>el</strong>ada<br />
Ciclo 0-I 2005/2006<br />
Pre<strong>para</strong>ción <strong>de</strong> tierras y otras labores mecanizadas 3,100.00<br />
Cosecha o trilla 600.00<br />
Flete 600.00<br />
Fertilizante 3,340.00<br />
Semilla 2,257.00<br />
Insecticida 779.00<br />
Cuota <strong>de</strong> agua 628.00<br />
Riegos (mano <strong>de</strong> obra) 625.00<br />
Aseguramiento 463.00<br />
Otras cuotas 60.00<br />
Intereses crédito <strong>de</strong> avío 375.00<br />
Costo <strong>de</strong> producción <strong><strong>de</strong>l</strong> cultivo*<br />
$ 12,827.00 por ha<br />
Rendimiento 10 ton/ha<br />
Costo <strong>de</strong> producción / ton 1,283.00<br />
Maíz con 14% <strong>de</strong> humedad, máximo.<br />
Varieda<strong>de</strong>s híbridas: Puma, Lince, Tigre, D-K 20-20, D-K 20-25<br />
Densidad <strong>de</strong> población<br />
105,000 plantas/ha<br />
Precio Venta: ton<br />
Precio base $1,450.00<br />
Subsidio <strong><strong>de</strong>l</strong> Gobierno Fe<strong>de</strong>ral 400.00<br />
Ingreso objetivo <strong><strong>de</strong>l</strong> agricultor 1,850.00<br />
*Este costo no consi<strong>de</strong>ra la renta <strong>de</strong> la tierra que se cotiza en $5,000 por año. Así <strong>el</strong> costo sería<br />
por ha $17,827.00 por ton: $1,783.0.<br />
12
<strong>Potenciales</strong> y <strong>Viabilidad</strong> <strong><strong>de</strong>l</strong> <strong>Uso</strong> <strong>de</strong> <strong>Bioetanol</strong> y <strong>Biodies<strong>el</strong></strong> <strong>para</strong> <strong>el</strong> Transporte en México (SENER-BID-GTZ)<br />
Task 4: Ethanol feedstocks<br />
3.3 Análisis económico (sin renta <strong>de</strong> tierra)<br />
Costo <strong>de</strong> producción y acarreo por ton $1,283.00<br />
Precio <strong>de</strong> venta al agricultor por ton 1,850.00<br />
Margen por ton<strong>el</strong>ada 567.00<br />
R<strong>el</strong>ación Beneficio-costo 1.44<br />
Rendimiento por peso invertido 1.59<br />
Si se carga renta <strong>de</strong> tierra, a un rendimiento <strong>de</strong> 10 ton por ha <strong>de</strong> grano, prácticamente no hay<br />
utilidad.<br />
Un ejidatario que siembre 10 has <strong>de</strong> maíz con rendimiento <strong>de</strong> 10 ton/ha, recibe <strong>de</strong> ingreso<br />
anual $56,700.00 o sea <strong>el</strong> equivalente a 3 salarios mínimos. Este ingreso se da en las mejores<br />
condiciones <strong>de</strong> la agricultura nacional.<br />
La única manera <strong>de</strong> que los ejidatarios y realmente pequeños propietarios salgan <strong>de</strong> la pobreza<br />
es cambiar en verdad <strong>el</strong> <strong>para</strong>digma con <strong>el</strong> cual se <strong>de</strong>sarrolle la agricultura <strong><strong>de</strong>l</strong> país, a saber:<br />
“los agricultores productores <strong>de</strong> las materias primas y aquéllos trabajadores permanentes que<br />
las hacen posibles, <strong>de</strong>ben participar <strong>de</strong> su valor agregado, accediendo también al capital<br />
accionario <strong>de</strong> las instalaciones agroindustriales y las que fueren necesarias <strong>para</strong> integrar la<br />
ca<strong>de</strong>na <strong>de</strong> distribución hasta <strong>el</strong> consumidor final, <strong>el</strong>iminando a los intermediarios no<br />
necesarios.<br />
3.4 El Costo Primo en la producción <strong>de</strong> <strong>Bioetanol</strong><br />
Tecnología molienda seca <strong>de</strong> maíz:<br />
Valor <strong>de</strong> los “granos <strong>de</strong> <strong>de</strong>stilería”<br />
$1,500.00 ton<br />
Rendimientos esperados /ton <strong>de</strong> maíz<br />
<strong>Bioetanol</strong><br />
400 litros<br />
Granos <strong>de</strong> <strong>de</strong>stilería 333 kg alimento <strong>para</strong> ganado<br />
Dióxido <strong>de</strong> carbono 285 kg sin mercado<br />
Costo <strong><strong>de</strong>l</strong> maíz 1,000 kilos* $1,283.00<br />
Valor <strong>de</strong> granos <strong>de</strong> <strong>de</strong>stilería ( 500.00)<br />
Costo <strong>de</strong> materia prima a <strong>Bioetanol</strong> 783.00<br />
Costo primo por litro <strong>de</strong> <strong>Bioetanol</strong> $ 1.96<br />
*Costo <strong>para</strong> <strong>el</strong> caso <strong>de</strong> que los productores <strong>de</strong> maíz, <strong>de</strong>bidamente organizados instalaran la<br />
fábrica <strong>de</strong> <strong>Bioetanol</strong> y obtuvieran su ganancia como agroindustriales, al través <strong><strong>de</strong>l</strong> producto<br />
<strong>Bioetanol</strong> (criterio igual al aplicado <strong>para</strong> <strong>el</strong> bioetanol <strong>de</strong> caña <strong>de</strong> azúcar).<br />
También, en la medida en que se <strong>de</strong>sarrollen los autos flexibles en las regiones y en México,<br />
estas mismas cooperativas instalarían sus centros <strong>de</strong> servicio al público o “<strong>Bioetanol</strong>eras” y<br />
manejarían también <strong>el</strong> E-85 <strong>para</strong> beneficio <strong>de</strong> la atmósfera y <strong><strong>de</strong>l</strong> <strong>de</strong>sarrollo <strong>de</strong> mercado <strong>para</strong> su<br />
negocio.<br />
13
<strong>Potenciales</strong> y <strong>Viabilidad</strong> <strong><strong>de</strong>l</strong> <strong>Uso</strong> <strong>de</strong> <strong>Bioetanol</strong> y <strong>Biodies<strong>el</strong></strong> <strong>para</strong> <strong>el</strong> Transporte en México (SENER-BID-GTZ)<br />
Task 4: Ethanol feedstocks<br />
4. El Trigo (Triticum vulgare L., familia <strong>de</strong> las gramíneas)<br />
4.1 El trigo grano (Originario <strong><strong>de</strong>l</strong> continente Europeo)<br />
La producción nacional en <strong>el</strong> año agrícola <strong><strong>de</strong>l</strong> 2004 alcanzó 2 millones 321 mil ton<strong>el</strong>adas en<br />
535 mil hectáreas.<br />
Las importaciones <strong>de</strong> 2005 fueron por 3 millones 562 mil; se exportaron 429 mil, con un<br />
consumo humano <strong>de</strong> 5 millones 400 mil ton<strong>el</strong>adas o sea 140 gramos diarios por persona.<br />
La productividad <strong><strong>de</strong>l</strong> trigo se ha mantenido o aumentado poco en la última década con los<br />
rendimientos más <strong>el</strong>evados en los Valles <strong>de</strong> Mexicali y <strong><strong>de</strong>l</strong> Yaqui <strong>de</strong> la región <strong><strong>de</strong>l</strong> Mar <strong>de</strong><br />
Cortés con 6.0 y 5.7 ton<strong>el</strong>adas por hectárea respectivamente.<br />
Y es precisamente en estos Valles en don<strong>de</strong> se analiza la factibilidad <strong>de</strong> producir <strong>Bioetanol</strong> a<br />
base <strong>de</strong> trigo por razones <strong>de</strong> logística y bajos rendimientos en algunas zonas <strong><strong>de</strong>l</strong> Valle <strong>de</strong><br />
Mexicali, B.C. y <strong>de</strong> logística en <strong>el</strong> Valle <strong><strong>de</strong>l</strong> Yaqui.<br />
El primero <strong>de</strong> <strong>el</strong>los produjo en <strong>el</strong> ciclo O-I 2004-05, 489 mil ton <strong>de</strong> trigo y <strong>el</strong> segundo 566 mil<br />
que como grano o harina viaja hacia <strong>el</strong> centro <strong><strong>de</strong>l</strong> país con altos fletes. El precio al agricultor<br />
fue <strong>de</strong> $2,150.00 ton en Mexicali, B.C. y $ 1,800.00 en <strong>el</strong> Valle <strong><strong>de</strong>l</strong> Yaqui, Sonora.<br />
Las varieda<strong>de</strong>s principales fueron Aconchi en <strong>el</strong> Valle <strong>de</strong> Mexicali y Jupare en los Valles<br />
Yaqui y Mayo.<br />
Es oportuno <strong>de</strong>stacar que la producción mundial <strong>de</strong> trigo en <strong>el</strong> ciclo 2004-05 llegó a 621<br />
millones <strong>de</strong> ton<strong>el</strong>adas, con <strong>el</strong> primer lugar <strong>para</strong> la Unión Europea con 137 millones <strong>de</strong><br />
ton<strong>el</strong>adas, en seguida China con 90 millones y en tercer lugar Estados Unidos <strong>de</strong> América con<br />
59 millones <strong>de</strong> ton<strong>el</strong>adas.<br />
4.1.1 Composición <strong><strong>de</strong>l</strong> grano <strong>de</strong> Trigo (Promedio)<br />
Componente<br />
Porcentaje(%)<br />
Agua 13.2<br />
Almidón 69.3<br />
Proteína cruda* 11.7<br />
Grasa cruda 2.0<br />
Cenizas 1.8<br />
Fibra 2.0<br />
*Si <strong>el</strong> trigo contiene más <strong><strong>de</strong>l</strong> 13% <strong>de</strong> proteína no <strong>de</strong>be <strong>de</strong> usarse <strong>para</strong> producir <strong>Bioetanol</strong><br />
por problemas en la fermentación.<br />
Fuente: The Biotechnology of etanol. Wiley-VCH<br />
14
<strong>Potenciales</strong> y <strong>Viabilidad</strong> <strong><strong>de</strong>l</strong> <strong>Uso</strong> <strong>de</strong> <strong>Bioetanol</strong> y <strong>Biodies<strong>el</strong></strong> <strong>para</strong> <strong>el</strong> Transporte en México (SENER-BID-GTZ)<br />
Task 4: Ethanol feedstocks<br />
4.1.2 Costos <strong>de</strong> producción<br />
Valle <strong>de</strong> Mexicali, B.C. por hectárea y por ton<strong>el</strong>ada <strong>de</strong> trigo<br />
Ciclo O-I 2005-2006<br />
Pre<strong>para</strong>ción <strong>de</strong> tierras y otras labores mecanizadas 2,675.00<br />
Cosecha o trilla 550.00<br />
Flete 480.00<br />
Fertilizante 2,502.00<br />
Semilla 560.00<br />
Insecticida 1,272.00<br />
Cuota <strong>de</strong> agua 788.00<br />
Riegos (mano <strong>de</strong> obra) 390.00<br />
Aseguramiento 350.00<br />
Otras cuotas 260.00<br />
Intereses crédito <strong>de</strong> avío 432.00<br />
*Costo <strong>de</strong> producción (cultivo)<br />
$ 10,259.00 por ha<br />
Rendimiento 6 tons<br />
Costo <strong>de</strong> producción por ton $1,710.00<br />
Precio <strong>de</strong> Venta<br />
Precio base<br />
Subsidio <strong><strong>de</strong>l</strong> Gobierno Fe<strong>de</strong>ral<br />
Apoyo por siembra en surcos<br />
Ingreso al productor:<br />
$ 1,800 ton<br />
283 ton<br />
67 ton<br />
$ 2,150 ton<br />
*Este costo no incluye renta <strong>de</strong> tierra que se cotiza en $3,500 por ha al año, así <strong>el</strong> costo sería:<br />
Por hectárea $13,759.00 por ton<strong>el</strong>ada $ 2,293.00<br />
Fuente: Directa agricultores y técnicos locales.<br />
15
<strong>Potenciales</strong> y <strong>Viabilidad</strong> <strong><strong>de</strong>l</strong> <strong>Uso</strong> <strong>de</strong> <strong>Bioetanol</strong> y <strong>Biodies<strong>el</strong></strong> <strong>para</strong> <strong>el</strong> Transporte en México (SENER-BID-GTZ)<br />
Task 4: Ethanol feedstocks<br />
4.1.3 Análisis económico (sin renta <strong>de</strong> tierra)<br />
Valle <strong>de</strong> Mexicali.<br />
Costo <strong>de</strong> producción y acarreo por ton<strong>el</strong>ada: $ 1,710.00<br />
Precio <strong>de</strong> venta, al agricultor por ton 2,150.00<br />
Margen por ton 440.00<br />
R<strong>el</strong>ación Beneficio-costo 1.26<br />
Rendimiento por peso invertido 1.40<br />
Un ejidatario que siembre sus 20 has <strong>de</strong> trigo (en las tierras buenas <strong><strong>de</strong>l</strong> Valle <strong>de</strong> Mexicali, no<br />
en las <strong>de</strong> segunda) con rendimiento <strong>de</strong> 6 tons por ha, recibe <strong>de</strong> ingreso $52,800 en <strong>el</strong> año, o sea<br />
<strong>el</strong> equivalente a 2.7 salarios mínimos.<br />
Este ingreso en las mejores condiciones <strong>de</strong> la agricultura nacional.<br />
La única manera <strong>de</strong> que los ejidatarios y realmente pequeños propietarios salgan <strong>de</strong> la pobreza<br />
es cambiar en verdad <strong>el</strong> <strong>para</strong>digma con <strong>el</strong> cual se <strong>de</strong>sarrolle la agricultura <strong><strong>de</strong>l</strong> país, a saber:<br />
“los agricultores productores <strong>de</strong> las materias primas y aquéllos trabajadores permanentes que<br />
las hacen posibles, <strong>de</strong>ben participar <strong>de</strong> su valor agregado, accediendo también al capital<br />
accionario <strong>de</strong> las instalaciones agroindustriales y las que fueren necesarias <strong>para</strong> integrar la<br />
ca<strong>de</strong>na <strong>de</strong> distribución hasta <strong>el</strong> consumidor final, <strong>el</strong>iminando a los intermediarios no<br />
necesarios.<br />
4.1.4 El Costo Primo <strong><strong>de</strong>l</strong> trigo en la producción <strong>de</strong> <strong>Bioetanol</strong><br />
Tecnología molienda seca <strong><strong>de</strong>l</strong> trigo<br />
Valor <strong>de</strong> los granos <strong>de</strong> <strong>de</strong>stilería: $1,500.00 por ton<br />
Rendimientos esperados por ton<strong>el</strong>ada <strong>de</strong> trigo:<br />
<strong>Bioetanol</strong><br />
360 litros<br />
Granos <strong>de</strong> <strong>de</strong>stilería 430 kg<br />
Dióxido <strong>de</strong> carbono 256 kg sin mercado<br />
*Costo <strong><strong>de</strong>l</strong> trigo 1,000 kilos $1,710.00<br />
Valor <strong>de</strong> los granos <strong>de</strong> <strong>de</strong>stilería 645.00<br />
Costo <strong>de</strong> materia prima a <strong>Bioetanol</strong> 1,065.00<br />
Costo primo por litro <strong>de</strong> <strong>Bioetanol</strong> $ 2.96<br />
Fuente: Sheffi<strong>el</strong>d Hallam University<br />
16
<strong>Potenciales</strong> y <strong>Viabilidad</strong> <strong><strong>de</strong>l</strong> <strong>Uso</strong> <strong>de</strong> <strong>Bioetanol</strong> y <strong>Biodies<strong>el</strong></strong> <strong>para</strong> <strong>el</strong> Transporte en México (SENER-BID-GTZ)<br />
Task 4: Ethanol feedstocks<br />
4.2 Paja <strong>de</strong> Trigo<br />
En <strong>el</strong> Valle <strong>de</strong> Mexicali, con un rendimiento <strong>de</strong> grano <strong>de</strong> 6 ton/ha, se producen 7.3 ton <strong>de</strong> paja<br />
posible <strong>de</strong> cosecharse.<br />
La siembra <strong><strong>de</strong>l</strong> trigo <strong>de</strong>berá hacerse en plano o surcos pequeños <strong>para</strong> que los implementos <strong>de</strong><br />
corte y empaque jalados por un tractor operen correctamente. Así, bastarían 3 horas y media<br />
<strong><strong>de</strong>l</strong> conjunto <strong>para</strong> cosecha una hectárea.<br />
A la paja como esquilmo, se le consi<strong>de</strong>ra con valor cero y <strong>el</strong> costo <strong>para</strong> <strong>el</strong> proyecto sería <strong>el</strong> <strong>de</strong><br />
cosecha y acarreo o flete a la fábrica.<br />
4.2.1 Composición <strong>de</strong> la paja <strong>de</strong> trigo<br />
Componente porciento en peso (%)<br />
Agua 15.0<br />
Lignina 21.0<br />
C<strong>el</strong>ulosas 53.5<br />
Cenizas 10.5<br />
Fuente: The Biotechnology of etanol. Wiley-VCH<br />
4.2.2 Costos <strong>de</strong> producción <strong>de</strong> la paja <strong>de</strong> trigo en Valle <strong>de</strong> Mexicali, B.C.<br />
Se toma como costo total, <strong>el</strong> <strong>de</strong> cosecha, flete, como sigue:<br />
Equipo Tractor <strong>de</strong> 80 H.P<br />
Cortadora <strong>de</strong> jalón<br />
Rastrillo<br />
Empacadora<br />
Tiempo <strong>para</strong> cosechar una ha con un tractor = 3.5 horas<br />
Pacas <strong>de</strong> 25 kilos<br />
Cosecha 292 pacas a $5.00 por paca $1, 460.00<br />
Flete <strong>de</strong> 292 pacas 720.00<br />
Costo por hectárea (7.3 ton/ha) 2,180.00<br />
Costo por ton<strong>el</strong>ada 299.00<br />
Fuente: Directa, agricultores y técnicos locales.<br />
17
<strong>Potenciales</strong> y <strong>Viabilidad</strong> <strong><strong>de</strong>l</strong> <strong>Uso</strong> <strong>de</strong> <strong>Bioetanol</strong> y <strong>Biodies<strong>el</strong></strong> <strong>para</strong> <strong>el</strong> Transporte en México (SENER-BID-GTZ)<br />
Task 4: Ethanol feedstocks<br />
4.2.3 El Costo Primo <strong>de</strong> la paja <strong>de</strong> trigo en la producción <strong>de</strong> <strong>Bioetanol</strong><br />
Tecnología.- Pretratamiento e Hidrólisis ácida (sulfúrico)<br />
Rendimientos esperados por ton<strong>el</strong>ada <strong>de</strong> paja:<br />
<strong>Bioetanol</strong><br />
Acido acético (sin mercado)<br />
Cenizas (sin mercado)<br />
*Lignina y no fermentables<br />
345 litros<br />
31.5 kg<br />
105.2 kg<br />
210.1 kg<br />
*Lignina transformada a fuente <strong>de</strong> energía térmica o <strong>el</strong>éctrica a proceso.<br />
Costo <strong>de</strong> la paja<br />
$ 299.00 / ton<br />
Valor <strong>de</strong> co y sub productos<br />
Costo <strong>de</strong> materia prima a <strong>Bioetanol</strong> 299.00 / ton<br />
Costo primo por litro <strong>de</strong> <strong>Bioetanol</strong> $ 0.87<br />
Fuente: Sheffi<strong>el</strong>d Hallam University.<br />
4.2.4 Costo Primo integrado <strong>de</strong> Trigo grano más paja<br />
Costo primo <strong>de</strong> <strong>Bioetanol</strong>: Grano<br />
$2.96 por litro<br />
Paja<br />
0.87 por litro<br />
Costo combinado:<br />
$1.93 por litro<br />
Una hectárea <strong>de</strong> trigo integral (cosechado trigo mas paja) en <strong>el</strong> Valle <strong>de</strong> Mexicali produciría<br />
(2,160 lts + 2,518 lts) = 4,678 litros <strong>de</strong> <strong>Bioetanol</strong>, más los productos y subproductos ya<br />
mencionados.<br />
5. La Remolacha azucarera (Beta vulgaris L., familia Chenopodiacea)<br />
Planta bianual que durante <strong>el</strong> primer ciclo <strong>de</strong> su <strong>de</strong>sarrollo produce una raíz con alto contenido<br />
<strong>de</strong> sacarosa (16 – 18% en peso) <strong>de</strong>pendiendo <strong>de</strong> la variedad (ciclo <strong>de</strong> 6 a 7 meses a partir <strong>de</strong> la<br />
siembra) y en <strong>el</strong> segundo ciclo <strong>de</strong>sarrolla un tallo floral, yemas, flores y semillas.<br />
La materia seca <strong>de</strong> la remolacha, es casi tan rica como la <strong>de</strong> los cereales.<br />
En Europa la remolacha junto con <strong>el</strong> trigo representan las materias primas principales <strong>para</strong> la<br />
producción <strong>de</strong> <strong>Bioetanol</strong>.<br />
En México se cultivó en <strong>el</strong> Valle <strong>de</strong> Mexicali, B.C. hace 20 años, con buenos resultados y<br />
también en los Valles <strong><strong>de</strong>l</strong> Yaqui y <strong><strong>de</strong>l</strong> Fuerte en don<strong>de</strong> se evaluó la producción <strong>de</strong> remolacha<br />
en tierras marginales (salinidad y sodio) y estas aún regadas con las aguas <strong>de</strong> drenaje <strong>de</strong> los<br />
18
<strong>Potenciales</strong> y <strong>Viabilidad</strong> <strong><strong>de</strong>l</strong> <strong>Uso</strong> <strong>de</strong> <strong>Bioetanol</strong> y <strong>Biodies<strong>el</strong></strong> <strong>para</strong> <strong>el</strong> Transporte en México (SENER-BID-GTZ)<br />
Task 4: Ethanol feedstocks<br />
distritos que ya iban al mar. En estas condiciones extremas <strong>el</strong> cultivo produjo 40 ton<strong>el</strong>adas <strong>de</strong><br />
raíz por ha y a<strong>de</strong>más, así se inicia <strong>el</strong> proceso <strong>de</strong> rescate <strong>de</strong> estos terrenos.<br />
En este trabajo, se propone <strong>el</strong> cultivo <strong>de</strong> la remolacha azucarera en <strong>el</strong> Valle <strong>de</strong> Mexicali <strong>para</strong><br />
<strong>de</strong>splazar <strong>el</strong> cultivo <strong><strong>de</strong>l</strong> trigo en tierras no aptas <strong>para</strong> este cultivo y que generan a los<br />
agricultores año con año, problemas económicos y sociales en virtud <strong>de</strong> sus bajos<br />
rendimientos (3.5 – 4 ton/ha).<br />
Estas tierras empeoran su condición con <strong>el</strong> trigo. Con la remolacha se pue<strong>de</strong>n rehabilitar.<br />
A<strong>de</strong>más, esto es fundamental, la fabricación <strong>de</strong> <strong>Bioetanol</strong> a partir <strong>de</strong> la remolacha aprovechará<br />
la energía térmica <strong><strong>de</strong>l</strong> vapor <strong>de</strong> escape <strong>de</strong> la Geotermo<strong>el</strong>éctrica <strong>de</strong> “Cerro Prieto”, que hoy<br />
lamentablemente se <strong>de</strong>sperdicia, ubicada en la zona agrícola <strong>de</strong> referencia, abatiendo<br />
significativamente <strong>el</strong> costo <strong>de</strong> producción <strong><strong>de</strong>l</strong> <strong>Bioetanol</strong> y superando <strong>el</strong> problema <strong>de</strong> la<br />
remolacha <strong>de</strong> no producir, como la caña con su bagazo, su propio combustible.<br />
En <strong>el</strong> Valle <strong><strong>de</strong>l</strong> Fuerte (Sinaloa) se propone la siembra <strong>de</strong> remolacha <strong>para</strong> operar plantas<br />
“mixtas” productoras <strong>de</strong> <strong>Bioetanol</strong> con jugos <strong>de</strong> remolacha y <strong>de</strong> caña, en zafras <strong>de</strong> mayor<br />
duración y también rehabilitando su<strong>el</strong>os. La caña en esta región se produce con alta fibra y<br />
bastos exce<strong>de</strong>ntes <strong>de</strong> bagazo en la zafra, los cuales serían la “energía” <strong>para</strong> procesar la<br />
remolacha. Esta, genera subproductos ricos <strong>para</strong> la alimentación animal.<br />
Obviamente, la extracción <strong><strong>de</strong>l</strong> jugo azucarado <strong>de</strong> la remolacha, se haría con Difusor.<br />
5.1 Composición <strong>de</strong> la raíz <strong>de</strong> remolacha<br />
En base seca, <strong>el</strong> 77% <strong><strong>de</strong>l</strong> peso <strong>de</strong> la raíz, esta representado por azúcares fermentables, casi<br />
exclusivamente sacarosa.<br />
En base húmeda, se muestra <strong>el</strong> análisis:<br />
Componente Porciento en peso %<br />
Agua 75.10<br />
Carbohidratos 19.14<br />
Fibra 1.13<br />
Proteína cruda 1.35<br />
Grasa 0.25<br />
Cenizas 3.03<br />
El análisis típico <strong><strong>de</strong>l</strong> jugo que sale <strong><strong>de</strong>l</strong> difusor (equivalente al jugo mezclado <strong>de</strong> la caña) nos<br />
muestra en base seca, un contenido <strong><strong>de</strong>l</strong> 87.75% <strong>de</strong> sacarosa más 1.03% <strong>de</strong> azúcares invertidos.<br />
Fuente: Internacional Sugar JLN. Idaho USA<br />
19
<strong>Potenciales</strong> y <strong>Viabilidad</strong> <strong><strong>de</strong>l</strong> <strong>Uso</strong> <strong>de</strong> <strong>Bioetanol</strong> y <strong>Biodies<strong>el</strong></strong> <strong>para</strong> <strong>el</strong> Transporte en México (SENER-BID-GTZ)<br />
Task 4: Ethanol feedstocks<br />
De una ton<strong>el</strong>ada <strong>de</strong> raíz, como co-producto <strong>de</strong> la fabricación <strong>de</strong> <strong>Bioetanol</strong>, se producen:<br />
472 kg <strong>de</strong> pulpa húmeda*<br />
17 kg <strong>de</strong> pectina<br />
2.9 kg <strong>de</strong> lignina<br />
* A secarse con la energía calórica <strong>de</strong> los vapores <strong>de</strong> escape <strong>de</strong> la Geotérmica y ven<strong>de</strong>rse <strong>para</strong><br />
los programas gana<strong>de</strong>ros <strong>de</strong> engorda <strong>de</strong> Mexicali.<br />
5.2 Costo <strong>de</strong> producción <strong>de</strong> la remolacha (Valle <strong>de</strong> Mexicali) por hectárea y por<br />
ton<strong>el</strong>ada*<br />
Pre<strong>para</strong>ción <strong>de</strong> tierras 1,261.00<br />
Cultivos, siembra y aplicación <strong>de</strong> insumos 1,420.00<br />
Semilla 1,413.00<br />
Fertilizante 2,117.00<br />
Agroquímicos (Insec. Herb. Fun.) 5,029.00<br />
Cuota <strong>de</strong> agua 950.00<br />
Mano <strong>de</strong> obra (3 jornales) 600.00<br />
Cosecha (85 ton/ha) 2,723.00<br />
Transporte 2,569.00<br />
Intereses crédito <strong>de</strong> avío 750.00<br />
Seguro agrícola 700.00<br />
Cuotas varias 240.00<br />
Costo total por ha $ 19,772.00<br />
** Fuente: Universidad <strong>de</strong> California. Condado <strong><strong>de</strong>l</strong> Valle Imperial, California y Agricultores y<br />
técnicos <strong><strong>de</strong>l</strong> Valle <strong>de</strong> Mexicali.<br />
Costo <strong>de</strong> producción por ton<strong>el</strong>ada $ 232.61<br />
Varieda<strong>de</strong>s: Phoenix; Beta 4430<br />
*La tecnología <strong>de</strong> producción es la que se practica en <strong>el</strong> Valle Imperial <strong>de</strong> California (vecino<br />
inmediato). Los costos <strong>de</strong> agroquímicos; semilla, y cosecha son los <strong><strong>de</strong>l</strong> Valle Imperial; los <strong>de</strong><br />
labores mecanizadas <strong>de</strong> pre<strong>para</strong>ción <strong>de</strong> tierras, cultivos, aplicación <strong>de</strong> insumos, transporte,<br />
agua, mano <strong>de</strong> obra, seguro e intereses, son según las cuotas y tarifas <strong>de</strong> la región. No se<br />
consi<strong>de</strong>ra renta <strong>de</strong> tierra que se cotiza en $ 3,500 /ha /año.<br />
5.3 El Costo Primo <strong>de</strong> la remolacha azucarera en la producción <strong>de</strong> <strong>Bioetanol</strong><br />
Tecnología: Extracción <strong><strong>de</strong>l</strong> azúcar <strong>de</strong> las rebanadas <strong>de</strong> raíz (cossettas) por lixiviación<br />
(difusión), con agua caliente. Utilización <strong><strong>de</strong>l</strong> vapor <strong>de</strong> escape y <strong><strong>de</strong>l</strong> agua caliente <strong>de</strong> la<br />
Geotérmica, como fuente <strong>de</strong> calor.<br />
20
<strong>Potenciales</strong> y <strong>Viabilidad</strong> <strong><strong>de</strong>l</strong> <strong>Uso</strong> <strong>de</strong> <strong>Bioetanol</strong> y <strong>Biodies<strong>el</strong></strong> <strong>para</strong> <strong>el</strong> Transporte en México (SENER-BID-GTZ)<br />
Task 4: Ethanol feedstocks<br />
Rendimientos esperados por ton <strong>de</strong> remolacha:<br />
<strong>Bioetanol</strong><br />
Pulpa seca (24% proteína)<br />
98 litros<br />
12.5 kg gana<strong>de</strong>ría<br />
*Fuente: The Biotechnology of ethanol. Wiley-VCH.<br />
Costo <strong>de</strong> la remolacha por ton<strong>el</strong>ada<br />
$ 232.61 ton<br />
Valor <strong>de</strong> la pulpa ( 15.00)<br />
Costo <strong>de</strong> materia prima a <strong>Bioetanol</strong><br />
217.61 ton<br />
Costo primo por litro <strong>de</strong> <strong>Bioetanol</strong><br />
$ 2.22 / litro<br />
6. Sorgo grano (Sorghum vulgare L, familia gramíneas)<br />
De esta gramínea se sembraron en los últimos diez años, en la zona <strong>de</strong> San Fernando Tamps.<br />
Región <strong><strong>de</strong>l</strong> Pacífico Norte, aproximadamente 230 mil has por año; siembras <strong>de</strong> invierno (dicenero)<br />
<strong>de</strong> temporal, aprovechando las humeda<strong>de</strong>s <strong>de</strong> las lluvias <strong>de</strong> esa estación.<br />
La producción <strong>de</strong> grano alcanza un poco más <strong>de</strong> 2 ton<strong>el</strong>adas por hectárea con <strong>el</strong> promedio <strong>de</strong><br />
lluvias <strong><strong>de</strong>l</strong> ciclo y sin fertilizante, pero con semilla mejorada.<br />
Son estas las zonas que podrían tener mayores ingresos directos, si <strong>el</strong> sorgo se transforma en<br />
<strong>Bioetanol</strong>, ya que ahora <strong>el</strong> precio <strong>de</strong> mercado es <strong>de</strong> $1,250.00 / ton y solo se <strong>el</strong>eva al pago<br />
actual <strong>de</strong> hasta $1,960.00 <strong>de</strong>bido a los apoyos <strong><strong>de</strong>l</strong> Gobierno Fe<strong>de</strong>ral (Procampo y otros).<br />
Cabe <strong>de</strong>stacar que en esta planicie costera, <strong>de</strong> San Fernando, la dotación ejidal es <strong>de</strong> 20 has<br />
por campesino, que normalmente se siembra completa <strong>de</strong> este cultivo.<br />
6.1 Composición <strong><strong>de</strong>l</strong> grano <strong>de</strong> sorgo.<br />
Componente Porcentaje (%)<br />
Agua 11.5<br />
* Extracto libre <strong>de</strong> nitrógeno 71.5<br />
Proteína 10.0<br />
Grasa 2.5<br />
Fibra 3.0<br />
Cenizas 1.5<br />
*Almidón y azúcares 63<br />
(<strong>el</strong> almidón <strong><strong>de</strong>l</strong> endospermo es <strong>de</strong> estructura cerosa)<br />
Con 630 kg <strong>de</strong> almidón contenido en una ton<strong>el</strong>ada <strong>de</strong> sorgo, se pue<strong>de</strong>n producir 400 litros <strong>de</strong><br />
<strong>Bioetanol</strong>, 333 kg <strong>de</strong> granos <strong>de</strong> <strong>de</strong>stilería con 10% <strong>de</strong> humedad y 285 kg <strong>de</strong> dióxido <strong>de</strong><br />
carbono.<br />
Fuente: The Biothecnology of Ethanol.Wiley-VCH<br />
21
<strong>Potenciales</strong> y <strong>Viabilidad</strong> <strong><strong>de</strong>l</strong> <strong>Uso</strong> <strong>de</strong> <strong>Bioetanol</strong> y <strong>Biodies<strong>el</strong></strong> <strong>para</strong> <strong>el</strong> Transporte en México (SENER-BID-GTZ)<br />
Task 4: Ethanol feedstocks<br />
6.2 Costo <strong>de</strong> producción<br />
San Fernando, Tamps<br />
Ciclo O-I 2005 – 2006. Sin fertilizante.<br />
Pre<strong>para</strong>ción <strong>de</strong> tierras siembras y cultivos (tractor) $ 1,400.00<br />
Semilla (híbrido) 320.00<br />
Trilla 240.00<br />
Flete 120.00<br />
Costo total por hectárea 2,080.00<br />
Rendimiento 2 ton por ha.<br />
Costo por ton<strong>el</strong>ada $ 1,040.00<br />
Precio <strong>de</strong> venta:<br />
ton<br />
Precio base 1,250.00<br />
Subsidio Gobierno Fe<strong>de</strong>ral 710.00<br />
Precio al agricultor 1,960.00<br />
Este costo no consi<strong>de</strong>ra renta <strong>de</strong> tierra que en esta zona cotiza poco.<br />
Fuente: Agricultores y técnicos <strong>de</strong> la zona.<br />
6.3 Análisis económico <strong><strong>de</strong>l</strong> sorgo grano<br />
Costo <strong>de</strong> producción y acarreo<br />
$ 1,040.00 ton<br />
Ingreso por venta y subsidios 1,960.00<br />
Margen por ton<strong>el</strong>ada 920.00<br />
R<strong>el</strong>ación Beneficio-costo 1.88<br />
Rendimiento por peso invertido 2.28<br />
Un agricultor que siembre su parc<strong>el</strong>a <strong>de</strong> 20 has, obtiene ingreso neto <strong>de</strong> $36,800.00 al año o<br />
sea <strong>el</strong> equivalente a dos salarios mínimos.<br />
22
<strong>Potenciales</strong> y <strong>Viabilidad</strong> <strong><strong>de</strong>l</strong> <strong>Uso</strong> <strong>de</strong> <strong>Bioetanol</strong> y <strong>Biodies<strong>el</strong></strong> <strong>para</strong> <strong>el</strong> Transporte en México (SENER-BID-GTZ)<br />
Task 4: Ethanol feedstocks<br />
6.4 El Costo Primo <strong><strong>de</strong>l</strong> sorgo <strong>de</strong> temporal en la producción <strong>de</strong> <strong>Bioetanol</strong><br />
Tecnología: molienda seca <strong>de</strong> sorgo<br />
Valor <strong>de</strong> los granos <strong>de</strong> <strong>de</strong>stilería $ 1,500.00 / ton<br />
Rendimientos esperados por ton<strong>el</strong>ada procesada:<br />
<strong>Bioetanol</strong><br />
Granos <strong>de</strong> <strong>de</strong>stilería<br />
Dióxido <strong>de</strong> carbono<br />
400 litros<br />
333 kg gana<strong>de</strong>ría<br />
285 kg sin mercado<br />
* Costo <strong><strong>de</strong>l</strong> sorgo $ 1,040.00 ton<br />
Valor <strong>de</strong> los granos <strong>de</strong>stilería (500.00)<br />
Costo <strong>de</strong> la materia prima a <strong>Bioetanol</strong> 540 ton<br />
Costo primo por litro <strong>de</strong> <strong>Bioetanol</strong> 1.35<br />
7. La Yuca<br />
(Manihot sculenta, Crantz, familia euphorbiacea; Sinonimia: Cassava; Mandioca; Tapioca)<br />
Originaria <strong><strong>de</strong>l</strong> trópico sur americano, posiblemente <strong>de</strong> Brasil; cultivada en importantes<br />
superficies <strong>de</strong> Indonesia, Nigeria, El Congo, Tanzania y <strong>de</strong>s<strong>de</strong> luego Brasil.<br />
En México, en <strong>el</strong> año agrícola <strong><strong>de</strong>l</strong> 2004, se cultivaron en la Región Peninsular principalmente,<br />
solo 1,336 hectáreas, en su gran mayoría <strong>de</strong> temporal en <strong>el</strong> estado <strong>de</strong> Tabasco, entidad<br />
s<strong>el</strong>eccionada en <strong>el</strong> presente estudio.<br />
El precio medio rural alcanzó $2,900 pesos por ton<strong>el</strong>ada en la cosecha <strong><strong>de</strong>l</strong> primavera-verano.<br />
Es una planta rústica que se propaga por estacas; es un arbusto que llega a crecer hasta 3<br />
metros y sus raíces son tuberosas <strong>de</strong> 30 a 50 centímetros <strong>de</strong> largo, con alto contenido <strong>de</strong><br />
almidón, cuya concentración alcanza <strong><strong>de</strong>l</strong> 25 al 33% en peso.<br />
Sus rendimientos <strong>de</strong> raíces por hectárea, varían <strong>de</strong> 12 a 25 ton<strong>el</strong>adas.<br />
Sus rendimientos <strong>de</strong> la parte aérea por hectárea varían <strong>de</strong> 30 a 60 ton<strong>el</strong>adas <strong>para</strong> un índice <strong>de</strong><br />
cosecha <strong>de</strong> 0.4<br />
De la plantación a la cosecha <strong>de</strong> las raíces <strong>el</strong> lapso es <strong>de</strong> 8 a 10 meses.<br />
La Yuca es sensible a inundaciones prolongadas y en tal virtud, tomando <strong>el</strong> drenaje <strong>de</strong> los<br />
su<strong>el</strong>os como <strong>el</strong> factor limitante <strong>de</strong> la producción, se tienen aproximadamente 75,000 hectáreas<br />
con muy buen potencial <strong>para</strong> la producción <strong>de</strong> raices <strong>de</strong> Yuca, localizadas en su mayor parte<br />
en <strong>el</strong> Distrito <strong>de</strong> Desarrollo Rural (DDR) 151 <strong>de</strong> Cár<strong>de</strong>nas, Municipio <strong>de</strong> Huimanguillo, en <strong>el</strong><br />
estado <strong>de</strong> Tabasco, siempre que se realicen prácticas <strong>de</strong> fetilización balanceada. A<strong>de</strong>más, si<br />
23
<strong>Potenciales</strong> y <strong>Viabilidad</strong> <strong><strong>de</strong>l</strong> <strong>Uso</strong> <strong>de</strong> <strong>Bioetanol</strong> y <strong>Biodies<strong>el</strong></strong> <strong>para</strong> <strong>el</strong> Transporte en México (SENER-BID-GTZ)<br />
Task 4: Ethanol feedstocks<br />
se realizan los drenajes a<strong>de</strong>cuados, se cuenta con aproximadamente 200 mil hectáreas en los<br />
DDR 150 y 151 <strong>de</strong> mediano potencial <strong>para</strong> <strong>el</strong> cultivo.<br />
Las varieda<strong>de</strong>s que sobresalen en producción <strong>de</strong> raíces son la Esmeralda, Criolla Papa y<br />
Sabanera.<br />
Cabe mencionar que la Yuca se cultiva en especial en su<strong>el</strong>os francamente ácidos, en los cuales<br />
otros cultivos como <strong>el</strong> maíz y <strong>el</strong> frijol, no prosperan. Es una planta que tiene la “habilidad” <strong>de</strong><br />
producir en don<strong>de</strong> otros cultivos no crecen.<br />
Una característica muy positiva <strong>de</strong> la Yuca, es que las raíces pue<strong>de</strong>n permanecer en <strong>el</strong> su<strong>el</strong>o<br />
sin <strong>de</strong>scomponerse, hasta 24 meses. Así, <strong>el</strong> su<strong>el</strong>o representa <strong>el</strong> almacén <strong>de</strong> la materia prima<br />
<strong>para</strong> la producción <strong>de</strong> <strong>Bioetanol</strong>.<br />
7.1 Composición química <strong>de</strong> las raíces. % en peso. Tres cultivares.<br />
Criolla Papa Esmeralda Sabanera<br />
Proteína 1.95 1.68 1.37<br />
Fibra 2.30 1.95 2.74<br />
Grasa 0.36 0.32 0.50<br />
Humedad 58.70 66.24 61.93<br />
Cenizas 2.53 3.31 2.82<br />
Azúcares 1.82 1.77 1.45<br />
Almidón * 76.89 78.42 78.71<br />
*Valor reportado en base seca<br />
7.2 Costo <strong>de</strong> producción <strong>de</strong> la Yuca<br />
Estado <strong>de</strong> Tabasco, año 2004. Cultivo <strong>de</strong> temporal con fertilizante.<br />
Pesos por hectárea.<br />
Pre<strong>para</strong>ción <strong>de</strong> tierras $ 900<br />
Siembra o plantación 850<br />
Fertilización 1,883<br />
Cultivos 784<br />
Control <strong>de</strong> plagas 496<br />
Cosecha 1,150<br />
Acarreo 600<br />
Costo Total por hectárea 6,663<br />
Rendimiento <strong>de</strong> raíces 12 ton<strong>el</strong>adas por ha.<br />
Costo total por ton<strong>el</strong>ada 555.25<br />
Precio <strong>de</strong> venta por ton<strong>el</strong>ada 680<br />
Subsidios gubernamentales 0<br />
Ingreso <strong><strong>de</strong>l</strong> agricultor por ton<strong>el</strong>ada 680<br />
Fuente: SAGARPA D<strong>el</strong>egación Estatal Tabasco<br />
24
<strong>Potenciales</strong> y <strong>Viabilidad</strong> <strong><strong>de</strong>l</strong> <strong>Uso</strong> <strong>de</strong> <strong>Bioetanol</strong> y <strong>Biodies<strong>el</strong></strong> <strong>para</strong> <strong>el</strong> Transporte en México (SENER-BID-GTZ)<br />
Task 4: Ethanol feedstocks<br />
7.3 Análisis económico (sin renta <strong>de</strong> tierra)<br />
Costo por ton<strong>el</strong>ada 555.25<br />
Precio <strong>de</strong> venta <strong>de</strong> las raíces por ton 680<br />
Valor neto <strong>de</strong> los esquilmos 157<br />
Ingreso total <strong>de</strong> la cosecha por ton 837<br />
Margen <strong><strong>de</strong>l</strong> agricultor por ton 281.75<br />
R<strong>el</strong>ación Beneficio-costo 1.51<br />
Rendimiento por peso invertido 2.05<br />
7.4 Costo primo <strong>de</strong> la Yuca en la producción <strong>de</strong> <strong>Bioetanol</strong><br />
Tecnología HPCP<br />
Productos esperados por ton <strong>de</strong> yuca<br />
<strong>Bioetanol</strong> (raíces)<br />
Follaje ver<strong>de</strong> (hojas, pecíolos y tallos)<br />
140 litros<br />
1,500 kilos<br />
Costo <strong>de</strong> la Yuca $ 555.25<br />
Valor neto <strong><strong>de</strong>l</strong> follaje 157<br />
Costo <strong>de</strong> la materia prima a <strong>Bioetanol</strong> 398.25<br />
Costo primo <strong>de</strong> la Yuca <strong>para</strong> <strong>Bioetanol</strong> $ 2.84<br />
Es importante señalar que una mo<strong>de</strong>rna tecnología <strong>de</strong> producción, ha <strong>de</strong>mostrado en nuestros<br />
institutos <strong>de</strong> investigación agrícola y en Institutos y campos comerciales <strong>de</strong> otros lugares <strong><strong>de</strong>l</strong><br />
mundo, que <strong>el</strong> incrementar <strong>de</strong> manera significativa los rendimientos <strong>de</strong> raíces y <strong>de</strong> follajes,<br />
abatiendo <strong>el</strong> costo <strong>de</strong> producción y <strong>el</strong> costo primo, es perfectamente factible.<br />
Los rendimientos potenciales se estiman <strong>de</strong> 20 a 30 ton<strong>el</strong>adas por hectárea, con un contenido<br />
<strong>de</strong> almidón <strong>de</strong> hasta 35%, <strong>de</strong> modo que al consi<strong>de</strong>rar la eficiencia <strong>de</strong> fabricación agroindustrial<br />
en un 70%, se pue<strong>de</strong>n producir hasta 4,630 litros <strong>de</strong> <strong>Bioetanol</strong> por hectárea.<br />
8. Sorgo Dulce (Sorghum bicolor, L., Moench ssp. Sacharatum)<br />
Es una planta anual-C4- Un pasto o zacate <strong>de</strong> origen tropical, con un alto potencial <strong>para</strong> la<br />
producción <strong>de</strong> biomasa, <strong>de</strong>bido a su eficiencia fotosintética.<br />
En <strong>el</strong> mundo se cultiva principalmente en áreas don<strong>de</strong> la lluvia no es suficiente <strong>para</strong> otros<br />
cultivos como <strong>el</strong> maíz y la temperatura, es alta <strong>para</strong> obtener <strong>de</strong> este grano producciones<br />
rentables.<br />
Se adapta a un amplio rango <strong>de</strong> pH <strong>de</strong> los su<strong>el</strong>os (5.5 – 8.2).<br />
25
<strong>Potenciales</strong> y <strong>Viabilidad</strong> <strong><strong>de</strong>l</strong> <strong>Uso</strong> <strong>de</strong> <strong>Bioetanol</strong> y <strong>Biodies<strong>el</strong></strong> <strong>para</strong> <strong>el</strong> Transporte en México (SENER-BID-GTZ)<br />
Task 4: Ethanol feedstocks<br />
En México, se cultivo en <strong>el</strong> centro y sur <strong>de</strong> Sinaloa y Coahuila con muy buenos rendimientos<br />
bajo riego. También en las regiones <strong>de</strong> la Laguna y <strong><strong>de</strong>l</strong> Bajío con la misma tecnología. De<br />
temporal se cultiva también en Sinaloa, en Chihuahua, Guerrero, Michoacán y Jalisco.<br />
Lo producen principalmente <strong>para</strong> autoconsumo en las granjas que explotan ganado lechero.<br />
Las condiciones <strong>para</strong> su cultivo en <strong>el</strong> temporal, se encuentran también en <strong>el</strong> centro-oriente <strong>de</strong><br />
Tamaulipas en don<strong>de</strong> se produce sorgo grano en gran<strong>de</strong>s superficies.<br />
Tanto en <strong>el</strong> riego como en <strong>el</strong> temporal, se le pue<strong>de</strong>n dar hasta cinco cortes en un año, con un<br />
rendimiento acumulado <strong>de</strong> hasta 100 ton<strong>el</strong>adas por hectárea <strong>de</strong> material ver<strong>de</strong> en <strong>el</strong> riego y <strong>de</strong><br />
60 ton<strong>el</strong>adas por hectárea en <strong>el</strong> temporal.<br />
La cosecha es sencilla, totalmente mecanizada y se llegan a obtener en otros países, hasta 30<br />
ton<strong>el</strong>adas <strong>de</strong> materia seca por hectárea y en tal virtud, también hasta 13,000 litros <strong>de</strong> <strong>Bioetanol</strong><br />
por ha. (130 litros por ton<strong>el</strong>ada <strong>de</strong> sorgo) aprovechando las 13 ton<strong>el</strong>adas <strong>de</strong> azúcar <strong>de</strong> sus<br />
jugos y las 10 ton<strong>el</strong>adas <strong>de</strong> su tallos y follajes.<br />
Las cosechas se harían al inicio <strong>de</strong> la floración, impidiendo así la formación <strong>de</strong> grano. La<br />
primera entre los 60 y 80 días a partir <strong>de</strong> la siembra, la segunda y tercera, entre los 40 y 50<br />
días <strong>de</strong>spués <strong><strong>de</strong>l</strong> primero y <strong><strong>de</strong>l</strong> segundo cortes. La experiencia indica que es más eficiente<br />
limitar la cosecha a tres cortes.<br />
Las principales varieda<strong>de</strong>s Híbridas en las regiones <strong>de</strong> Sinaloa y Tamaulipas s<strong>el</strong>eccionadas<br />
<strong>para</strong> <strong>el</strong> cultivo <strong>de</strong> riego y <strong>de</strong> temporal respectivamente son:<br />
Para Culiacán, Sin: Gota <strong>de</strong> Mi<strong>el</strong> (Susweet Conlee) y Cowvittles<br />
Para Tamaulipas: SX16; Buil<strong>de</strong>r y Grazer<br />
La producción nacional en <strong>el</strong> año <strong>de</strong> 2004 fue como sigue:<br />
Cultivo Superficie cosechada (ha) Precio por ton $<br />
Sorgo ver<strong>de</strong> 62,759 308<br />
Sorgo acicalado 10,078 1,048<br />
Sorgo seco 4,189 847<br />
26
<strong>Potenciales</strong> y <strong>Viabilidad</strong> <strong><strong>de</strong>l</strong> <strong>Uso</strong> <strong>de</strong> <strong>Bioetanol</strong> y <strong>Biodies<strong>el</strong></strong> <strong>para</strong> <strong>el</strong> Transporte en México (SENER-BID-GTZ)<br />
Task 4: Ethanol feedstocks<br />
8.1 Composición <strong>de</strong> la planta completa<br />
Por 1,000 kilos <strong>de</strong> tallos mas 399 kilos <strong>de</strong> hojas, pedúnculos y panoja, es <strong>de</strong>cir 1,399 kilos <strong>de</strong><br />
Biomasa:<br />
Agua<br />
1,083 kilos<br />
Materia seca 315<br />
Materia seca:<br />
Sólidos en solución<br />
204 kilos<br />
Insolubles 110<br />
Sólidos en solución:<br />
Azúcares fermentables y almidones 134 kilos<br />
Sólidos no fermentables 70<br />
Insolubles:<br />
Fibra<br />
106 kilos<br />
Cenizas 4<br />
<strong>Bioetanol</strong> <strong>de</strong> fermentables (azúcares y c<strong>el</strong>ulosas) litros por ton<strong>el</strong>adas <strong>de</strong> tallos 132<br />
Producción <strong>de</strong> <strong>Bioetanol</strong> por hectárea:<br />
Riego Temporal<br />
Rendimiento <strong><strong>de</strong>l</strong> sorgo (ton-ha) 100 60<br />
<strong>Bioetanol</strong> (lts) 13,200 7,920<br />
8.2 Sorgo <strong>de</strong> riego en Sinaloa<br />
8.2.1 Costos <strong>de</strong> producción<br />
(cultivo, cosecha y acarreo) en Sinaloa, con tecnología <strong>de</strong> riego, ciclo PV 2005, por hectárea y<br />
por ton<strong>el</strong>ada <strong>de</strong> sorgo ver<strong>de</strong>.<br />
a) Primer corte: producción 40 ton/ha<br />
Pre<strong>para</strong>ción <strong>de</strong> tierras y otras labores mecanizadas $ 2,040<br />
Riego (3 x 80) mano <strong>de</strong> obra 240<br />
Cuota <strong>de</strong> riego 480<br />
Fertilizante 1,800<br />
Insecticida 150<br />
Semilla 290<br />
Cosecha 1,200<br />
Acarreo (flete) 2,857<br />
Costo <strong>de</strong> producción por ha 9,057<br />
Precio <strong><strong>de</strong>l</strong> producto por ton<strong>el</strong>ada 300<br />
27
<strong>Potenciales</strong> y <strong>Viabilidad</strong> <strong><strong>de</strong>l</strong> <strong>Uso</strong> <strong>de</strong> <strong>Bioetanol</strong> y <strong>Biodies<strong>el</strong></strong> <strong>para</strong> <strong>el</strong> Transporte en México (SENER-BID-GTZ)<br />
Task 4: Ethanol feedstocks<br />
b) Segundo corte: producción 35 ton/ha<br />
Labores mecanizadas 300<br />
Fertilizante 570<br />
Riego (2 X 80) 160<br />
Cosecha 1,200<br />
Acarreo (flete) 2,333<br />
Costo <strong>de</strong> producción por ha 4,563<br />
Precio <strong><strong>de</strong>l</strong> producto por ton<strong>el</strong>ada 300<br />
c) Tercer corte: producción 30 ton/ha<br />
Labores mecanizadas 300<br />
Fertilizante 570<br />
Riego (2 X 80) 160<br />
Cosecha 1,200<br />
Acarreo (flete) 2,000<br />
Costo <strong>de</strong> producción por ha 4,230<br />
Precio <strong><strong>de</strong>l</strong> producto por ton<strong>el</strong>ada 300<br />
Costo total <strong>de</strong> producción por ha 17,850<br />
Rendimiento en 3 cortes (tons <strong>de</strong> material ver<strong>de</strong>) 105<br />
Costo por ton<strong>el</strong>ada 170<br />
Costo <strong>de</strong> cultivo por ton<strong>el</strong>ada 67.24<br />
Costo <strong>de</strong> cosecha y acarreo por ton 102.76<br />
8.2.2 Análisis económico (sin renta <strong>de</strong> tierra)<br />
Costo <strong>de</strong> producción por ton $ 170<br />
Precio <strong>de</strong> venta por ton 300<br />
Margen por ton 130<br />
R<strong>el</strong>ación beneficio-costo 1.76<br />
Rendimiento por peso invertido 4.46<br />
Fuente: tecnicos y productores <strong>de</strong> la region.<br />
8.2.3 Costo primo <strong><strong>de</strong>l</strong> sorgo dulce, ver<strong>de</strong>, en la producción <strong>de</strong> <strong>Bioetanol</strong><br />
Rendimiento <strong>de</strong> <strong>Bioetanol</strong> por ton <strong>de</strong> sorgo<br />
94.34 litros<br />
Costo primo 1.80<br />
Con este cultivo como materia prima <strong>para</strong> la producción <strong>de</strong> <strong>Bioetanol</strong>, no se obtienen<br />
esquilmos utilizables, <strong>para</strong> la generación <strong>de</strong> energía térmica y su utilización en <strong>el</strong> proceso por<br />
lixiviación <strong>para</strong> extraer los jugos azucarados en un difusor. En tal virtud, se <strong>de</strong>be trabajar <strong>para</strong><br />
<strong>el</strong> propósito, con pan<strong>el</strong>es <strong>de</strong> energía solar y/o con vapores <strong>de</strong> escape y agua caliente <strong>de</strong><br />
geotermia.<br />
28
<strong>Potenciales</strong> y <strong>Viabilidad</strong> <strong><strong>de</strong>l</strong> <strong>Uso</strong> <strong>de</strong> <strong>Bioetanol</strong> y <strong>Biodies<strong>el</strong></strong> <strong>para</strong> <strong>el</strong> Transporte en México (SENER-BID-GTZ)<br />
Task 4: Ethanol feedstocks<br />
8.3 Sorgo dulce, ver<strong>de</strong> <strong>de</strong> temporal en Tamaulipas<br />
8.3.1 Costo <strong>de</strong> producción por hectárea y por ton<strong>el</strong>ada.<br />
a) Primer corte: producción 25 ton/ha<br />
Pre<strong>para</strong>ción <strong>de</strong> tierras y otras labores mecanizadas $ 1,880<br />
Fertilizante y agroquímicos 2,000<br />
Semilla 200<br />
Cosecha 750<br />
Acarreo (flete) 1,250<br />
Costo <strong>de</strong> producción por ha 6,080<br />
Precio <strong><strong>de</strong>l</strong> producto por ton<strong>el</strong>ada 300<br />
b) Segundo corte: producción 20 ton/ha<br />
Labores mecanizadas 200<br />
Fertilizante y agroquímicos 600<br />
Cosecha 600<br />
Acarreo (flete) 1,000<br />
Costo <strong>de</strong> producción por ha 2,400<br />
Precio <strong><strong>de</strong>l</strong> producto por ton<strong>el</strong>ada 300<br />
c) Tercer corte: producción 15 ton/ha<br />
Labores mecanizadas 200<br />
Fertilizante y agroquímicos 600<br />
Cosecha 450<br />
Acarreo (flete) 750<br />
Costo <strong>de</strong> producción por ha 2,000<br />
Precio <strong><strong>de</strong>l</strong> producto por ton<strong>el</strong>ada 300<br />
Costo total <strong>de</strong> producción por ha 10,480<br />
Rendimiento en 3 cortes (tons <strong>de</strong> material ver<strong>de</strong>) 60<br />
Costo por ton<strong>el</strong>ada 174.67<br />
Costo <strong>de</strong> cultivo por ton<strong>el</strong>ada 94.67<br />
Costo <strong>de</strong> cosecha y acarreo por ton 80.00<br />
8.3.2 Análisis económico (sin renta <strong>de</strong> tierra)<br />
Costo <strong>de</strong> producción por ton $ 174.67<br />
Precio <strong>de</strong> venta por ton 300<br />
Margen por ton 125.33<br />
R<strong>el</strong>ación beneficio-costo 1.72<br />
Rendimiento por peso invertido 3.17<br />
Fuente: tecnicos y productores <strong>de</strong> la región.<br />
29
<strong>Potenciales</strong> y <strong>Viabilidad</strong> <strong><strong>de</strong>l</strong> <strong>Uso</strong> <strong>de</strong> <strong>Bioetanol</strong> y <strong>Biodies<strong>el</strong></strong> <strong>para</strong> <strong>el</strong> Transporte en México (SENER-BID-GTZ)<br />
Task 4: Ethanol feedstocks<br />
8.3.3 Costo primo <strong><strong>de</strong>l</strong> sorgo dulce, ver<strong>de</strong>, <strong>para</strong> la producción <strong>de</strong> bioetanol<br />
Litros <strong>de</strong> <strong>Bioetanol</strong> por ton <strong>de</strong> sorgo 94.34<br />
Litros <strong>de</strong> <strong>Bioetanol</strong> por ha 5,660<br />
Costo primo por litro <strong>de</strong> <strong>Bioetanol</strong> 1.85<br />
8.4. Resumen <strong>de</strong> Costos Primos<br />
Cultivo<br />
Costo primo/lt <strong>Bioetanol</strong><br />
Caña guarapo-riego $ 2.63<br />
Caña entera-riego 1.53<br />
Caña guarapo-temporal 2.96<br />
Caña entera-temporal 1.71<br />
Maíz- riego 1.96<br />
Trigo grano-riego 2.96<br />
Trigo paja 0.87<br />
Trigo combinado: grano-paja 1.93<br />
Remolacha-riego 2.22<br />
Sorgo-temporal 1.35<br />
Yuca temporal 2.84<br />
Sorgo Dulce riego 1.80<br />
Sorgo Dulce Temporal 1.85<br />
30
<strong>Potenciales</strong> y <strong>Viabilidad</strong> <strong><strong>de</strong>l</strong> <strong>Uso</strong> <strong>de</strong> <strong>Bioetanol</strong> y <strong>Biodies<strong>el</strong></strong> <strong>para</strong> <strong>el</strong> Transporte en México (SENER-BID-GTZ)<br />
Task 4: Ethanol feedstocks<br />
9. Determinación <strong>de</strong> la superficie a cultivar y <strong>el</strong> ton<strong>el</strong>aje<br />
necesario, por año, <strong>de</strong> Caña <strong>de</strong> azúcar y maíz, <strong>para</strong> cubrir los<br />
escenarios 2 y 3 planteados en la tarea 2 <strong><strong>de</strong>l</strong> presente estudio.<br />
Escenario 2 “ <strong>Bioetanol</strong> necesario en México <strong>para</strong> sustituir a los éteres que se agregan<br />
actualmente a las gasolinas <strong>de</strong> las zonas metropolitanas”.<br />
Demanda esperada <strong>de</strong> <strong>Bioetanol</strong> anhidro <strong>para</strong> <strong>el</strong> año 2010, oxigenando gasolinas al 1.5% en<br />
peso y requerimientos <strong>de</strong> caña y maíz <strong>para</strong> satisfacerla. Volúmenes y superficies<br />
A cubrir con caña <strong>de</strong> azúcar<br />
Gasolinas <strong>Bioetanol</strong> Jugo a Sup <strong>de</strong> caña Jugo+bagazo Sup <strong>de</strong> caña<br />
<strong>Bioetanol</strong><br />
MM litros en MM litros en M ton tallos M hectáreas M ton tallos M hectáreas<br />
<strong>el</strong> año <strong>el</strong> año caña<br />
caña<br />
19,728 782 9,772 130 5,665 76<br />
A cubrir con maíz<br />
Gasolinas <strong>Bioetanol</strong> Grano <strong>de</strong> maíz Sup <strong>de</strong> maíz<br />
MM litros en <strong>el</strong> año MM litros en <strong>el</strong> año M <strong>de</strong> ton M hectáreas<br />
19,728 782 1,955 196<br />
Escenario 3 “La sustitución <strong><strong>de</strong>l</strong> 10% <strong><strong>de</strong>l</strong> volumen <strong>de</strong> las ventas nacionales <strong>de</strong> gasolinas<br />
(asumiendo una mezcla <strong>de</strong> 10% <strong>de</strong> etanol y 90 <strong>de</strong> gasolinas)”<br />
A cubrir con caña <strong>de</strong> azúcar<br />
Gasolinas <strong>Bioetanol</strong> Jugo a Sup <strong>de</strong> caña Jugo+bagazo Sup <strong>de</strong> caña<br />
<strong>Bioetanol</strong><br />
MM litros en MM litros en M ton tallos M hectáreas M ton tallos M hectáreas<br />
<strong>el</strong> año <strong>el</strong> año caña<br />
caña<br />
44,060 4,406 55,075 734 31,928 426<br />
A cubrir con maíz<br />
Gasolinas <strong>Bioetanol</strong> Grano <strong>de</strong> maíz Sup <strong>de</strong> maíz<br />
MM litros en <strong>el</strong> año MM litros en <strong>el</strong> año M <strong>de</strong> ton M hectáreas<br />
44,060 4,406 11,015 1,102<br />
31
<strong>Potenciales</strong> y <strong>Viabilidad</strong> <strong><strong>de</strong>l</strong> <strong>Uso</strong> <strong>de</strong> <strong>Bioetanol</strong> y <strong>Biodies<strong>el</strong></strong> <strong>para</strong> <strong>el</strong> Transporte en México (SENER-BID-GTZ)<br />
Task 4: Ethanol feedstocks<br />
Se <strong>de</strong>speja como base <strong>de</strong> cálculo, los siguientes parámetros:<br />
Peso volumétrico <strong><strong>de</strong>l</strong> <strong>Bioetanol</strong> 0.794<br />
Peso volumétrico <strong>de</strong> la gasolina 0.730<br />
Peso volumétrico <strong><strong>de</strong>l</strong> MTBE 0.746<br />
Rendimiento <strong>de</strong> caña tallos (ton/ha) 75<br />
Rendimiento <strong>de</strong> caña entera por ton/ ha 98<br />
Rendimiento <strong>de</strong> maíz por ton/ha 10<br />
Rendimiento <strong><strong>de</strong>l</strong> jugo <strong>de</strong> caña a <strong>Bioetanol</strong><br />
80 litros por ton <strong>de</strong> caña<br />
Rendimiento <strong><strong>de</strong>l</strong> jugo <strong>de</strong> caña + fibra a <strong>Bioetanol</strong> 138 lts por ton caña<br />
Rendimiento <strong><strong>de</strong>l</strong> grano <strong>de</strong> maíz a <strong>Bioetanol</strong><br />
400 lts por ton<br />
32
10. Anexo<br />
<strong>Potenciales</strong> y <strong>Viabilidad</strong> <strong><strong>de</strong>l</strong> <strong>Uso</strong> <strong>de</strong> <strong>Bioetanol</strong> y <strong>Biodies<strong>el</strong></strong> <strong>para</strong> <strong>el</strong> Transporte en México (SENER-BID-GTZ)<br />
Task 4: Ethanol feedstocks<br />
I. Las Regiones Cañeras <strong>de</strong> México<br />
Las regiones cañeras <strong>de</strong> la vertiente <strong><strong>de</strong>l</strong> Océano Pacífico están limitadas en cuanto a su latitud<br />
<strong>de</strong>s<strong>de</strong> Tapachula, Chis., a Los Mochis, Sin y <strong>de</strong> Chetumal, Q. Roo hasta Llera, Tamps. En la<br />
vertiente <strong><strong>de</strong>l</strong> Golfo <strong>de</strong> México y <strong>el</strong> Caribe. Debido a la orografía tan acci<strong>de</strong>ntada <strong>de</strong> nuestro<br />
territorio, la altitud es un factor <strong><strong>de</strong>l</strong>imitante <strong>para</strong> su cultivo y en varias zonas <strong>de</strong> Jalisco y<br />
Michoacán situadas a más <strong>de</strong> 1,250 msnm, la caña durante <strong>el</strong> invierno (diciembre a febrero)<br />
está expuesta a bajas temperaturas sufriendo daños por h<strong>el</strong>adas.<br />
La diferencia <strong>de</strong> altura a que se encuentran las regiones cañeras producen tipos <strong>de</strong> climas<br />
distintos en temperatura, entre <strong>el</strong> cálido y <strong>el</strong> templado, pero las mayores variantes se <strong>de</strong>ben<br />
principalmente a la precipitación pluvial; así observamos que a partir <strong>de</strong> las regiones <strong>de</strong><br />
Tabasco y Papaloapan – que tiene las mayores precipitaciones pluviales – las lluvias van<br />
disminuyendo hacia todos los rumbos y marcadamente al noroeste <strong>de</strong>terminando condiciones<br />
<strong>de</strong> humedad muy distintas, como en Sinaloa don<strong>de</strong> la caña solo pue<strong>de</strong> cultivarse con agua <strong>de</strong><br />
riego.<br />
De acuerdo con <strong>el</strong> Prof Contreras, los límites que encierran la porción en que quedan<br />
comprendidas las 14 regiones <strong>de</strong>dicadas al cultivo comercial <strong>de</strong> la caña <strong>para</strong> la fabricación<br />
e azúcar son:<br />
I. Sinaloa<br />
II. Nayarit<br />
III. Jalisco<br />
IV. Colima<br />
V. Michoacán<br />
VI. Balsas<br />
VII. Tehuacán<br />
VIII. A. Istmo<br />
VIII. B. Papaloapan<br />
IX. Chiapas<br />
X. Yucatán<br />
XI. Tabasco<br />
XII. Veracruz Central<br />
XIII. Costa Veracruz<br />
XIV. Huastecas<br />
a) En latitud, <strong>de</strong> los 14º 30’ al extremo sur, <strong>de</strong>s<strong>de</strong> Tapachula, Chis hasta los 26º 00’ al norte<br />
en los Mochis, Sin.<br />
b) En altitud, <strong>de</strong>s<strong>de</strong> unos cuantos metros sobre <strong>el</strong> niv<strong>el</strong> <strong><strong>de</strong>l</strong> mar, don<strong>de</strong> se localizan los<br />
cañaverales <strong>de</strong> Veracruz, Tabasco, Campeche, Quintana Roo, y Sinaloa, hasta 1,400<br />
metros en algunas zonas <strong>de</strong> Jalisco, Michoacán y Puebla.<br />
c) En cuanto a longitud, las extremas se encuentran <strong>de</strong>s<strong>de</strong> Chetumal, Q. Roo a los 89º 00’<br />
hasta Los Mochis, Sin., a los 109º 00’ <strong>de</strong> Greenwich, <strong>de</strong> oriente a poniente.<br />
33
<strong>Potenciales</strong> y <strong>Viabilidad</strong> <strong><strong>de</strong>l</strong> <strong>Uso</strong> <strong>de</strong> <strong>Bioetanol</strong> y <strong>Biodies<strong>el</strong></strong> <strong>para</strong> <strong>el</strong> Transporte en México (SENER-BID-GTZ)<br />
Task 4: Ethanol feedstocks<br />
Para la <strong>de</strong>marcación <strong>de</strong> 14 regiones se formaron grupos <strong>de</strong> ingenios (zonas), con<br />
características similares que se abastecen <strong>de</strong> un área <strong>de</strong> condiciones naturales idénticas; <strong>de</strong><br />
acuerdo con las condiciones geográficas <strong>de</strong> las distintas partes <strong><strong>de</strong>l</strong> territorio nacional don<strong>de</strong> se<br />
encuentran las zonas, se agruparon en “regiones” trazando sus lin<strong>de</strong>ros según los límites<br />
fisiográficos <strong><strong>de</strong>l</strong> país; por lo tanto la extensión que abarca con <strong>el</strong> mapa <strong>de</strong> cada una <strong>de</strong> las<br />
regiones que se <strong>de</strong>scriben, no indica la extensión actual <strong><strong>de</strong>l</strong> cultivo, ni tampoco <strong>el</strong> área en que<br />
pudiera ser introducido en <strong>el</strong> futuro, sino la posición geográfica que en conjunto ocupan las<br />
zonas cañeras <strong>de</strong>ntro <strong>de</strong> la geográfica mexicana.<br />
Región I Sinaloa. Esta situada en la planicie costera <strong><strong>de</strong>l</strong> Océano Pacífico <strong>de</strong>s<strong>de</strong> los 23º 10’ al<br />
sur <strong>de</strong> Mazatlán hasta los 26º 00’ <strong>de</strong> lat N en los Mochis; y la altitud <strong>de</strong> los terrenos es <strong>de</strong> 7 a<br />
22 m. El clima es seco con régimen uniforme <strong>de</strong> temperatura; la precipitación pluvial es <strong>de</strong><br />
300 mm anuales, cantidad insuficiente <strong>para</strong> <strong>el</strong> cultivo <strong>de</strong> la caña por lo que es indispensable <strong>el</strong><br />
agua <strong>para</strong> riego. Cuenta con tres ingenios, que son:<br />
Zona I Los Mochis Altitud<br />
1, Los Mochis 15 m<br />
Zona II<br />
Culiacán, Sin<br />
2. La Primavera 12 m<br />
3. El Dorado 7 m<br />
Región II Nayarit.- Se localiza en las estribaciones <strong>de</strong> la Sierra Madre Occi<strong>de</strong>ntal y <strong>el</strong><br />
<strong>para</strong>l<strong>el</strong>o 21º 30’ <strong>de</strong> lat N, y <strong>el</strong> meridiano 105º <strong>de</strong> long Oeste, fijan más o menos <strong>el</strong> centro <strong><strong>de</strong>l</strong><br />
Valle <strong>de</strong> Tepic, con terrenos ondulados, <strong>de</strong> buen drenaje natural, situados <strong>de</strong> 600 a 950 msnm.<br />
El clima es <strong>de</strong> ligero a mo<strong>de</strong>radamente húmedo; la precipitación pluvial es <strong>de</strong> alre<strong>de</strong>dor <strong>de</strong><br />
1300 mm anuales, con <strong>de</strong>ficiencia <strong>de</strong> unos 200 mm en la primavera y 400 mm <strong>de</strong> exce<strong>de</strong>nte<br />
<strong>de</strong> julio a octubre. Semicálido con régimen uniforme <strong>de</strong> temperatura. El 30% <strong>de</strong> la superficie<br />
en cultivo cuenta con agua <strong>para</strong> riego y <strong>el</strong> 70% restante es temporal. Tiene 2 ingenios que<br />
son:<br />
Zona III Tepic, Nay Altitud<br />
4. Puga 686 m<br />
5. El Molino 922 m<br />
Región III Jalisco.- Ubicada en la porción sureste <strong>de</strong> la altiplanicie, limitada al poniente por<br />
la Sierra Madre Occi<strong>de</strong>ntal y al sur por Eje Volcánico, entre los 19º 30’ a los 21º 00’ Lat. N.<br />
Los terrenos cañeros se encuentran <strong>de</strong>s<strong>de</strong> 360 m en Casimiro Castillo hasta 1450 m <strong>de</strong> altitud<br />
en Tala y Ameca. Esta región es la <strong>de</strong> mayor altitud <strong>de</strong> todas las <strong><strong>de</strong>l</strong> país.<br />
Clima semiseco, con <strong>de</strong>ficiencia pluvial <strong>de</strong> unos 300 mm en invierno y pequeño exce<strong>de</strong>nte <strong>de</strong><br />
150 mm en otoño; semicálido a templado con régimen uniforme <strong>de</strong> temperatura. La media<br />
anual es <strong>de</strong> 22º C, llegando a 24º C en junio y bajando a 17º en enero. La máxima absoluta<br />
su<strong>el</strong>e llegar a 40º C. En Ameca y Tala se han presentado temperaturas <strong>de</strong> 5º C bajo cero y<br />
34
<strong>Potenciales</strong> y <strong>Viabilidad</strong> <strong><strong>de</strong>l</strong> <strong>Uso</strong> <strong>de</strong> <strong>Bioetanol</strong> y <strong>Biodies<strong>el</strong></strong> <strong>para</strong> <strong>el</strong> Transporte en México (SENER-BID-GTZ)<br />
Task 4: Ethanol feedstocks<br />
todos los años ocurren daños por h<strong>el</strong>adas. El 80% <strong>de</strong> la superficie se cultiva bajo riego y <strong>el</strong><br />
20% <strong>de</strong> temporal. Existen 6 ingenios, que son:<br />
Zona IV Ameca Jal Altitud<br />
6. San Francisco A 1,235 m<br />
7, Jose M Martínez 1,300 m<br />
Zona V<br />
Zona VI<br />
Zona VII<br />
Acatlán, Jal.<br />
8. B<strong>el</strong>lavista 1,358 m<br />
9. M<strong>el</strong>chor Ocampo 1,200 m<br />
Tamazula, Jal<br />
10. Tamazula 1,235 m<br />
Casimiro Castillo, Jal.<br />
11. José M. Mor<strong>el</strong>os 360 m<br />
Región IV Colima.- Se localiza en las estribaciones <strong><strong>de</strong>l</strong> extremo occi<strong>de</strong>ntal <strong><strong>de</strong>l</strong> Eje Volcánico,<br />
entre los 19º 00’ y 19º 30’ Lat. N con alturas <strong>de</strong> 780 a 1380 msnm. El clima es semiseco, con<br />
<strong>de</strong>ficiencia pluvial en la mayor parte <strong><strong>de</strong>l</strong> año llegando a un total <strong>de</strong> 400 mm y con pequeño<br />
exce<strong>de</strong>nte <strong>de</strong> unos 100 mm en <strong>el</strong> otoño; cálido a templado-cálido, con régimen uniforme <strong>de</strong><br />
temperatura. Tiene 2 ingenios, <strong>el</strong> 60% con terrenos <strong>de</strong> temporal y <strong>el</strong> 40% <strong>de</strong> riego.<br />
Zona VIII Quesería, Col Altitud<br />
12. Quesería 1,300 m<br />
Zona IX Tecatitlán, Jal 1,050 m<br />
*La Purísima<br />
(esta inactivo)<br />
Región V Michoacán.- Se encuentra en <strong>el</strong> Valle <strong><strong>de</strong>l</strong> Balsas, sobre <strong>el</strong> <strong>de</strong>clive norte <strong>de</strong> la<br />
cuenca, entre los 18º 30’ y 19º 30’ Lat. N. Altura <strong>de</strong> los terrenos entre los 900 a 1400 msnm.<br />
Clima, ligeramente húmedo y semihúmedo, con <strong>de</strong>ficiencia pluvial <strong>de</strong> 300 mm en invierno y<br />
exce<strong>de</strong>ntes <strong>de</strong> 200 a 600 mm en verano; semicálido, con régimen uniforme <strong>de</strong> temperatura.<br />
En la zona <strong>de</strong> Los Reyes, ocurren daños por bajas temperaturas (h<strong>el</strong>adas). Cuenta con 4<br />
ingenios, que son:<br />
Zona X. Los Reyes, Mich Altitud<br />
13. Santa Clara 1,335 m<br />
14. San Sebastián 1,280 m<br />
Zona XI.<br />
Zona XII<br />
Uruapan, Mich<br />
15. Lázaro Cár<strong>de</strong>nas 900 m<br />
Tacámbaro, Mich.<br />
16. Pe<strong>de</strong>rnales 900 m<br />
35
<strong>Potenciales</strong> y <strong>Viabilidad</strong> <strong><strong>de</strong>l</strong> <strong>Uso</strong> <strong>de</strong> <strong>Bioetanol</strong> y <strong>Biodies<strong>el</strong></strong> <strong>para</strong> <strong>el</strong> Transporte en México (SENER-BID-GTZ)<br />
Task 4: Ethanol feedstocks<br />
Región VI Balsas.- Esta pertenece también a la cuenca hidrográfica <strong><strong>de</strong>l</strong> Río Balsas y se<br />
localiza entre los 17º 30’ y los 19º 00’ en porciones <strong>de</strong> los estados <strong>de</strong> Puebla, Mor<strong>el</strong>os y<br />
Guerrero. La altura <strong>de</strong> los terrenos varía <strong>de</strong>s<strong>de</strong> 728 m en Iguala, Gro hasta 1,444 m en<br />
Raboso, Pue. Climas: ligeramente húmedo a semiseco, con <strong>de</strong>ficiencia pluvial <strong>de</strong> 300 a 600<br />
mm en invierno y exce<strong>de</strong>ntes <strong>de</strong> menos <strong>de</strong> 100 a 200 mm en verano: cálido a templado-cálido,<br />
con régimen uniforme <strong>de</strong> temperatura. En la zona <strong>de</strong> Izúcar y Tepeojuma, Pue., ocurren<br />
h<strong>el</strong>adas eventuales. A la fecha hay 3 ingenios que son:<br />
Zona XIII. Jojutla , Mor Altitud<br />
17. E. Zapata 998 m<br />
Zona XIV.<br />
Zona XV.<br />
Cuautla, Mor<br />
18. Casasano 1,300 m<br />
Izucar, Pue<br />
19. Atencingo 1,098 m<br />
Región VII Tehuacan.- Se localiza en las faldas <strong>de</strong> la vertiente occi<strong>de</strong>ntal <strong>de</strong> la Sierra Madre<br />
Oriental, con alturas <strong>de</strong> 900 a 1,200 msnm, entre los 18º 30’ Lat N. y 97º 30’ Long. W. Queda<br />
<strong>de</strong>ntro <strong>de</strong> una estrecha franja <strong>de</strong> marcada ari<strong>de</strong>z que se extien<strong>de</strong> <strong>de</strong>s<strong>de</strong> la hacienda Buenavista,<br />
cerca <strong>de</strong> Tehuacan, Pue., hasta Cuicatlán, Oax. Los terrenos son <strong>de</strong> riego y los campos <strong>de</strong><br />
caña se encuentran en las márgenes <strong><strong>de</strong>l</strong> Rió Salado, cuenta con un ingenio.<br />
Zona XVI. Tehuacan, Pue. Altitud<br />
20. Calipam 1,100 m<br />
Región VIII- A) Istmo.- Está situada en la parte que compren<strong>de</strong> <strong>el</strong> Istmo <strong>de</strong> Tehuantepec. En<br />
las cuatro quintas partes <strong>de</strong> su longitud, a partir <strong><strong>de</strong>l</strong> norte, esta franja tiene drenaje hacia <strong>el</strong><br />
Golfo <strong>de</strong> México por los ríos San Juan, Tesechoacan y <strong>el</strong> Coatzacoalcos; la parte restante,<br />
escurre por <strong>el</strong> Océano Pacífico. Su posición geográfica es entre los 16º 00’ a 16º 40 Lat. N.<br />
La altura <strong>de</strong> los terrenos fluctúa entre 90 a 120 m. Clima semiseco, con prolongada <strong>de</strong>ficiencia<br />
pluvial (generalmente <strong>de</strong>s<strong>de</strong> fines <strong><strong>de</strong>l</strong> otoño hasta la primavera inclusive) ascendiendo en total<br />
a 700 mm y con exce<strong>de</strong>nte <strong>de</strong> lluvia <strong>de</strong> 400 mm en verano; cálido con régimen uniforme <strong>de</strong><br />
temperatura. En esta zona azotan unos vientos conocidos con <strong>el</strong> nombre <strong>de</strong> “El Tehuano”,<br />
persistentes y violentos, que soplan durante 4 meses <strong><strong>de</strong>l</strong> año, aumentando la<br />
evapotranspiración y la sequedad <strong><strong>de</strong>l</strong> ambiente. El cultivo es 100% <strong>de</strong> riego y sólo hay un<br />
ingenio.<br />
Zona XVII. Juchitán, Oax Altitud<br />
21. Santo Domingo 90 m<br />
36
<strong>Potenciales</strong> y <strong>Viabilidad</strong> <strong><strong>de</strong>l</strong> <strong>Uso</strong> <strong>de</strong> <strong>Bioetanol</strong> y <strong>Biodies<strong>el</strong></strong> <strong>para</strong> <strong>el</strong> Transporte en México (SENER-BID-GTZ)<br />
Task 4: Ethanol feedstocks<br />
Región VIII-B) Papaloapan. Se localiza en la Cuenca <strong><strong>de</strong>l</strong> Papaloapan cubriendo áreas <strong>de</strong><br />
Veracruz y Oaxaca, entre lo 17º 45’ y 19º 00’ Lat. N. Los terrenos cañeros están <strong>de</strong> 3 a 150<br />
msnm, muchos con problemas <strong>de</strong> mal drenaje interno. El clima es semihúmedo, con<br />
<strong>de</strong>ficiencia pluvial <strong>de</strong> unos 400 mm en primavera y exce<strong>de</strong>nte <strong>de</strong> 400 mm aproximadamente<br />
en otoño; con régimen uniforme <strong>de</strong> temperatura. Todas las tierras <strong>para</strong> caña son <strong>de</strong> temporal.<br />
Existen 5 ingenios.<br />
Zona XVIII. Cuatotolapan, Ver. Altitud<br />
22. Cuatotolapan 13 m<br />
Zona XVX<br />
Papaloapan, Ver<br />
23. San Cristóbal 10 m<br />
24. San Gabri<strong>el</strong> 10 m<br />
25.Tres Valles 28 m<br />
26, A. López Mateos 35 m<br />
Región IX Chiapas.- Cuenta con 2 zonas, una en la costa <strong><strong>de</strong>l</strong> Océano Pacífico, cerca <strong>de</strong><br />
Huixtla entre los <strong>para</strong>l<strong>el</strong>os 14º 30’ y 15º 00’ Lat. N. con terrenos <strong>de</strong> temporal <strong>de</strong> mal drenaje<br />
interno, situados <strong>de</strong> 5 a 250 msnm. Clima húmedo con <strong>de</strong>ficiencia pluvial <strong>de</strong> 400 mm en<br />
invierno y gran exce<strong>de</strong>nte <strong>de</strong> 1,400 mm durante <strong>el</strong> verano. La otra zona correspon<strong>de</strong> a la<br />
vertiente <strong><strong>de</strong>l</strong> Golfo <strong>de</strong> México, con <strong>el</strong> sistema pluvial <strong><strong>de</strong>l</strong> Río Grijalva, cerca <strong>de</strong> Comitán,<br />
cuyos terrenos son <strong>de</strong>niego y se localizan entre 500 a 600 msnm. El estado <strong>de</strong> Chiapas tiene 2<br />
ingenios, que son:<br />
Zona XX Huixtla, Chis. Altitud<br />
27. Huixtla 20 m<br />
Zona XXI<br />
V. Carranza, Chis.<br />
28. Pujiltic 522 m<br />
Región X Península <strong>de</strong> Yucatán.- Es una planicie <strong>de</strong> suave pendiente <strong>de</strong> sur a norte, don<strong>de</strong><br />
los vientos dominantes soplan <strong><strong>de</strong>l</strong> este proce<strong>de</strong>ntes <strong><strong>de</strong>l</strong> Mar Caribe. La parte Oeste es azotada<br />
durante <strong>el</strong> invierno por los nortes <strong><strong>de</strong>l</strong> Golfo <strong>de</strong> México. Se localiza entre los 18º15’ y 20º 15’<br />
Lat. N., cubriendo los estados <strong>de</strong> Campeche y Quintana Roo, pues en Yucatán sólo existe una<br />
zona piloncillera en Oxkutzcab y Tekax.<br />
Las lluvias se inician en mayo y terminan en octubre, pero son insuficientes <strong>para</strong> abastecer <strong>el</strong><br />
cultivo, por lo que la caña requiere 2 riegos <strong>de</strong> auxilio durante los meses <strong>de</strong> estiaje, en la<br />
primavera. La altura <strong>de</strong> los terrenos fluctúa entre 10 a 40 msnm. El clima es semiseco, sin<br />
exce<strong>de</strong>nte pluvial en ninguna época <strong><strong>de</strong>l</strong> año y con una <strong>de</strong>ficiencia <strong>de</strong> 350 mm; cálido, con<br />
régimen uniforme <strong>de</strong> temperatura. Tiene 2 ingenios don<strong>de</strong> <strong>el</strong> 80% <strong>de</strong> sus tierras son <strong>de</strong><br />
temporal y <strong>el</strong> 20% cuenta con pozos <strong>para</strong> riegos <strong>de</strong> auxilio.<br />
37
<strong>Potenciales</strong> y <strong>Viabilidad</strong> <strong><strong>de</strong>l</strong> <strong>Uso</strong> <strong>de</strong> <strong>Bioetanol</strong> y <strong>Biodies<strong>el</strong></strong> <strong>para</strong> <strong>el</strong> Transporte en México (SENER-BID-GTZ)<br />
Task 4: Ethanol feedstocks<br />
Zona XXII Chetumal, Q. Roo Altitud<br />
29. San Rafa<strong>el</strong> 15 m<br />
Zona XXIII<br />
Champotón, Cam.<br />
30. La Joya 8 m<br />
Región XI Tabasco.- Exceptuando la zona cañera <strong>de</strong> los ingenios San Pedro y San Francisco<br />
cerca <strong>de</strong> la costa en Lerdo Ver., las otras áreas se encuentran en la gran planicie tabasqueña en<br />
la parte que ocupan las vegas <strong><strong>de</strong>l</strong> Usumacinta y <strong>el</strong> Grijalva en las poblaciones <strong>de</strong> Tenosique,<br />
Tlacotalpa y Cár<strong>de</strong>nas. Con gran precipitación pluvial tanto en las sierras que la limitan por <strong>el</strong><br />
sur como en la planicie misma, estos ríos cerca <strong><strong>de</strong>l</strong> litoral forman pantanos y canales durante<br />
parte <strong><strong>de</strong>l</strong> año.<br />
La parte <strong>de</strong> la costa <strong>de</strong> Veracruz que hemos asociado con Tabasco es más o menos tan húmeda<br />
como la <strong>de</strong> La Chontalpa, <strong>de</strong>bido a la influencia <strong>de</strong> la región <strong>de</strong> los Tuxtlas y <strong><strong>de</strong>l</strong> volcán <strong>de</strong><br />
San Martín, Ver. Toda esta región cañera se encuentra entre los <strong>para</strong>l<strong>el</strong>os 17º 30’ y 19º 00’<br />
Lat. N. Los terrenos fluctúan <strong>de</strong> 5 a 100 msnm, la mayoría en Tabasco con problemas <strong>de</strong> mal<br />
drenaje interno, y <strong>el</strong> manto freático muy cerca <strong>de</strong> la superficie <strong><strong>de</strong>l</strong> su<strong>el</strong>o. Clima húmedo a<br />
superhúmedo, con pequeña <strong>de</strong>ficiencia pluvial <strong>de</strong> 150 mm en la primavera y gran exce<strong>de</strong>nte<br />
en verano-otoño, entre 500 a 2000 mm; cálido con régimen muy uniforme <strong>de</strong> temperatura.<br />
Cuenta con 6 ingenios que son:<br />
Zona XXIV Tenosique, Tab. Altitud<br />
31. Azuremex 80 m<br />
Zona XXV<br />
Zona XXVI<br />
Zona XXVII<br />
Tlacotalpa, Tab.<br />
32. Dos Patrias 60 m<br />
Cár<strong>de</strong>nas, Tab.<br />
33. Santa Rosalia 30 m<br />
34. Pdte B. Juárez 30 m<br />
Lerdo <strong>de</strong> Tejada, Ver.<br />
35. San Pedro 8 m<br />
36. San Francisco 8 m<br />
Región XII Veracruz Central.- Esta región se caracteriza por ser <strong>el</strong> <strong>de</strong>clive oriental más<br />
pronunciado <strong>de</strong> la Sierra Madre Oriental, con una topografía muy acci<strong>de</strong>ntada; sin embargo<br />
fuera <strong>de</strong> las serranías, pue<strong>de</strong>n distinguirse 3 fases en <strong>el</strong> <strong>de</strong>scenso <strong><strong>de</strong>l</strong> terreno hacia <strong>el</strong> litoral: la<br />
primera son pequeños Valles como los <strong>de</strong> Orizaba, Maltrata y Coatepec; la segunda son<br />
planicies o Valles más amplios como los <strong>de</strong> Córdoba y Huatusco, y la tercera que forma una<br />
extensa planicie costera, con suave pendiente al litoral, escasa vegetación, menor precipitación<br />
y su<strong>el</strong>os <strong><strong>de</strong>l</strong>gados <strong>de</strong> menor calidad.<br />
Las zonas cañeras se encuentran en estos 3 escalones, por lo tanto dadas sus alturas y<br />
topografía no hay uniformidad climatológica. La <strong><strong>de</strong>l</strong>imitación geográfica queda entre los<br />
38
<strong>Potenciales</strong> y <strong>Viabilidad</strong> <strong><strong>de</strong>l</strong> <strong>Uso</strong> <strong>de</strong> <strong>Bioetanol</strong> y <strong>Biodies<strong>el</strong></strong> <strong>para</strong> <strong>el</strong> Transporte en México (SENER-BID-GTZ)<br />
Task 4: Ethanol feedstocks<br />
<strong>para</strong>l<strong>el</strong>os 18º 30’ y 19º 30’ Lat, N y la altura <strong>de</strong> los terrenos <strong>de</strong> 50 a 1400msnm. Clima: muy<br />
húmedo y superhúmedo con <strong>de</strong>ficiencia pluvial casi nula en primavera y exce<strong>de</strong>nte hasta <strong>de</strong><br />
1,200 mm, en verano-otoño, cálido y templado a cálido, con régimen uniforme <strong>de</strong> temperatura.<br />
Tiene 13 ingenios, que en su mayoría cultivan la caña <strong>de</strong> temporal y alre<strong>de</strong>dor <strong><strong>de</strong>l</strong> 10 al 20%,<br />
con riego que son:<br />
Zona XXVIII Tezonapa, Ver. Altitud<br />
37. Don Pablo Machado 104 m<br />
38. El Refugio 95 m<br />
39. Constancia 283 m<br />
40. Motzorongo 260 m<br />
41. La Provi<strong>de</strong>ncia 390 m<br />
42. S. Jose <strong>de</strong> Abajo 400 m<br />
Zona XXIX<br />
Zona XXX<br />
Córdoba, Ver.<br />
43. San Migu<strong>el</strong>ito 778 m<br />
44. San Nicolás 648 m<br />
45. El Carmen 1,050 m<br />
El Potrero, Ver<br />
46. El Potrero 606 m<br />
47. C.Progreso 476 m<br />
Zona XXXI<br />
Xalapa, Ver.<br />
48. La Concepción 1,252 m<br />
49. Mahuixtlán 1,336 m<br />
Región XIII Costa <strong>de</strong> Veracruz. Esta región <strong>de</strong> hecho es una prolongación <strong>de</strong> la anterior, su<br />
clima correspon<strong>de</strong> a la disminución gradual <strong>de</strong> humedad y aumento <strong>de</strong> la temperatura que se<br />
presenta en la planicie costera <strong>de</strong> Veracruz, a medida que se aproxima al litoral. La estación<br />
seca se manifiesta con toda claridad y abarca <strong>de</strong> noviembre a mayo.<br />
Esta situada entre los 19º 15’ y 20º 30’ Lat. N. y los campos <strong>de</strong> caña se localizan entre 10<br />
hasta 150 m <strong>de</strong> altitud. El clima es semiseco con <strong>de</strong>ficiencia pluvial hasta <strong>de</strong> 500 mm en<br />
primavera y un exce<strong>de</strong>nte <strong>de</strong> 150 en verano; cálido con régimen uniforme <strong>de</strong> temperatura. No<br />
se registran h<strong>el</strong>adas, sino que los “nortes” producen enfriamientos acompañados <strong>de</strong> lloviznas<br />
persistentes y vientos fuertes. Tiene 2 ingenios con terrenos <strong>de</strong> riego y 1 <strong>de</strong> temporal.<br />
Zona XXXII Car<strong><strong>de</strong>l</strong>, Ver Altitud<br />
50. El Mo<strong><strong>de</strong>l</strong>o 7 m<br />
51 La Gloria 7 m<br />
Zona XXXIII<br />
M <strong>de</strong> la Torre, ver<br />
52. In<strong>de</strong>pen<strong>de</strong>ncia 151 m<br />
39
<strong>Potenciales</strong> y <strong>Viabilidad</strong> <strong><strong>de</strong>l</strong> <strong>Uso</strong> <strong>de</strong> <strong>Bioetanol</strong> y <strong>Biodies<strong>el</strong></strong> <strong>para</strong> <strong>el</strong> Transporte en México (SENER-BID-GTZ)<br />
Task 4: Ethanol feedstocks<br />
Región XIV Huastecas.- Esta región queda bien <strong>de</strong>finida por la serie <strong>de</strong> barrancas, cañones y<br />
estrechos valles <strong>de</strong> los afluentes <strong>de</strong> los ríos Tamesí y Pánuco, junto con la planicie costera<br />
inmediata <strong>de</strong>s<strong>de</strong> cerca <strong><strong>de</strong>l</strong> puerto <strong>de</strong> Tampico al norte, hasta la sierra <strong>de</strong> Otontepec, al sur.<br />
Esta ubicada en los estados <strong>de</strong> Tamaulipas, San Luis Potosí y norte <strong>de</strong> Veracruz, entre los<br />
<strong>para</strong>l<strong>el</strong>os 21º 30’ y 23º 00’ Lat. N. y los terrenos cañeros están <strong>de</strong> 10 a 150 msnm.<br />
Climas: Semiseco a mo<strong>de</strong>radamente húmedo, con <strong>de</strong>ficiencia pluvial entre 100 a 200 mm en<br />
primavera y exce<strong>de</strong>nte en verano y otoño entre 100 a 780 mm; cálido con régimen uniforme<br />
<strong>de</strong> temperatura. En ciertos años bajan las temperaturas en diciembre y enero y causan graves<br />
daños por h<strong>el</strong>adas. Existen 8 ingenios en la región, 3 cuentan con agua <strong>para</strong> riego y 5 son<br />
<strong>para</strong> cultivo <strong>de</strong> temporal.<br />
Zona XXXIV Pánuco, Ver Altitud<br />
53. Zapoapita 10 m<br />
54. El Higo 78 m<br />
Zona XXXV<br />
Zona XXXVI<br />
Cd. Valles, SLP<br />
55. Plan <strong>de</strong> Ayala 87 m<br />
56. Alianza Popular 92 m<br />
57. P. <strong>de</strong> Sn Luis 95 m<br />
58. S.M <strong><strong>de</strong>l</strong> Naranjo 100 m<br />
Cd. Mante, Tamps.<br />
59. El Mante 80 m<br />
60. A. Saenz Garza 131 m<br />
Para la se<strong>para</strong>ción y <strong><strong>de</strong>l</strong>imitación <strong>de</strong> las regiones cañeras, <strong>el</strong> Prof, Contreras Arias, consi<strong>de</strong>ró<br />
las características fisiográficas <strong>de</strong> las porciones <strong><strong>de</strong>l</strong> país en que se encuentran los acci<strong>de</strong>ntes<br />
geográficos sobresalientes que más influyen en <strong>el</strong>las; por lo tanto, <strong>el</strong> clima no es uniforme<br />
<strong>de</strong>ntro <strong>de</strong> cada una <strong>de</strong> las regiones, dado lo acci<strong>de</strong>ntado <strong>de</strong> la topografía <strong><strong>de</strong>l</strong> territorio<br />
mexicano; sin embargo, sí es posible discernir cuáles son las variantes climatológicas en una<br />
zona cañera <strong>de</strong>terminada, conociendo su posición r<strong>el</strong>ativa <strong>de</strong>ntro <strong>de</strong> la región y su altura sobre<br />
<strong>el</strong> niv<strong>el</strong> <strong><strong>de</strong>l</strong> mar. Esta información será muy valiosa en <strong>el</strong> proceso que seguimos <strong>para</strong> la<br />
s<strong>el</strong>ección <strong>de</strong> las varieda<strong>de</strong>s comerciales <strong>de</strong> caña.<br />
Un balance general <strong>de</strong> las características climáticas <strong>de</strong> las regiones mencionadas, hace<br />
notar lo siguiente:<br />
Dada la dispersión en que se encuentran y la acci<strong>de</strong>ntada topografía <strong>de</strong> nuestro territorio, esto<br />
origina una gran diversidad <strong>de</strong> climas en las zonas cañeras.<br />
Des<strong>de</strong> <strong>el</strong> punto <strong>de</strong> vista <strong>de</strong> la latitud en que se encuentran, has lugares como Los Mochis, Sin.<br />
Y El Mante, Tamps., don<strong>de</strong> los enfriamientos <strong><strong>de</strong>l</strong> tipo <strong>de</strong> h<strong>el</strong>adas causan daños a la caña<br />
durante <strong>el</strong> invierno. En cuanto a la altitud, en varias localida<strong>de</strong>s <strong>de</strong> Jalisco, Michoacán y<br />
Puebla, situadas a más <strong>de</strong> 1,300 msnm, la caña también está expuesta a las h<strong>el</strong>adas.<br />
40
<strong>Potenciales</strong> y <strong>Viabilidad</strong> <strong><strong>de</strong>l</strong> <strong>Uso</strong> <strong>de</strong> <strong>Bioetanol</strong> y <strong>Biodies<strong>el</strong></strong> <strong>para</strong> <strong>el</strong> Transporte en México (SENER-BID-GTZ)<br />
Task 4: Ethanol feedstocks<br />
Las condiciones <strong>de</strong> humedad difieren mucho en <strong>el</strong> conjunto <strong>de</strong> todas las regiones en cuanto al<br />
aprovisionamiento <strong>de</strong> agua <strong>para</strong> riego <strong>de</strong> la caña; tal es <strong>el</strong> caso <strong>de</strong> los ingenios <strong><strong>de</strong>l</strong> estado <strong>de</strong><br />
San Luis Potosí, don<strong>de</strong> la sequía causa severos estragos, en contraste con los <strong>de</strong> Tabasco,<br />
don<strong>de</strong> la precipitación e abundante.<br />
Como fenómenos metereológicos intensos, los llamados “nortes” son frecuentes durante <strong>el</strong><br />
período <strong>de</strong> la zafra en todas las zonas cañeras <strong>de</strong> la vertiente <strong><strong>de</strong>l</strong> Golfo <strong>de</strong> México,<br />
acompañados <strong>de</strong> nublados, lloviznas (chips-chipi) y niebla. También se consi<strong>de</strong>ra perjudicial<br />
<strong>el</strong> efecto <strong>de</strong> los ciclones tropicales o huracanes, que son vientos muy violentos y<br />
precipitaciones diluvianas, su<strong>el</strong>en azotar las costas <strong><strong>de</strong>l</strong> país.<br />
Con excepción <strong>de</strong> las zonas <strong>de</strong> Tabasco y algunas <strong>de</strong> Chiapas y Veracruz, cuyo balance<br />
pluviométrico muestra plena satisfacción <strong>de</strong> las necesida<strong>de</strong>s <strong><strong>de</strong>l</strong> cultivo <strong>de</strong> la caña <strong>de</strong> temporal,<br />
en todas las zonas restantes se requieren por lo menos 2 riegos <strong>de</strong> auxilio durante <strong>el</strong> período <strong>de</strong><br />
estiaje <strong>para</strong> po<strong>de</strong>r lograr un rendimiento <strong>de</strong> 70 ton/caña/ha., promedio (plantilla, soca y<br />
resoca).<br />
41
<strong>Potenciales</strong> y <strong>Viabilidad</strong> <strong><strong>de</strong>l</strong> <strong>Uso</strong> <strong>de</strong> <strong>Bioetanol</strong> y <strong>Biodies<strong>el</strong></strong> <strong>para</strong> <strong>el</strong> Transporte en México (SENER-BID-GTZ)<br />
Task 4: Ethanol feedstocks<br />
11. Bibliografía<br />
BBI International Consulting Division.2005. “Feasibility Study for Ethanol Production in<br />
Mexico from Sugar Cane and Maize”.<br />
Banco <strong>de</strong> Crédito Rural <strong><strong>de</strong>l</strong> Noroeste, S.A.1984. “El cultivo <strong>de</strong> la remolacha azucarera<br />
utilizada como forraje”.<br />
Comité <strong>de</strong> la Agroindustria Azucarera. “Desarrollo Operativo Campo-fábrica. Zafra 2003-04”.<br />
De Carvalho Macedo, Isaias.2005.”Sugar Cane”s Energy. UNICA<br />
Ethanol Producer Magazine. Abril 2006<br />
Flores Cáceres Silverio. 2001.“Las Varieda<strong>de</strong>s <strong>de</strong> Caña <strong>de</strong> Azúcar en Mexico”<br />
F<strong>el</strong>lenberg Gunter. 2000.“The Chemistry of Pollution. Wiley.England.<br />
Geplcea/PNUD/RLA/86/011.”La Diversificación <strong>de</strong> la Agroindustria <strong>de</strong> la Caña <strong>de</strong> Azúcar en<br />
América Latina y <strong>el</strong> Caribe.<br />
Imperial County.2004. “Agricultural Crop & Livestock Report”.<br />
Kosaric, N; Vardar-Sukan, F; Pieper, H.J. 2001. “The Biotechnology of Ethanol.<br />
Matthews, R and Mortimer, D.2003. “Carbon and energy balances for range of biofu<strong>el</strong>s<br />
options.<br />
Secretaria <strong>de</strong> Agricultura, Gana<strong>de</strong>ría, Desarrollo Rural, Pesca y Alimentación. Anuario<br />
Estadístico <strong>de</strong> la producción agrícola. Año 2004. www.sagarpa.gob.mx<br />
Servicio <strong>de</strong> Información y Estadística Agroalimentaria y pesquera.(SIAP).<br />
www.siap.sagarpa.gob.mx<br />
Unión Nacional <strong>de</strong> Cañeros. CNPR. 2005. “Estadísticas <strong>de</strong> la Agroindustria <strong>de</strong> la Caña <strong>de</strong><br />
Azúcar”.<br />
University of California. “Gui<strong><strong>de</strong>l</strong>ines to production cost and practices Imperial County. Fi<strong>el</strong>d<br />
Crops 2004-2005.<br />
42
Task 5: Ethanol and ETBE production and end-use in Mexico<br />
Luiz Augusto Horta Nogueira
<strong>Potenciales</strong> y <strong>Viabilidad</strong> <strong><strong>de</strong>l</strong> <strong>Uso</strong> <strong>de</strong> <strong>Bioetanol</strong> y <strong>Biodies<strong>el</strong></strong> <strong>para</strong> <strong>el</strong> Transporte en México (SENER-BID-GTZ)<br />
Task 5: Ethanol and ETBE production and end-use in Mexico<br />
Índice<br />
Resumen Ejecutivo<br />
1. Introducción<br />
2. Producción <strong>de</strong> éteres y etanol en México: cuadro actual<br />
2.1. Producción <strong>de</strong> MTBE y TAME<br />
2.2. Producción <strong>de</strong> etanol <strong>de</strong> caña <strong>de</strong> azúcar<br />
3. Biomasas con potencial <strong>para</strong> producción <strong>de</strong> etanol<br />
4. Procesos tecnológicos r<strong>el</strong>evantes <strong>para</strong> producción <strong>de</strong> etanol<br />
4.1. Procesos utilizando caña <strong>de</strong> azúcar<br />
4.1.1. Producción <strong>de</strong> etanol <strong>de</strong> m<strong>el</strong>azas agotadas (mi<strong>el</strong> C)<br />
4.1.2. Producción <strong>de</strong> etanol <strong>de</strong> m<strong>el</strong>azas intermediarias (mi<strong>el</strong> B)<br />
4.1.3. Producción <strong>de</strong> etanol <strong>de</strong> jugo directo <strong>de</strong> caña<br />
4.1.4. Producción <strong>de</strong> etanol <strong>de</strong> jugo directo <strong>de</strong> caña y <strong>de</strong> residuos<br />
c<strong>el</strong>ulósicos<br />
4.2. Procesos utilizando maíz<br />
4.3. Procesos utilizando yuca<br />
4.4. Procesos utilizando sorgo y remolacha<br />
4.5. Visión general<br />
5. Costos <strong>de</strong> producción <strong>de</strong> etanol en México<br />
5.1. Costos <strong>de</strong> la materia prima<br />
5.1.1. Costos <strong>para</strong> caña <strong>de</strong> azúcar y m<strong>el</strong>azas<br />
5.1.2. Costos <strong>para</strong> <strong>el</strong> maíz grano<br />
5.1.3. Costos <strong>para</strong> otras materias primas<br />
5.2. Costos <strong>de</strong> procesamiento<br />
5.2.1. Módulos industriales e inversiones<br />
5.2.2. Costos <strong>de</strong> operación y mantenimiento<br />
5.3. Costos totales<br />
6. Precios <strong>de</strong> indiferencia <strong>para</strong> <strong>el</strong> etanol en México<br />
6.1. Precios <strong>de</strong> paridad <strong>para</strong> productores <strong>de</strong> etanol<br />
6.2. Frente a gasolina y MTBE<br />
7. Mercado <strong>para</strong> etanol combustible en México
<strong>Potenciales</strong> y <strong>Viabilidad</strong> <strong><strong>de</strong>l</strong> <strong>Uso</strong> <strong>de</strong> <strong>Bioetanol</strong> y <strong>Biodies<strong>el</strong></strong> <strong>para</strong> <strong>el</strong> Transporte en México (SENER-BID-GTZ)<br />
Task 5: Ethanol and ETBE production and end-use in Mexico<br />
8. Factibilidad económica <strong>de</strong> la producción y uso <strong>de</strong> etanol<br />
8.1. Dimensiones <strong><strong>de</strong>l</strong> parque productor <strong>de</strong> etanol en México<br />
8.2. Factibilidad económica <strong>de</strong> la producción y uso <strong>de</strong> etanol<br />
9. Conclusiones<br />
Referencias<br />
Anexo 1. Procesamiento y transformación <strong>de</strong> la caña en azúcar y etanol<br />
Anexo 2. Comentarios sobre costos <strong>de</strong> producción <strong>de</strong> etanol <strong>de</strong> caña <strong>de</strong> azúcar
<strong>Potenciales</strong> y <strong>Viabilidad</strong> <strong><strong>de</strong>l</strong> <strong>Uso</strong> <strong>de</strong> <strong>Bioetanol</strong> y <strong>Biodies<strong>el</strong></strong> <strong>para</strong> <strong>el</strong> Transporte en México (SENER-BID-GTZ)<br />
Task 5: Ethanol and ETBE production and end-use in Mexico<br />
Lista <strong>de</strong> Figuras<br />
Figura 2.1. Importación <strong>de</strong> MTBE en México<br />
Figura 2.2. Producción <strong>de</strong> etanol <strong>de</strong> caña <strong>de</strong> azúcar en México, 1988/2004<br />
Figura 2.3. Evolución <strong>de</strong> indicadores <strong>de</strong> productividad en la industria azucarera <strong>de</strong> México<br />
Figura 2.4. Evolución <strong>de</strong> la producción <strong>de</strong> mi<strong>el</strong> final y alcohol en los ingenios mexicanos<br />
Figura 2.5. Ubicación <strong>de</strong> los ingenios azucareros en México<br />
Figura 3.1. Productividad agroindustrial <strong>de</strong> etanol <strong>para</strong> diferentes cultivos en los escenarios<br />
evaluados<br />
Figura 4.1. Procesos <strong>para</strong> producción <strong>de</strong> etanol<br />
Figura 4.2. Procesos <strong>de</strong> producción <strong>de</strong> alcohol <strong>de</strong> caña <strong>de</strong> azúcar<br />
Figura 4.3. Flujos básicos en la producción <strong>de</strong> etanol a partir <strong>de</strong> m<strong>el</strong>azas agotadas<br />
Figura 4.4. Esquema <strong>de</strong> un ingenio <strong>para</strong> la producción <strong>de</strong> combinada <strong>de</strong> azúcar y etanol<br />
Figura 4.5. Flujos básicos en la producción <strong>de</strong> etanol a partir <strong>de</strong> m<strong>el</strong>azas intermediarias<br />
Figura 4.6. Producción r<strong>el</strong>ativa <strong>de</strong> etanol y azúcar, <strong>para</strong> las condiciones medias <strong>de</strong> los<br />
ingenios <strong>de</strong> México<br />
Figura 4.7. Procesos <strong>de</strong> fabricación <strong>de</strong> etanol <strong>de</strong> maíz<br />
Figura 4.8. Flujos básicos en la producción <strong>de</strong> etanol a partir <strong>de</strong> maíz amarillo, procesamiento<br />
en seco<br />
Figura 5.1. Evolución <strong>de</strong> los precios <strong>de</strong> la caña al productor<br />
Figura 5.2. Costos <strong><strong>de</strong>l</strong> etanol <strong>para</strong> las materias primas y procesos consi<strong>de</strong>rados<br />
Figura 5.3. Estructura <strong>de</strong> costos <strong><strong>de</strong>l</strong> etanol <strong>para</strong> las materias primas y procesos consi<strong>de</strong>rados<br />
Figura 6.1. Competitividad <strong>de</strong> la producción <strong>de</strong> etanol<br />
Figura 6.2. Precios <strong>de</strong> cierre en <strong>el</strong> primero día <strong><strong>de</strong>l</strong> mes <strong>para</strong> los Contratos <strong>de</strong> Azúcar <strong>de</strong> la<br />
Bolsa <strong>de</strong> Nueva York (NYBOT, 2006)
<strong>Potenciales</strong> y <strong>Viabilidad</strong> <strong><strong>de</strong>l</strong> <strong>Uso</strong> <strong>de</strong> <strong>Bioetanol</strong> y <strong>Biodies<strong>el</strong></strong> <strong>para</strong> <strong>el</strong> Transporte en México (SENER-BID-GTZ)<br />
Task 5: Ethanol and ETBE production and end-use in Mexico<br />
Figura 6.3. Evolución <strong><strong>de</strong>l</strong> precio <strong><strong>de</strong>l</strong> petróleo (WTI) y <strong>de</strong> la gasolina spot (sin impuestos) en<br />
Costa <strong><strong>de</strong>l</strong> Golfo (CG) y Los Ang<strong>el</strong>es (LA)<br />
Figura 6.4. Proyecciones <strong>de</strong> precios <strong><strong>de</strong>l</strong> petróleo <strong>de</strong> la EIA/DOE, Febrero <strong>de</strong> 2006<br />
Figura 6.5. Precios <strong>de</strong> paridad <strong>para</strong> <strong>el</strong> etanol <strong>de</strong> caña frente a otros productos azucareros y<br />
combustibles pasibles <strong>de</strong> sustitución.<br />
Figura 1.1. Estimaciones <strong>de</strong> evolución <strong>de</strong> la <strong>de</strong>manda <strong>de</strong> gasolina en México<br />
Figura 7.2. Escenarios <strong>de</strong> <strong>de</strong>manda <strong>de</strong> etanol en México <strong>para</strong> dos escenarios <strong>de</strong> crecimiento<br />
<strong><strong>de</strong>l</strong> mercado <strong>de</strong> gasolinas<br />
Figura 8.1. Inversiones industriales necesarias<br />
Figura 8.2. Superficies <strong>de</strong> cultivo necesarias <strong>para</strong> producción <strong>de</strong> etanol<br />
Figura 8.3. Resultado neto <strong>de</strong> la producción <strong>de</strong> etanol, <strong>para</strong> las materias primas y tecnologías<br />
estudiadas, en <strong>el</strong> escenario <strong>de</strong> referencia<br />
Figura 8.4. Sensibilidad <strong><strong>de</strong>l</strong> costo <strong><strong>de</strong>l</strong> etanol producido <strong>de</strong> mi<strong>el</strong> pobre <strong>de</strong> caña<br />
Figura 8.5. Sensibilidad <strong><strong>de</strong>l</strong> costo <strong><strong>de</strong>l</strong> etanol producido <strong>de</strong> mi<strong>el</strong> rico <strong>de</strong> caña<br />
Figura 8.6. Sensibilidad <strong><strong>de</strong>l</strong> costo <strong><strong>de</strong>l</strong> etanol producido <strong>de</strong> jugo directo <strong>de</strong> caña<br />
Figura 8.7. Sensibilidad <strong><strong>de</strong>l</strong> costo <strong><strong>de</strong>l</strong> etanol producido <strong>de</strong> jugo directo <strong>de</strong> caña más hidrólisis<br />
<strong>de</strong> los residuos c<strong>el</strong>ulósicos<br />
Figura 8.8. Sensibilidad <strong><strong>de</strong>l</strong> costo <strong><strong>de</strong>l</strong> etanol producido <strong>de</strong> maíz vía seca
Lista <strong>de</strong> Tablas<br />
<strong>Potenciales</strong> y <strong>Viabilidad</strong> <strong><strong>de</strong>l</strong> <strong>Uso</strong> <strong>de</strong> <strong>Bioetanol</strong> y <strong>Biodies<strong>el</strong></strong> <strong>para</strong> <strong>el</strong> Transporte en México (SENER-BID-GTZ)<br />
Task 5: Ethanol and ETBE production and end-use in Mexico<br />
Tabla 2.1. Plantas <strong>de</strong> producción <strong>de</strong> MTBE en México<br />
Tabla 2.2. Materias primas y éteres producidos en las plantas <strong>de</strong> PEMEX<br />
Tabla 2.3. Capacidad instalada y producción <strong>de</strong> etanol en la zafra <strong>de</strong> 02/03 los ingenios <strong>de</strong><br />
México<br />
Tabla 2.4. Datos básicos la agroindustria cañera <strong>de</strong> México<br />
Tabla 3.1. Fuentes posibles <strong>de</strong> material prima <strong>para</strong> producción <strong>de</strong> etanol<br />
Tabla 3.2. Aspectos generales <strong>de</strong> las biomasas <strong>de</strong> interés <strong>para</strong> la producción <strong>de</strong> etanol<br />
Tabla 3.3. Productividad y costos estimados <strong>para</strong> las biomasas <strong>de</strong> interés <strong>para</strong> la producción<br />
<strong>de</strong> etanol en México<br />
Tabla 3.4. Productividad <strong>de</strong> etanol y costos <strong>de</strong> las biomasas <strong>de</strong> interés por unidad <strong>de</strong> etanol<br />
producido en los contextos recomendados<br />
Tabla 4.1. Insumos y productos en la producción <strong>de</strong> etanol a partir <strong>de</strong> las m<strong>el</strong>azas agotadas<br />
Tabla 4.2. Insumos y productos en la producción <strong>de</strong> etanol a partir <strong>de</strong> m<strong>el</strong>azas intermediarias,<br />
estimados <strong>para</strong> 18% <strong>de</strong> reducción en la producción <strong>de</strong> azúcar y 17.1 litros <strong>de</strong><br />
etanol por ton<strong>el</strong>ada <strong>de</strong> caña<br />
Tabla 4.3. Insumos y productos en la producción <strong>de</strong> etanol directo a partir <strong>de</strong> caña<br />
Tabla 4.4. Síntesis <strong>de</strong> los procesos <strong>de</strong> fabricación <strong>de</strong> etanol<br />
Tabla 5.1. Costos <strong>de</strong> producción <strong>de</strong> caña en dos regiones cañeras <strong>de</strong> México<br />
Tabla 5.2. Composición <strong>de</strong> costos <strong>de</strong> producción <strong>de</strong> caña en una zona <strong>de</strong> temporal<br />
Tabla 5.3. Inversiones específicas <strong>para</strong> riego <strong>de</strong> caña <strong>de</strong> azúcar<br />
Tabla 5.4. Costos estimados <strong>de</strong> producción <strong>para</strong> las biomasas no convencionales <strong>de</strong> interés<br />
<strong>para</strong> la producción <strong>de</strong> etanol en México<br />
Tabla 5.5. Módulos productivos <strong>para</strong> fabricación <strong>de</strong> etanol <strong>de</strong> caña <strong>de</strong> azúcar<br />
Tabla 5.6. Módulo productivo <strong>para</strong> fabricación <strong>de</strong> etanol <strong>de</strong> maíz,<br />
Tabla 5.7. Módulos <strong>para</strong> fabricación <strong>de</strong> etanol <strong>de</strong> materias primas no convencionales
<strong>Potenciales</strong> y <strong>Viabilidad</strong> <strong><strong>de</strong>l</strong> <strong>Uso</strong> <strong>de</strong> <strong>Bioetanol</strong> y <strong>Biodies<strong>el</strong></strong> <strong>para</strong> <strong>el</strong> Transporte en México (SENER-BID-GTZ)<br />
Task 5: Ethanol and ETBE production and end-use in Mexico<br />
Tabla 5.8. Inversión en plantas productoras <strong>de</strong> etanol<br />
Tabla 5.9. Composición <strong>de</strong> los costos <strong>de</strong> producción <strong>de</strong> etanol<br />
Tabla 7.1. Consumo <strong>de</strong> gasolina en México en 2005<br />
Tabla 7.2. Escenarios <strong>para</strong> introducción <strong><strong>de</strong>l</strong> etanol combustible en México, valores <strong>para</strong> 2006<br />
Tabla 7.3. Estimativa <strong>de</strong> <strong>de</strong>manda <strong>de</strong> etanol combustible en México en 2010<br />
Tabla 8.1. Número <strong>de</strong> unida<strong>de</strong>s productivas necesarias (tecnologías convencionales)<br />
Tabla 8.2. Número <strong>de</strong> unida<strong>de</strong>s productivas necesarias (tecnologías innovadoras)<br />
Tabla 8.3. Inversión industrial total (tecnologías convencionales)<br />
Tabla 8.4. Inversión industrial total (tecnologías innovadoras)<br />
Tabla 8.5. Superficie <strong>de</strong> cultivo requerida (tecnologías convencionales)<br />
Tabla 8.6. Superficie <strong>de</strong> cultivo requerida (tecnologías innovadoras)
<strong>Potenciales</strong> y <strong>Viabilidad</strong> <strong><strong>de</strong>l</strong> <strong>Uso</strong> <strong>de</strong> <strong>Bioetanol</strong> y <strong>Biodies<strong>el</strong></strong> <strong>para</strong> <strong>el</strong> Transporte en México (SENER-BID-GTZ)<br />
Task 5: Ethanol and ETBE production and end-use in Mexico<br />
Resumen Ejecutivo<br />
México presenta suficientes condiciones <strong>para</strong> consi<strong>de</strong>rar seriamente la progresiva introducción<br />
<strong><strong>de</strong>l</strong> etanol anhidro combustible en su matriz energética. En un contexto <strong>de</strong> creciente<br />
<strong>de</strong>pen<strong>de</strong>ncia <strong>de</strong> combustibles refinados importados, hay disponibilidad <strong>de</strong> recursos naturales,<br />
la tecnología <strong>de</strong> producción es conocida y los estudios <strong>de</strong> factibilidad económica señalan la<br />
atractividad <strong><strong>de</strong>l</strong> etanol, especialmente <strong>el</strong> <strong>de</strong>rivado <strong>de</strong> caña <strong>de</strong> azúcar.<br />
1. Contexto actual<br />
Para cumplir con las directivas ambientales, actualmente 44% <strong>de</strong> las gasolinas consumidas en<br />
México son oxigenadas, mediante mezclas con MTBE y TAME. En 2005 fueran consumidos<br />
23 miles barriles por día <strong>de</strong> estos componentes. La capacidad <strong>de</strong> producción en las plantas <strong>de</strong><br />
PEMEX correspon<strong>de</strong> a 68% <strong>de</strong> esa <strong>de</strong>manda y su producción efectiva alcanza 45% <strong>de</strong> las<br />
necesida<strong>de</strong>s. La importación <strong>de</strong> estos éteres costó en 2005 aproximadamente US$ 240<br />
millones.<br />
Con potencial <strong>para</strong> producción <strong>de</strong> etanol, existen en México ya 58 ingenios azucareros,<br />
procesando la caña cosechada en 612 mil hectáreas y produciendo en torno <strong>de</strong> 5 millones <strong>de</strong><br />
ton<strong>el</strong>adas <strong>de</strong> azúcar por año. Una parte <strong>de</strong> estos ingenios posee <strong>de</strong>stilerías, con una capacidad<br />
instalada <strong>para</strong> producir anualmente cerca <strong>de</strong> 167 mil m 3 <strong>de</strong> etanol <strong>de</strong> todos os tipos, incluyendo<br />
33 mil m 3 <strong>de</strong> etanol anhidro. En los últimos años la producción <strong>de</strong> etanol es <strong>de</strong>clinante, con un<br />
volumen <strong>de</strong> 39 mil m 3 producidos en la zafra 2004/2005, a partir <strong>de</strong> mi<strong>el</strong> residual <strong>de</strong> la<br />
producción azucarera. Consi<strong>de</strong>rando la producción <strong>de</strong> mi<strong>el</strong> en los ingenios mexicanos y una<br />
productividad <strong>de</strong> 8.8 litros <strong>de</strong> etanol por ton<strong>el</strong>ada <strong>de</strong> caña procesada, podrían ser producidos<br />
cerca <strong>de</strong> 400 mil m 3 <strong>de</strong> etanol, valor próximo a <strong>de</strong>manda <strong>de</strong> ese biocombustible en <strong>el</strong><br />
Escenario 1, presentado a continuación.<br />
2. Escenarios <strong>de</strong> referencia<br />
Consi<strong>de</strong>rando los estudios previos hechos por consultores mexicanos, fueran estimados los<br />
potenciales <strong>de</strong> <strong>de</strong>manda y oferta <strong>de</strong> etanol combustible. Para la <strong>de</strong>manda fueran evaluados tres<br />
escenarios <strong>de</strong> penetración <strong><strong>de</strong>l</strong> etanol en México, resumidos en la tabla siguiente y<br />
<strong>de</strong>terminados a partir <strong>de</strong> los valores <strong>para</strong> 2005 asumiendo un incremento anual <strong>de</strong> 3%.<br />
Tabla 1. Escenarios <strong>para</strong> introducción <strong><strong>de</strong>l</strong> etanol combustible en México, valores <strong>para</strong> 2010<br />
Escenario<br />
1. Sustitución <strong>de</strong> la producción nacional <strong>de</strong> MTBE<br />
por ETBE, en la capacidad <strong>de</strong> producción<br />
2. Sustitución total <strong>de</strong> los éteres por etanol a 5.7%<br />
en 44% <strong>de</strong> la gasolina (2% <strong>de</strong> oxigeno)<br />
3. Mezcla <strong>de</strong> 10% <strong>de</strong> etanol en toda gasolina <strong><strong>de</strong>l</strong><br />
país (3.5% <strong>de</strong> oxigeno)<br />
Demanda <strong>de</strong> etanol<br />
(mil m 3 /año)<br />
Ahorro <strong>de</strong> divisas por la<br />
reducción <strong>de</strong> la importación<br />
<strong>de</strong> gasolina y MTBE (mil US$)<br />
411.9 185,355<br />
1,110.6 499,500<br />
4,406.3 1,982,835<br />
1
<strong>Potenciales</strong> y <strong>Viabilidad</strong> <strong><strong>de</strong>l</strong> <strong>Uso</strong> <strong>de</strong> <strong>Bioetanol</strong> y <strong>Biodies<strong>el</strong></strong> <strong>para</strong> <strong>el</strong> Transporte en México (SENER-BID-GTZ)<br />
Task 5: Ethanol and ETBE production and end-use in Mexico<br />
Podría ser consi<strong>de</strong>rada, como alternativa al Escenario 1, la manutención <strong>de</strong> la producción local<br />
<strong>de</strong> éteres y sustitución <strong>de</strong> los éteres importados por etanol nacional, que significaría aumentar<br />
la <strong>de</strong>manda <strong>de</strong> etanol en ese escenario en cerca <strong>de</strong> 22%. El Escenario 3 estudiado en <strong>el</strong><br />
presente informe representa la máxima <strong>de</strong>manda <strong>de</strong> etanol, consi<strong>de</strong>rando la mezcla <strong>de</strong> 10% <strong>de</strong><br />
etanol en todas las gasolinas <strong>de</strong> México y es una variante <strong><strong>de</strong>l</strong> propuesto inicialmente, que<br />
restringía tal mezcla a las gasolinas no oxigenadas.<br />
Para la producción <strong>de</strong> etanol fueran estudiados cinco cultivos: caña <strong>de</strong> azúcar, maíz, sorgo,<br />
yuca y remolacha, consi<strong>de</strong>rándose que la caña y <strong>el</strong> maíz correspon<strong>de</strong>n a tecnologías más<br />
conocidas y disponibles, mientras los <strong>de</strong>más representan todavía posibilida<strong>de</strong>s en <strong>de</strong>sarrollo.<br />
Para los cultivos <strong>de</strong> mayor interés, se consi<strong>de</strong>raron escenarios productivos diferenciados: <strong>para</strong><br />
la caña <strong>de</strong> azúcar <strong>de</strong> temporal, en las regiones <strong>de</strong> Huastecas y Veracruz Centro, se adoptó 61<br />
t/ha, 14% inferior al promedio nacional, y <strong>para</strong> <strong>el</strong> maíz se consi<strong>de</strong>ró la región <strong><strong>de</strong>l</strong> Mar <strong>de</strong><br />
Cortés, con tecnología <strong>de</strong> riego, produciendo 10 t/ha, bastante superior al promedio nacional.<br />
La figura siguiente presenta la productividad agroindustrial estimada <strong>para</strong> los cultivos<br />
estudiados. Para la caña se consi<strong>de</strong>ró <strong>el</strong> proceso a partir <strong><strong>de</strong>l</strong> jugo directo, <strong>para</strong> <strong>el</strong> maíz la<br />
molienda en seco.<br />
6,000<br />
litro/ ha<br />
5,000<br />
4,000<br />
3,000<br />
2,000<br />
1,000<br />
0<br />
Caña Maíz Sorgo dulce Yuca Remolacha<br />
azucarera<br />
Figura 1. Productividad agroindustrial <strong>de</strong> etanol en los escenarios evaluados<br />
A<strong>de</strong>más <strong>de</strong> los aspectos <strong>de</strong> productividad, la s<strong>el</strong>ección <strong>de</strong> las materias primas a ser empleadas<br />
<strong>para</strong> producción <strong>de</strong> etanol <strong>de</strong>be tomar en cuenta <strong>el</strong> niv<strong>el</strong> <strong>de</strong> conocimiento agronómico, <strong>el</strong><br />
balance energético (que expresa la r<strong>el</strong>ación entre la <strong>de</strong>manda y la producción energética <strong>para</strong><br />
una <strong>de</strong>terminada combinación materia prima/ proceso <strong>de</strong> conversión), la disponibilidad <strong>de</strong><br />
subproductos <strong>de</strong> valor económico, los impactos ambientales (a niv<strong>el</strong> <strong>de</strong> producción agrícola y<br />
industrial) y la competencia con la producción alimentaría. Bajo eses supuestos la caña surge<br />
naturalmente como la opción más evi<strong>de</strong>nte <strong>para</strong> promover en <strong>el</strong> corto plazo la<br />
producción <strong>de</strong> etanol en México, alternativa que se refuerza al tener en cuenta la larga<br />
experiencia <strong><strong>de</strong>l</strong> país con ese cultivo, insertado hace siglos en la pauta cultural y agronómica<br />
mexicana. No obstante, eso no quiere <strong>de</strong>cir que la caña es necesariamente la única opción <strong>para</strong><br />
producir etanol en México, que a mediano plazo podrá <strong>de</strong>sarrollar otras posibilida<strong>de</strong>s.<br />
2
<strong>Potenciales</strong> y <strong>Viabilidad</strong> <strong><strong>de</strong>l</strong> <strong>Uso</strong> <strong>de</strong> <strong>Bioetanol</strong> y <strong>Biodies<strong>el</strong></strong> <strong>para</strong> <strong>el</strong> Transporte en México (SENER-BID-GTZ)<br />
Task 5: Ethanol and ETBE production and end-use in Mexico<br />
3. Tecnología <strong>de</strong> producción <strong><strong>de</strong>l</strong> etanol<br />
En la Tabla 2 se sintetiza los procesos estudiados <strong>para</strong> fabricación <strong>de</strong> etanol, <strong>para</strong> las<br />
diferentes materias primas con datos <strong>de</strong> productividad y requerimientos <strong>de</strong> energía. Mientras<br />
los procesos utilizando caña y maíz son conocidos y comercialmente bien <strong>de</strong>sarrollados, los<br />
<strong>de</strong>más procesos no presentan la misma madurez. Particularmente <strong>el</strong> proceso <strong>de</strong> hidrólisis <strong>de</strong><br />
los residuos c<strong>el</strong>ulósicos, <strong>de</strong> gran<strong>de</strong> potencial, sigue en <strong>de</strong>sarrollo, esperándose en un horizonte<br />
<strong>de</strong> por lo menos diez años su cabal perfeccionamiento.<br />
Tabla 2. Síntesis <strong>de</strong> los procesos <strong>de</strong> fabricación <strong>de</strong> etanol<br />
materia<br />
prima<br />
caña <strong>de</strong><br />
azúcar<br />
proceso<br />
productividad<br />
(litro etanol/ t)<br />
consumo energético<br />
otros productos<br />
mi<strong>el</strong> pobre (C) 8.8 autosuficiente 112 kg azúcar<br />
mi<strong>el</strong> rica (B) 17.1 autosuficiente 92 kg azúcar<br />
jugo directo 80 autosuficiente menos r<strong>el</strong>evante<br />
jugo directo +<br />
hidrólisis <strong>de</strong> residuos<br />
lignoc<strong>el</strong>ulósicos<br />
maíz vía seca 398<br />
(80+18)<br />
98<br />
autosuficiente<br />
<strong>el</strong>ectr.: 0.21 kWh/litro<br />
comb.: 10.2 MJ/litro<br />
menos r<strong>el</strong>evante<br />
321 kg granos<br />
secos <strong>de</strong> <strong>de</strong><br />
<strong>de</strong>stilería y<br />
solubles DDGS<br />
sorgo similar a caña 35 autosuficiente menos r<strong>el</strong>evante<br />
yuca similar al maíz 170 comb.: 26 a 31 MJ/litro menos r<strong>el</strong>evante<br />
remolacha similar a caña 86<br />
<strong>el</strong>ectr.: 0.08 kWh/litro<br />
comb.: 6.7 MJ/litro<br />
51 kg <strong>de</strong><br />
residuos<br />
4. Costos <strong>de</strong> producción <strong><strong>de</strong>l</strong> etanol<br />
Los costos <strong>de</strong> producción fueran evaluados <strong>de</strong>sagregándose los costos <strong>de</strong> las materias primas<br />
(que representan la parc<strong>el</strong>a más importante), los costos <strong>de</strong> capital, los costos operacionales y<br />
los costos y ingresos r<strong>el</strong>acionados con subproductos <strong>de</strong> valor económico que se producen<br />
(como los granos <strong>de</strong> <strong>de</strong>stilería en <strong>el</strong> caso <strong><strong>de</strong>l</strong> maíz) o que se <strong>de</strong>jan <strong>de</strong> producir (azúcar en <strong>el</strong><br />
caso <strong>de</strong> utilizar la mi<strong>el</strong> rica <strong>para</strong> fabricar etanol).<br />
Los costos <strong>de</strong> capital fueran estimados a partir <strong>de</strong> la previa s<strong>el</strong>ección <strong>de</strong> “módulos<br />
industriales” representativos <strong>para</strong> los ocho pares (materia prima + proceso) consi<strong>de</strong>rados,<br />
observándose la experiencia internacional, como se presenta en la Tabla 3. En los casos <strong>de</strong><br />
utilización <strong>de</strong> mi<strong>el</strong> no se consi<strong>de</strong>raran los costos <strong><strong>de</strong>l</strong> ingenio azucarero asociado.<br />
3
<strong>Potenciales</strong> y <strong>Viabilidad</strong> <strong><strong>de</strong>l</strong> <strong>Uso</strong> <strong>de</strong> <strong>Bioetanol</strong> y <strong>Biodies<strong>el</strong></strong> <strong>para</strong> <strong>el</strong> Transporte en México (SENER-BID-GTZ)<br />
Task 5: Ethanol and ETBE production and end-use in Mexico<br />
Tabla 3. Inversión en plantas productoras <strong>de</strong> etanol<br />
Materia prima y tecnología<br />
Inversión Capacidad Inversión unitaria<br />
mil US$ m 3 /día US$/litro/día<br />
Cana, mi<strong>el</strong> pobre 15,000 150 100<br />
Caña, mi<strong>el</strong> rica 15,000 150 100<br />
Jugo directo 50,000 450 111<br />
Jugo directo + hidrólisis 158,000 551 287<br />
Maíz vía seca 61,000 500 122<br />
Sorgo 25,000 150 167<br />
Yuca 45,000 150 300<br />
Remolacha 30,000 150 200<br />
Las inversiones fueran anualizadas consi<strong>de</strong>rando una vida económica <strong>de</strong> 10 años y una tasa<br />
<strong>de</strong>scuento <strong>de</strong> 12%. Se incluyeran costos <strong>de</strong> mano <strong>de</strong> obra y administración, costos <strong>de</strong> los<br />
insumos <strong>de</strong> producción y costos <strong>de</strong> mantenimiento y conservación, estimados a partir <strong>de</strong> casos<br />
reales. Agregando todos los costos, inclusive los costos asociados a <strong>de</strong>manda <strong>de</strong> energía <strong>para</strong><br />
producción, en los casos adon<strong>de</strong> es necesario aporte externo (maíz y yuca, <strong>para</strong> la remolacha<br />
se asumió la disponibilidad <strong>de</strong> calor geotérmico disponible), se <strong>de</strong>terminó la Tabla 4, con la<br />
formación <strong>de</strong> los costos totales <strong><strong>de</strong>l</strong> etanol <strong>para</strong> las materias primas y tecnologías consi<strong>de</strong>radas,<br />
también presentados en la Figura 2.<br />
Tabla 4. Composición <strong>de</strong> los costos <strong>de</strong> producción <strong>de</strong> etanol (US$/litro)<br />
Caso<br />
Caña mi<strong>el</strong> pobre<br />
Caña mi<strong>el</strong> rica<br />
Caña jugo<br />
directo<br />
Caña jugo +<br />
hidrólisis<br />
materia prima 0.26 0.21 0.27 0.22 0.30 0.59 0.30 0.44<br />
inversiones 0.09 0.09 0.10 0.26 0.07 0.13 0.23 0.15<br />
energía 0.00 0.00 0.00 0.00 0.09 0.00 0.15 0.00<br />
otros 0.06 0.21 0.06 0.12 -0.02 0.10 0.11 0.10<br />
total 0.40 0.52 0.43 0.60 0.44 0.82 0.79 0.69<br />
Maíz vía seca<br />
Sorgo<br />
Yuca<br />
Remolacha<br />
4
<strong>Potenciales</strong> y <strong>Viabilidad</strong> <strong><strong>de</strong>l</strong> <strong>Uso</strong> <strong>de</strong> <strong>Bioetanol</strong> y <strong>Biodies<strong>el</strong></strong> <strong>para</strong> <strong>el</strong> Transporte en México (SENER-BID-GTZ)<br />
Task 5: Ethanol and ETBE production and end-use in Mexico<br />
0.90<br />
0.80<br />
0.70<br />
0.60<br />
US$/litro<br />
otros<br />
energía<br />
inversiones<br />
materia prima<br />
0.50<br />
0.40<br />
0.30<br />
0.20<br />
0.10<br />
0.00<br />
-0.10<br />
Cana mi<strong>el</strong><br />
pobre<br />
Cana mi<strong>el</strong><br />
rica<br />
Cana jugo<br />
directo<br />
Cana jugo<br />
+ hidrólisis<br />
Maíz vía<br />
seca<br />
Sorgo<br />
Yuca<br />
Remolacha<br />
Figura 2. Costos <strong><strong>de</strong>l</strong> etanol <strong>para</strong> las materias primas y procesos consi<strong>de</strong>rados<br />
Es r<strong>el</strong>evante observar que los costos <strong>de</strong> la materia prima fueran evaluados a partir <strong>de</strong> los<br />
factores <strong>de</strong> producción y resultaran, <strong>para</strong> los contextos estudiados y <strong>para</strong> las materias<br />
primas más r<strong>el</strong>evantes, costos <strong>para</strong> la caña <strong>de</strong> 22 US$/t y <strong>para</strong> <strong>el</strong> maíz <strong>de</strong> 120 US$/t,<br />
valores utilizados en las estimaciones <strong><strong>de</strong>l</strong> costo total <strong><strong>de</strong>l</strong> etanol, respectivamente en 0.43<br />
US$/litro y 0.44 US$/litro. Sin embargo, los precios practicados en <strong>el</strong> mercado mexicano <strong>para</strong><br />
estos productos son respectivamente 33 US$/t y 173 US$/t, resultando que <strong>el</strong> costo <strong><strong>de</strong>l</strong> etanol<br />
<strong>de</strong> jugo directo <strong>de</strong> caña pasaria a 0.59 US$/litro (37% más <strong>el</strong>evado) y <strong>para</strong> <strong>el</strong> etanol <strong>de</strong> maíz, a<br />
0.58 US$/litro (32% más <strong>el</strong>evado). En ese sentido es esencial estudiar como los costos (y<br />
precios) <strong>de</strong> las materias primas pue<strong>de</strong>n ser reducidos. De hecho, <strong>para</strong> promover <strong>de</strong> modo<br />
sustentable <strong>el</strong> etanol combustible en México es imperativo bajar los costos <strong>de</strong> las<br />
materias primas.<br />
Consi<strong>de</strong>rando los resultados <strong>de</strong> costos y los <strong>de</strong>más criterios <strong>para</strong> s<strong>el</strong>ección <strong>de</strong> materias primas<br />
y procesos, se <strong>de</strong>staca favorablemente la caña <strong>de</strong> azúcar, por no competir en la <strong>de</strong>manda <strong>de</strong><br />
áreas bajo riego, por su productividad y perspectivas <strong>de</strong> perfeccionamiento. Así, es<br />
recomendable que las otras alternativas sean consi<strong>de</strong>radas <strong>de</strong> menor prioridad, por lo menos<br />
en <strong>el</strong> horizonte <strong>de</strong> los próximos años y hasta que sean reforzados su conocimiento y los<br />
indicadores <strong>de</strong> factibilidad.<br />
5. Costos <strong>de</strong> oportunidad <strong><strong>de</strong>l</strong> etanol<br />
Los precios <strong>de</strong> indiferencia o costos <strong>de</strong> oportunidad <strong><strong>de</strong>l</strong> etanol son <strong>de</strong>finidos <strong>de</strong>s<strong>de</strong> <strong>el</strong> punto <strong>de</strong><br />
vista <strong>de</strong> los productores, frente a productos alternativos <strong>de</strong> la materia prima, o <strong>de</strong>s<strong>de</strong> <strong>el</strong> punto<br />
<strong>de</strong> vista <strong>de</strong> los usuarios, en términos <strong>de</strong> <strong>de</strong>sempeño <strong>de</strong> ese biocombustible en r<strong>el</strong>ación a la<br />
gasolina o al MTBE.<br />
5
<strong>Potenciales</strong> y <strong>Viabilidad</strong> <strong><strong>de</strong>l</strong> <strong>Uso</strong> <strong>de</strong> <strong>Bioetanol</strong> y <strong>Biodies<strong>el</strong></strong> <strong>para</strong> <strong>el</strong> Transporte en México (SENER-BID-GTZ)<br />
Task 5: Ethanol and ETBE production and end-use in Mexico<br />
Para los productores <strong>de</strong> etanol a partir <strong>de</strong> la caña <strong>de</strong> azúcar en <strong>de</strong>stilerías asociadas a ingenios,<br />
a partir <strong>de</strong> las r<strong>el</strong>aciones <strong>de</strong> masa entre etanol y azúcar o m<strong>el</strong>azas, consi<strong>de</strong>rando los precios en<br />
los mercados accesibles (libres o preferentes), fue posible <strong>de</strong>terminar los costos <strong>de</strong><br />
oportunidad. Por supuesto que estos costos cambian en función <strong><strong>de</strong>l</strong> contexto <strong>de</strong> precios, pero<br />
en la evaluación efectuada quedaron evi<strong>de</strong>ntes dos puntos: hay clara competitividad en hacer<br />
etanol <strong>de</strong> m<strong>el</strong>azas y no hay ventaja económica en <strong>de</strong>jar <strong>de</strong> producir azúcar exportable a precios<br />
preferenciales (cuota americana, Contrato 14 <strong>de</strong> la NYBOT). Para <strong>el</strong> caso <strong><strong>de</strong>l</strong> azúcar en los<br />
mercados abiertos (como <strong>el</strong> Contrato 11 <strong>de</strong> la NYBOT) existe una factibilidad marginal y<br />
variable con los mercados. Sin embargo, la simultanea producción <strong>de</strong> azúcar y etanol aporta<br />
una <strong>de</strong>seable flexibilidad a la agroindustria cañera, que pue<strong>de</strong> manejar sus flujos <strong>de</strong> sacarosa<br />
<strong>de</strong> forma maximizar sus ganancias. El punto clave aquí es como compatibilizar una<br />
producción azucarera con costos <strong>el</strong>evados y rígidamente regulada, con la necesaria<br />
flexibilización productiva, que aportaría eficiencia y ampliaría <strong>el</strong> mercado <strong>para</strong> los<br />
ingenios.<br />
Consi<strong>de</strong>rando que la adición <strong>de</strong> etanol hasta <strong>el</strong> niv<strong>el</strong> <strong>de</strong> 10% prácticamente no altera <strong>el</strong><br />
consumo <strong>de</strong> los vehículos, se <strong>de</strong>terminaran los costos <strong>de</strong> oportunidad <strong>de</strong> los combustibles en<br />
función <strong>de</strong> sus precios <strong>de</strong> referencia. Los costos <strong>de</strong> oportunidad <strong>para</strong> ambos puntos <strong>de</strong> vista<br />
están presentados en la Figura 3. En esencia, se observa que los costos <strong>de</strong> la producción <strong>de</strong><br />
etanol a partir <strong>de</strong> la caña, a valores paritarios con las m<strong>el</strong>azas y <strong>el</strong> azúcar en los<br />
mercados abiertos, es competitiva frentes a los valores <strong>de</strong> sustitución <strong>de</strong> los combustibles<br />
convencionales.<br />
1.00<br />
0.90<br />
0.80<br />
0.70<br />
0.60<br />
0.50<br />
0.40<br />
0.30<br />
0.20<br />
0.10<br />
0.00<br />
US$/litro<br />
m<strong>el</strong>aza<br />
azúcar<br />
mercados<br />
abiertos<br />
Productos azucareros<br />
azúcar<br />
mercados<br />
preferentes<br />
gasolina<br />
MTBE<br />
Combustibles<br />
Figura 3. Precios <strong>de</strong> paridad <strong>para</strong> <strong>el</strong> etanol <strong>de</strong> caña frente a otros productos azucareros y<br />
combustibles pasibles <strong>de</strong> sustitución.<br />
6
<strong>Potenciales</strong> y <strong>Viabilidad</strong> <strong><strong>de</strong>l</strong> <strong>Uso</strong> <strong>de</strong> <strong>Bioetanol</strong> y <strong>Biodies<strong>el</strong></strong> <strong>para</strong> <strong>el</strong> Transporte en México (SENER-BID-GTZ)<br />
Task 5: Ethanol and ETBE production and end-use in Mexico<br />
6. Factibilidad pr<strong>el</strong>iminar <strong><strong>de</strong>l</strong> etanol<br />
Se evaluó económicamente la producción <strong>de</strong> etanol <strong>para</strong> las diferentes materias primas y<br />
tecnologías s<strong>el</strong>eccionadas, <strong>de</strong>terminándose <strong>el</strong> resultado neto <strong>de</strong> la actividad, consi<strong>de</strong>rada la<br />
venta <strong><strong>de</strong>l</strong> etanol en tres niv<strong>el</strong>es <strong>de</strong> precios y los costos totales <strong>de</strong> producción, y adoptando <strong>para</strong><br />
<strong>el</strong> escenario <strong>de</strong> referencia: tasa <strong>de</strong> <strong>de</strong>scuento <strong>de</strong> 12%, vida económica útil <strong>de</strong> 10 años, un factor<br />
<strong>de</strong> <strong>de</strong>preciación <strong>de</strong> 10% anual y una tasa <strong>de</strong> impuestos <strong>de</strong> 28% sobre <strong>el</strong> resultado bruto. En la<br />
Figura 4 se sintetizan los resultados, confirmando la atractividad <strong>de</strong> los cultivos y tecnologías<br />
convencionales, <strong>de</strong>biendo reiterarse la importancia <strong><strong>de</strong>l</strong> costo <strong>de</strong> la materia prima sobre tal<br />
resultado, como cuantificado en <strong>el</strong> análisis <strong>de</strong> sensibilidad efectuado.<br />
0.20<br />
0.10<br />
US$/litro<br />
0.45 US$/litro<br />
0.55 US$/litro<br />
0.65 US$/litro<br />
0.00<br />
-0.10<br />
Cana mi<strong>el</strong><br />
pobre<br />
Cana mi<strong>el</strong><br />
rica<br />
Cana jugo<br />
directo<br />
Cana jugo +<br />
hidrólisis<br />
Maíz vía<br />
seca<br />
Sorgo Yuca Remolacha<br />
-0.20<br />
-0.30<br />
-0.40<br />
-0.50<br />
Figura 4. Resultado neto <strong>de</strong> la producción <strong>de</strong> etanol, <strong>para</strong> las materias primas y tecnologías<br />
estudiadas, en <strong>el</strong> escenario <strong>de</strong> referencia<br />
7. Requerimientos <strong>de</strong> área cultivada e inversiones industriales<br />
A partir <strong>de</strong> las expectativas <strong>de</strong> <strong>de</strong>manda <strong>de</strong> etanol y las disponibilida<strong>de</strong>s <strong>de</strong>terminadas <strong>para</strong> los<br />
“módulos industriales” se <strong>de</strong>terminaran las necesida<strong>de</strong>s <strong>de</strong> superficie y las inversiones en<br />
unida<strong>de</strong>s <strong>de</strong> producción <strong>de</strong> etanol, presentadas en las Tablas 5 y 6 <strong>para</strong> los casos<br />
convencionales.<br />
Tabla 5. Superficie <strong>de</strong> cultivo requerida (tecnologías convencionales)<br />
Materia prima y tecnología<br />
Caña mi<strong>el</strong><br />
pobre<br />
Caña mi<strong>el</strong><br />
rica<br />
Caña jugo<br />
directo<br />
Maíz vía seca<br />
Productividad agrícola (t/ha) 61 61 61 10<br />
Productividad industrial (litro/t) 8.8 17.1 80 398<br />
Escenario<br />
1. Sustitución <strong>de</strong> la producción nacional <strong>de</strong><br />
MTBE por ETBE<br />
2. Sustitución total <strong>de</strong> los éteres por etanol a<br />
5,7% en volumen<br />
3. Mezcla <strong>de</strong> 10% <strong>de</strong> etanol en volumen en<br />
toda gasolina <strong><strong>de</strong>l</strong> país<br />
Superficie <strong>de</strong> cultivo (miles <strong>de</strong> ha)<br />
767 395 84 103<br />
1,698 874 187 229<br />
7,260 3,736 799 979<br />
7
<strong>Potenciales</strong> y <strong>Viabilidad</strong> <strong><strong>de</strong>l</strong> <strong>Uso</strong> <strong>de</strong> <strong>Bioetanol</strong> y <strong>Biodies<strong>el</strong></strong> <strong>para</strong> <strong>el</strong> Transporte en México (SENER-BID-GTZ)<br />
Task 5: Ethanol and ETBE production and end-use in Mexico<br />
Tabla 6. Inversión industrial total (tecnologías convencionales)<br />
Escenario<br />
Materia prima y tecnología<br />
1. Sustitución <strong>de</strong> la producción nacional <strong>de</strong><br />
MTBE por ETBE<br />
2. Sustitución total <strong>de</strong> los éteres por etanol a<br />
5,7% en volumen<br />
3. Mezcla <strong>de</strong> 10% <strong>de</strong> etanol en volumen en<br />
toda gasolina <strong><strong>de</strong>l</strong> país<br />
Caña mi<strong>el</strong><br />
pobre<br />
Caña mi<strong>el</strong><br />
rica<br />
Inversión industrial (millones <strong>de</strong> US$)<br />
Caña jugo<br />
directo<br />
Maíz vía seca<br />
240 240 300 183<br />
510 510 600 427<br />
2,160 2,160 2,400 1,586<br />
Cumple recordar que <strong>para</strong> la caña se adoptaron escenarios <strong>de</strong> baja productividad, 61 t/ha,<br />
exactamente al revés <strong>de</strong> escenario <strong>el</strong>egido <strong>para</strong> <strong>el</strong> maíz, <strong>de</strong> ese modo, los valores <strong>de</strong> área<br />
cultivada <strong>para</strong> la caña podrán ser progresivamente reducidos en función <strong>de</strong> perfeccionamientos<br />
todavía pasibles se introducir en la etapa agrícola <strong>de</strong> producción <strong><strong>de</strong>l</strong> etanol. Es interesante<br />
com<strong>para</strong>r <strong>el</strong> área necesaria en caña <strong>para</strong> la producción <strong>de</strong> etanol utilizando las m<strong>el</strong>azas como<br />
materia prima, con la superficie actualmente plantada en México, cerca <strong>de</strong> 612 mil hectáreas,<br />
que permite concluir que, en caso <strong><strong>de</strong>l</strong> Escenario 1 (sustitución <strong>de</strong> la producción nacional <strong>de</strong><br />
éteres), la oferta actual <strong>de</strong> caña ya alcanzaría <strong>el</strong> 80% <strong>de</strong> la <strong>de</strong>manda (utilizando mi<strong>el</strong> pobre) o<br />
superaría en 55% la <strong>de</strong>manda (mi<strong>el</strong> rica).<br />
Gran<strong>de</strong> parte <strong>de</strong> las inversiones necesarias podrán efectuarse en moneda nacional,<br />
correspondiendo a obras civiles y equipos producidos en <strong>el</strong> país. En verdad, México es<br />
exportador <strong>de</strong> mo<strong>de</strong>rnas <strong>de</strong>stilerías <strong>de</strong> etanol, empleadas en países <strong>de</strong> la región <strong>para</strong> producir y<br />
exportar etanol.<br />
8. Conclusiones y recomendaciones<br />
En los límites <strong><strong>de</strong>l</strong> estudio efectuado, quedó clara la oportunidad <strong>de</strong> proseguir en la<br />
implementación <strong>de</strong> la producción y uso <strong>de</strong> etanol como combustible en México,<br />
principalmente mediante <strong>el</strong> empleo <strong>de</strong> materias primas y tecnologías convencionales.<br />
Con r<strong>el</strong>ación a materia prima más a<strong>de</strong>cuada, entre las diversas posibilida<strong>de</strong>s se <strong>de</strong>stacan las<br />
m<strong>el</strong>azas, <strong>el</strong> jugo directo <strong>de</strong> caña y <strong>el</strong> maíz, por su productividad, costos y conocimiento<br />
agronómico en México. Por los resultados económicos no es posible afirmarse<br />
categóricamente que la caña representa una opción nítidamente superior al maíz, no obstante<br />
la menor disponibilidad <strong>de</strong> tierras bajo riego, la importancia en usos alimentarios y la<br />
<strong>de</strong>pen<strong>de</strong>ncia <strong>de</strong> maíz importado sean aspectos estratégicos a reducir <strong>el</strong> interés en ese cultivo<br />
<strong>para</strong> fines bioenergéticos. Obsérvese aún que estos resultados consi<strong>de</strong>raran parámetros<br />
conservadores <strong>para</strong> la caña y optimistas <strong>para</strong> <strong>el</strong> maíz. A<strong>de</strong>más, otros cultivos también pue<strong>de</strong>n<br />
ser consi<strong>de</strong>rados, pero siempre en nichos específicos pues todavía carecen <strong>de</strong> mejor<br />
fundamentación y los resultados obtenidos no son exactamente estimulantes. En síntesis, sobre<br />
esto punto, es importante enfocar las materias primas <strong>de</strong> manera no restrictiva pero<br />
teniendo en cuenta experiencias previas y datos económicos.<br />
8
<strong>Potenciales</strong> y <strong>Viabilidad</strong> <strong><strong>de</strong>l</strong> <strong>Uso</strong> <strong>de</strong> <strong>Bioetanol</strong> y <strong>Biodies<strong>el</strong></strong> <strong>para</strong> <strong>el</strong> Transporte en México (SENER-BID-GTZ)<br />
Task 5: Ethanol and ETBE production and end-use in Mexico<br />
Por sus disponibilida<strong>de</strong>s y necesida<strong>de</strong>s, es cierto que temprano o tar<strong>de</strong> los mexicanos estarán<br />
produciendo, utilizando y quizás exportando y importando biocombustibles. Frente a los<br />
resultados presentados, existen <strong>de</strong>s<strong>de</strong> ya perspectivas interesantes <strong>para</strong> <strong>el</strong> <strong>de</strong>sarrollo <strong><strong>de</strong>l</strong> etanol<br />
en México, cabiendo <strong>el</strong>egir los mecanismos <strong>de</strong> fomento y perfeccionar <strong>el</strong> marco normativo y<br />
legal <strong>para</strong> los biocombustibles, asimismo buscando asegurar que su introducción ocurra <strong>de</strong><br />
forma progresiva y sostenible, compartiendo beneficios entre los agentes involucrados y la<br />
sociedad. Necesariamente complexo, por sus amplias corr<strong>el</strong>aciones e implicaciones, ahora se<br />
empieza a <strong>de</strong>cidir <strong>el</strong> sen<strong>de</strong>ro <strong>de</strong> ese proceso.<br />
9
<strong>Potenciales</strong> y <strong>Viabilidad</strong> <strong><strong>de</strong>l</strong> <strong>Uso</strong> <strong>de</strong> <strong>Bioetanol</strong> y <strong>Biodies<strong>el</strong></strong> <strong>para</strong> <strong>el</strong> Transporte en México (SENER-BID-GTZ)<br />
Task 5: Ethanol and ETBE production and end-use in Mexico<br />
1. Introducción<br />
Como parte <strong><strong>de</strong>l</strong> Proyecto “<strong>Viabilidad</strong> <strong><strong>de</strong>l</strong> etanol <strong>de</strong>rivado <strong>de</strong> biomasa como combustible <strong>para</strong><br />
transporte”, <strong>de</strong>sarrollado por <strong>el</strong> Banco Interamericano <strong>de</strong> Desarrollo (BID) junto a Secretaria<br />
<strong>de</strong> Energía (SENER) <strong><strong>de</strong>l</strong> gobierno mexicano, <strong>el</strong> objetivo básico <strong><strong>de</strong>l</strong> presente informe es, a<br />
partir <strong>de</strong> estudios previos sobre <strong>el</strong> escenario económico, energético y agrícola <strong>de</strong> México,<br />
explorar las posibilida<strong>de</strong>s <strong>de</strong> producir etanol a partir <strong>de</strong> recursos <strong>de</strong> biomasa, como caña <strong>de</strong><br />
azúcar o maíz, y utilizar ese biocombustible en mezclas con gasolina en <strong>el</strong> mercado mexicano<br />
<strong>de</strong> combustibles. No fueran consi<strong>de</strong>radas las perspectivas <strong>de</strong> exportación, <strong>de</strong> evi<strong>de</strong>nte interés<br />
pero que plantean escenarios <strong>de</strong> <strong>de</strong>manda no estudiados en <strong>el</strong> presente informe. En ese sentido<br />
y <strong>de</strong> acuerdo con tres escenarios <strong>de</strong> mercado <strong>para</strong> <strong>el</strong> etanol, serán <strong>de</strong>terminados los<br />
requerimientos <strong>de</strong> recursos <strong>para</strong> producir ese biocombustible y los indicadores <strong>de</strong> factibilidad<br />
económica <strong>para</strong> diferentes contextos <strong>de</strong> materias primas, procesos y escalas <strong>de</strong> producción.<br />
Estos resultados servirán <strong>para</strong> evaluaciones pr<strong>el</strong>iminares <strong>de</strong> factibilidad, asimismo serán<br />
utilizados en los posteriores estudios <strong>de</strong> sostenabilidad, con un espectro más amplio.<br />
En la primera mitad <strong>de</strong> los años ochenta, diversas instituciones regionales han explorado las<br />
perspectivas <strong><strong>de</strong>l</strong> etanol como combustible en la América Latina, adon<strong>de</strong> las tecnologías<br />
requeridas son bastante conocidas y existe hace siglos una importante industria azucarera. En<br />
ese sentido, la percepción <strong><strong>de</strong>l</strong> amplio abanico <strong>de</strong> ventajas e impactos positivos sobre la<br />
economía y la sociedad estimuló estudios nacionales y la caracterización <strong>de</strong> los obstáculos a<br />
superar, como se presentó en un documento <strong>de</strong> 1984 pre<strong>para</strong>do por un grupo <strong>de</strong> consultores<br />
bajo <strong>el</strong> patrocinio <strong>de</strong> la Grupo <strong>de</strong> Países Latinoamericanos y <strong><strong>de</strong>l</strong> Caribe Exportadores <strong>de</strong><br />
Azúcar, Instituto Interamericano <strong>de</strong> Cooperación <strong>para</strong> la Agricultura y Organización<br />
Latinoamericana <strong>de</strong> Energía (GEPLACEA, IICA, OLADE, 1985). No obstante, <strong>de</strong>s<strong>de</strong> ese<br />
entonces, con la excepción <strong>de</strong> pocos estudios puntuales y en un marco restrictivo <strong>de</strong> la<br />
agroindustria cañera, la temática bioenergética no se ha a<strong><strong>de</strong>l</strong>antado en México,<br />
com<strong>para</strong>tivamente a otros países similares. De hecho, la reducción <strong>de</strong> los precios <strong><strong>de</strong>l</strong> petróleo<br />
a partir <strong>de</strong> 1985 disminuyó <strong>el</strong> interés en los biocombustibles, solamente retomado a fines <strong>de</strong><br />
los años noventa a raíz <strong>de</strong> motivaciones ambientales y en un contexto <strong>de</strong> sostenida alza en los<br />
precios <strong>de</strong> los combustibles convencionales. En pocas palabras, ese es <strong>el</strong> cuadro <strong>de</strong><br />
antece<strong>de</strong>ntes en <strong>el</strong> cual se preten<strong>de</strong> conocer las potencialida<strong>de</strong>s <strong><strong>de</strong>l</strong> etanol en México.<br />
Como factores complementarios <strong>de</strong> inducción <strong><strong>de</strong>l</strong> interés en evaluar las perspectivas <strong><strong>de</strong>l</strong> etanol<br />
en la realidad mexicana, cabe mencionar <strong>el</strong> continuado éxito <strong>de</strong> la experiencia brasileña, cuya<br />
producción <strong>de</strong> anual etanol <strong>de</strong> caña <strong>de</strong> azúcar supera 16 mil millones <strong>de</strong> litros y crece a tazas<br />
<strong>el</strong>evadas en bases sostenibles <strong>de</strong>s<strong>de</strong> <strong><strong>de</strong>l</strong> punto <strong>de</strong> vista social, económico y ambiental, así<br />
como la iniciativa <strong>de</strong> diversos países latinoamericanos en implementar programas nacionales<br />
<strong>de</strong> etanol carburante, como por ejemplo Colombia, Costa Rica y Guatemala (CEPAL, 2004).<br />
También cabe observar <strong>de</strong>s<strong>de</strong> <strong><strong>de</strong>l</strong> punto <strong>de</strong> vista interno, la necesidad <strong>de</strong> dinamizar la<br />
agroindustria cañera mexicana y enfrentar <strong>el</strong> preocupante cuadro <strong>de</strong> <strong>de</strong>pen<strong>de</strong>ncia <strong>de</strong><br />
combustibles importados, bajo precios <strong>el</strong>evados y frente a una reducción <strong>de</strong> las reservas<br />
nacionales <strong>de</strong> hidrocarburos.<br />
Un síntoma <strong>de</strong> la creciente percepción <strong>de</strong> los dirigentes mexicanos sobre las oportunida<strong>de</strong>s <strong><strong>de</strong>l</strong><br />
etanol es la reciente evolución <strong><strong>de</strong>l</strong> marco legal, tendiente a proporcionar la base a<strong>de</strong>cuada <strong>para</strong><br />
la adopción <strong>de</strong> etanol en la matriz energética. Así, pue<strong>de</strong>n ser mencionadas la Ley <strong>de</strong><br />
Desarrollo Sustentable <strong>de</strong> Caña <strong>de</strong> Azúcar, que en dos artículos menciona explícitamente la<br />
10
<strong>Potenciales</strong> y <strong>Viabilidad</strong> <strong><strong>de</strong>l</strong> <strong>Uso</strong> <strong>de</strong> <strong>Bioetanol</strong> y <strong>Biodies<strong>el</strong></strong> <strong>para</strong> <strong>el</strong> Transporte en México (SENER-BID-GTZ)<br />
Task 5: Ethanol and ETBE production and end-use in Mexico<br />
necesidad <strong>de</strong> promover <strong>el</strong> etanol como carburante y oxigenante <strong>de</strong> gasolina”, la revisión en<br />
enero <strong>de</strong> 2006 <strong>de</strong> la Normativa 086/94, Especificaciones <strong>de</strong> los combustibles fósiles <strong>para</strong><br />
protección ambiental, estableciendo exigencias <strong>de</strong> oxigenación <strong>para</strong> las gasolinas mexicanas y<br />
abriendo la posibilidad <strong><strong>de</strong>l</strong> empleo <strong>de</strong> etanol como aditivo, bien como la aprobación por la<br />
Cámara <strong>de</strong> Diputados <strong>de</strong> la Ley <strong>para</strong> <strong>el</strong> Desarrollo y Promoción <strong>de</strong> los Bioenergéticos, en abril<br />
<strong>de</strong> 2006. En ese mismo sentido la Secretaria <strong>de</strong> Energía <strong><strong>de</strong>l</strong> gobierno mexicano, en <strong>el</strong> marco <strong>de</strong><br />
un estudio sobre energías renovables <strong>para</strong> México, señaló que las materias primas<br />
potencialmente disponibles <strong>para</strong> producción <strong>de</strong> biocombustibles líquidos (etanol y biodies<strong>el</strong>)<br />
alcanzaban un total <strong>de</strong> 200 PJ por año (SENER, 2006), correspondientes a cerca <strong>de</strong> 33<br />
millones <strong>de</strong> barriles <strong>de</strong> petróleo, cerca <strong>de</strong> 6.5% <strong>de</strong> la oferta interna <strong>de</strong> hidrocarburos en <strong>el</strong><br />
país..<br />
Naturalmente que la viabilidad <strong>de</strong> la producción y utilización <strong><strong>de</strong>l</strong> etanol en México no pue<strong>de</strong><br />
ser <strong>de</strong>terminada <strong>de</strong> forma simplista, mediante una transposición <strong>de</strong> mo<strong><strong>de</strong>l</strong>os aplicados en otros<br />
países. La diversidad <strong>de</strong> implicaciones e interr<strong>el</strong>aciones asociadas al etanol combustible,<br />
involucrando una gama <strong>de</strong> activida<strong>de</strong>s agrícolas, agroindustriales, <strong><strong>de</strong>l</strong> mercado <strong>de</strong><br />
combustibles y sus impactos ambientales y sociales impone un acercamiento individualizado,<br />
que tenga en cuenta las potencialida<strong>de</strong>s y restricciones locales, en escenarios coherentes y<br />
representativos. En este particular, México posee una amplia base productora agrícola, una<br />
fuerte industria energética convencional y una institucionalidad consolidada, <strong>el</strong>ementos clave<br />
a concertar en una propuesta efectiva <strong>para</strong> producir combustibles renovables, al mismo tiempo<br />
en que aspectos singulares <strong>de</strong> las r<strong>el</strong>aciones productivas en <strong>el</strong> sector agrícola, <strong><strong>de</strong>l</strong> merca<strong>de</strong>o <strong>de</strong><br />
combustibles y referentes a articulación <strong>de</strong> los intereses frente a cambios en la estructura<br />
energética imponen un abordaje caut<strong>el</strong>oso y exploratorio <strong>de</strong> las diversas posibilida<strong>de</strong>s<br />
buscando la inserción consistente <strong><strong>de</strong>l</strong> etanol combustible en la realidad mexicana. Así, <strong>el</strong><br />
<strong>de</strong>safío que se preten<strong>de</strong> discernir en las próximas páginas <strong>de</strong> este informe es caracterizar<br />
económicamente potenciales productivos y <strong>de</strong>mandas a aten<strong>de</strong>r, sin preten<strong>de</strong>r obtener recetas<br />
óptimas o recomendaciones estrictas.<br />
El próximo tópico discurre sobre <strong>el</strong> cuadro actual <strong>de</strong> la producción <strong>de</strong> MTBE y etanol en<br />
México, siguiéndose una discusión sobre las biomasas con potencial <strong>para</strong> producción <strong>de</strong> etanol<br />
y los procesos tecnológicos en pauta, adon<strong>de</strong> las múltiplas alternativas son caracterizadas y<br />
priorizadas en términos <strong>de</strong> sus posibilida<strong>de</strong>s reales. Luego se presentan estudios sobre los<br />
costos <strong>de</strong> producción <strong><strong>de</strong>l</strong> etanol <strong>para</strong> México, <strong>de</strong>sagregados en los costos <strong>de</strong> la materia prima y<br />
costos <strong>de</strong> procesamiento, según diferentes rutas tecnológicas y permitiendo <strong>de</strong>finir las<br />
condiciones <strong>de</strong> atractividad económica frente a los costos <strong>de</strong> oportunidad o <strong>de</strong> indiferencia<br />
<strong>para</strong> <strong>el</strong> etanol mexicano, evaluados <strong>para</strong> <strong>el</strong> mercado <strong>de</strong> combustibles y <strong>para</strong> otras alternativas<br />
<strong>de</strong> utilización <strong>de</strong> las materias primas consi<strong>de</strong>radas. En seguida, <strong>para</strong> tres escenarios <strong>de</strong><br />
penetración <strong><strong>de</strong>l</strong> biocombustible, se abordan las perspectivas <strong>de</strong> mercado <strong>para</strong> <strong>el</strong> etanol en<br />
México y los impactos <strong>de</strong> or<strong>de</strong>n económico <strong>de</strong>currentes <strong>de</strong> su producción en <strong>el</strong> país,<br />
permitiendo finalmente estimar los indicadores resultantes <strong>de</strong> las evaluaciones <strong>de</strong> costos y<br />
efectuar estudios <strong>de</strong> sensibilidad <strong>para</strong> <strong>el</strong> precio <strong><strong>de</strong>l</strong> etanol frente a los condicionantes utilizados<br />
en <strong>el</strong> escenario <strong>de</strong> referencia, sin consi<strong>de</strong>rar la exportación. Con base en estos datos e<br />
informaciones, se presentan las conclusiones <strong><strong>de</strong>l</strong> estudio y se obtienen las recomendaciones<br />
pertinentes <strong>para</strong> la política energética mexicana, que naturalmente <strong>de</strong>berán ser consi<strong>de</strong>radas a<br />
luz <strong>de</strong> las evaluaciones <strong>de</strong> sostenabilidad, objeto <strong>de</strong> otro estudio.<br />
11
<strong>Potenciales</strong> y <strong>Viabilidad</strong> <strong><strong>de</strong>l</strong> <strong>Uso</strong> <strong>de</strong> <strong>Bioetanol</strong> y <strong>Biodies<strong>el</strong></strong> <strong>para</strong> <strong>el</strong> Transporte en México (SENER-BID-GTZ)<br />
Task 5: Ethanol and ETBE production and end-use in Mexico<br />
2. Producción <strong>de</strong> éteres y etanol en México: cuadro actual<br />
A continuación se presenta una visión <strong>de</strong> actuales condiciones <strong>para</strong> la fabricación <strong>de</strong> éteres y<br />
etanol en México, productos que pue<strong>de</strong>n ser utilizados como componentes oxigenantes en la<br />
gasolina buscando mejorar su calidad y reducir las emisiones contaminantes.<br />
2.1. Producción <strong>de</strong> MTBE y TAME<br />
De acuerdo con la actual especificación mexicana, todas las gasolinas regulares, (<strong>de</strong>nominadas<br />
PEMEX Magma, con índice <strong>de</strong> octano mínimo 87) consumidas en las Zonas Metropolitanas<br />
<strong>de</strong> Valle <strong>de</strong> México, Guadalajara y Monterrey y toda la gasolina súper (<strong>de</strong>nominadas PEMEX<br />
Premium, con índice <strong>de</strong> octano mínimo 92) consumida en todo <strong>el</strong> resto <strong><strong>de</strong>l</strong> país, <strong>de</strong>ben<br />
contener aditivo oxigenante que permitan hasta 2.7% <strong>de</strong> oxigeno en peso (SEMARNAT,<br />
2006). Para <strong>el</strong> cumplimento <strong>de</strong> éstas exigencias normativas <strong>de</strong> oxigenación se emplearon<br />
como aditivos <strong>el</strong> MTBE (Metil Terbutil Éter) y <strong>el</strong> TAME (Teramil Metil Éter), siendo<br />
requeridos en 2005 volúmenes <strong>de</strong> 23 MBD (miles barriles por día), parcialmente producidos<br />
en México. La producción <strong>de</strong> esos oxigenantes en México estaría alre<strong>de</strong>dor <strong>de</strong> 10.6 MBD,<br />
45% <strong>de</strong> las necesida<strong>de</strong>s <strong><strong>de</strong>l</strong> país, complementándose las necesida<strong>de</strong>s con MTBE importado.<br />
10<br />
MBD<br />
9<br />
8<br />
7<br />
6<br />
5<br />
4<br />
2000 2001 2002 2003 2004 2005<br />
Figura 2.1. Importación <strong>de</strong> MTBE en México<br />
En la Figura 2.1 se presenta la evolución <strong>de</strong> las importaciones <strong>de</strong> MTBE <strong>para</strong> oxigenar las<br />
gasolinas mexicanas, siendo <strong>el</strong> valor <strong>para</strong> 2005 estimado con base en <strong>el</strong> volumen importado<br />
entre enero y octubre (PEMEX, 2005). Asumiendo un valor <strong>de</strong> US$ 70 <strong>el</strong> barril <strong>de</strong> MTBE<br />
(mediados <strong>de</strong> 2005), en <strong>el</strong> último año ese componente significó una erogación <strong>de</strong><br />
aproximadamente US$ 240 millones. Eventuales diferencias entre los volúmenes <strong>de</strong> éter<br />
<strong>de</strong>mandado se <strong>de</strong>ben esencialmente a la diferencia <strong>de</strong> contenido <strong>de</strong> oxígeno entre MTBE y<br />
TAME.<br />
12
<strong>Potenciales</strong> y <strong>Viabilidad</strong> <strong><strong>de</strong>l</strong> <strong>Uso</strong> <strong>de</strong> <strong>Bioetanol</strong> y <strong>Biodies<strong>el</strong></strong> <strong>para</strong> <strong>el</strong> Transporte en México (SENER-BID-GTZ)<br />
Task 5: Ethanol and ETBE production and end-use in Mexico<br />
La producción <strong>de</strong> éteres <strong>para</strong> oxigenación <strong>de</strong> gasolina en México es realizada en seis plantas<br />
instaladas en refinerías <strong>de</strong> PEMEX, con las capacida<strong>de</strong>s nominales indicadas en la tabla abajo,<br />
que suman 15.6 MBD como MTBE y TAME. Asumiendo una eficiencia <strong>de</strong> operación <strong>de</strong><br />
92%, sería posible producción <strong>de</strong> 14.4 MBD <strong>de</strong> MTBE. En la actualidad esas plantas producen<br />
cerca <strong>de</strong> 10.6 MBD, operando a aproximadamente 70% <strong>de</strong> su capacidad nominal, por<br />
limitaciones <strong>de</strong> disponibilidad <strong>de</strong> corrientes <strong>de</strong> materia prima <strong>de</strong>s<strong>de</strong> las unida<strong>de</strong>s catalíticas <strong>de</strong><br />
las refinerías. En la Tabla 2. se presentan las materias primas utilizadas y los productos <strong>de</strong> esas<br />
plantas, en una configuración <strong>de</strong> volúmenes representativa <strong>para</strong> 2005 (PEMEX, 2005). Estas<br />
plantas eventualmente podrían ser adaptadas <strong>para</strong> utilizar etanol en sustitución al metanol,<br />
pasando a producir en ese caso ETBE (Etil Terbutil Éter) y TAEE (Teramil Etil Éter).<br />
Tabla 2.1. Capacidad <strong>de</strong> las plantas <strong>de</strong> producción <strong>de</strong> MTBE en México<br />
Refinería<br />
MTBE<br />
(MBD)<br />
TAME<br />
(MBD)<br />
Ma<strong>de</strong>ro 2.5 2.3<br />
Ca<strong>de</strong>reyta 2.9 0<br />
Salamanca 1.1 0<br />
Tula 2.3 2.3<br />
Minatitlán 0 0<br />
Salina Cruz 0.7 1.5<br />
Total 9.5 6.1<br />
Tabla 2.2. Materias primas y éteres producidos efectivamente en las plantas <strong>de</strong> PEMEX<br />
Materias primas<br />
Productos<br />
Metanol 2.9 MBD MTBE 6.6 MBD<br />
Butanos e butilenos 39.8 MBD TAME 4.2 MBD<br />
Pentanos<br />
15.0 MBD<br />
2.2. Etanol <strong>de</strong> caña <strong>de</strong> azúcar<br />
La producción <strong>de</strong> etanol, principalmente a partir <strong>de</strong> m<strong>el</strong>azas <strong>de</strong> caña <strong>de</strong> azúcar, es una práctica<br />
bastante conocida en México, utilizada mayormente <strong>para</strong> producir bebidas. Para esa finalidad,<br />
diversos ingenios mexicanos poseen <strong>de</strong>stilerías, pero no necesariamente operando tales<br />
unida<strong>de</strong>s en todas las zafras. Otras materias primas, como <strong>el</strong> mezcal, son utilizadas pero <strong>de</strong><br />
escaso interés energético, ya sea por su baja productividad o por su alto valor <strong>de</strong> mercado.<br />
Las <strong>de</strong>stilerías indicadas en la Tabla 2.3, que representan aproximadamente mitad <strong>de</strong> las<br />
<strong>de</strong>stilarías mexicanas, que operaron en la zafra 02/03 y totalizaron una producción <strong>de</strong> 39.2 mil<br />
metros cúbicos <strong>de</strong> etanol (96º GL), utilizando como materia prima 167.4 mil ton<strong>el</strong>adas <strong>de</strong> mi<strong>el</strong><br />
85º Brix, correspondientes a 53.7% <strong><strong>de</strong>l</strong> total <strong>de</strong> mi<strong>el</strong> producido en esas unida<strong>de</strong>s. En esa zafra<br />
estos ingenios procesaron 12.2 millones <strong>de</strong> ton<strong>el</strong>adas <strong>de</strong> caña, cerca <strong>de</strong> 23% <strong><strong>de</strong>l</strong> total nacional,<br />
cultivados en 143.5 mil hectáreas (COAAZUCAR, 2005). Para la capacidad <strong>de</strong> producción <strong>de</strong><br />
13
<strong>Potenciales</strong> y <strong>Viabilidad</strong> <strong><strong>de</strong>l</strong> <strong>Uso</strong> <strong>de</strong> <strong>Bioetanol</strong> y <strong>Biodies<strong>el</strong></strong> <strong>para</strong> <strong>el</strong> Transporte en México (SENER-BID-GTZ)<br />
Task 5: Ethanol and ETBE production and end-use in Mexico<br />
etanol por zafra se consi<strong>de</strong>ró 300 días <strong>de</strong> operación, un periodo más largo que la zafra ya que<br />
son utilizadas m<strong>el</strong>azas.<br />
Existen otros ingenios en condiciones <strong>de</strong> producir etanol, pero que no operaron en las últimas<br />
zafras. Consi<strong>de</strong>rando su capacidad diaria y análogamente una zafra <strong>de</strong> 300 días <strong>de</strong> operación,<br />
resulta una capacidad anual <strong>de</strong> aproximadamente 167.4 mil metros cúbicos. Los números<br />
anteriores y los datos <strong>de</strong> la Tabla 2.3 (COAAZUCAR, 2005) se refieren a todos tipos <strong>de</strong><br />
etanol, siendo que particularmente <strong>para</strong> etanol anhidro se estima una capacidad productiva <strong>de</strong><br />
110 mil litros día, producidos en las <strong>de</strong>stilerías vinculadas a dos ingenios, La Gloria y San<br />
Nicolás, ambos en <strong>el</strong> Estado <strong>de</strong> Veracruz, respectivamente con 70 mil y 40 mil litros diarios <strong>de</strong><br />
capacidad instalada <strong>de</strong> <strong>de</strong>stilación, que significan cerca <strong>de</strong> 20% <strong>de</strong> la capacidad total <strong>de</strong><br />
<strong>de</strong>stilación (García, 2006). Para las últimas zafras, los máximos valores <strong>de</strong> producción <strong>de</strong><br />
etanol en los diversos ingenios mexicanos alcanzaran un total <strong>de</strong> 70 millones <strong>de</strong> litros/año. En<br />
ese sentido, es interesante observar que la producción alcanzada en la zafra 02/03<br />
correspondió a 55% <strong>de</strong> ese máximo. La Figur.2 presenta como ha variado la producción <strong>de</strong><br />
etanol <strong>de</strong> caña <strong>de</strong> azúcar en México en los últimos quince años.<br />
Tabla 2.3. Capacidad instalada y producción <strong>de</strong> etanol en la zafra <strong>de</strong> 02/03 los ingenios <strong>de</strong><br />
México<br />
Ingenio<br />
Capacidad instalada Zafra 02/03<br />
(litros/día)<br />
(litros/zafra)<br />
Mi<strong>el</strong><br />
producida<br />
(t)<br />
Mi<strong>el</strong> utilizada<br />
<strong>para</strong> etanol<br />
(t)<br />
Etanol<br />
producido<br />
(litros)<br />
Aarón Sáenz 28,500 8,550,000 39,756 21,028 4,948,000<br />
Calipam 8,000 2,400,000 8,531 4,194 990,261<br />
Constancia 30,000 9,000,000 21,675 21,248 4,997,400<br />
El Carmen 18,000 5,400,000 19,815 11,872 2,923,000<br />
El Mante 24,000 7,200,000 32,811 19,654 5,082,300<br />
In<strong>de</strong>pen<strong>de</strong>ncia 15,000 4,500,000 7,845 4,743 1,250,908<br />
La Joya 14,000 4,200,000 11,637 6,409 1,307,000<br />
La Provi<strong>de</strong>ncia 25,000 7,500,000 20,322 8,653 1,818,471<br />
Pujiltic 20,000 6,000,000 49,380 14,122 3,373,004<br />
San José <strong>de</strong> Abajo 25,000 7,500,000 15,048 4,348 1,118,000<br />
San Nicolás 40,000 12,000,000 14,800 10,973 2,547,683<br />
San Pedro 25,000 7,500,000 27,341 13,140 3,206,000<br />
Tamazula 25,000 7,500,000 42,463 27,000 5,643,750<br />
total 297,500 89,250,000 311,425 167,384 39,205,777<br />
14
<strong>Potenciales</strong> y <strong>Viabilidad</strong> <strong><strong>de</strong>l</strong> <strong>Uso</strong> <strong>de</strong> <strong>Bioetanol</strong> y <strong>Biodies<strong>el</strong></strong> <strong>para</strong> <strong>el</strong> Transporte en México (SENER-BID-GTZ)<br />
Task 5: Ethanol and ETBE production and end-use in Mexico<br />
80,000<br />
1000 Litros<br />
60,000<br />
40,000<br />
20,000<br />
1988 1992 1996 2000 2004<br />
Figura 2.2. Producción <strong>de</strong> etanol <strong>de</strong> caña <strong>de</strong> azúcar en México, 1988/2004<br />
En términos <strong>de</strong> caña procesada y azúcar producidos, la agroindustria cañera mexicana presenta<br />
una producción r<strong>el</strong>ativamente estable, <strong>de</strong> acuerdo a los indicadores presentados en la Tabla 2.4<br />
(COAAZUCAR, 2005). El volumen <strong>de</strong> producción observado en las recientes zafras,<br />
alre<strong>de</strong>dor <strong>de</strong> 4 a 5 millones <strong>de</strong> ton<strong>el</strong>adas <strong>de</strong> azúcar, correspon<strong>de</strong> a aproximadamente 3.8% <strong>de</strong><br />
la producción mundial y es prácticamente consumido en su totalidad por <strong>el</strong> mercado interno,<br />
siendo aun necesaria alguna importación <strong>para</strong> aten<strong>de</strong>r completamente las necesida<strong>de</strong>s<br />
mexicanas. Consi<strong>de</strong>rando las últimas cinco zafras, la importación <strong>de</strong> azúcar anual fue <strong>de</strong><br />
149,000 ton<strong>el</strong>adas, cerca <strong>de</strong> 2.5% <strong>de</strong> las necesida<strong>de</strong>s <strong><strong>de</strong>l</strong> país (FAOSTAT, 2006).<br />
El Estado <strong>de</strong> Veracruz es la región productora más importante, con 37% <strong>de</strong> las 58 plantas<br />
azucareras mexicanas y 39% <strong>de</strong> la producción <strong>de</strong> azúcar. La capacidad <strong>de</strong> procesamiento<br />
diario <strong>de</strong> esas plantas varía entre 2,200 a 20,000 ton<strong>el</strong>adas, con un promedio <strong>de</strong> 6,680<br />
ton<strong>el</strong>adas. En términos <strong>de</strong> capacidad anual <strong>de</strong> procesamiento, 75% <strong>de</strong> los ingenios mexicanos<br />
presentan capacida<strong>de</strong>s superiores a 80 mil ton<strong>el</strong>adas y 17% procesan menos que 40 mil<br />
ton<strong>el</strong>adas al año. Cerca <strong>de</strong> la mitad <strong>de</strong> la capacidad total <strong>de</strong> la agroindustria cañera mexicana<br />
se encuentra en manos privadas, con 27 ingenios bajo administración gubernamental (CNIAA,<br />
2006). Entre los grupos privados, por volumen <strong>de</strong> producción se <strong>de</strong>stacan <strong>el</strong> Grupo Beta San<br />
Migu<strong>el</strong>, Zucarmex, Sáenz y Piasa, respectivamente con 9.7%, 8.5%, 7.7% e 5.9% <strong>de</strong> la<br />
producción mexicana <strong>de</strong> azúcar.<br />
15
<strong>Potenciales</strong> y <strong>Viabilidad</strong> <strong><strong>de</strong>l</strong> <strong>Uso</strong> <strong>de</strong> <strong>Bioetanol</strong> y <strong>Biodies<strong>el</strong></strong> <strong>para</strong> <strong>el</strong> Transporte en México (SENER-BID-GTZ)<br />
Task 5: Ethanol and ETBE production and end-use in Mexico<br />
Año<br />
Tabla 2.4. Datos básicos la agroindustria cañera <strong>de</strong> México<br />
Área cultivada Producción <strong>de</strong> caña Producción <strong>de</strong> azúcar<br />
(ha) (t ) (t )<br />
1990 511,653 34,894,735 3,173,308<br />
1991 530,591 38,186,634 3,669,426<br />
1992 480,975 35,476,716 3,298,722<br />
1993 510,577 39,876,064 4,087,173<br />
1994 492,597 34,097,564 3,559,439<br />
1995 521,164 40,134,840 4,290,464<br />
1996 577,106 40,183,904 4,391,269<br />
1997 585,672 42,168,359 4,557,005<br />
1998 634,197 47,355,479 5,188,137<br />
1999 642,625 43,589,254 4,713,503<br />
2000 619,343 42,102,937 4,710,354<br />
2001 601,988 44,480,893 4,936,533<br />
2002 610,121 42,903,686 4,885,726<br />
2003 609,358 43,946,918 4,942,730<br />
2004 612,360 45,455,470 5,039,680<br />
Consi<strong>de</strong>rando las cinco zafras a partir <strong><strong>de</strong>l</strong> año 2000, los indicadores básicos <strong>de</strong> productividad<br />
en <strong>el</strong> campo y en la agroindustria son respectivamente 71.7 ton<strong>el</strong>adas <strong>de</strong> caña por hectárea y<br />
112 kg <strong>de</strong> azúcar por ton<strong>el</strong>ada <strong>de</strong> caña procesada. La Figura 2.3 muestra cómo estos<br />
indicadores han variado poco a lo largo <strong>de</strong> los últimos años. Es importante observar que <strong>el</strong><br />
r<strong>el</strong>ativo incremento <strong>de</strong> la productividad industrial fue consecuencia <strong>de</strong> mejoras tanto en la<br />
calidad <strong>de</strong> la caña como en propio proceso industrial. Como un índice <strong>de</strong> la eficiencia<br />
energética <strong>de</strong> los ingenios mexicanos se pue<strong>de</strong> tomar <strong>el</strong> consumo <strong>de</strong> petróleo (fu<strong>el</strong> oil o<br />
combustóleo, como se le conoce en México) , que en la década <strong>de</strong> noventa era cerca <strong>de</strong> 20 kg<br />
por ton<strong>el</strong>ada <strong>de</strong> caña procesada y en los últimos años ha bajado <strong>para</strong> casi la mitad, indicando<br />
una evolución favorable, aunque existe un claro espacio <strong>para</strong> perfeccionamiento, en la medida<br />
que <strong>el</strong> bagazo producido podría seguramente aten<strong>de</strong>r la <strong>de</strong>manda energética <strong>de</strong> la agroindustria<br />
cañera (Poy, 1998).<br />
16
<strong>Potenciales</strong> y <strong>Viabilidad</strong> <strong><strong>de</strong>l</strong> <strong>Uso</strong> <strong>de</strong> <strong>Bioetanol</strong> y <strong>Biodies<strong>el</strong></strong> <strong>para</strong> <strong>el</strong> Transporte en México (SENER-BID-GTZ)<br />
Task 5: Ethanol and ETBE production and end-use in Mexico<br />
120<br />
100<br />
80<br />
60<br />
40<br />
20<br />
Productividad agrícola (t/ha)<br />
Productividad industrial (kg/t caña)<br />
0<br />
1990 1992 1994 1996 1998 2000 2002 2004<br />
Figura 2.2. Evolución <strong>de</strong> indicadores <strong>de</strong> productividad en la industria azucarera <strong>de</strong> México<br />
De interés <strong>para</strong> la producción <strong>de</strong> etanol, en promedio <strong>para</strong> todos los ingenios y con pequeña<br />
variación en los últimos años, fueron producidos cerca <strong>de</strong> 37.5 kg <strong>de</strong> mi<strong>el</strong> con 85º Brix por<br />
ton<strong>el</strong>ada <strong>de</strong> caña procesada, mientras por cada ton<strong>el</strong>ada <strong>de</strong> mi<strong>el</strong> utilizado <strong>para</strong> producción <strong>de</strong><br />
etanol, resultaron 246 litros <strong>de</strong> etanol 96º GL, o sea serian producidos 8.8 litros <strong>de</strong> etanol<br />
anhidro por ton<strong>el</strong>ada <strong>de</strong> caña procesada, en <strong>el</strong> caso que toda <strong>el</strong> mi<strong>el</strong> disponible se utilizase <strong>para</strong><br />
producción <strong>de</strong> etanol (CNIAA, 2006). Estos valores serán utilizados a<strong><strong>de</strong>l</strong>ante en <strong>el</strong> presente<br />
estudio. Consi<strong>de</strong>rando solamente los ingenios con producción <strong>de</strong> etanol, la Figura 2.4 muestra<br />
que ha variado poco la disponibilidad específica <strong>de</strong> mi<strong>el</strong> final y la producción <strong>de</strong> alcohol por<br />
unidad <strong>de</strong> m<strong>el</strong>aza procesada. Asumiendo esa productividad <strong>de</strong> etanol y <strong>el</strong> total <strong>de</strong> caña<br />
procesada, podrían ser producidos cerca <strong>de</strong> 400 mil metros cúbicos <strong>de</strong> etanol por año.<br />
En la Figura 2.5 se presenta la distribución <strong>de</strong> las plantas <strong>de</strong> la agroindustria azucarera en <strong>el</strong><br />
territorio mexicano, adon<strong>de</strong> se percibe la importancia <strong>de</strong> las regiones <strong>de</strong> Costa <strong><strong>de</strong>l</strong> Golfo (Poy,<br />
2005). Se estima que la agroindustria azucarera mexicana represente <strong>el</strong> 0.54% <strong><strong>de</strong>l</strong> PIB<br />
nacional mexicano y más <strong>de</strong> 13% <strong><strong>de</strong>l</strong> producto económico <strong><strong>de</strong>l</strong> sector agropecuario, silvicultura<br />
y pesca (INEGI, 2005). Eventualmente estos números no correspondan al total <strong>de</strong> etanol<br />
producido, pues posiblemente una parte no es contabilizada 1 .<br />
1 Se informó que la producción real <strong>de</strong> etanol en México podría ser más <strong>de</strong> 20% superior a los valores indicados,<br />
<strong>de</strong>bido a posibilidad <strong>de</strong> frau<strong>de</strong>s y <strong>de</strong>svíos <strong>de</strong> producción sin recaudación <strong>de</strong> impuestos.<br />
17
<strong>Potenciales</strong> y <strong>Viabilidad</strong> <strong><strong>de</strong>l</strong> <strong>Uso</strong> <strong>de</strong> <strong>Bioetanol</strong> y <strong>Biodies<strong>el</strong></strong> <strong>para</strong> <strong>el</strong> Transporte en México (SENER-BID-GTZ)<br />
Task 5: Ethanol and ETBE production and end-use in Mexico<br />
300<br />
250<br />
200<br />
150<br />
100<br />
Mi<strong>el</strong>es a 85º Brix (kg por t <strong>de</strong> caña)<br />
Alcohol (litros por t <strong>de</strong> mi<strong>el</strong>)<br />
50<br />
0<br />
1988 1990 1992 1994 1996 1998 2000 2002 2004<br />
Figura 2.4. Evolución <strong>de</strong> la producción <strong>de</strong> mi<strong>el</strong> final y alcohol en los ingenios mexicanos<br />
Figura 2.5. Ubicación <strong>de</strong> los ingenios azucareros en México (Poy, 2005)<br />
18
<strong>Potenciales</strong> y <strong>Viabilidad</strong> <strong><strong>de</strong>l</strong> <strong>Uso</strong> <strong>de</strong> <strong>Bioetanol</strong> y <strong>Biodies<strong>el</strong></strong> <strong>para</strong> <strong>el</strong> Transporte en México (SENER-BID-GTZ)<br />
Task 5: Ethanol and ETBE production and end-use in Mexico<br />
3. Biomasas con potencial <strong>para</strong> producción <strong>de</strong> etanol<br />
La producción <strong>de</strong> etanol su<strong>el</strong>e emplear materias primas azucaradas o amiláceas, como<br />
respectivamente son la caña <strong>de</strong> azúcar y <strong>el</strong> maíz, que representan las alternativas más<br />
adoptadas en las plantas agroindustriales existentes hoy día. Sin embargo, la amplia diversidad<br />
edafoclimática <strong>de</strong> México y las particularida<strong>de</strong>s <strong>de</strong> la agricultura practicada hace siglos en ese<br />
país proporcionan diversas otras opciones, que interesa evaluar pr<strong>el</strong>iminarmente,<br />
estableciendo un punto <strong>de</strong> partida <strong>para</strong> evaluaciones más <strong>de</strong>talladas. Como un ejemplo <strong>de</strong> la<br />
gama <strong>de</strong> materias primas que, por lo menos como planteamiento teórico podrían ser utilizadas<br />
<strong>para</strong> producir etanol, la tabla a seguir reúne <strong>de</strong>s<strong>de</strong> cultivos tradicionales hasta otros casi<br />
<strong>de</strong>sconocidos y algunos subproductos agroindustriales (adaptado <strong>de</strong> SAGARPA, 2004).<br />
Tabla 3.1. Fuentes posibles <strong>de</strong> material prima <strong>para</strong> producción <strong>de</strong> etanol<br />
Producto básico a ser<br />
convertido en etanol<br />
Azucares<br />
Almidón<br />
C<strong>el</strong>ulosa<br />
Ejemplos<br />
• Sacarosa <strong>de</strong> cultivos sacáridos: caña <strong>de</strong> azúcar, remolacha,<br />
sorgo dulce<br />
• Azucares invertidos y glucosas: m<strong>el</strong>azas y otros residuos<br />
agroindustriales, como lactosas<br />
• Granos <strong>de</strong> cereales: maíz, sorgo, trigo, cebada<br />
• Productos procesados: harina <strong>de</strong> trigo, cascarilla <strong>de</strong> maíz<br />
• Raíces almidonadas: yuca, papa, patata, alcachofa isra<strong>el</strong>ita<br />
• Residuos lignoc<strong>el</strong>ulósicos: aserrín, paja, residuos boscosos,<br />
residuos agrícolas, lejía c<strong>el</strong>ulósica<br />
• Residuos urbanos y industriales: pap<strong>el</strong>, fracciones c<strong>el</strong>ulósicas<br />
Sin embargo, seria poco eficaz preten<strong>de</strong>r profundizar <strong>el</strong> análisis <strong>de</strong> una lista tan amplia <strong>de</strong><br />
materias primas y algunos criterios sencillos permiten reducir <strong>el</strong> número <strong>de</strong> cultivos a ser<br />
evaluado en <strong>el</strong> presente estudio. A pesar <strong><strong>de</strong>l</strong> precio generalmente atractivo <strong>de</strong> las materias<br />
primas c<strong>el</strong>ulósicas, como la paja <strong>de</strong> trigo, <strong>el</strong> cogollo (puntas <strong>de</strong> la caña) y las hojas <strong>de</strong> caña, las<br />
tecnologías <strong>para</strong> producción <strong>de</strong> etanol a partir <strong>de</strong> estos materiales aun están en <strong>de</strong>sarrollo, con<br />
perspectivas comerciales aun no <strong>de</strong>finidas. Por otra parte, hay evi<strong>de</strong>ntes restricciones<br />
climáticas y <strong>de</strong> disponibilidad <strong>de</strong> agua que limitan la expansión en México <strong>de</strong> algunos<br />
cultivos <strong>de</strong> clima más templado, asimismo existen limitaciones económicas en la oferta <strong>de</strong><br />
ciertos productos, por su alto costo o por presentar una utilización alternativa más ventajosa.<br />
Buscando auxiliar en la <strong>de</strong>finición <strong>de</strong> los cultivos a consi<strong>de</strong>rar y bajo los supuestos anteriores,<br />
se s<strong>el</strong>eccionó un grupo <strong>de</strong> materias primas, listado en la Tabla 3.2Tabla 3.2., justamente las<br />
más mencionadas como <strong>de</strong> interés bioenergético, asociado a un conjunto <strong>de</strong> indicadores<br />
cualitativos <strong>para</strong> evaluar las posibilida<strong>de</strong>s <strong>de</strong> tales productos agrícolas en la producción <strong>de</strong><br />
etanol. Cabe observar que la valoración presentada en esa tabla podrá cambiar como resultado<br />
<strong><strong>de</strong>l</strong> <strong>de</strong>sarrollo <strong>de</strong> nuevas tecnologías industriales y agrícolas, así como por la evolución<br />
favorable <strong><strong>de</strong>l</strong> marco económico, pero es importante reconocer la <strong>el</strong>ección pr<strong>el</strong>iminar a<strong>de</strong>cuada<br />
<strong>de</strong> las fuentes <strong>de</strong> materia prima como absolutamente <strong>de</strong>terminante <strong>para</strong> <strong>el</strong> éxito <strong>de</strong> un<br />
19
<strong>Potenciales</strong> y <strong>Viabilidad</strong> <strong><strong>de</strong>l</strong> <strong>Uso</strong> <strong>de</strong> <strong>Bioetanol</strong> y <strong>Biodies<strong>el</strong></strong> <strong>para</strong> <strong>el</strong> Transporte en México (SENER-BID-GTZ)<br />
Task 5: Ethanol and ETBE production and end-use in Mexico<br />
programa bioenergético y no parece recomendable preten<strong>de</strong>r promover <strong>el</strong> uso energético <strong>de</strong><br />
cultivos <strong>de</strong> posibilida<strong>de</strong>s prometedoras pero aun poco conocidas.<br />
Tabla 3.2. Aspectos generales <strong>de</strong> las biomasas <strong>de</strong> interés <strong>para</strong> la producción <strong>de</strong> etanol<br />
Cultivo<br />
Conocimiento<br />
agronómico<br />
Exigencia<br />
edafoclimática<br />
Tecnología <strong>para</strong> producción<br />
<strong>de</strong> etanol<br />
Posibilidad <strong>de</strong><br />
integración productiva<br />
y uso <strong>de</strong> subproductos<br />
caña alto alta conocida y practicada alta<br />
maíz alto alta Conocida y practicada ( EUA) alta<br />
sorgo dulce mediano mediana conocida mediana<br />
yuca limitado baja conocida (Tailandia) baja<br />
remolacha<br />
azucarera<br />
bajo mediana conocida (Europa) baja<br />
En ese sentido y sin restar r<strong>el</strong>evancia a estudios complementarios <strong>de</strong> carácter aplicado que<br />
<strong><strong>de</strong>l</strong>imiten nuevas posibilida<strong>de</strong>s <strong>de</strong> forma <strong>de</strong>tallada, parece suficientemente claro que a corto y<br />
mediano plazo los cultivos más atractivos y que merecen una inmediata atención son la caña<br />
<strong>de</strong> azúcar, <strong>el</strong> maíz, <strong>el</strong> sorgo y la yuca. El caso <strong>de</strong> la remolacha pue<strong>de</strong> presentar un singular<br />
nicho <strong>de</strong> interés en México, r<strong>el</strong>acionado con la disponibilidad <strong>de</strong> vapor <strong>de</strong> baja presión <strong>de</strong> la<br />
Central Geotermo<strong>el</strong>éctrica <strong>de</strong> “Cerro Prieto”, localizada en la zona <strong><strong>de</strong>l</strong> Valle <strong><strong>de</strong>l</strong> Mexicali,<br />
adon<strong>de</strong> se cree ser posible expandir ese cultivo 2 .<br />
Un factor que justificaría limitar la evaluación <strong>de</strong> las materias primas <strong>de</strong> interés apenas a la<br />
caña y <strong>el</strong> maíz es la disponibilidad <strong>de</strong> informaciones necesarias <strong>para</strong> a<strong>de</strong>cuadamente<br />
cuantificar costos, beneficios y caracterizar procesos, inclusive por que en los países adon<strong>de</strong> la<br />
producción <strong>de</strong> etanol ya se <strong>de</strong>sarrolla <strong>de</strong> forma comercial se utiliza esencialmente estos<br />
cultivos. Así, <strong>para</strong> seguir evaluando <strong>el</strong> sorgo, la yuca y la remolacha es preciso reconocer que<br />
la calidad y representatividad <strong>de</strong> los datos es necesariamente más reducida.<br />
A continuación, <strong>para</strong> los cultivos consi<strong>de</strong>rados <strong>de</strong> mayor interés, se presentan valores <strong>de</strong><br />
productividad y costos <strong>de</strong> producción (sin incluir <strong>el</strong> costo <strong>de</strong> renta <strong>de</strong> la tierra), como<br />
promedios <strong>para</strong> México y <strong>para</strong> los contextos recomendados como más a<strong>de</strong>cuados o<br />
prometedores (Lazcano, 2006):<br />
a) caña <strong>de</strong> azúcar - caña <strong>de</strong> temporal en las regiones Huastecas y Veracruz Centro.<br />
b) maíz grano y sorgo dulce - región <strong><strong>de</strong>l</strong> Mar <strong>de</strong> Cortés, específicamente Sinaloa, con<br />
tecnología <strong>de</strong> riego en los Valles <strong>de</strong> Culiacán y <strong><strong>de</strong>l</strong> Fuerte.<br />
c) yuca y remolacha - las regiones <strong>de</strong> Bajo Papaloapan y Peninsular<br />
2 Como una referencia <strong>para</strong> la evaluación <strong><strong>de</strong>l</strong> empleo energético <strong>de</strong> la remolacha, cabe observar que la producción<br />
europea <strong>de</strong> azúcar a partir <strong>de</strong> remolacha se encuentra en clara retracción <strong>de</strong>bido a reducción <strong>de</strong> las barreras<br />
aranc<strong>el</strong>arias que protegían este cultivo frente a los costos significativamente más bajos <strong><strong>de</strong>l</strong> azúcar <strong>de</strong> caña.<br />
20
<strong>Potenciales</strong> y <strong>Viabilidad</strong> <strong><strong>de</strong>l</strong> <strong>Uso</strong> <strong>de</strong> <strong>Bioetanol</strong> y <strong>Biodies<strong>el</strong></strong> <strong>para</strong> <strong>el</strong> Transporte en México (SENER-BID-GTZ)<br />
Task 5: Ethanol and ETBE production and end-use in Mexico<br />
Como se citó, hay una carencia <strong>de</strong> información en <strong>de</strong>talle <strong>para</strong> los cultivos no convencionales<br />
y los costos fueron estimados con base a situaciones análogas en otros países. Para <strong>el</strong> sorgo se<br />
encuentran datos <strong>para</strong> <strong>el</strong> sorgo grano, que pero pue<strong>de</strong> ser utilizado <strong>para</strong> producir etanol<br />
mediante procesos similares al maíz, pero poca información se encontró sobre <strong>el</strong> sorgo dulce<br />
(Sorghum bicolor (L.) Moench) en México, la variedad que en todo <strong>el</strong> mundo ha sido más<br />
frecuentemente consi<strong>de</strong>rada como cultivo <strong>de</strong> interés <strong>para</strong> producción <strong>de</strong> etanol, en rutas<br />
semejantes a la caña, así se tomaran indicadores <strong>de</strong> productividad y costos observados en<br />
culturas americanas (Rains et al., 2005), agregándose los costos <strong>de</strong> cosecha y transporte<br />
similares a caña en México (Poy, 2005), resultando 20.8 dólares por ton<strong>el</strong>ada. Para la yuca se<br />
tomaran datos <strong>de</strong> cultivo <strong>para</strong> fines industriales en Brasil y en Magdalena, Colombia, adon<strong>de</strong><br />
ese cultivo es consi<strong>de</strong>rado r<strong>el</strong>evante, adoptándose un costo unitario <strong>de</strong> 51 dólares por ton<strong>el</strong>ada<br />
(ABAM, 2006 y Quintero et al., 2004). Para la remolacha se adoptaran datos <strong>de</strong> costos <strong><strong>de</strong>l</strong><br />
estudio <strong>de</strong> Lazcano, bastante similares a los resultados <strong>de</strong> un reciente estudio australiano<br />
(RIRDC, 2005). Sin embargo, es forzoso reconocer que producir 85 ton<strong>el</strong>adas por hectárea,<br />
conforme a lo planteado en ese informe, parece bastante optimista, particularmente<br />
consi<strong>de</strong>rando los valores observados en las resultados consolidados <strong>de</strong> zafra <strong>para</strong> diversos<br />
países europeos con larga tradición en cultivos industriales <strong>de</strong> remolacha (F.O. Licht, 2005).<br />
De ese modo se adoptó una productividad <strong>de</strong> 51 ton<strong>el</strong>adas por hectárea, idéntica al promedio<br />
europeo (FAOSTAT, 2006) y utilizando los costos unitarios indicados por Lazcano, se calculó<br />
un costo <strong>de</strong> producción <strong>de</strong> 35.6 dólares por ton<strong>el</strong>ada.<br />
Tabla 3.3. Productividad y costos estimados <strong>para</strong> las biomasas <strong>de</strong> interés <strong>para</strong> la producción<br />
<strong>de</strong> etanol en México<br />
Cultivo<br />
Área cultivada<br />
miles ha<br />
Productividad<br />
promedio<br />
t producto/ ha<br />
Contexto recomendado<br />
Productividad<br />
t producto/ ha<br />
Costo <strong>de</strong><br />
producción<br />
US$/t<br />
Caña 612.4 71 61 21.7<br />
Maíz 7,220.2 2.8 10 *119.8<br />
Sorgo dulce 12.3 - 40 20.8<br />
Yuca sin datos - 14 51.0<br />
Remolacha<br />
sin datos - 51 35.6<br />
azucarera<br />
* no incluye la venta <strong>de</strong> granos <strong>de</strong> <strong>de</strong>stilería<br />
A partir <strong>de</strong> esos valores se estimó la productividad y costos correspondientes en etanol, como<br />
se presenta a continuación. En todas esas evaluaciones se adoptó una tasa <strong>de</strong> cambio <strong>de</strong> 10.89<br />
pesos mexicanos por dólar, valor promedio <strong>para</strong> 2005 (CEFP, 2005). Obsérvese que <strong>el</strong> costo<br />
<strong>de</strong> producción <strong>para</strong> <strong>el</strong> etanol se refiere solamente al costo <strong>de</strong> la materia prima, sin consi<strong>de</strong>rar <strong>el</strong><br />
costo <strong>de</strong> renta <strong>de</strong> la tierra o <strong>el</strong> valor <strong>de</strong> otros coproductos, como los granos <strong>de</strong> <strong>de</strong>stilería,<br />
r<strong>el</strong>evante <strong>para</strong> <strong>el</strong> maíz. Para <strong>el</strong> caso <strong>de</strong> la caña se refiere al proceso empleando directamente<br />
jugo <strong>de</strong> caña. En los capítulos siguientes <strong><strong>de</strong>l</strong> presente informe los procesos <strong>de</strong> conversión y los<br />
costos serán presentados <strong>para</strong> cada materia prima, <strong>de</strong>tallándose los parámetros adoptados en la<br />
Tabla 3.4 <strong>para</strong> conversión hacia etanol.<br />
21
<strong>Potenciales</strong> y <strong>Viabilidad</strong> <strong><strong>de</strong>l</strong> <strong>Uso</strong> <strong>de</strong> <strong>Bioetanol</strong> y <strong>Biodies<strong>el</strong></strong> <strong>para</strong> <strong>el</strong> Transporte en México (SENER-BID-GTZ)<br />
Task 5: Ethanol and ETBE production and end-use in Mexico<br />
Tabla 3.4. Productividad <strong>de</strong> etanol y costos <strong>de</strong> las biomasas <strong>de</strong> interés por unidad <strong>de</strong> etanol<br />
producido en los contextos recomendados<br />
Cultivo<br />
Productividad industrial<br />
litro/ t<br />
Costo <strong>de</strong> la materia prima<br />
US$/ litro<br />
Caña 80 0.271<br />
Maíz 398 0.296<br />
Sorgo dulce 35 0.596<br />
Yuca 170 0.300<br />
Remolacha azucarera 86 0.414<br />
Estos resultados <strong>de</strong>ben ser analizados críticamente, en la medida que representan expectativas<br />
y contextos diferenciados entre los cultivos estudiados. Por ejemplo, no se consi<strong>de</strong>ró la<br />
eventual producción <strong>de</strong> coproductos con valor económico importante, caso r<strong>el</strong>evante <strong>para</strong> <strong>el</strong><br />
maíz, cuando pue<strong>de</strong> significar una reducción <strong>de</strong> cerca <strong>de</strong> 20% en <strong>el</strong> costo <strong><strong>de</strong>l</strong> etanol, como se<br />
verá a<strong><strong>de</strong>l</strong>ante en Capítulo 5 <strong>de</strong> este informe. La productividad agrícola <strong>de</strong> la caña inferior al<br />
promedio nacional mexicano es <strong>de</strong>bido al carácter temporal <strong><strong>de</strong>l</strong> cultivo consi<strong>de</strong>rado,<br />
exactamente <strong>para</strong> no utilizar las tierras más nobles y <strong>de</strong> riego. A su vez, <strong>para</strong> <strong>el</strong> maíz se asumió<br />
una <strong>el</strong>evada productividad, bastante más alta que <strong>el</strong> promedio <strong><strong>de</strong>l</strong> país, por emplearse riego.<br />
Igualmente <strong>para</strong> los <strong>de</strong>más cultivos evaluados, es esencial remarcar que se tratan <strong>de</strong> contextos<br />
arbitrariamente <strong>de</strong>finidos, representando configuraciones productivas particulares y en la<br />
extensión posible, factibles <strong>de</strong> reproducción en mayor escala en México. Hecho esas reservas,<br />
se presenta en la próxima figura como varía la productividad agroindustrial <strong>de</strong> etanol, <strong>para</strong> los<br />
contextos evaluados.<br />
6,000<br />
litro/ ha<br />
5,000<br />
4,000<br />
3,000<br />
2,000<br />
1,000<br />
0<br />
Caña Maíz Sorgo dulce Yuca Remolacha<br />
azucarera<br />
Figura 3.1. Productividad agroindustrial <strong>de</strong> etanol <strong>para</strong> diferentes cultivos en los escenarios<br />
evaluados<br />
22
<strong>Potenciales</strong> y <strong>Viabilidad</strong> <strong><strong>de</strong>l</strong> <strong>Uso</strong> <strong>de</strong> <strong>Bioetanol</strong> y <strong>Biodies<strong>el</strong></strong> <strong>para</strong> <strong>el</strong> Transporte en México (SENER-BID-GTZ)<br />
Task 5: Ethanol and ETBE production and end-use in Mexico<br />
Los aspectos principales a tener en cuenta al promover un cultivo <strong>para</strong> fines energéticos son<br />
naturalmente su productividad y su costo, como se mostró en los últimos párrafos. De hecho,<br />
<strong>para</strong> plantear un cultivo <strong>para</strong> fines bioenergéticos es esencial minimizar los requerimientos <strong>de</strong><br />
área y presentar <strong>el</strong>evada viabilidad económica. Obsérvese que la materia prima representa <strong>el</strong><br />
componente más gran<strong>de</strong> <strong><strong>de</strong>l</strong> costo final <strong><strong>de</strong>l</strong> etanol, típicamente alre<strong>de</strong>dor <strong>de</strong> 60%. Sin<br />
embargo hay aspectos adicionales también muy importantes como la competencia con la<br />
producción <strong>de</strong> alimentos, la capacidad <strong>de</strong> provisión <strong>de</strong> servicios <strong>de</strong> extensión agrícola y la<br />
<strong>de</strong>manda asociada <strong>de</strong> recursos naturales <strong>para</strong> producción agrícola, particularmente su<strong>el</strong>os<br />
fértiles y agua. A<strong>de</strong>más, la existencia <strong>de</strong> coproductos y subproductos, <strong>de</strong> valor alimentario,<br />
industrial o energético, es también un aspecto muy importante, que pue<strong>de</strong> conferir una<br />
<strong>de</strong>seable flexibilidad en la producción bioenergética, asociando la disponibilidad <strong>de</strong><br />
biocombustibles con otras fuentes <strong>de</strong> valor económico.<br />
Des<strong>de</strong> <strong>el</strong> punto <strong>de</strong> vista <strong>de</strong> la disponibilidad interna <strong>de</strong> alimentos, entre los cultivos bajo<br />
evaluación <strong>para</strong> México se <strong>de</strong>staca <strong>de</strong>sfavorablemente <strong>el</strong> maíz y <strong>el</strong> trigo, componentes básicos<br />
<strong>de</strong> la dieta nacional y actualmente importados respectivamente en 26% y 68% <strong>de</strong> las<br />
necesida<strong>de</strong>s <strong><strong>de</strong>l</strong> país (FAOSTAT, 2006). Dedicar las mejores regiones productivas a fines<br />
bioenergéticos en contextos <strong>de</strong> escasez <strong>de</strong> bienes básicos <strong>de</strong>be ser tomado con caut<strong>el</strong>a.<br />
Igualmente consi<strong>de</strong>rando las condiciones mexicanas, se recomienda cuidado al proponer la<br />
expansión <strong>de</strong> cultivos <strong>para</strong> producción <strong>de</strong> biocombustibles empleando regularmente riego, que<br />
implica en costos adicionales y principalmente la priorización <strong>de</strong> la bioenergía frente a otros<br />
usos.<br />
Otro punto r<strong>el</strong>evante <strong>para</strong> la s<strong>el</strong>ección <strong>de</strong> biomasas con potencial <strong>para</strong> producción <strong>de</strong><br />
biocombustibles es <strong>el</strong> balance energético, o sea, la r<strong>el</strong>ación entre la energía producida y la<br />
<strong>de</strong>manda <strong>de</strong> energía directa e indirecta <strong>para</strong> producir energía, siendo más interesantes los<br />
cultivos <strong>de</strong> alta productividad y baja <strong>de</strong>manda <strong>de</strong> insumos energéticos exógenos. En ese<br />
sentido no se disponen <strong>de</strong> estudios sobre la realidad mexicana, pero <strong>de</strong>tallados estudios hechos<br />
en Brasil y EUA apuntan respectivamente r<strong>el</strong>aciones energéticas (output/input) entre 8 a 10<br />
<strong>para</strong> etanol <strong>de</strong> caña y hasta 2 <strong>para</strong> etanol <strong>de</strong> maíz. Solo este aspecto ya indicaría un limitado<br />
espacio <strong>para</strong> <strong>el</strong> maíz como fuente <strong>de</strong> materia prima <strong>para</strong> fabricar etanol com<strong>para</strong>tivamente a<br />
caña, sin embargo este tema será abordado en más extensión en otro estudio <strong>de</strong> ese proyecto,<br />
en la Tarea 6.<br />
Con r<strong>el</strong>ación a los cultivos no convencionales <strong>para</strong> producción <strong>de</strong> etanol, como <strong>el</strong> sorgo, yuca<br />
y remolacha, es muy importante tener claro su carácter innovador, eventualmente oportuno<br />
<strong>para</strong> nichos particulares <strong>de</strong> alto interés, por su eventual a<strong>de</strong>cuación a su<strong>el</strong>os salinos y baja<br />
exigencia <strong>de</strong> agua, pero aún carecen <strong>de</strong> estudios agronómicos más <strong>de</strong>nsos <strong>para</strong> recomendarse<br />
efectivamente su empleo <strong>de</strong> forma masiva. La reducida o casi inexistente experiencia<br />
mexicana en tales cultivos apunta <strong>para</strong> la necesidad <strong>de</strong> que se emprendan experimentos y<br />
estudios en ese campo, caracterizando mejor las productivida<strong>de</strong>s y susceptibilida<strong>de</strong>s a plagas y<br />
enfermeda<strong>de</strong>s, sin los cuales seria una aventura sugerir su utilización. Por ejemplo, se<br />
menciona entre las dificulta<strong>de</strong>s particulares <strong>para</strong> promover la expansión <strong><strong>de</strong>l</strong> sorgo la reducida<br />
base <strong>de</strong> germoplasma, poca adaptación ambiental y baja resistencia a plagas y malezas<br />
(Venturi y Venturi, 2003).<br />
Bajo esos supuestos la caña surge naturalmente como la opción más evi<strong>de</strong>nte <strong>para</strong> promover<br />
en <strong>el</strong> corto plazo la producción <strong>de</strong> etanol en México, alternativa que se refuerza al tener en<br />
23
<strong>Potenciales</strong> y <strong>Viabilidad</strong> <strong><strong>de</strong>l</strong> <strong>Uso</strong> <strong>de</strong> <strong>Bioetanol</strong> y <strong>Biodies<strong>el</strong></strong> <strong>para</strong> <strong>el</strong> Transporte en México (SENER-BID-GTZ)<br />
Task 5: Ethanol and ETBE production and end-use in Mexico<br />
cuenta la larga experiencia <strong><strong>de</strong>l</strong> país con ese cultivo, insertado hace siglos en la pauta cultural y<br />
agronómica mexicana. No obstante, eso no quiere <strong>de</strong>cir que la caña es necesariamente la única<br />
opción <strong>para</strong> producir etanol en México. Progresivamente, en la medida en que avance <strong>el</strong><br />
conocimiento sobre otras alternativas y se <strong>de</strong>fina mejor <strong>el</strong> espacio pretendido <strong>para</strong> <strong>el</strong> etanol en<br />
la oferta agrícola mexicana, la diversificación podrá ocurrir en bases consistentes. Para<br />
cualquier escenario, es importante hacer hincapié en la necesidad <strong>de</strong> que la producción<br />
bioenergética no sea consi<strong>de</strong>rada como una sustituta <strong>para</strong> la actual producción agrícola, pero<br />
fundamentalmente un nuevo cultivo, a utilizar tierras marginales en un proceso <strong>de</strong> expansión y<br />
diversificación <strong>de</strong> las activida<strong>de</strong>s.<br />
En <strong>el</strong> próximo capítulo se presentan las tecnologías que permiten producir etanol utilizando las<br />
materias primas consi<strong>de</strong>radas <strong>de</strong> mayor interés.<br />
24
<strong>Potenciales</strong> y <strong>Viabilidad</strong> <strong><strong>de</strong>l</strong> <strong>Uso</strong> <strong>de</strong> <strong>Bioetanol</strong> y <strong>Biodies<strong>el</strong></strong> <strong>para</strong> <strong>el</strong> Transporte en México (SENER-BID-GTZ)<br />
Task 5: Ethanol and ETBE production and end-use in Mexico<br />
4. Procesos tecnológicos r<strong>el</strong>evantes <strong>para</strong> producción <strong>de</strong> etanol<br />
La figura siguiente sintetiza las rutas tecnológicas que pue<strong>de</strong>n ser empleadas en la producción<br />
<strong>de</strong> etanol, sin representar los subproductos presentes en todos los casos. Cabe reiterar que<br />
procesos empleando materias primas c<strong>el</strong>ulósicas todavía se encuentran en <strong>de</strong>sarrollo, con<br />
buenas perspectivas pero a mediano plazo, con pocas plantas actualmente operando,<br />
generalmente en niv<strong>el</strong> experimental, como la planta <strong>de</strong> Iogen en Canadá. Así, las biomasas<br />
azucaradas y amiláceas, respectivamente bien representadas por la caña <strong>de</strong> azúcar y <strong>el</strong> maíz,<br />
como se vió en <strong>el</strong> apartado anterior, son las materias primas <strong>de</strong> inmediato interés. Para la caña,<br />
adicionalmente será brevemente presentada la utilización <strong><strong>de</strong>l</strong> bagazo y hojas <strong>de</strong> la caña como<br />
materia prima <strong>para</strong> producción <strong>de</strong> etanol una tecnología prometedora, pero todavía en<br />
<strong>de</strong>sarrollo. Actualmente <strong>el</strong> bagazo representa una fuente <strong>de</strong> energía en <strong>el</strong> procesamiento <strong>de</strong> la<br />
caña y su utilización <strong>de</strong>be consi<strong>de</strong>rar también los usos alternativos <strong>de</strong> ese producto.<br />
Biomasa Azucarada<br />
Biomasa Amilácea<br />
Biomasa C<strong>el</strong>ulósica<br />
Trituración/<br />
Molienda<br />
Trituración<br />
Hidrólisis<br />
enzimática<br />
Trituración<br />
Hidrólisis ácida o<br />
enzimática<br />
Obtención <strong>de</strong> solución azucarada fermentable<br />
Fermentación<br />
Destilación<br />
ETANOL<br />
Figura 4.1. Procesos <strong>para</strong> producción <strong>de</strong> etanol<br />
Una visión <strong>de</strong> los diferentes procesos y <strong>de</strong> los balances <strong>de</strong> masa referentes a los casos<br />
consi<strong>de</strong>rados <strong>de</strong> mayor interés <strong>para</strong> la realidad mexicana es presentada a continuación. Como<br />
esperado, las tecnologías ya implementadas (caña y maíz) permitieran una buena base <strong>de</strong><br />
información, mientras la escasez <strong>de</strong> datos <strong>para</strong> las alternativas innovadoras implicó en una<br />
menor profundidad <strong>de</strong> la evaluación presentada <strong>para</strong> <strong>el</strong> sorgo, remolacha y yuca.<br />
25
<strong>Potenciales</strong> y <strong>Viabilidad</strong> <strong><strong>de</strong>l</strong> <strong>Uso</strong> <strong>de</strong> <strong>Bioetanol</strong> y <strong>Biodies<strong>el</strong></strong> <strong>para</strong> <strong>el</strong> Transporte en México (SENER-BID-GTZ)<br />
Task 5: Ethanol and ETBE production and end-use in Mexico<br />
4.1. Procesos utilizando caña <strong>de</strong> azúcar<br />
La materia prima clásica <strong>para</strong> producción <strong>de</strong> etanol es la caña <strong>de</strong> azúcar, por su alto<br />
rendimiento y simplicidad en <strong>el</strong> proceso <strong>para</strong> obtención <strong>de</strong> soluciones dulces fermentables.<br />
Esencialmente dos reacciones son necesarias <strong>para</strong> convertir la sacarosa en etanol: una<br />
hidrólisis <strong>de</strong> la sacarosa, con producción <strong>de</strong> hexosas y la fermentación alcohólica, con auxilio<br />
<strong>de</strong> levaduras <strong><strong>de</strong>l</strong> tipo Saccharomyces Cerevisiae, como se indica en las expresiones siguientes.<br />
C +<br />
12H22O11<br />
+ H2O<br />
→ C6H12O6<br />
C6H12O6<br />
sacarosa<br />
glucosa fructosa<br />
(1)<br />
C6H12O6<br />
→ 2 C2H6O<br />
+ 2 CO<br />
hexosa etanol<br />
2<br />
(2)<br />
Consi<strong>de</strong>rando las varias fuentes <strong>de</strong> materia prima azucarada existentes en la agroindustria<br />
cañera, diversas alternativas pue<strong>de</strong>n ser adoptadas <strong>para</strong> la producción <strong>de</strong> etanol, <strong>de</strong>s<strong>de</strong> la<br />
fermentación directa <strong><strong>de</strong>l</strong> jugo <strong>de</strong> la caña hasta <strong>el</strong> empleo <strong>de</strong> soluciones acuosas <strong>de</strong> mi<strong>el</strong>es<br />
finales o intermediarias, o aún mezclas <strong>de</strong> mi<strong>el</strong>es e jugo. De hecho, en los ingenios, la sacarosa<br />
<strong>de</strong> la caña pue<strong>de</strong> ser convertida en azúcar <strong>de</strong> diversos grados <strong>de</strong> calidad, pero en <strong>el</strong> proceso <strong>de</strong><br />
fabricación siempre una fracción <strong><strong>de</strong>l</strong> azúcar se “invierte” según la expresión (1) arriba,<br />
<strong>de</strong>gradándose en azucares más sencillos, las hexosas, que constituyen los mi<strong>el</strong>es o las m<strong>el</strong>azas<br />
y pue<strong>de</strong>n dar origen a mostos fermentables y luego, a etanol, como presentado en la Figura<br />
4.2.<br />
Fabricación <strong>de</strong> azúcar<br />
azúcar<br />
caña Extracción <strong><strong>de</strong>l</strong> jugo jugo<br />
m<strong>el</strong>aza<br />
m<strong>el</strong>aza exce<strong>de</strong>nte<br />
bagazo<br />
Fermentación<br />
viñaza<br />
Destilación<br />
y<br />
Deshidratación<br />
alcohol hidratado<br />
alcohol anhidro<br />
Figura 4.2. Procesos <strong>de</strong> producción <strong>de</strong> alcohol <strong>de</strong> caña <strong>de</strong> azúcar<br />
26
<strong>Potenciales</strong> y <strong>Viabilidad</strong> <strong><strong>de</strong>l</strong> <strong>Uso</strong> <strong>de</strong> <strong>Bioetanol</strong> y <strong>Biodies<strong>el</strong></strong> <strong>para</strong> <strong>el</strong> Transporte en México (SENER-BID-GTZ)<br />
Task 5: Ethanol and ETBE production and end-use in Mexico<br />
Usualmente en los ingenios <strong>de</strong> azúcar, posteriormente a la producción <strong><strong>de</strong>l</strong> jarabe por<br />
concentración <strong><strong>de</strong>l</strong> jugo <strong>de</strong> la caña, se emplean hasta tres sucesivas cristalizaciones o “tres<br />
masas”. Cada proceso <strong>de</strong> cristalización es seguido por una se<strong>para</strong>ción <strong>de</strong> los cristales <strong>de</strong><br />
sacarosa <strong><strong>de</strong>l</strong> llamado licor madre o mi<strong>el</strong>, mediante centrifugación. Así, la primera etapa <strong>de</strong><br />
cristalización y centrifugación permite obtener <strong>el</strong> azúcar A y <strong>el</strong> mi<strong>el</strong> A, luego esta mi<strong>el</strong> A es<br />
sometida a nueva cristalización y centrifugación, resultando <strong>el</strong> azúcar B y la mi<strong>el</strong> B,<br />
finalmente <strong>de</strong> modo análogo se produce <strong>el</strong> azúcar C y la mi<strong>el</strong> C, consi<strong>de</strong>rada agotada y <strong>de</strong> la<br />
cual no se recupera más sacarosa, sin embargo contienen unos 50% <strong>de</strong> material fermentable.<br />
En <strong>el</strong> Anexo 1 son presentadas las etapas <strong><strong>de</strong>l</strong> proceso industrial <strong>de</strong> fabricación <strong>de</strong> etanol y<br />
azúcar <strong>de</strong> caña.<br />
La m<strong>el</strong>aza o mi<strong>el</strong> final actualmente producida por los ingenios mexicanos, alre<strong>de</strong>dor <strong>de</strong> 1,668<br />
miles ton<strong>el</strong>adas en 2004 (CNIAA, 2006), es parcialmente utilizada <strong>para</strong> la producción <strong>de</strong><br />
etanol y alimentación animal, pudiendo ser empleada como materia prima <strong>para</strong> una serie <strong>de</strong><br />
otros productos, como levaduras, mi<strong>el</strong> proteica, L-lisina, glutamato monosódico y ácido<br />
cítrico. Las exportaciones <strong>de</strong> m<strong>el</strong>azas <strong>de</strong> México a Estados Unidos son r<strong>el</strong>evantes, superiores a<br />
440 miles ton<strong>el</strong>adas en 2005, o sea, aproximadamente una cuarta parte <strong>de</strong> la producción<br />
(F.O.Licht, 2006).<br />
Buscando consi<strong>de</strong>rar las alternativas <strong>de</strong> mayor interés <strong>para</strong> México, se <strong>de</strong>talla sucesivamente<br />
la producción <strong>de</strong> etanol empleando mi<strong>el</strong>es agotadas, mi<strong>el</strong>es B y jugo directo. Cabe observar<br />
que la utilización <strong>de</strong> mi<strong>el</strong>es intermedias pue<strong>de</strong> significar una interesante sinergia entre la<br />
producción <strong>de</strong> azúcar y etanol, con ventajas en términos <strong>de</strong> productividad y calidad <strong><strong>de</strong>l</strong><br />
producto, siendo la ruta preferencial adoptada en Brasil. De acuerdo con los precios r<strong>el</strong>ativos y<br />
las <strong>de</strong>mandas, pue<strong>de</strong> ser <strong>de</strong>sviada más o menos sacarosa <strong>para</strong> fabricación <strong>de</strong> azúcar, <strong>de</strong>jando<br />
consecuentemente menos o más materia prima <strong>para</strong> producir etanol. De ese modo, la<br />
variabilidad <strong>de</strong> la producción <strong>de</strong>pen<strong>de</strong> directamente <strong><strong>de</strong>l</strong> contenido total <strong>de</strong> azucares <strong>de</strong> la<br />
m<strong>el</strong>aza utilizada <strong>para</strong> pre<strong>para</strong>r <strong>el</strong> mosto, cantidad usualmente evaluada según <strong>el</strong> contenido <strong>de</strong><br />
los “azúcares reductores totales”, que correspon<strong>de</strong>n a suma <strong>de</strong> la sacarosa y las hexosas.<br />
Consi<strong>de</strong>rando procesos teóricos <strong>de</strong> conversión <strong>de</strong> glucosas en etanol y la <strong>de</strong>nsidad <strong>de</strong> ese<br />
biocombustible (792 kg/m 3 ), se pue<strong>de</strong> <strong>de</strong>terminar que un kilogramo <strong>de</strong> sacarosa correspon<strong>de</strong><br />
teóricamente a 0.679 litros <strong>de</strong> etanol anhidro, o en otras palabras un litro <strong>de</strong> etanol requiere<br />
1.473 kilogramos <strong>de</strong> sacarosa <strong>para</strong> ser producido. En los procesos reales <strong>de</strong> fermentación y<br />
<strong>de</strong>stilación <strong>para</strong> los tres casos evaluados a<strong><strong>de</strong>l</strong>ante, la eficiencia en la conversión <strong>de</strong> azucares<br />
<strong>para</strong> etanol y obtención <strong>de</strong> etanol anhidro <strong><strong>de</strong>l</strong> vino (mosto fermentado) fue adoptada como<br />
respectivamente 90% y 98%, valores <strong>de</strong> referencia <strong>para</strong> las plantas brasileñas (Macedo, 2000).<br />
Bajo tales condiciones, por litro <strong>de</strong> etanol anhidro se requieren 1.67 kg <strong>de</strong> azucares reductores<br />
totales. Para la caña fue adoptado un contenido <strong>de</strong> sacarosa (Pol caña ) y <strong>de</strong> fibra respectivamente<br />
<strong>de</strong> 13.5% y 13.2%, promedios <strong>de</strong> los valores observados en las últimas cinco zafras <strong>para</strong> los<br />
ingenios mexicanos (CNIAA, 2006).<br />
4.1.1. Producción <strong>de</strong> etanol <strong>de</strong> m<strong>el</strong>azas agotadas (mi<strong>el</strong> C)<br />
Para condiciones típicamente observadas en los ingenios mexicanos son producidos cerca <strong>de</strong><br />
37.5 kg <strong>de</strong> mi<strong>el</strong> C o mi<strong>el</strong> final con 85º Brix, por ton<strong>el</strong>ada <strong>de</strong> caña procesada (CNIAA, 2006).<br />
El grado Brix correspon<strong>de</strong> al porcentual en peso <strong>de</strong> sólidos solubles en la mi<strong>el</strong>, cuyo contenido<br />
27
<strong>Potenciales</strong> y <strong>Viabilidad</strong> <strong><strong>de</strong>l</strong> <strong>Uso</strong> <strong>de</strong> <strong>Bioetanol</strong> y <strong>Biodies<strong>el</strong></strong> <strong>para</strong> <strong>el</strong> Transporte en México (SENER-BID-GTZ)<br />
Task 5: Ethanol and ETBE production and end-use in Mexico<br />
<strong>de</strong> azúcares reductores totales en las m<strong>el</strong>azas agotadas pue<strong>de</strong> ser <strong>de</strong>terminado por su “pureza<br />
en ART”. Para las condiciones <strong>de</strong> las m<strong>el</strong>azas producidas en los ingenios <strong>de</strong> México se estima<br />
que este parámetro varíe entre 32 y 63% (Poy, 2005). Así, apenas utilizando las m<strong>el</strong>azas<br />
agotadas inevitablemente resultantes <strong>de</strong> la fabricación <strong>de</strong> azúcar, entre 6 y 12 litros <strong>de</strong> etanol<br />
pue<strong>de</strong>n ser producidos por ton<strong>el</strong>ada <strong>de</strong> caña procesada, como mínimo. El valor observado en<br />
los ingenios mexicanos que poseen <strong>de</strong>stilerías, 8.8 litros por ton<strong>el</strong>ada <strong>de</strong> caña, situase en este<br />
rango y pue<strong>de</strong> ser consi<strong>de</strong>rado representativo.<br />
Esquemáticamente, la Figura 4.3 representa los principales flujos <strong>de</strong> masa observados en esa<br />
alternativa, conforme las condiciones mexicanas. La Tabla 4.1 presenta los componentes<br />
básicos <strong>de</strong> un balance <strong>de</strong> insumos y productos en ese caso, con valores estimados <strong>de</strong> acuerdo a<br />
las condiciones observadas en ingenios brasileños y características <strong>de</strong> la caña en México. Se<br />
consi<strong>de</strong>ró que <strong>el</strong> consumo <strong>de</strong> vapor adicional <strong>para</strong> la producción <strong>de</strong> etanol, estimado en 2.5 kg<br />
<strong>de</strong> vapor por litro <strong>de</strong> etanol, representando cerca <strong>de</strong> 5% <strong><strong>de</strong>l</strong> consumo <strong><strong>de</strong>l</strong> ingenio, sea poco<br />
r<strong>el</strong>evante y pueda ser absorbido por incrementos <strong>de</strong> eficiencia en <strong>el</strong> sistema <strong>de</strong> vapor existente.<br />
Tabla 4.1. Insumos y productos en la producción <strong>de</strong> etanol a partir <strong>de</strong> las m<strong>el</strong>azas agotadas<br />
Insumos<br />
Caña <strong>de</strong> azúcar 1,000 kg<br />
Fu<strong>el</strong> oil (podría ser remplazado por bagazo) 10.7 kg<br />
Electricidad (pue<strong>de</strong> ser producida a partir <strong><strong>de</strong>l</strong> bagazo) 12.5 kWh<br />
Agua tratada 5,600 litro<br />
Ácido sulfúrico 0.026 kg<br />
Urea (nitrógeno <strong>para</strong> las levaduras) 0.052 kg<br />
Productos y subproductos<br />
Azúcar 112 kg<br />
Etanol anhidro 8.8 litro<br />
Bagazo con 50% humedad (consumido en <strong>el</strong> ingenio) 264 kg<br />
Vinazas 88 a 141 litro<br />
Cachaza (torta <strong>de</strong> filtro) 30 kg<br />
Levadura (exce<strong>de</strong>nte a las necesida<strong>de</strong>s <strong>de</strong> la producción) 1.6 kg<br />
CO 2 (producido en las cubas <strong>de</strong> fermentación) 6.9 kg<br />
Fab ricación<br />
1 t <strong>de</strong> caña 37.5 kg mi<strong>el</strong> C<br />
Destilería<br />
<strong>de</strong> azúcar<br />
112 kg azúcar 8.8 l etanol anhidro<br />
Figura 4.3. Flujos básicos en la producción <strong>de</strong> etanol a partir <strong>de</strong> m<strong>el</strong>azas agotadas<br />
28
<strong>Potenciales</strong> y <strong>Viabilidad</strong> <strong><strong>de</strong>l</strong> <strong>Uso</strong> <strong>de</strong> <strong>Bioetanol</strong> y <strong>Biodies<strong>el</strong></strong> <strong>para</strong> <strong>el</strong> Transporte en México (SENER-BID-GTZ)<br />
Task 5: Ethanol and ETBE production and end-use in Mexico<br />
4.1.2. Producción <strong>de</strong> etanol <strong>de</strong> m<strong>el</strong>azas intermediarias (mi<strong>el</strong> B)<br />
Cuando hay interés en producir más etanol que en <strong>el</strong> caso anterior, se disminuye<br />
proporcionalmente la cantidad <strong>de</strong> sacarosa convertida en edulcorante y se <strong>de</strong>svía más m<strong>el</strong>aza<br />
hacia la producción <strong>de</strong> etanol, en ese caso produciendo en <strong>el</strong> ingenio solamente los azucares A<br />
y B, y <strong>de</strong>stinando la mi<strong>el</strong> B, a veces llamada <strong>de</strong> mi<strong>el</strong> rica, <strong>para</strong> la producción <strong>de</strong> etanol.<br />
Bajo <strong>el</strong> concepto <strong>de</strong> aumentar la producción r<strong>el</strong>ativa <strong>de</strong> etanol, pue<strong>de</strong>n ser adoptados<br />
procedimientos más complejos, por ejemplo con <strong>el</strong> uso <strong>de</strong> mostos combinando jugo directo o<br />
jugo pobre <strong>de</strong> los filtros y parte <strong>de</strong> las m<strong>el</strong>azas intermediarias, buscando simultáneamente<br />
reducir consumo <strong>de</strong> servicios auxiliares e insumos químicos, ampliando los beneficios <strong>de</strong> la<br />
integración productiva etanol/azúcar. Basándose en la amplia experiencia brasileña con esa<br />
tecnología, son citados los siguientes puntos como más r<strong>el</strong>evantes en esa integración<br />
(Finguerut , 2005):<br />
a. Todas las corrientes contiendo azucares <strong>de</strong> baja calidad, como los jugos <strong>de</strong> los últimos<br />
molinos y <strong>el</strong> jugo <strong>de</strong> los filtros pue<strong>de</strong>n ser utilizados <strong>para</strong> producir etanol sin representar<br />
perdidas <strong>de</strong> azúcar. Asimismo, todos los problemas <strong>de</strong> producción en la fábrica <strong>de</strong><br />
azúcar, que resulten en disponibilidad <strong>de</strong> materiales azucarados, pue<strong>de</strong>n ser resu<strong>el</strong>tos <strong>de</strong><br />
forma sencilla, enviando tales materiales <strong>para</strong> la <strong>de</strong>stilería.<br />
b. Al utilizar solo dos masas las m<strong>el</strong>azas no son agotadas, permitiendo una calidad más<br />
<strong>el</strong>evada <strong><strong>de</strong>l</strong> azúcar (mejor color y pureza) y consecuentemente mejores precios.<br />
c. El vapor producido en los evaporadores pue<strong>de</strong> ser empleado eficientemente <strong>para</strong><br />
tratamiento <strong><strong>de</strong>l</strong> jugo a ser fermentado y la <strong>de</strong>stilería.<br />
d. La necesidad <strong>de</strong> concentrar <strong>el</strong> jugo a ser fermentado se reduce pues <strong>el</strong> contenido <strong>de</strong><br />
azucares pue<strong>de</strong> ser ajustado <strong>de</strong> forma sencilla mediante la mezcla con m<strong>el</strong>azas, hasta la<br />
concentración más a<strong>de</strong>cuada (18-24 o Brix), permitiendo producir un vino con <strong>el</strong>evada<br />
concentración alcohólica, <strong>de</strong>pendiendo <strong>de</strong> la tolerancia alcohólica <strong>de</strong> las levaduras<br />
empleadas..<br />
e. Las mismas instalaciones auxiliares (utilida<strong>de</strong>s, disposición <strong>de</strong> residuos, laboratorios,<br />
talleres <strong>de</strong> mantenimiento, seguridad industrial, gestión y comercialización), pue<strong>de</strong>n<br />
ventajosamente ser utilizadas <strong>para</strong> <strong>el</strong> azúcar y <strong>el</strong> etanol producidos.<br />
En la Figura 4.4 se presenta <strong>el</strong> esquema <strong>de</strong> equipos y procesos <strong>para</strong> un ingenio produciendo<br />
etanol a partir <strong>de</strong> m<strong>el</strong>azas intermediarias (adaptado <strong>de</strong> Finguerut, 2006). Otro esquema<br />
semejante, <strong>para</strong> un ingenio real <strong>de</strong> Brasil, es presentado en <strong>el</strong> Anexo 1.<br />
29
<strong>Potenciales</strong> y <strong>Viabilidad</strong> <strong><strong>de</strong>l</strong> <strong>Uso</strong> <strong>de</strong> <strong>Bioetanol</strong> y <strong>Biodies<strong>el</strong></strong> <strong>para</strong> <strong>el</strong> Transporte en México (SENER-BID-GTZ)<br />
Task 5: Ethanol and ETBE production and end-use in Mexico<br />
Figura 4.4. Esquema <strong>de</strong> un ingenio <strong>para</strong> la producción <strong>de</strong> combinada <strong>de</strong> azúcar y etanol<br />
En ese contexto diversos escenarios productivos son factibles, <strong>de</strong>pendiendo directamente <strong><strong>de</strong>l</strong><br />
contenido <strong>de</strong> azucares que presenta la m<strong>el</strong>aza enviada <strong>para</strong> la <strong>de</strong>stilería. En un cálculo que<br />
podría ser consi<strong>de</strong>rado conservador, un estudioso mexicano evalúa <strong>el</strong> uso <strong>de</strong> mi<strong>el</strong> B <strong>para</strong><br />
producir etanol, estimando por ton<strong>el</strong>ada <strong>de</strong> caña, una producción simultánea <strong>de</strong> 104.3 kg <strong>de</strong><br />
azúcar y 14.6 litros <strong>de</strong> etanol (Poy, 1998). En Brasil, correspondiendo a una división en<br />
proporciones iguales <strong>de</strong> los azucares <strong>de</strong> la caña entre los dos productos, en promedio son<br />
producidos cerca <strong>de</strong> 67 kg <strong>de</strong> azúcar y 42 litros <strong>de</strong> etanol, por ton<strong>el</strong>ada <strong>de</strong> caña procesada.<br />
Entre estos límites y buscando reproducir una situación <strong>de</strong> bajo impacto en producción<br />
azucarera y una producción <strong>de</strong> etanol r<strong>el</strong>ativamente importante, admitiendo una producción <strong>de</strong><br />
61 kg <strong>de</strong> mi<strong>el</strong> B por ton<strong>el</strong>ada <strong>de</strong> caña procesada, con 82º Brix y un contenido <strong>de</strong> ART en <strong>el</strong><br />
rango 49 a 60%, se estima una reducción en la producción <strong>de</strong> azúcar <strong>de</strong> 18%. Utilizando una<br />
m<strong>el</strong>aza con esas características se espera una producción <strong>de</strong> etanol anhidro <strong>de</strong> 280 litros por<br />
ton<strong>el</strong>ada <strong>de</strong> mi<strong>el</strong>, resultando por tanto 17.1 litros <strong>de</strong> etanol. Esta configuración será tomada<br />
como representativa <strong>para</strong> los estudios posteriores <strong>de</strong> utilización <strong>de</strong> las m<strong>el</strong>azas intermediarias,<br />
es sintetizada en la Figura 4.5 y en la Tabla 4.2.<br />
30
<strong>Potenciales</strong> y <strong>Viabilidad</strong> <strong><strong>de</strong>l</strong> <strong>Uso</strong> <strong>de</strong> <strong>Bioetanol</strong> y <strong>Biodies<strong>el</strong></strong> <strong>para</strong> <strong>el</strong> Transporte en México (SENER-BID-GTZ)<br />
Task 5: Ethanol and ETBE production and end-use in Mexico<br />
Fabricación<br />
1 t <strong>de</strong> caña<br />
<strong>de</strong> azúcar<br />
61 kg mi<strong>el</strong> B Destilería<br />
92 kg azúcar 17.1 l etanol<br />
Figura 4.5. Flujos básicos en la producción <strong>de</strong> etanol a partir <strong>de</strong> m<strong>el</strong>azas intermediarias<br />
Para tal caso, adoptando una <strong>de</strong>manda <strong>de</strong> vapor <strong>de</strong> 450 kg por ton<strong>el</strong>ada <strong>de</strong> caña molida y una<br />
r<strong>el</strong>ación vapor/bagazo <strong>de</strong> 2.2, se estimó una reducción <strong>de</strong> 6% en la <strong>de</strong>manda <strong>de</strong> vapor y<br />
consecuentemente un consumo <strong>de</strong> bagazo menor en la misma proporción. Estas estimaciones<br />
fueron <strong>de</strong>sarrolladas tomando como referencia un estudio <strong>de</strong>tallado <strong>de</strong> conversión <strong>de</strong> plantas<br />
azucareras <strong>para</strong> producción <strong>de</strong> etanol. (Almazán y González, 1999). Para las condiciones<br />
mexicanas, <strong>el</strong> efecto <strong><strong>de</strong>l</strong> consumo <strong>de</strong> vapor más bajo en la producción combinada <strong>de</strong> azúcar y<br />
etanol pue<strong>de</strong> ser consi<strong>de</strong>rado mediante <strong>el</strong> cómputo <strong>de</strong> la reducción en la <strong>de</strong>manda <strong>de</strong><br />
combustible adicional (fu<strong>el</strong> oil). En <strong>el</strong> caso presentado anteriormente, con 18% <strong>de</strong> reducción<br />
<strong>de</strong> la producción <strong>de</strong> azúcar y 17.1 litros <strong>de</strong> etanol por ton<strong>el</strong>ada <strong>de</strong> caña procesada, se estimó un<br />
consumo <strong>de</strong> vapor inferior en 6%, permitiendo un consumo <strong>de</strong> fu<strong>el</strong> oil cerca <strong>de</strong> 30% más bajo<br />
que <strong>el</strong> valor indicado en la Tabla 4.1, cuando se toma respectivamente <strong>para</strong> <strong>el</strong> bagazo y <strong>el</strong> fu<strong>el</strong><br />
oil productivida<strong>de</strong>s <strong>de</strong> 2 y 13 kg <strong>de</strong> vapor por kg <strong>de</strong> combustible.<br />
Tabla 4.2. Insumos y productos en la producción <strong>de</strong> etanol a partir <strong>de</strong> m<strong>el</strong>azas intermediarias,<br />
estimados <strong>para</strong> 18% <strong>de</strong> reducción en la producción <strong>de</strong> azúcar y 17.1 litros <strong>de</strong> etanol por<br />
ton<strong>el</strong>ada <strong>de</strong> caña<br />
Insumos<br />
Caña <strong>de</strong> azúcar 1,000 Kg<br />
Fu<strong>el</strong> oil 7.4 Kg<br />
Electricidad (pue<strong>de</strong> ser producida a partir <strong><strong>de</strong>l</strong> bagazo) 12.5 kWh<br />
Agua tratada 5,600 Litro<br />
Ácido sulfúrico 0.050 Kg<br />
Urea 0.100 Kg<br />
Productos y subproductos<br />
Azúcar 92 kg<br />
Etanol anhidro 17.1 litro<br />
Bagazo con 50% humedad (consumido en <strong>el</strong> ingenio) 264 kg<br />
Vinazas 171 a 274 litro<br />
Cachaza 30 kg<br />
Levadura 3.9 kg<br />
CO 2 (producido en las cubas <strong>de</strong> fermentación) 13.3 kg<br />
31
<strong>Potenciales</strong> y <strong>Viabilidad</strong> <strong><strong>de</strong>l</strong> <strong>Uso</strong> <strong>de</strong> <strong>Bioetanol</strong> y <strong>Biodies<strong>el</strong></strong> <strong>para</strong> <strong>el</strong> Transporte en México (SENER-BID-GTZ)<br />
Task 5: Ethanol and ETBE production and end-use in Mexico<br />
Es interesante reiterar que esta alternativa permite una ancha gama <strong>de</strong> perfiles productivos.<br />
Para evaluar diferentes escenarios <strong>de</strong> producción combinando azúcar y etanol, pue<strong>de</strong> ser usada<br />
una expresión frecuentemente utilizada en Brasil <strong>para</strong> <strong>de</strong>terminar la eficiencia industrial<br />
teórica en plantas que producen simultáneamente y en proporciones variables etanol y azúcar,<br />
traduciendo en ART ambos productos, como se presenta a continuación.<br />
η<br />
teórica<br />
S E<br />
ART<br />
+<br />
productos<br />
= =<br />
0.95 0.647<br />
(3)<br />
ART ART<br />
caña<br />
caña<br />
adon<strong>de</strong>:<br />
ART productos = azucares reductores totales en los productos, (kg/t caña)<br />
ART caña = azucares reductores totales en la caña, (kg/t caña)<br />
S = azúcar producida, (kg sacarosa/t caña)<br />
E = etanol anhidro producido, (litro/t caña)<br />
η teórica = eficiencia industrial teórica<br />
Típicamente y en la ausencia <strong>de</strong> datos experimentales, se estima que <strong>el</strong> contenido <strong>de</strong> ART en<br />
jugos <strong>de</strong> alta pureza, como jugo directo <strong>de</strong> caña, sea la suma <strong><strong>de</strong>l</strong> los azucares reductores<br />
formados a partir <strong>de</strong> la sacarosa con <strong>el</strong> contenido <strong>de</strong> otros azucares reductores, estimados en<br />
0,5% <strong><strong>de</strong>l</strong> peso <strong>de</strong> la caña, resultando:<br />
⎛ Pol ⎞<br />
= 1.105 Polcaña<br />
(4)<br />
⎝ 0,95 ⎠<br />
caña<br />
ART<br />
caña<br />
1.05 ⎜ ⎟ =<br />
Partiendo <strong><strong>de</strong>l</strong> rendimiento industrial (“eficiencia en fábrica”) promedio observado en los<br />
ingenios mexicanos durante las últimas cinco zafras, 82.6%, y asumiendo una caña con 13.5%<br />
<strong>de</strong> sacarosa (CNIAA, 2006), es posible estimar la r<strong>el</strong>ación entre la producción <strong>de</strong> etanol versus<br />
la producción <strong>de</strong> azúcar, conforme presentado en la Figura 4.6. Cabe observar que esa<br />
situación representa un ingenio mexicano promedio, seguramente existiendo situaciones <strong>de</strong><br />
rendimiento superior e inferior al utilizado.<br />
Evaluando la producción <strong>de</strong> etanol utilizando mi<strong>el</strong>es agotadas, por lo menos 8.8 litros <strong>de</strong><br />
etanol pue<strong>de</strong>n ser siempre producidos, ya que una fracción <strong>de</strong> la sacarosa <strong>de</strong> la caña no se<br />
alcanza convertir en azúcar y así, la máxima producción <strong>de</strong> azúcar indicada en esa figura<br />
jamás podrá ser alcanzada. Naturalmente que, en función <strong>de</strong> los precios y estrategias <strong>de</strong><br />
mercado, los productores <strong>de</strong> azúcar y etanol empleando tal tecnología pue<strong>de</strong>n <strong>el</strong>egir <strong>el</strong> perfil<br />
<strong>de</strong> producción más a<strong>de</strong>cuado, inclusive tomando en cuenta las limitaciones <strong>de</strong> almacenamiento<br />
y logística.<br />
32
<strong>Potenciales</strong> y <strong>Viabilidad</strong> <strong><strong>de</strong>l</strong> <strong>Uso</strong> <strong>de</strong> <strong>Bioetanol</strong> y <strong>Biodies<strong>el</strong></strong> <strong>para</strong> <strong>el</strong> Transporte en México (SENER-BID-GTZ)<br />
Task 5: Ethanol and ETBE production and end-use in Mexico<br />
120<br />
100<br />
kg <strong>de</strong> azúcar<br />
80<br />
60<br />
40<br />
20<br />
0<br />
0 20 40 60 80<br />
litros <strong>de</strong> etanol anhidro<br />
Figura 4.6. Producción r<strong>el</strong>ativa <strong>de</strong> etanol y azúcar, <strong>para</strong> las condiciones medias <strong>de</strong> los<br />
ingenios <strong>de</strong> México<br />
4.1.3. Producción <strong>de</strong> etanol <strong>de</strong> jugo directo <strong>de</strong> caña<br />
Para incrementar la producción <strong>de</strong> etanol, se <strong>de</strong>svía progresivamente más jugo <strong>de</strong> caña hacia la<br />
producción <strong>de</strong> etanol, hasta la situación en que no se produce ningún azúcar. Para condiciones<br />
así y consi<strong>de</strong>rando <strong>el</strong> contexto <strong>de</strong> los ingenios mexicanos, a partir <strong>de</strong> una ton<strong>el</strong>ada <strong>de</strong> caña con<br />
13 a 14% <strong>de</strong> sacarosa se estima obtener <strong>de</strong> 75 a 80 litros <strong>de</strong> alcohol anhidro, significando una<br />
recuperación <strong>de</strong> ART <strong>de</strong> la caña entre 82 y 85%. En ese caso se espera un consumo <strong>de</strong> vapor<br />
cerca <strong>de</strong> 10% inferior al consumo en la producción <strong>de</strong> azúcar, <strong>de</strong>biendo mantenerse <strong>el</strong><br />
tratamiento térmico <strong><strong>de</strong>l</strong> jugo y <strong>el</strong> ajuste <strong><strong>de</strong>l</strong> niv<strong>el</strong> <strong>de</strong> concentración buscando mejorar las<br />
condiciones en la fermentación.<br />
Evi<strong>de</strong>ntemente la producción <strong>de</strong> etanol directamente <strong><strong>de</strong>l</strong> jugo <strong>de</strong> la caña reduce la flexibilidad<br />
<strong><strong>de</strong>l</strong> ingenio en términos <strong>de</strong> producir diferentes productos y <strong>de</strong>terminar según las condiciones<br />
<strong>de</strong> mercado, una composición <strong>de</strong> mayor rentabilidad. Por otro lado, la producción solamente<br />
<strong>de</strong> etanol reduce las inversiones significativamente, no siendo requerido cualquier equipo <strong>de</strong> la<br />
sección <strong>de</strong> cocimiento (tachos, turbinas <strong>de</strong> centrifugación, etc.), que pue<strong>de</strong>n correspon<strong>de</strong>r a<br />
20% <strong>de</strong> las inversiones totales en un ingenio.<br />
Las plantas agroindustriales operando <strong>de</strong>dicadas únicamente a la producción <strong>de</strong> etanol<br />
presentan como indicadores representativos los valores constantes <strong>de</strong> la Tabla 4.3, estimados<br />
con base en las condiciones observadas en los ingenios brasileños. Naturalmente que es<br />
posible esperar una variación en estos valores según cada contexto agroindustrial, en función<br />
33
<strong>Potenciales</strong> y <strong>Viabilidad</strong> <strong><strong>de</strong>l</strong> <strong>Uso</strong> <strong>de</strong> <strong>Bioetanol</strong> y <strong>Biodies<strong>el</strong></strong> <strong>para</strong> <strong>el</strong> Transporte en México (SENER-BID-GTZ)<br />
Task 5: Ethanol and ETBE production and end-use in Mexico<br />
<strong>de</strong> las características <strong>de</strong> la materia prima y las especificida<strong>de</strong>s <strong><strong>de</strong>l</strong> proceso adoptado, en<br />
particular las condiciones <strong>de</strong> tratamiento <strong><strong>de</strong>l</strong> jugo y fermentación.<br />
Tabla 4.3. Insumos y productos en la producción <strong>de</strong> etanol directo a partir <strong>de</strong> caña<br />
Insumos<br />
Caña <strong>de</strong> azúcar 1,000 kg<br />
Fu<strong>el</strong> oil 7.4 kg<br />
Electricidad (pue<strong>de</strong> ser producida a partir <strong><strong>de</strong>l</strong> bagazo) 12.5 kWh<br />
Agua tratada 5,600 litro<br />
Ácido sulfúrico 0.050 kg<br />
Urea 0.100 kg<br />
Productos y subproductos<br />
Etanol anhidro 80 litro<br />
Bagazo con 50% humedad (consumido en <strong>el</strong> ingenio) 264 kg<br />
Vinazas 780 a 1248 litro<br />
Cachaza 30 kg<br />
Levadura 17.8 kg<br />
CO 2 (producido en las cubas <strong>de</strong> fermentación) 60.7 kg<br />
4.1.4. Producción <strong>de</strong> etanol <strong>de</strong> jugo directo <strong>de</strong> caña y <strong>de</strong> residuos<br />
c<strong>el</strong>ulósicos<br />
Consi<strong>de</strong>rando las disponibilida<strong>de</strong>s <strong>de</strong> bagazo exce<strong>de</strong>nte en los ingenios, como consecuencia <strong>de</strong><br />
la racionalización energética en los procesos <strong>de</strong> producción y uso <strong>de</strong> vapor, bien como las<br />
disponibilida<strong>de</strong>s <strong>de</strong> residuos <strong>de</strong> cosecha (puntas y hojas <strong>de</strong> caña), la posibilidad <strong>de</strong> utilizarse<br />
eses materiales lignoc<strong>el</strong>ulósicos <strong>de</strong> costo reducido como materia prima <strong>para</strong> producción <strong>de</strong><br />
etanol <strong>de</strong>spierta gran<strong>de</strong> interés y podría con ventajas asociarse a producción convencional a<br />
partir <strong>de</strong> sustancias dulces <strong>de</strong> la caña. Sin embargo, aun que la utilización <strong>de</strong> esa rota<br />
productiva permita <strong>el</strong>evar dramáticamente la producción <strong>de</strong> etanol por unidad <strong>de</strong> materia<br />
prima procesada y potencialmente reducir bastante los costos, <strong>de</strong>pendiendo <strong>de</strong> las inversiones<br />
incrementales, los procesos <strong>de</strong> conversión <strong>de</strong> c<strong>el</strong>ulosa están todavía en <strong>de</strong>sarrollo.<br />
Los materiales lignoc<strong>el</strong>ulósicos son compuestos <strong>de</strong> c<strong>el</strong>ulosa, hemic<strong>el</strong>ulosa y lignina. La<br />
c<strong>el</strong>ulosa es formada por largas ca<strong>de</strong>nas <strong>de</strong> glucosas, mientras la hemic<strong>el</strong>ulosa es constituida<br />
por hexosas y pentosas. La lignina no contiene azucares y envu<strong>el</strong>ve las c<strong>el</strong>das vegetales con<br />
una capa que dificulta romper la c<strong>el</strong>ulosa y hemic<strong>el</strong>ulosa <strong>para</strong> producir soluciones<br />
fermentables. La proporción <strong>de</strong> cada componente varia con la especie vegetal y su edad,<br />
típicamente las gramíneas presentando menos lignina que las especies leñosas.<br />
El principal reto en la producción <strong>de</strong> etanol a partir <strong>de</strong> biomasa lignoc<strong>el</strong>ulósica es <strong>el</strong><br />
pretratamiento e hidrólisis <strong>de</strong> la materia prima, que pue<strong>de</strong>n utilizar esencialmente tres tipos <strong>de</strong><br />
procesos y sus variantes y combinaciones: hidrólisis ácida (con ácido diluido o concentrado),<br />
hidrólisis enzimática y procesos termoquímicos. El pretratamiento tiene como objetivo<br />
34
<strong>Potenciales</strong> y <strong>Viabilidad</strong> <strong><strong>de</strong>l</strong> <strong>Uso</strong> <strong>de</strong> <strong>Bioetanol</strong> y <strong>Biodies<strong>el</strong></strong> <strong>para</strong> <strong>el</strong> Transporte en México (SENER-BID-GTZ)<br />
Task 5: Ethanol and ETBE production and end-use in Mexico<br />
<strong>de</strong>sintegrar la matriz <strong>de</strong> carbohidratos <strong>de</strong> tal manera que la c<strong>el</strong>ulosa reduzca su grado <strong>de</strong><br />
cristalinidad y aumente la c<strong>el</strong>ulosa amorfa, que es la más a<strong>de</strong>cuada <strong>para</strong> <strong>el</strong> posterior ataque<br />
enzimático. Adicionalmente, la mayor parte <strong>de</strong> la hemic<strong>el</strong>ulosa se hidroliza durante <strong>el</strong><br />
pretratamiento y la lignina se libera o pue<strong>de</strong> incluso <strong>de</strong>scomponerse, en algunos casos con<br />
producción <strong>de</strong> compuestos perjudiciales al proceso fermentativo posterior. No obstante, caso<br />
se<strong>para</strong>da , la lignina pue<strong>de</strong> presentar valor comercial o servir como combustible.<br />
En una etapa posterior, la c<strong>el</strong>ulosa liberada es típicamente sometida a hidrólisis enzimática con<br />
c<strong>el</strong>ulasas exógenas, lo cual hace que se obtenga una solución <strong>de</strong> azúcares fermentables que<br />
contiene principalmente glucosa, así como pentosas (xilosas) resultantes <strong>de</strong> la hidrólisis inicial<br />
<strong>de</strong> la hemic<strong>el</strong>ulosa. Hay en estudio <strong>de</strong>cenas <strong>de</strong> alternativas <strong>de</strong> proceso <strong>para</strong> pretratamiento e<br />
hidrólisis (Sun y Cheng, 2002). Como afirmado anteriormente, las glucosas pue<strong>de</strong>n ser<br />
convertidas sin dificulta<strong>de</strong>s en etanol, pero las pentosas son todavía objeto <strong>de</strong> atención <strong>de</strong> los<br />
bioquímicos, que buscan <strong>de</strong>sarrollar bacterias capaces <strong>de</strong> efectuar a<strong>de</strong>cuadamente tal<br />
conversión.<br />
A pesar <strong><strong>de</strong>l</strong> gran esfuerzo <strong>de</strong> instituciones públicas y privadas <strong>para</strong> <strong>de</strong>sarrollar procesos<br />
eficientes, capaces <strong>de</strong> lograr a bajo costo una máxima conversión <strong>de</strong> los polisacáridos y baja<br />
<strong>de</strong>gradación <strong>de</strong> los azucares resultantes, como glucosas y pentosas, todavía no se <strong>de</strong>finieran<br />
procesos económicamente competitivos, esperándose en un horizonte <strong>de</strong> diez años su cabal<br />
perfeccionamiento y <strong>de</strong>sarrollo <strong>de</strong> las tecnologías asociadas (Worldwatch Institute, 2006).<br />
En la actualidad se consi<strong>de</strong>ra representativa una eficiencia <strong>de</strong> conversión y recuperación <strong>de</strong><br />
c<strong>el</strong>ulosa en 76%, que asociada a una conversión fermentativa <strong>de</strong> 75%, aumentaría la<br />
producción a 336 litros <strong>de</strong> etanol anhidro por ton<strong>el</strong>ada <strong>de</strong> c<strong>el</strong>ulosa (Badger, 2002). En <strong>el</strong><br />
bagazo seco los contenidos <strong>de</strong> c<strong>el</strong>ulosa, hemic<strong>el</strong>ulosa y lignina son respectivamente cerca <strong>de</strong><br />
47%, 25% y 20%, valores próximos a los observados <strong>para</strong> los residuos <strong>de</strong> cosecha. Por<br />
ton<strong>el</strong>ada <strong>de</strong> bagazo con 50% <strong>de</strong> humedad, se pue<strong>de</strong> producir a partir <strong>de</strong> la c<strong>el</strong>ulosa, 123 litros<br />
<strong>de</strong> etanol anhidro y a partir <strong>de</strong> la hemic<strong>el</strong>ulosa, 63 litros <strong>de</strong> ese biocombustible (Ross<strong>el</strong>, 2005).<br />
Estos datos permiten ver la r<strong>el</strong>evancia <strong>de</strong> lograr la conversión y fermentación <strong>de</strong> las pentosas.<br />
En términos concretos, específicamente <strong>para</strong> bagazo, empleando ácido diluido y tratamientos<br />
térmicos, estudios hechos en una planta piloto en un ingenio azucarero en Brasil llegaron a una<br />
productividad <strong>de</strong> 109 litros por ton<strong>el</strong>ada <strong>de</strong> bagazo, con perspectivas <strong>de</strong> alcanzar hasta 180<br />
litros por ton<strong>el</strong>ada, caso se consiga fermentar las pentosas. A eses niv<strong>el</strong>es, la producción <strong>de</strong><br />
etanol prácticamente dobla por unidad <strong>de</strong> área en cultivo, estimándose que llegue a más <strong>de</strong> 12<br />
mil litros por hectárea, utilizando cerca <strong>de</strong> 1/3 <strong><strong>de</strong>l</strong> bagazo producido, pasible <strong>de</strong> ser obtenido<br />
sin afectar la operación normal <strong>de</strong> la planta, exce<strong>de</strong>nte <strong><strong>de</strong>l</strong> proceso <strong>de</strong> generación <strong>de</strong> vapor,<br />
más una cantidad similar <strong>de</strong> residuos <strong>de</strong> cosecha (Oliverio, 2005).<br />
Como se tratan <strong>de</strong> procesos todavía en <strong>de</strong>sarrollo y no son disponibles datos o parámetros <strong>de</strong><br />
instalaciones reales, <strong>para</strong> los análisis posteriores, necesariamente simplificadas, serán<br />
consi<strong>de</strong>rados conservadoramente una productividad <strong>de</strong> 109 litros <strong>de</strong> etanol por ton<strong>el</strong>ada <strong>de</strong><br />
bagazo húmedo y una idéntica productividad en <strong>el</strong> procesamiento <strong>de</strong> los residuos <strong>de</strong> cosecha.<br />
Consi<strong>de</strong>rándose disponibilida<strong>de</strong>s <strong>de</strong> bagazo y residuos <strong>para</strong> producir etanol como se mencionó<br />
en <strong>el</strong> párrafo anterior, cerca <strong>de</strong> 166 kg <strong>de</strong> material c<strong>el</strong>ulósico, resulta por ton<strong>el</strong>ada <strong>de</strong> caña<br />
procesada, 18 litros adicionales <strong>de</strong> etanol, que sumados a producción <strong>de</strong> etanol <strong>de</strong> jugo <strong>de</strong> los<br />
colmos, significa un total <strong>de</strong> 98 litros <strong>de</strong> etanol anhidro.<br />
35
<strong>Potenciales</strong> y <strong>Viabilidad</strong> <strong><strong>de</strong>l</strong> <strong>Uso</strong> <strong>de</strong> <strong>Bioetanol</strong> y <strong>Biodies<strong>el</strong></strong> <strong>para</strong> <strong>el</strong> Transporte en México (SENER-BID-GTZ)<br />
Task 5: Ethanol and ETBE production and end-use in Mexico<br />
4.2. Procesos utilizando maíz<br />
El maíz amarillo, cuyos granos contienen entre 60 a 68% <strong>de</strong> almidón, es la materia prima<br />
mayormente utilizada en la producción <strong>de</strong> etanol en los Estados Unidos. Para obtener etanol a<br />
partir <strong>de</strong> almidón es necesario romper las ca<strong>de</strong>nas <strong>de</strong> ese polisacárido <strong>para</strong> obtener jarabe <strong>de</strong><br />
glucosa, <strong>el</strong> cual se pue<strong>de</strong> convertir en etanol mediante las levaduras, conforme se analizó <strong>para</strong><br />
la caña.<br />
Aunque se pue<strong>de</strong>n utilizar procesos ácidos, la ruta enzimática es prepon<strong>de</strong>rante. Inicialmente<br />
se hace una hidrólisis enzimática, empleando la alfa-amilasa obtenida <strong>de</strong> bacterias<br />
termorresistentes como Bacillus licheniformis o B. amyloliquefaciens, lo que la hace i<strong>de</strong>al <strong>para</strong><br />
la primera etapa <strong>de</strong> la hidrólisis <strong>de</strong> las suspensiones <strong>de</strong> almidón que tienen que ser llevadas a<br />
temperaturas entre 90 -110º C, cuando ocurre <strong>el</strong> rompimiento <strong>de</strong> los gránulos <strong>de</strong> almidón,<br />
condición necesaria <strong>para</strong> <strong>el</strong> tratamiento enzimático. El contenido <strong>de</strong> enzimas utilizado <strong>de</strong>pen<strong>de</strong><br />
<strong>de</strong> su grado <strong>de</strong> actividad, pero es usualmente cerca <strong>de</strong> 0.06 a 0.08%. Bajo ese niv<strong>el</strong> <strong>de</strong><br />
temperatura ocurre también una esterilización <strong>de</strong> la materia prima, reduciendo la presencia <strong>de</strong><br />
bacterias prejudiciales <strong>para</strong> la fermentación.<br />
El producto <strong>de</strong> la etapa <strong>de</strong> licuefacción es una solución <strong>de</strong> almidón que contiene <strong>de</strong>xtrinas<br />
(oligosacáridos compuestos por varias unida<strong>de</strong>s <strong>de</strong> glucosa) y pequeñas cantida<strong>de</strong>s <strong>de</strong> glucosa.<br />
El almidón licuado se somete entonces a sacarificación a menores temperaturas (60-70ºC) con<br />
glucoamilasa (0.06 a 0.12%) obtenida <strong>de</strong> Aspergillus niger o <strong>de</strong> especies <strong>de</strong> Rhizopus, la cual<br />
hidroliza las <strong>de</strong>xtrinas hasta glucosa, como presenta la ecuación a seguir (Sánchez y Cardona,<br />
2005).<br />
(C6H10O5<br />
) → <strong>de</strong>xtrinas → n C2H12O<br />
almidón<br />
glucosa<br />
n 6<br />
(5)<br />
De cada 1 kg <strong>de</strong> almidón se pue<strong>de</strong>n obtener teóricamente 1.11 kg <strong>de</strong> glucosa, lo que implica<br />
una r<strong>el</strong>ación estequiométrica <strong>de</strong> 9:10. Una vez obtenida la glucosa se realiza la fermentación<br />
por medio <strong>de</strong> la adición <strong>de</strong> levadura <strong>para</strong> la producción <strong>de</strong> etanol, como se muestra en la<br />
expresión (2) anterior. En condiciones teóricas, <strong>para</strong> cada kg <strong>de</strong> almidón podrían ser<br />
producidos 0.716 litros <strong>de</strong> etanol anhidro. Asumiendo un contenido <strong>de</strong> 66% <strong>de</strong> almidón en <strong>el</strong><br />
maíz en grano seco, podrían teóricamente ser producidos hasta 416 litros <strong>de</strong> etanol por<br />
ton<strong>el</strong>ada <strong>de</strong> maíz. Consi<strong>de</strong>rando las eficiencias <strong>de</strong> sacarificación, fermentación y <strong>de</strong>stilación,<br />
respectivamente 95, 90 y 98%, llegase a 0.631 litros por kg <strong>de</strong> almidón o cerca <strong>de</strong> 400 litros <strong>de</strong><br />
etanol por ton<strong>el</strong>ada <strong>de</strong> maíz en condiciones reales.<br />
En términos prácticos, <strong>el</strong> proceso empieza con la molienda <strong><strong>de</strong>l</strong> cereal, <strong>para</strong> reducirlo a un<br />
tamaño <strong>de</strong> partícula fina y extraer <strong>el</strong> almidón <strong>de</strong> los granos <strong>de</strong> maíz. Existen actualmente dos<br />
tipos <strong>de</strong> proceso en uso, húmedo y seco. El proceso en seco es preferida <strong>para</strong> producción <strong>de</strong><br />
etanol por <strong>de</strong>mandar menos equipos y menos energía, resultando costos com<strong>para</strong>tivamente<br />
más bajos que <strong>el</strong> proceso húmedo.<br />
En <strong>el</strong> proceso húmedo se obtiene <strong><strong>de</strong>l</strong> grano, a<strong>de</strong>más <strong>de</strong> almidón, fibra, gluten, germen y aceite,<br />
que son subproductos <strong>de</strong> alto valor. Los rendimientos <strong>de</strong> etanol pue<strong>de</strong>n llegar a 403 litros por t<br />
<strong>de</strong> maíz. En <strong>el</strong> proceso en seco no se fracciona <strong>el</strong> grano en sus componentes y todos sus<br />
36
<strong>Potenciales</strong> y <strong>Viabilidad</strong> <strong><strong>de</strong>l</strong> <strong>Uso</strong> <strong>de</strong> <strong>Bioetanol</strong> y <strong>Biodies<strong>el</strong></strong> <strong>para</strong> <strong>el</strong> Transporte en México (SENER-BID-GTZ)<br />
Task 5: Ethanol and ETBE production and end-use in Mexico<br />
nutrientes entran al proceso y son concentrados en un subproducto <strong>de</strong> <strong>de</strong>stilación empleado<br />
<strong>para</strong> alimentación animal llamado granos secos <strong>de</strong> <strong>de</strong>stilería (DDG, Dried Distillers Grains),<br />
cuyo valor <strong>de</strong> mercado pue<strong>de</strong> compensar parcialmente los costos <strong><strong>de</strong>l</strong> proceso. Cuando los<br />
DDG se mezclan con solubles concentrados provenientes <strong>de</strong> la evaporación <strong>de</strong> las vinazas se<br />
obtienen los granos secos <strong>de</strong> <strong>de</strong>stilería con solubles (DDGS). Los rendimientos <strong>de</strong> alcohol <strong>para</strong><br />
<strong>el</strong> proceso en seco son <strong>de</strong> 395 a 405 litros por t <strong>de</strong> maíz (Gulati, 1996). Los esquemas<br />
simplificados <strong>para</strong> estos procesos son indicados en la Figura 4.7.<br />
En <strong>el</strong> proceso en seco, <strong>el</strong> maíz es inicialmente limpiado <strong>de</strong> piedras y metales, pasando por<br />
molinos <strong>de</strong> martillo y siguiendo <strong>para</strong> los tanques <strong>de</strong> licuefacción continua, adon<strong>de</strong> se ajusta <strong>el</strong><br />
pH a 6 y se mezcla con <strong>el</strong> con<strong>de</strong>nsado <strong>de</strong> los evaporadores y la enzima (alfa-amilasa),<br />
manteniéndose bajo calentamiento una temperatura <strong>de</strong> 88º C. En esa etapa se pue<strong>de</strong> agregar<br />
urea <strong>para</strong> mejorar las condiciones <strong>de</strong> fermentación. En seguida a licuefacción, <strong>el</strong> material es<br />
calentado hasta 110º C por 20 minutos, enfriado a 60º C y pasa a etapa <strong>de</strong> sacarificación en<br />
tanques continuos, adon<strong>de</strong> recibe la enzima (glucoamilasa) y ácido sulfúrico <strong>para</strong> ajustar <strong>el</strong> pH<br />
<strong>para</strong> 4.4. El tiempo <strong>de</strong> resi<strong>de</strong>ncia <strong>para</strong> sacarificación es <strong>de</strong> 6 horas. El mosto resultante es<br />
enfriado a 32º C y alimenta los fermentadores continuos en cascada (Continuously Stirred<br />
Reactor – CSTR), adon<strong>de</strong> cumple un tiempo <strong>de</strong> resi<strong>de</strong>ncia <strong>de</strong> 46 horas. Mo<strong>de</strong>rnamente, la<br />
sacarificación y fermentación ocuren juntas en <strong>el</strong> mismo reactor. La temperatura <strong>de</strong><br />
fermentación es mantenida <strong>de</strong>bajo <strong>de</strong> 34º C mediante la circulación <strong><strong>de</strong>l</strong> mosto en<br />
intercambiadores <strong>de</strong> calor. La concentración <strong>de</strong> etanol en la salida <strong><strong>de</strong>l</strong> proceso <strong>de</strong> fermentación<br />
es 12% en volumen (McAloon, 2000).<br />
37
<strong>Potenciales</strong> y <strong>Viabilidad</strong> <strong><strong>de</strong>l</strong> <strong>Uso</strong> <strong>de</strong> <strong>Bioetanol</strong> y <strong>Biodies<strong>el</strong></strong> <strong>para</strong> <strong>el</strong> Transporte en México (SENER-BID-GTZ)<br />
Task 5: Ethanol and ETBE production and end-use in Mexico<br />
Molienda húmeda<br />
Molienda en seco<br />
maíz<br />
agua<br />
maíz<br />
mezcla y molienda<br />
molienda<br />
filtrado y lavado<br />
cocimiento<br />
se<strong>para</strong>ción<br />
germen, fibra<br />
licuefacción<br />
almidón<br />
sacarificación<br />
licuefacción<br />
fermentación CO 2<br />
sacarificación<br />
reciclo levaduras<br />
fermentación<br />
reciclo levaduras<br />
CO 2<br />
<strong>de</strong>stilación<br />
etanol<br />
vinazas<br />
residuos sólidos<br />
(DDG)<br />
<strong>de</strong>stilación<br />
etanol<br />
Figura 4.7. Procesos <strong>de</strong> fabricación <strong>de</strong> etanol <strong>de</strong> maíz<br />
Un aspecto importante r<strong>el</strong>acionado al empleo <strong><strong>de</strong>l</strong> maíz se refiere al consumo energético en la<br />
producción <strong>de</strong> etanol. Muchos estudios han sido efectuados sobre ese tema y aparentemente<br />
las estimaciones iniciales <strong>de</strong> que la <strong>de</strong>manda era superior a producción <strong>de</strong> energía dieron lugar<br />
a productivida<strong>de</strong>s energéticas positivas, aun que r<strong>el</strong>ativamente bajas. Las <strong>de</strong>mandas<br />
representativas <strong>de</strong> energía <strong>el</strong>éctrica y térmica, en la vía seca, son respectivamente 0.21 kWh y<br />
10.2 MJ por litro <strong>de</strong> etanol producido (Fundación Emisión, 2005). Usualmente se utiliza gas<br />
natural <strong>para</strong> <strong>el</strong> suministro <strong>de</strong> calor utilizado en la generación <strong>de</strong> vapor <strong>de</strong> proceso y <strong>el</strong> los<br />
secadores <strong>de</strong> DDG. En <strong>el</strong> caso <strong>de</strong> ven<strong>de</strong>rse ese subproducto húmedo, la <strong>de</strong>manda <strong>de</strong><br />
combustible se reduce en 30%.<br />
38
<strong>Potenciales</strong> y <strong>Viabilidad</strong> <strong><strong>de</strong>l</strong> <strong>Uso</strong> <strong>de</strong> <strong>Bioetanol</strong> y <strong>Biodies<strong>el</strong></strong> <strong>para</strong> <strong>el</strong> Transporte en México (SENER-BID-GTZ)<br />
Task 5: Ethanol and ETBE production and end-use in Mexico<br />
Como condición <strong>de</strong> referencia <strong>para</strong> los estudios posteriores <strong>de</strong> viabilidad se consi<strong>de</strong>ra<br />
representativo la situación presentada en un estudio <strong>de</strong>sarrollado específicamente <strong>para</strong> una<br />
planta productora <strong>de</strong> etanol a partir <strong>de</strong> maíz en los alre<strong>de</strong>dores <strong>de</strong> Tulla <strong>de</strong> Allen<strong>de</strong>, Hidalgo,<br />
utilizando la tecnología seca, <strong>para</strong> la cual se espera productivida<strong>de</strong>s <strong>de</strong> etanol y DDGS<br />
respectivamente <strong>de</strong> 398 litros y 321 kg por ton<strong>el</strong>ada <strong>de</strong> maíz amarillo procesado (Fundación<br />
Emisión, 2005), conforme se presenta en la Figura 4.8.<br />
1 t <strong>de</strong> ma íz amarillo<br />
Planta productora<br />
<strong>de</strong> etanol<br />
321 kg <strong>de</strong> granos secos <strong>de</strong><br />
<strong>de</strong>stilería y solubles (DDGS)<br />
398 l etanol<br />
Figura 4.8. Flujos básicos en la producción <strong>de</strong> etanol a partir <strong>de</strong> maíz amarillo,<br />
procesamiento en seco<br />
4.3. Proceso utilizando yuca<br />
La yuca es una planta con raices llenas <strong>de</strong> almidon, originaria <strong>de</strong> Brasil y bastante cultivada en<br />
regiones tropicales da Africa y Asia. A<strong>de</strong>más <strong>de</strong> su amplia utilización como alimento básico<br />
en la dieta humana y animal, en Tailandia y China la yuca es semi-industrializada <strong>para</strong><br />
exportación y utilizada localmente <strong>para</strong> producir etanol potable. Así, por su atractivo<br />
contenido <strong>de</strong> almidón, entre 20 a 30% <strong>de</strong> las raíces, asociado a rusticidad <strong>de</strong> los cultivos, baja<br />
exigencia edafoclimática y posibilidad <strong>de</strong> producir al largo <strong>de</strong> casi todo <strong>el</strong> año, la yuca es<br />
frecuentemente consi<strong>de</strong>rada una materia prima <strong>de</strong> potencial interés <strong>para</strong> la fabricación <strong>de</strong><br />
etanol combustible. De hecho, durante los años setenta, en la primera fase <strong><strong>de</strong>l</strong> programa<br />
brasileño <strong>de</strong> alcohol, se intentó promover <strong>el</strong> uso <strong>de</strong> mandioca y fueran construidas dos plantas<br />
productoras <strong>de</strong> etanol utilizando esa materia prima, sin cualquier éxito, principalmente <strong>de</strong>bido<br />
al precio y discontinuida<strong>de</strong>s en <strong>el</strong> suministro regular <strong>de</strong> raíces <strong>para</strong> la industria. En las<br />
presentes condiciones <strong>de</strong> Brasil la yuca sigue siendo un cultivo <strong>de</strong> reducido interés <strong>para</strong><br />
producción <strong>de</strong> etanol. Sin embargo, en países asiáticos la yuca es frecuentemente consi<strong>de</strong>rada<br />
como una posible alternativa <strong>para</strong> producción <strong>de</strong> etanol, con proyectos en estudio o <strong>de</strong>sarrollo<br />
en China y Tailandia (How<strong>el</strong>er, 2003).<br />
Actualmente, con la posible excepción <strong>de</strong> Tailandia, la obtención <strong>de</strong> etanol a partir <strong>de</strong> yuca<br />
todavía no es practicada <strong>de</strong> forma comercial y por tanto los datos sobre su procesamiento,<br />
como balances <strong>de</strong> masa y parámetros operativos son bastante escasos. Para <strong>el</strong> presente trabajo,<br />
se utilizó como referencia esencialmente un estudio realizado <strong>para</strong> evaluar as perspectivas <strong><strong>de</strong>l</strong><br />
etanol en Tailandia, que aborda la utilización <strong>de</strong> esa materia prima (Trinda<strong>de</strong>, 1985).<br />
En la producción <strong>de</strong> etanol, las raíces son <strong>de</strong>scascadas, lavadas y molidas, pasando luego a<br />
cocedores y <strong>de</strong>spués a tanques <strong>para</strong> sacarificación <strong><strong>de</strong>l</strong> almidón. Los procesos sucesivos son<br />
similares a la producción <strong>de</strong> etanol <strong>de</strong> maíz. Consi<strong>de</strong>rando factores productivos semejantes a<br />
los adoptados <strong>para</strong> <strong>el</strong> maíz, la productividad <strong>de</strong>bería estar cerca <strong>de</strong> 170 litros por ton<strong>el</strong>ada <strong>de</strong><br />
raíz <strong>de</strong> yuca in natura procesada, con cerca <strong>de</strong> 25% <strong>de</strong> almidón. Evi<strong>de</strong>ntemente que contenidos<br />
más <strong>el</strong>evados <strong>de</strong> almidón permiten productivida<strong>de</strong>s más altas. A<strong>de</strong>más <strong>de</strong> la vinaza, resultante<br />
39
<strong>Potenciales</strong> y <strong>Viabilidad</strong> <strong><strong>de</strong>l</strong> <strong>Uso</strong> <strong>de</strong> <strong>Bioetanol</strong> y <strong>Biodies<strong>el</strong></strong> <strong>para</strong> <strong>el</strong> Transporte en México (SENER-BID-GTZ)<br />
Task 5: Ethanol and ETBE production and end-use in Mexico<br />
<strong><strong>de</strong>l</strong> proceso <strong>de</strong> <strong>de</strong>stilación, no se i<strong>de</strong>ntificaran co-productos <strong>de</strong> valor en ese proceso. Sin<br />
embargo, algunos autores citan la posibilidad <strong>de</strong> utilizarse los residuos fibrosos <strong><strong>de</strong>l</strong><br />
procesamiento <strong>de</strong> yuca <strong>para</strong> etanol como complemento alimentar <strong>para</strong> animales (Leon<strong>el</strong>,<br />
1999).<br />
La <strong>de</strong>manda <strong>de</strong> energía térmica se estimó entre 26 a 31 MJ por litro <strong>de</strong> etanol producido, <strong>para</strong><br />
una planta con capacidad <strong>de</strong> 150 m 3 por día, conforme <strong>el</strong> estudio <strong>para</strong> Tailandia (Trinda<strong>de</strong>,<br />
1985). En <strong>el</strong> mencionado estudio se consi<strong>de</strong>ró como alternativas <strong>para</strong> generación <strong>de</strong> calor <strong>el</strong><br />
gas natural, carbón mineral (posiblemente lignito) y cáscaras <strong>de</strong> arroz. En la realidad<br />
tailan<strong>de</strong>sa y <strong>para</strong> los escenarios evaluados, ese último biocombustible resulto económicamente<br />
más atractivo. La <strong>de</strong>manda <strong>de</strong> <strong>el</strong>ectricidad fue consi<strong>de</strong>rada atendida por producción propia.<br />
Una posible alternativa, r<strong>el</strong>evante en Tailandia, <strong>para</strong> la utilización <strong>de</strong> la yuca en plantas <strong>de</strong><br />
etanol es mediante <strong>el</strong> procesamiento <strong>de</strong> “chips” <strong>de</strong> esas raíces, un producto pre-procesado que<br />
contiene menos humedad y alre<strong>de</strong>dor <strong>de</strong> 75% <strong>de</strong> almidón, permitiendo almacenamiento. Se<br />
estima que la productividad <strong>de</strong> esa materia prima en procesos combinados <strong>de</strong> sacarificación y<br />
fermentación, seria <strong>de</strong> 380 litros <strong>de</strong> etanol por ton<strong>el</strong>ada <strong>de</strong> “chips” <strong>de</strong> yuca, generando mostos<br />
fermentables con 9,5% <strong>de</strong> etanol en volumen (Keawsompong, 2003, ).<br />
Con r<strong>el</strong>ación a yuca en México podría ser citado aún <strong>el</strong> Proyecto Yucalcol, <strong>el</strong>aborado <strong>para</strong> ser<br />
implementado en módulos agroindustriales en diversas regiones mexicanas, planteando<br />
utilizar los productos <strong>de</strong> ese cultivo en la fabricación <strong>de</strong> etanol. Confirmando la ausencia <strong>de</strong><br />
tradición <strong>de</strong> cultivo <strong>de</strong> yuca en Mexico, en la documentación <strong><strong>de</strong>l</strong> proyecto no se i<strong>de</strong>ntificaran<br />
datos o informaciones más específicas sobre <strong>el</strong> proceso que se preten<strong>de</strong> eventualmente utilizar<br />
(Gómez Fuster, 1998).<br />
4.4. Procesos utilizando sorgo y remolacha<br />
A<strong>de</strong>más <strong>de</strong> la caña <strong>de</strong> azúcar, otros cultivos sacáridos pue<strong>de</strong>n ser objeto <strong>de</strong> evaluación <strong>para</strong><br />
producción <strong>de</strong> etanol en la realidad mexicana, como <strong>el</strong> sorgo dulce y la remolacha. A<br />
continuación se comenta <strong>de</strong> modo sintético los procesos <strong>de</strong> fabricación <strong>de</strong> etanol <strong>para</strong> estos<br />
casos.<br />
La utilización <strong><strong>de</strong>l</strong> sorgo dulce <strong>para</strong> la fabricación <strong>de</strong> etanol presenta interés <strong>de</strong>bido<br />
principalmente a la posibilidad <strong>de</strong> integración con la agroindustria cañera, que podría alargar<br />
la zafra empleando un cultivo r<strong>el</strong>ativamente más rústico que la caña y que presenta diversas<br />
similitu<strong>de</strong>s en cuanto al procesamiento. Los colmos <strong>de</strong> sorgo dulce pue<strong>de</strong>n ser molidos en los<br />
trapiches, produciendo un jugo azucarado, con contenido <strong>de</strong> sacarosa inferior al típico jugo <strong>de</strong><br />
caña, pero que pue<strong>de</strong> ser sometido a procesamiento similar, <strong>para</strong> producir jarabes o etanol.<br />
Tomando en cuenta <strong>el</strong> contenido <strong>de</strong> azúcares y la baja aptitud <strong><strong>de</strong>l</strong> sorgo <strong>para</strong> producir azúcar<br />
sólido, se consi<strong>de</strong>ra que esa materia prima <strong>de</strong>ba ser procesada mediante plantas autónomas<br />
<strong>para</strong> producción <strong>de</strong> etanol a partir <strong>de</strong> jugo directo <strong>de</strong> caña, como se presentó anteriormente,<br />
estimándose <strong>para</strong> unida<strong>de</strong>s con 150 metros cúbicos diarios <strong>de</strong> capacidad una productividad <strong>de</strong><br />
35 litros <strong>de</strong> etanol por ton<strong>el</strong>ada <strong>de</strong> sorgo dulce procesado (Trinda<strong>de</strong>, 1985). Estudios más<br />
recientes hechos en India estiman 40 litros por ton<strong>el</strong>ada <strong>para</strong> plantas similares (ICRISAT,<br />
2004).<br />
40
<strong>Potenciales</strong> y <strong>Viabilidad</strong> <strong><strong>de</strong>l</strong> <strong>Uso</strong> <strong>de</strong> <strong>Bioetanol</strong> y <strong>Biodies<strong>el</strong></strong> <strong>para</strong> <strong>el</strong> Transporte en México (SENER-BID-GTZ)<br />
Task 5: Ethanol and ETBE production and end-use in Mexico<br />
Se admite que los indicadores <strong>de</strong> <strong>de</strong>manda <strong>de</strong> insumos y energía <strong>de</strong> proceso <strong>de</strong>ben ser<br />
análogos a los presentados <strong>para</strong> caña. Con r<strong>el</strong>ación a co-productos, <strong>el</strong> sorgo dulce es rico en<br />
fibras y produce un bagazo con propieda<strong>de</strong>s similares al bagazo <strong>de</strong> caña, con aplicaciones<br />
parecidas <strong>para</strong> la generación <strong>de</strong> energía térmica y uso como forraje en la alimentación animal.<br />
A<strong>de</strong>más <strong>de</strong> las cuestiones agronómicas citadas en <strong>el</strong> capítulo anterior, un problema particular<br />
en <strong>el</strong> procesamiento industrial <strong><strong>de</strong>l</strong> sorgo dulce es su ten<strong>de</strong>ncia a rápidamente <strong>de</strong>gradar, luego<br />
<strong>de</strong> cortado, imponiendo una a<strong>de</strong>cuada gestión <strong>de</strong> la cosecha y <strong><strong>de</strong>l</strong> ritmo <strong>de</strong> procesamiento,<br />
a<strong>de</strong>más <strong>de</strong> otras medidas preventivas que pue<strong>de</strong>n ser adoptadas (An<strong>de</strong>rson, 2002). No se<br />
encontró información <strong>de</strong> plantas comerciales <strong>de</strong> producción <strong>de</strong> etanol operando a partir <strong>de</strong><br />
sorgo dulce, pero hay una razonable experiencia en Estados Unidos en la producción <strong>de</strong><br />
jarabes <strong>de</strong> sorgo dulce y extensa literatura sobre estudios y proyectos en ese sentido en países<br />
africanos y asiáticos, particularmente India y China (Nan, Best y Carvalho, 1994).<br />
Para la remolacha, <strong>el</strong> proceso <strong>de</strong> producción <strong>de</strong> etanol empieza con <strong>el</strong> lavado y troceado fino<br />
<strong>de</strong> las raíces, que son reducidas a fracciones <strong>de</strong> sección triangular y 3 mm <strong>de</strong> espesor, llamadas<br />
cosetas. Las cosetas siguen <strong>para</strong> un difusor, adon<strong>de</strong> en medio a agua caliente a 70º C<br />
lentamente se mueven las fracciones <strong>de</strong> remolacha y progresivamente se enriquece la solución<br />
con los azucares presentes en la raíz. Luego <strong>de</strong> extraerse los azucares, los residuos o pulpa son<br />
secados y <strong>el</strong> jugo, con cerca <strong>de</strong> 16º Brix y una pureza en sacarosa <strong>de</strong> 85% (InfoAgro, 2006),<br />
prosigue su tratamiento en un proceso análogo al adoptado en las <strong>de</strong>stilerías <strong>de</strong> jugo <strong>de</strong> caña,<br />
pasando sucesivamente por los procesos <strong>de</strong> pasteurización, fermentación, <strong>de</strong>stilación y<br />
rectificación .<br />
En promedio, una ton<strong>el</strong>ada <strong>de</strong> raíces <strong>de</strong> remolacha produce entre 80 y 100 litros <strong>de</strong> etanol.<br />
Asumiendo una concentración <strong>de</strong> azucares totales <strong>de</strong> 19% en las raíces (varía típicamente<br />
entre 15 a 20%), se estima una producción <strong>de</strong> etanol <strong>de</strong> 86 litros por ton<strong>el</strong>ada <strong>de</strong> raíces,<br />
resultando aún 51 kg <strong>de</strong> torta fibrosa que pue<strong>de</strong> ser utilizada como alimento animal (El Sayed<br />
et al., 2005). En Francia algunas plantas productoras <strong>de</strong> azúcar <strong>de</strong> remolacha están<br />
produciendo etanol, aprovechando m<strong>el</strong>azas residuales <strong>de</strong> manera semejante a los ingenios<br />
azucareros que operan <strong>de</strong>stilerías integradas (TEREOS, 2006).<br />
Particularmente <strong>para</strong> las condiciones mexicanas, <strong>de</strong> acuerdo con <strong>el</strong> escenario sugerido<br />
<strong>para</strong> la utilización <strong>de</strong> la remolacha, se consi<strong>de</strong>ró que la <strong>de</strong>manda energética <strong>para</strong> su<br />
procesamiento y fabricación <strong>de</strong> etanol, cerca <strong>de</strong> 6.7 MJ y 0.084 kWh respectivamente <strong>de</strong><br />
energía térmica y <strong>el</strong>ectricidad por litro <strong>de</strong> etanol, sería suministrada gratuitamente a partir <strong>de</strong><br />
los exce<strong>de</strong>ntes <strong>de</strong> una planta geotérmica existente en la región adon<strong>de</strong> se plantea<br />
eventualmente promover ese cultivo.<br />
4.5. Visión general<br />
Este capítulo exploró básicamente los procesos <strong>de</strong> fabricación <strong>de</strong> etanol utilizando cinco<br />
diferentes fuentes <strong>de</strong> materia prima: caña <strong>de</strong> azúcar, maíz, yuca, sorgo y remolacha,<br />
<strong>de</strong>stacándose las dos primeras como las tecnologías más disponibles y conocidas. En la tabla<br />
siguiente se presenta un resumen <strong>de</strong> los parámetros más importantes <strong>de</strong> los diferentes procesos<br />
evaluados.<br />
41
<strong>Potenciales</strong> y <strong>Viabilidad</strong> <strong><strong>de</strong>l</strong> <strong>Uso</strong> <strong>de</strong> <strong>Bioetanol</strong> y <strong>Biodies<strong>el</strong></strong> <strong>para</strong> <strong>el</strong> Transporte en México (SENER-BID-GTZ)<br />
Task 5: Ethanol and ETBE production and end-use in Mexico<br />
A<strong>de</strong>más <strong>de</strong> la productividad en etanol, esencialmente <strong>de</strong>pendiente <strong>de</strong> la concentración <strong>de</strong><br />
azúcar o almidón en la materia prima y en términos netos no muy diferente entre los casos<br />
presentados, los requerimientos <strong>de</strong> aporte <strong>de</strong> energía al proceso pue<strong>de</strong>n variar <strong>de</strong> forma<br />
importante, como resultado <strong>de</strong> la disponibilidad <strong>de</strong> residuos o coproductos <strong>de</strong> valor económico<br />
(como alimento animal o energéticos), un factor r<strong>el</strong>evante <strong>para</strong> diferenciar los procesos, como<br />
ya se comentó <strong>para</strong> las materias primas. Los procesos empleando caña o sorgo son<br />
consi<strong>de</strong>rados autosuficientes <strong>de</strong>bido a disponibilidad <strong>de</strong> bagazo, que atien<strong>de</strong> las <strong>de</strong>mandas <strong>de</strong><br />
<strong>el</strong>ectricidad y calor, mientras <strong>para</strong> los <strong>de</strong>más se requiere aporte <strong>de</strong> energías exógenas <strong>para</strong><br />
<strong>de</strong>sarrollar <strong>el</strong> proceso. En <strong>el</strong> caso <strong>de</strong> la yuca solo se estimó la necesidad <strong>de</strong> calor <strong>de</strong> proceso,<br />
ya que la se consi<strong>de</strong>ra la <strong>el</strong>ectricidad producida mediante un sistema <strong>de</strong> cogeneración (con gas<br />
natural) y <strong>para</strong> la remolacha se consi<strong>de</strong>ró <strong>el</strong> acceso a una fuente geotérmica <strong>de</strong> energía.<br />
Como comentario final a los procesos <strong>de</strong> fabricación <strong>de</strong> etanol, es notable <strong>el</strong> esfuerzo <strong>de</strong><br />
<strong>de</strong>sarrollo <strong>de</strong> nuevas tecnologías en ese campo, principalmente con recurso a bioquímica y la<br />
genética, procurando incrementar <strong>de</strong>sempeño <strong>de</strong> procesos y valorizar materias primas <strong>de</strong> bajo<br />
costo, como por ejemplo a través <strong>de</strong> hidrólisis <strong>de</strong> c<strong>el</strong>ulosa, que a mediano plazo podrán<br />
presentar perspectivas <strong>de</strong> real aplicación, con fuertes impactos en las productivida<strong>de</strong>s y en <strong>el</strong><br />
precio final <strong><strong>de</strong>l</strong> etanol (Macedo, 2005).<br />
materia<br />
prima<br />
Tabla 4.4. Síntesis <strong>de</strong> los procesos <strong>de</strong> fabricación <strong>de</strong> etanol<br />
proceso<br />
caña <strong>de</strong><br />
azúcar jugo directo +<br />
hidrólisis <strong>de</strong><br />
residuos<br />
lignoc<strong>el</strong>ulósicos<br />
productividad<br />
(litro etanol/ t)<br />
consumo energético<br />
otros productos<br />
mi<strong>el</strong> pobre (C) 8.8 autosuficiente 112 kg azúcar<br />
mi<strong>el</strong> rica (B) 17.1 autosuficiente 92 kg azúcar<br />
jugo directo 80 autosuficiente menos r<strong>el</strong>evante<br />
(80+18)<br />
98<br />
maíz vía seca 398<br />
autosuficiente<br />
<strong>el</strong>ectr.: 0.21 kWh/litro<br />
comb.: 10.2 MJ/litro<br />
menos r<strong>el</strong>evante<br />
321 kg granos<br />
secos <strong>de</strong> <strong>de</strong><br />
<strong>de</strong>stilería y<br />
solubles DDGS<br />
sorgo similar a caña 35 autosuficiente menos r<strong>el</strong>evante<br />
yuca similar al maíz 170 comb.: 26 a 31 MJ/litro menos r<strong>el</strong>evante<br />
remolacha similar a caña 86<br />
<strong>el</strong>ectr.: 0.08 kWh/litro<br />
comb.: 6.7 MJ/litro<br />
51 kg <strong>de</strong><br />
residuos<br />
42
<strong>Potenciales</strong> y <strong>Viabilidad</strong> <strong><strong>de</strong>l</strong> <strong>Uso</strong> <strong>de</strong> <strong>Bioetanol</strong> y <strong>Biodies<strong>el</strong></strong> <strong>para</strong> <strong>el</strong> Transporte en México (SENER-BID-GTZ)<br />
Task 5: Ethanol and ETBE production and end-use in Mexico<br />
5. Costos <strong>de</strong> producción <strong>de</strong> etanol en México<br />
Conocer los costos <strong>de</strong> producción es esencial <strong>para</strong> evaluar la factibilidad económica <strong>de</strong> un<br />
combustible, pero siempre es una tarea compleja, sea por gama <strong>de</strong> escenarios, sea por los<br />
intereses en preservar informaciones <strong>de</strong> carácter comercial, sea aún por la propia dinámica <strong>de</strong><br />
los procesos económicos y <strong>de</strong> formación <strong>de</strong> costos. En <strong>el</strong> caso <strong><strong>de</strong>l</strong> etanol, se suman a los<br />
factores anteriores la reducida experiencia mexicana en programas <strong>de</strong> gran amplitud <strong>para</strong> la<br />
producción <strong>de</strong> etanol. Sin embargo, utilizando estimaciones efectuadas en <strong>el</strong> propio contexto<br />
nacional o en condiciones similares es posible <strong>de</strong>terminar los costos asociados a materia prima<br />
y a su procesamiento, como se presenta a continuación.<br />
En todas esas evaluaciones se adoptó como promedio <strong>para</strong> 2005 y <strong>para</strong> los primeros meses <strong>de</strong><br />
2006, una tasa <strong>de</strong> cambio respectivamente <strong>de</strong> 10.89 y 10.70 pesos mexicanos por dólar (CEFP,<br />
2006).<br />
5.1. Costos <strong>de</strong> la materia prima<br />
Los costos <strong>para</strong> cultivar y transportar la materia prima, como la caña y <strong>el</strong> maíz, son<br />
prepon<strong>de</strong>rantes en la formación <strong>de</strong> los costos totales <strong>de</strong> producción <strong>de</strong> etanol. Para los<br />
contextos y las materias primas mencionadas como las más prometedoras, se presenta a<br />
continuación los costos estimados <strong>para</strong> su obtención, que serán empleados a<strong><strong>de</strong>l</strong>ante <strong>para</strong><br />
estimar <strong>el</strong> costo <strong><strong>de</strong>l</strong> etanol. Siempre que posible los costos serán presentados inicialmente<br />
como costos a factores <strong>de</strong> producción, o sea costos <strong>para</strong> los productores agrícolas, y luego<br />
como precios <strong>de</strong> mercado, correspondientes a los costos <strong>para</strong> las plantas productoras <strong>de</strong> etanol.<br />
5.1.1. Costos <strong>para</strong> caña <strong>de</strong> azúcar y m<strong>el</strong>azas<br />
En términos <strong>de</strong> costo <strong>para</strong> producción agrícola, un estudioso <strong>de</strong> la agroindustria cañera<br />
mexicana estimó en mediados <strong>de</strong> 2005 que, en condiciones típicas, <strong>para</strong> cultivo temporal la<br />
productividad agrícola sea <strong>de</strong> 68 t/ha y presente un costo <strong>de</strong> producción <strong>de</strong> 257.49 $/t,<br />
mientras bajo riego se alcance 95 t/ha y un costo <strong>de</strong> 286.71 $/t, correspondientes<br />
respectivamente a 23.64 y 26.32 US$/t. A partir <strong>de</strong> estos costos, se <strong>de</strong>terminó que <strong>el</strong> ingreso<br />
neto <strong>de</strong> los productores <strong>de</strong> caña <strong>de</strong> México por hectarea estaría entre $10,200.00 y<br />
$14,250.00, respectivamente <strong>para</strong> cultivo temporal o bajo riego (Poy, 2005A).<br />
En <strong>el</strong> marco <strong><strong>de</strong>l</strong> presente estudio Lazcano (2006) llegó a valores un poco más bajos evaluando<br />
en <strong>de</strong>talle contextos <strong>de</strong> interés <strong>para</strong> la producción <strong>de</strong> etanol en México (Lazcano, 2006),<br />
conforme se presenta en la tabla siguiente, que resultarian entre 21.71 a 19.35 US$/t<br />
respectivamente <strong>para</strong> temporal y riego. Obsérvese que en ese caso los costos bajo riego fueron<br />
inferiores, al revés <strong><strong>de</strong>l</strong> estudio anterior. No se consi<strong>de</strong>ró <strong>el</strong> costo <strong>de</strong> la tierra.<br />
43
<strong>Potenciales</strong> y <strong>Viabilidad</strong> <strong><strong>de</strong>l</strong> <strong>Uso</strong> <strong>de</strong> <strong>Bioetanol</strong> y <strong>Biodies<strong>el</strong></strong> <strong>para</strong> <strong>el</strong> Transporte en México (SENER-BID-GTZ)<br />
Task 5: Ethanol and ETBE production and end-use in Mexico<br />
Tabla 5.1. Costos <strong>de</strong> producción <strong>de</strong> caña en dos regiones cañeras <strong>de</strong> México<br />
Componente <strong><strong>de</strong>l</strong> costo<br />
Caña <strong>de</strong> temporal en Huastecas y<br />
Veracruz Centro<br />
($/t)<br />
Caña <strong>de</strong> riego en Huastecas y<br />
Balsas<br />
($/t)<br />
Costo agrícola (cultivo) 103. 47 92.39<br />
Cosecha y transporte 133.00 118.35<br />
Costo total 236.47 210.74<br />
Como una conclusión pr<strong>el</strong>iminar r<strong>el</strong>evante, resulta que los costos <strong>de</strong> producción <strong>de</strong> caña <strong>de</strong><br />
azúcar <strong>de</strong> temporal pue<strong>de</strong>n ser consi<strong>de</strong>rados alre<strong>de</strong>dor <strong>de</strong> 20 a 23 US$/t. Con r<strong>el</strong>ación a<br />
<strong>de</strong>sagregación <strong>de</strong> eses costos, <strong>de</strong> acuerdo a un análisis <strong>de</strong>tallado realizado en un ingenio<br />
mexicano ubicado en la media nacional y cosechando caña proveniente <strong>de</strong> una zona <strong>de</strong><br />
temporal, fue posible establecer <strong>para</strong> caña planta (primero corte) y caña soca (cosechas<br />
sucesivas al primero corte) las distribuciones <strong>de</strong> costos presentadas en la Tabla 5.2. (Poy,<br />
2005A). En ese estudio se indica <strong>para</strong> la caña planta y la caña soca productivida<strong>de</strong>s <strong>de</strong> 80 t/ha<br />
y 45 t/ha, respectivamente. No se consi<strong>de</strong>ró <strong>el</strong> costo <strong>de</strong> aseguramiento <strong><strong>de</strong>l</strong> IMSS.<br />
Resultó evi<strong>de</strong>nciado en la formación <strong>de</strong> los costos <strong>el</strong> importante impacto económico <strong>de</strong> los<br />
gastos <strong>de</strong> cosecha y agroinsumos, respectivamente <strong>el</strong> 64.4 y 76.6%, siendo por tanto los<br />
montos prioritarios <strong>para</strong> buscar economias. En ese mismo trabajo, se consi<strong>de</strong>ra que los gastos<br />
<strong>de</strong> re<strong>para</strong>cion <strong>de</strong> caminos, contratacion <strong>de</strong> cortadores, corte, alza, flete, transportacion,<br />
personal y gastos administrativos son susceptibles <strong>de</strong> reducir en hasta 31%. Cuando esto<br />
efectivamente ocurra, se podría llegar a costos <strong>para</strong> la caña alre<strong>de</strong>dor <strong>de</strong> 15 US$/t, puesta en <strong>el</strong><br />
ingenio, <strong>de</strong> toda manera costos todavía <strong>el</strong>evados frente a los praticados en Brasil, Tailandia y<br />
Australia.<br />
Tabla 5.2. Composición <strong>de</strong> costos <strong>de</strong> producción <strong>de</strong> caña en una zona <strong>de</strong> temporal<br />
Componente <strong><strong>de</strong>l</strong> costo agrícola Caña planta Caña soca<br />
Pre<strong>para</strong>ción 7.6% no se aplica<br />
Siembra 9.2% no se aplica<br />
Labores culturales 6.0% 16.8%<br />
Insumos 32.7% 27.0%<br />
Cosecha 31.7% 49.6%<br />
Intereses 12.8% 6.6%<br />
La adopción <strong>de</strong> sistemas <strong>de</strong> riego en regiones más secas naturalmente permite <strong>el</strong>evar la<br />
productividad, pero las inversiones son importantes. Un estudio hecho <strong>para</strong> Tamaulipas apunta<br />
los costos unitarios indicados en la Tabla 5.3, que asociados a distritos <strong>de</strong> riego <strong>de</strong> 15,000 ha,<br />
con expectativas <strong>de</strong> producir 1.1 millones <strong>de</strong> t <strong>de</strong> caña y aten<strong>de</strong>r la <strong>de</strong>manda <strong>de</strong> <strong>de</strong>stilerías <strong>para</strong><br />
44
<strong>Potenciales</strong> y <strong>Viabilidad</strong> <strong><strong>de</strong>l</strong> <strong>Uso</strong> <strong>de</strong> <strong>Bioetanol</strong> y <strong>Biodies<strong>el</strong></strong> <strong>para</strong> <strong>el</strong> Transporte en México (SENER-BID-GTZ)<br />
Task 5: Ethanol and ETBE production and end-use in Mexico<br />
500 mil litros diarios <strong>de</strong> etanol, correspon<strong>de</strong> a inversiones <strong>de</strong> US$ 78 millones, suma superior<br />
a los US$ 50 millones estimados <strong>para</strong> implementar la <strong>de</strong>stilería (ANUR, 2005). Posiblemente<br />
los cultivos <strong>de</strong> temporal sean alternativas mejores, bajo costos más aceptables y no disputando<br />
con otros cultivos la humedad artificial. Solamente en condiciones muy particulares la<br />
producción bionergética podrá obtener prioridad en <strong>el</strong> uso <strong>de</strong> un recurso limitado como es <strong>el</strong><br />
agua, frente a otros los objetivos típicos <strong>de</strong> la agricultura <strong>de</strong> riego, mayormente empleada <strong>para</strong><br />
productos alimentarios.<br />
Tabla 5.3. Inversiones específicas <strong>para</strong> riego <strong>de</strong> caña <strong>de</strong> azúcar<br />
Item<br />
costo unitario<br />
(US$/ha)<br />
Infraestructura <strong>de</strong> riego 3,500<br />
Riego por goteo 1,200<br />
Drenaje parc<strong>el</strong>ario (en mitad <strong>de</strong> la superficie) 1,000<br />
Más allá <strong>de</strong> los costos <strong>para</strong> los productores, es <strong>el</strong> precio pagado por los ingenios que<br />
efectivamente representa <strong>el</strong> costo <strong>de</strong> la caña <strong>para</strong> la fines agroindustriales, pues prácticamente<br />
en toda la agroindustria cañera <strong>de</strong> México la materia prima es comprada <strong>de</strong> productores<br />
in<strong>de</strong>pendientes. Esos productores reciben por su producto <strong>de</strong> acuerdo a una fórmula conocida<br />
como KARBE, que <strong>de</strong>termina la cantidad <strong>de</strong> azúcar recuperable por ton<strong>el</strong>ada <strong>de</strong> caña<br />
entregue, en función <strong>de</strong> parámetros <strong>de</strong> calidad <strong>de</strong> la caña y <strong><strong>de</strong>l</strong> <strong>de</strong>sempeño agroindustrial. En<br />
esa fórmula se adopta <strong>el</strong> contenido <strong>de</strong> sacarosa (Pol caña ) como la principal variable <strong>de</strong> calidad<br />
<strong>de</strong> la caña y se toma como condiciones adicionales <strong>de</strong> referencia un contenido <strong>de</strong> fibra <strong>de</strong><br />
14.21% y una pureza <strong><strong>de</strong>l</strong> jugo mezclado <strong>de</strong> 81.23%. Existen disposiciones <strong>para</strong> <strong>de</strong>scuentos y<br />
castigos, pero no son aplicados <strong>de</strong> forma individualizada por productor, resultando en<br />
<strong>de</strong>voluciones a la masa común <strong>de</strong> recursos correspondientes al sector cañero.<br />
Es adoptado un promedio por zafra y por ingenio <strong>para</strong> los parámetros y la remuneración <strong>de</strong> los<br />
cañeros correspon<strong>de</strong> a 57% <strong><strong>de</strong>l</strong> precio <strong><strong>de</strong>l</strong> azúcar cobrado a los ingenios, resultante <strong>de</strong> las<br />
distintas condiciones <strong>de</strong> comercialización. Cada año se <strong>de</strong>fine <strong>el</strong> precio KARBE y mediante un<br />
mecanismo <strong>de</strong> pre-liquidaciones (80% <strong><strong>de</strong>l</strong> valor final estimado) y una liquidación final, se<br />
pagan los productores <strong>de</strong> caña. El precio KARBE pue<strong>de</strong> ser adoptado como costo <strong>de</strong> la<br />
materia prima, bajo <strong>el</strong> concepto <strong>de</strong> costo <strong>de</strong> oportunidad, <strong>para</strong> una planta productora <strong>de</strong> etanol<br />
<strong>de</strong> caña <strong>de</strong> azúcar.<br />
Para 2005, <strong>el</strong> precio <strong><strong>de</strong>l</strong> azúcar referente <strong>para</strong> <strong>el</strong> pago <strong>de</strong> la caña a los productores fue $<br />
5,759.97 por ton<strong>el</strong>ada. Como <strong>el</strong> contenido <strong>de</strong> sacarosa estuve entre 10.75% a 15.36%, resultó<br />
un rendimiento KARBE en <strong>el</strong> rango 90 a 127 kg/t; consi<strong>de</strong>rando <strong>el</strong> reparto legal <strong>de</strong> 57% a los<br />
productores, la caña fue pagada como mínimo a 292.47 $/t (28.67 US$/t) y como máximo a<br />
417.90 $/t (40.97 US$/t), con un promedio nacional <strong>de</strong> 33 US$/t (CNIAA, 2006).<br />
Aparentemente, frente a los costos estimados anteriormente, la actividad cañera en México<br />
presenta buena remuneración, con un margen bruto <strong>de</strong> aproximadamente 10 a 13 US$/t, valor<br />
que pue<strong>de</strong> incrementarse al implementar las medidas <strong>de</strong> racionalización <strong>de</strong> costos<br />
mencionadas. Este precio ha estado prácticamente estable en los últimos diez años (Lazcano,<br />
45
<strong>Potenciales</strong> y <strong>Viabilidad</strong> <strong><strong>de</strong>l</strong> <strong>Uso</strong> <strong>de</strong> <strong>Bioetanol</strong> y <strong>Biodies<strong>el</strong></strong> <strong>para</strong> <strong>el</strong> Transporte en México (SENER-BID-GTZ)<br />
Task 5: Ethanol and ETBE production and end-use in Mexico<br />
2006). De hecho, como se presenta en la Figura 5.1, poco ha variado los precios pagados a los<br />
productores, en pesos mexicanos <strong>de</strong> 1994, a lo largo <strong>de</strong> las últimas décadas.<br />
120<br />
100<br />
Pesos (1994)/t<br />
80<br />
60<br />
40<br />
20<br />
0<br />
1980 1985 1990 1995 2000<br />
Figura 5.1. Evolución <strong>de</strong> los precios <strong>de</strong> la caña al productor<br />
Con r<strong>el</strong>ación a las m<strong>el</strong>azas (informaciones <strong>de</strong> Lazcano, 2006), en términos generales la<br />
industria azucarera en México no cuenta con capacidad instalada <strong>de</strong> almacenaje <strong>para</strong> <strong>el</strong><br />
líquido. Así, las ventas son programadas <strong>de</strong>s<strong>de</strong> inicio <strong>de</strong> zafra, bajo precios conocidos y<br />
pactados, por lo que se calcula la producción <strong>de</strong> mi<strong>el</strong> final <strong>para</strong> la venta directa, que se realiza<br />
en periodos que <strong>de</strong>sahoguen la problemática <strong>de</strong> capacidad <strong>de</strong> almacenaje. El precio <strong>de</strong> mi<strong>el</strong><br />
guarda un comportamiento con <strong>el</strong> precio <strong><strong>de</strong>l</strong> alcohol, <strong>el</strong> precio <strong><strong>de</strong>l</strong> maíz y <strong><strong>de</strong>l</strong> sorgo forrajero,<br />
porque es consi<strong>de</strong>rado un sustituto. Los principales <strong>de</strong>stinos <strong>de</strong> las m<strong>el</strong>azas producidas en los<br />
ingenios mexicanos son la agropecuaria, la producción <strong>de</strong> bebidas y la exportación. Como se<br />
indicó anteriormente, en 2004 la producción <strong>de</strong> m<strong>el</strong>azas en los ingenios mexicanos fue <strong>de</strong><br />
1,668 miles <strong>de</strong> ton<strong>el</strong>adas, <strong>de</strong> los cuales 26% fueran exportados <strong>para</strong> los Estados Unidos<br />
(F.O.Licht, 2006). Por otro lado, México importa cantida<strong>de</strong>s crecientes <strong>de</strong> jarabe <strong>de</strong> maíz <strong>de</strong><br />
Estados Unidos, en 2005 fueran 106 miles <strong>de</strong> ton<strong>el</strong>adas, cantidad que pue<strong>de</strong> doblar en 2006<br />
(ERS/USDA, 2006).<br />
Los precios internacionales <strong>de</strong> la mi<strong>el</strong> final, se incrementaron <strong>para</strong> finales <strong><strong>de</strong>l</strong> año pasado y se<br />
han mantenido estables durante 2006. A finales <strong>de</strong> 2005, <strong>el</strong> mercado enfrentó escasez <strong>de</strong><br />
alcohol y la <strong>de</strong>manda <strong>de</strong> mi<strong>el</strong> <strong>para</strong> la producción <strong><strong>de</strong>l</strong> mismo creció, lo que impulsó los precios<br />
al alza. Durante 2005, en septiembre los precios internacionales estaban alre<strong>de</strong>dor <strong>de</strong> 45<br />
US$/t, <strong>para</strong> octubre en 65 US$/t, en diciembre 85 US$/t, y en enero <strong>de</strong> 2006 alre<strong>de</strong>dor <strong>de</strong> 140<br />
US$/t. Actualmente <strong>el</strong> precio está estacionado entre los 95 US$/t y 100 US$/t.<br />
Para la producción <strong>de</strong> etanol <strong>de</strong> residuos c<strong>el</strong>ulósicos, no se consi<strong>de</strong>ró un precio <strong>para</strong> <strong>el</strong> bagazo,<br />
asumido como un residuo disponible en la planta y correspondiente a mitad <strong>de</strong> los residuos a<br />
46
<strong>Potenciales</strong> y <strong>Viabilidad</strong> <strong><strong>de</strong>l</strong> <strong>Uso</strong> <strong>de</strong> <strong>Bioetanol</strong> y <strong>Biodies<strong>el</strong></strong> <strong>para</strong> <strong>el</strong> Transporte en México (SENER-BID-GTZ)<br />
Task 5: Ethanol and ETBE production and end-use in Mexico<br />
procesar. Para la fracción <strong>de</strong> las puntas y hojas <strong>de</strong> caña transportadas hacia <strong>el</strong> ingenio <strong>para</strong><br />
procesamiento, evaluaciones en ingenios <strong>de</strong> Brasil establecieran un costo <strong>de</strong> recolección <strong>de</strong> 2<br />
US$/t (Macedo et al., 2001). Como esa fracción representa la mitad <strong>de</strong> la materia prima<br />
utilizada en <strong>el</strong> escenario adoptado, resultaría un costo promedio <strong>de</strong> 1 US$/t <strong>para</strong> <strong>el</strong> total <strong>de</strong> los<br />
residuos c<strong>el</strong>ulósicos, consi<strong>de</strong>rado <strong>de</strong>spreciable.<br />
5.1.2. Costos <strong>para</strong> maíz grano<br />
Consi<strong>de</strong>rando las condiciones <strong>de</strong> Sinaloa, <strong>para</strong> <strong>el</strong> ciclo productivo 2005-2006. se estimó un<br />
costo agrícola total, incluyendo flete y cuota <strong>de</strong> agua <strong>para</strong> riego, <strong>de</strong> $12,827.00 por hectárea,<br />
que asociado a una productividad <strong>de</strong> 10 ton<strong>el</strong>adas por hectarea, resulta un costo <strong>de</strong> producción<br />
<strong>de</strong> 1,282.70 $/t, correspondientes a 119.87 US$/t. En <strong>el</strong> caso que se incluya <strong>el</strong> costo <strong>de</strong> la<br />
tierra, cotizada a $5,000.00 por año, ese costo <strong>de</strong> producción pasaría a 1,783.00 $/t o 166.92<br />
US$/t (Lazcano, 2006).<br />
De forma análoga a la caña <strong>de</strong> azúcar, <strong>el</strong> costo <strong><strong>de</strong>l</strong> maíz como materia prima <strong>para</strong> producción<br />
<strong>de</strong> etanol <strong>para</strong> una agroindustria procesadora <strong>de</strong>bería ser tomado como <strong>el</strong> precio pagado a los<br />
produtores <strong>de</strong> ese grano. Para condiciones evaluadas en Sinaloa, incluyendo <strong>el</strong> subsidio <strong>de</strong><br />
Gobierno Fe<strong>de</strong>ral ($400.00 por ton<strong>el</strong>ada), resulta um precio final <strong>de</strong> $1,850,00, o sea 172,90<br />
US$/t.<br />
Vale observar que en <strong>el</strong> mercado americano los altos precios <strong><strong>de</strong>l</strong> maíz pagados a los<br />
productores han oscilado entre 84 hasta 96 US$/t en los últimos cinco años (FSA/USDA,<br />
2006), indicando la necesidad <strong>de</strong> enten<strong>de</strong>r mejor la formación <strong>de</strong> los precios en <strong>el</strong> contexto<br />
mexicano y la eventual oportunidad <strong>de</strong> promover incrementos <strong>de</strong> productividad y reducciones<br />
<strong>de</strong> costos y precios 3 . Se consi<strong>de</strong>ra que los productores mexicanos perciben ganancias<br />
r<strong>el</strong>ativamente reducidas frente a este cuadro <strong>de</strong> precios, inclusive “si se carga renta <strong>de</strong> tierra, a<br />
un rendimiento <strong>de</strong> 10 t/ha <strong>de</strong> grano, prácticamente no hay utilidad” (Lazcano, 2006), sin<br />
embargo en <strong>el</strong> proyecto <strong>de</strong> producción <strong>de</strong> etanol a partir <strong>de</strong> maíz diseñado <strong>para</strong> Tula <strong>de</strong><br />
Allen<strong>de</strong>, se consi<strong>de</strong>ró factible la utilización <strong>de</strong> maíz importado <strong>de</strong> Nebraska, evaluándose que<br />
<strong>el</strong> flete costaría cerca <strong>de</strong> 46 US$/t y resultaría un costo final <strong><strong>de</strong>l</strong> maíz <strong>de</strong> 127.50 US$/t,<br />
aproximadamente 26% inferior al precio corrientemente pagado a los productores mexicanos<br />
(Fundación Emisión, 2005). Esa hipótesis implicaría en empeorar aun más los pobres<br />
indicadores <strong>de</strong> eficiencia energética <strong>de</strong> la producción <strong>de</strong> etanol a partir <strong>de</strong> maíz en Estados<br />
Unidos. De toda manera, en este contexto, la significativa brecha entre los precios <strong>de</strong> mercado<br />
y los costos potenciales <strong>de</strong>be ser consi<strong>de</strong>rada como los dos puntos más importantes <strong>para</strong><br />
discutirse las posibilida<strong>de</strong>s <strong>de</strong> producir sustentablemente etanol a partir <strong>de</strong> cultivos<br />
agroenergéticos en Mexico.<br />
Particularmente <strong>para</strong> <strong>el</strong> maíz en la producción <strong>de</strong> etanol <strong>de</strong>be ser consi<strong>de</strong>rada la producción<br />
simultánea <strong>de</strong> los granos <strong>de</strong> <strong>de</strong>stilería, cerca <strong>de</strong> 321 kg/t <strong>de</strong> maíz procesado, que pue<strong>de</strong> ser<br />
comercializado a 90 US$/t por ton<strong>el</strong>ada (precio en marzo <strong>de</strong> 2006, producto seco con 10% <strong>de</strong><br />
humedad, un contenido <strong>de</strong> proteína cruda <strong>de</strong> 30.7% y <strong>de</strong> grasa <strong><strong>de</strong>l</strong> 10.9%) (Lazcano, 2006).<br />
Computándose la venta <strong><strong>de</strong>l</strong> DDGS, resulta un <strong>de</strong>scuento <strong>de</strong> US$ 28.89 por ton<strong>el</strong>ada <strong>de</strong> maíz<br />
3 Es fundamental observar que los precios <strong>de</strong> los productos agrícolas en los EUA y particularmente <strong>el</strong> maíz, están<br />
bastante distorsionados frente a los costos reales por políticas <strong>de</strong> soporte y <strong>el</strong>evados subsidios.<br />
47
<strong>Potenciales</strong> y <strong>Viabilidad</strong> <strong><strong>de</strong>l</strong> <strong>Uso</strong> <strong>de</strong> <strong>Bioetanol</strong> y <strong>Biodies<strong>el</strong></strong> <strong>para</strong> <strong>el</strong> Transporte en México (SENER-BID-GTZ)<br />
Task 5: Ethanol and ETBE production and end-use in Mexico<br />
procesado, significando un costo neto <strong><strong>de</strong>l</strong> maíz en <strong>el</strong> etanol entre 0.346 a 0.361 US$ por litro,<br />
respectivamente <strong>para</strong> los precios tomados a niv<strong>el</strong> <strong>de</strong> los costos (inclusive <strong>el</strong> costo <strong>de</strong> la tierra)<br />
y <strong>el</strong> precio pagado, con subsidios, a los productores.<br />
El precio adoptado <strong>para</strong> <strong>el</strong> DDG es evi<strong>de</strong>ntemente r<strong>el</strong>evante y será mejor explorado en los<br />
estudios <strong>de</strong> sensibilidad. En los últimos meses hay una gran volatilidad en ese mercado,<br />
llegando a alcanzar en algunos estados americanos más <strong>de</strong> 140 US$/t, pero la sustentada<br />
expansión <strong>de</strong> la producción <strong>de</strong> etanol <strong>de</strong> maíz en EUA señaliza posibles exce<strong>de</strong>ntes <strong>de</strong><br />
producción y una reducción <strong>de</strong> precios a mediano o largo plazo. Un punto importante es la<br />
limitada capacidad <strong>de</strong> absorción <strong>de</strong> ese producto en la pecuaria americana y la necesidad <strong>de</strong><br />
los productores americanos <strong>de</strong> etanol exportarlo a otros mercados, como Europa (Hurt, 2006).<br />
5.1.3. Costos <strong>para</strong> otras materias primas<br />
Para las <strong>de</strong>más materias primas consi<strong>de</strong>radas <strong>de</strong> interés potencial (sorgo dulce, yuca y<br />
remolacha) la limitada área cultivada y reducida experiencia agronómica, como ya se<br />
comentó, impone estimaciones menos fundamentadas. Basándose en estudios <strong>de</strong>sarrollados en<br />
contextos similares, se <strong>de</strong>terminaran costos <strong>de</strong> referencia <strong>para</strong> estos productos, como se<br />
resumen en la Tabla 5.4.<br />
Los valores <strong>de</strong> costos <strong>para</strong> <strong>el</strong> sorgo dulce se estimaron <strong>de</strong> datos <strong>de</strong> costos <strong>de</strong> producción en<br />
Estados Unidos (Rains et al., 2005), sustituyendo los costos <strong>de</strong> cosecha y transporte por datos<br />
mexicanos (Poy, 2005), resultando 20.85 US$/t. Los costos <strong>para</strong> yuca fueran consi<strong>de</strong>rados<br />
similares a los <strong>de</strong>terminados <strong>para</strong> Brasil, 51.00 US$/t, según reciente estudio sobre <strong>el</strong> empleo<br />
<strong>de</strong> esa raíz <strong>para</strong> la producción <strong>de</strong> etanol (ABAM, 2006). Vale observar que en la región<br />
colombiana <strong>de</strong> Magdalena, consi<strong>de</strong>rando producción <strong>para</strong> fines industriales, fueran estimados<br />
costos bastante bajos <strong>para</strong> la yuca, alre<strong>de</strong>dor <strong>de</strong> 20.80 US$/t (Quintero, 2004), sin embargo<br />
<strong>de</strong>bido a reducida experiencia mexicana con ese cultivo, los valores constatados en Brasil<br />
parecen más a<strong>de</strong>cuados.<br />
Tabla 5.4. Costos estimados <strong>de</strong> producción <strong>para</strong> las biomasas no convencionales <strong>de</strong> interés<br />
<strong>para</strong> la producción <strong>de</strong> etanol en México<br />
Cultivo<br />
Costo <strong>de</strong> producción<br />
US$/ t<br />
Sorgo dulce 20.85<br />
Yuca 51.00<br />
Remolacha azucarera 35.60<br />
Los valores <strong>de</strong> costos <strong>de</strong> producción <strong>de</strong> la remolacha consi<strong>de</strong>raran condiciones similares a la<br />
región <strong>de</strong> interés, ya que <strong>el</strong> Valle Imperial <strong>de</strong> California es vecino inmediato <strong><strong>de</strong>l</strong> Valle <strong>de</strong><br />
Mexicali. Para ese cultivo, tomando las varieda<strong>de</strong>s Phoenix y Beta 4430, los costos <strong>de</strong><br />
agroquímicos; semilla, y cosecha son los <strong><strong>de</strong>l</strong> Valle Imperial; los <strong>de</strong> labores mecanizadas <strong>de</strong><br />
pre<strong>para</strong>ción <strong>de</strong> tierras, cultivos, aplicación <strong>de</strong> insumos, transporte, agua, mano <strong>de</strong> obra, seguro<br />
48
<strong>Potenciales</strong> y <strong>Viabilidad</strong> <strong><strong>de</strong>l</strong> <strong>Uso</strong> <strong>de</strong> <strong>Bioetanol</strong> y <strong>Biodies<strong>el</strong></strong> <strong>para</strong> <strong>el</strong> Transporte en México (SENER-BID-GTZ)<br />
Task 5: Ethanol and ETBE production and end-use in Mexico<br />
e intereses, son según las cuotas y tarifas <strong>de</strong> la región (Lazcano, 2006) y asumiendo una<br />
productividad <strong>de</strong> 51 t/ha, se llega a 35.60 US$/t. No se consi<strong>de</strong>raran renta <strong>de</strong> tierras que se<br />
cotiza en $ 2,500 anuales por hectárea. Es interesante observar que eses costos resultaran<br />
similares a los presentados en un reciente estudio <strong>para</strong> Tasmania, Australia (RIRDC, 2005).<br />
Cabe <strong>de</strong>stacar que en estos casos se trata <strong>de</strong> tener referencias <strong>para</strong> una evaluación más<br />
exploratoria, ya que frente a expectivas <strong>de</strong> efectiva viabilidad <strong>de</strong>berán ser efectuados estudios<br />
complementares en mayor <strong>de</strong>talle. De toda manera, los próximos estudios <strong>de</strong> sensibilidad a los<br />
costos permitirán evaluar mejor la importancia <strong>de</strong> cada componente <strong>de</strong> costo consi<strong>de</strong>rado.<br />
Para todos estos cultivos, se presento en <strong>el</strong> Capítulo 4 <strong>de</strong> ese informe una evaluación<br />
pr<strong>el</strong>iminar <strong>de</strong> los costos directos <strong>de</strong> la materia prima en <strong>el</strong> etanol producido. A continuación, a<br />
esos costos serán agregados los costos <strong>de</strong> procesamiento <strong>para</strong> las diferentes tecnologias.<strong>de</strong><br />
interés, como los costos <strong>de</strong> operación, inversion y <strong>el</strong> efecto <strong>de</strong> los subprodutos, permitiendo<br />
estimar <strong>el</strong> costo final <strong><strong>de</strong>l</strong> etanol.<br />
5.2. Costos <strong>de</strong> procesamiento<br />
Para las tecnologías <strong>de</strong> producción <strong>de</strong> etanol consi<strong>de</strong>radas más factibles y utilizando las<br />
diferentes alternativas <strong>de</strong> materia prima introducidas en <strong>el</strong> Capítulo 4, se presenta a<br />
continuación las evaluaciones <strong>de</strong> los costos <strong>de</strong> procesamiento correspondientes. A partir <strong>de</strong> la<br />
materia prima colocada en la unidad agroindustrial, esos costos pue<strong>de</strong>n ser subdivididos en<br />
costos variables, que <strong>de</strong>pen<strong>de</strong>n <strong><strong>de</strong>l</strong> volumen <strong>de</strong> etanol producido, como mano <strong>de</strong> obra <strong>para</strong> los<br />
ciclos <strong>de</strong> zafra, materiales y productos químicos, energía <strong>el</strong>éctrica, combustibles, etc. y costos<br />
fijos, referentes a las inversiones, tasas y re<strong>para</strong>ción y otros rubros, que no <strong>de</strong>pen<strong>de</strong>n <strong><strong>de</strong>l</strong><br />
volumen <strong>de</strong> etanol producido.<br />
5.2.1. Módulos industriales e inversiones<br />
Buscando estimar los costos <strong>de</strong> forma representativa, <strong>para</strong> cada materia prima y tecnología se<br />
adoptó un módulo industrial, correspondiendo siempre que posible a unida<strong>de</strong>s productivas<br />
reales o diseñadas en <strong>de</strong>talle. Naturalmente que eses costos pue<strong>de</strong>n variar ampliamente en<br />
función <strong>de</strong> las condiciones <strong><strong>de</strong>l</strong> proyecto, como por ejemplo uso <strong>de</strong> materiales más resistentes a<br />
corrosión, adopción <strong>de</strong> sistemas <strong>de</strong> automatización y control más complejos, sistemas <strong>de</strong><br />
tratamiento <strong>de</strong> efluentes, etc.<br />
La Tabla 5.5 presenta las características principales <strong>para</strong> los módulos industriales empleando<br />
caña <strong>de</strong> azúcar en las diferentes posibilida<strong>de</strong>s. Estos módulos fueran concebidos basándose en<br />
la experiencia brasileña <strong>para</strong> la <strong>de</strong>stilería autónoma (Oliverio, 2006) y guatemalteca <strong>para</strong> las<br />
<strong>de</strong>stilerías anexas, adoptándose en ese último caso las inversiones estimadas en plantas<br />
productoras <strong>de</strong> etanol implantadas recientemente en Guatemala junto al ingenio azucareros,<br />
utilizando equipos producidos en México (CEPAL, 2006). Queda confirmada a existencia <strong>de</strong><br />
economía <strong>de</strong> escala en las <strong>de</strong>stilerías <strong>de</strong> etanol, resultando <strong>para</strong> capacida<strong>de</strong>s más <strong>el</strong>evadas<br />
inversiones unitarias más reducidas. Para las <strong>de</strong>stilerías anexas no fueran consi<strong>de</strong>radas las<br />
inversiones en <strong>el</strong> ingenio, <strong>de</strong>dicadas esencialmente a fabricación <strong>de</strong> azúcar. Los costos <strong>para</strong> la<br />
hidrólisis <strong>de</strong> residuos c<strong>el</strong>ulósicos serán comentados a<strong><strong>de</strong>l</strong>ante.<br />
49
<strong>Potenciales</strong> y <strong>Viabilidad</strong> <strong><strong>de</strong>l</strong> <strong>Uso</strong> <strong>de</strong> <strong>Bioetanol</strong> y <strong>Biodies<strong>el</strong></strong> <strong>para</strong> <strong>el</strong> Transporte en México (SENER-BID-GTZ)<br />
Task 5: Ethanol and ETBE production and end-use in Mexico<br />
Tabla 5.5. Módulos productivos <strong>para</strong> fabricación <strong>de</strong> etanol <strong>de</strong> caña <strong>de</strong> azúcar<br />
proceso<br />
módulo industrial<br />
mi<strong>el</strong> pobre<br />
mi<strong>el</strong> rica<br />
jugo directo<br />
Destilería anexa con 150 m 3 /día <strong>de</strong> capacidad, inversiones <strong>de</strong> 15 millones <strong>de</strong> dólares,<br />
operando 210 días/año y 86% <strong>de</strong> aprovechamiento <strong><strong>de</strong>l</strong> tiempo, anualmente utilizando mi<strong>el</strong> C<br />
(propio o comprado <strong>de</strong> otros ingenios) resultante <strong><strong>de</strong>l</strong> procesamiento <strong>de</strong> 3.08 millones <strong>de</strong><br />
ton<strong>el</strong>adas <strong>de</strong> caña y produciendo 27,090 m 3 <strong>de</strong> etanol anhidro. Dispone <strong>de</strong> servicios<br />
auxiliares (<strong>el</strong>ectricidad y vapor generados a partir <strong>de</strong> bagazo en <strong>el</strong> ingenio asociado)<br />
Destilería anexa con 150 m 3 /día <strong>de</strong> capacidad, inversiones <strong>de</strong> 15 millones <strong>de</strong> dólares,<br />
operando 210 días/año y 86% <strong>de</strong> aprovechamiento <strong><strong>de</strong>l</strong> tiempo, anualmente utilizando mi<strong>el</strong> B<br />
(propio o comprado <strong>de</strong> otros ingenios) resultante <strong><strong>de</strong>l</strong> procesamiento <strong>de</strong> 1.58 millones <strong>de</strong><br />
ton<strong>el</strong>adas <strong>de</strong> caña y produciendo 27,090 m 3 <strong>de</strong> etanol anhidro. Dispone <strong>de</strong> servicios<br />
auxiliares (<strong>el</strong>ectricidad y vapor generados a partir <strong>de</strong> bagazo en <strong>el</strong> ingenio asociado)<br />
Destilaría autónoma con 450 m 3 /día <strong>de</strong> capacidad, inversiones industriales <strong>de</strong> 50 millones <strong>de</strong><br />
dólares, operando 210 días/año y 86% <strong>de</strong> aprovechamiento <strong><strong>de</strong>l</strong> tiempo, procesando por zafra<br />
1 millón <strong>de</strong> t <strong>de</strong> caña y produciendo 80,000 m 3 <strong>de</strong> etanol anhidro. Produce <strong>el</strong>ectricidad y<br />
vapor a partir <strong>de</strong> 250 mil t <strong>de</strong> bagazo producido por zafra, sin necesitar <strong>de</strong> aportes<br />
energéticos externos.<br />
jugo directo y hidrólisis <strong>de</strong><br />
bagazo y residuos<br />
Destilaría autónoma con 450 m 3 /día <strong>de</strong> capacidad, incorporando una planta <strong>para</strong> hidrolizar<br />
aprox. 923 t <strong>de</strong> bagazo exce<strong>de</strong>nte y residuos <strong>de</strong> cosecha, con capacidad adicional <strong>de</strong> 100<br />
m 3 /día y inversiones industriales totales <strong>de</strong> 158 millones <strong>de</strong> dólares, operando 210 días/año y<br />
86% <strong>de</strong> aprovechamiento <strong><strong>de</strong>l</strong> tiempo, procesando por zafra 1 millón <strong>de</strong> t <strong>de</strong> caña y<br />
produciendo 98,000 m 3 <strong>de</strong> etanol anhidro. Produce <strong>el</strong>ectricidad y vapor a partir <strong>de</strong> 250 mil t<br />
<strong>de</strong> bagazo producido por zafra, sin necesitar <strong>de</strong> aportes energéticos externos.<br />
La extensa experiencia brasileña en la producción <strong>de</strong> estos equipos permite estimaciones <strong>de</strong><br />
precios bastante confiables, típicamente en <strong>el</strong> rango <strong>de</strong> US$ 5,000 por ton<strong>el</strong>ada <strong>de</strong> caña<br />
procesada por día, <strong>para</strong> azúcar y etanol. Estudios recientes e in<strong>de</strong>pendientes sobre costos <strong>de</strong><br />
ingenios alcoholeros en Brasil apuntan inversiones bastante similares a la estimación<br />
presentada en la tabla anterior (CGEE, 2006 y Assis, 2006). Actualmente las <strong>de</strong>stilarías<br />
brasileñas son típicamente diseñadas <strong>para</strong> procesar cerca <strong>de</strong> 2 millones <strong>de</strong> t <strong>de</strong> caña por año, o<br />
sea, <strong>el</strong> doble <strong><strong>de</strong>l</strong> modulo productivo adoptado <strong>para</strong> jugo directo <strong>de</strong> caña, pero se consi<strong>de</strong>ró más<br />
razonable proponer capacida<strong>de</strong>s <strong>de</strong> procesamiento similares a mayores plantas azucareras en<br />
operación en México, como se citó en <strong>el</strong> Capítulo 2 <strong><strong>de</strong>l</strong> presente informe. Cerca <strong>de</strong> 10% <strong>de</strong><br />
estos costos correspon<strong>de</strong>n a obras civiles, <strong>el</strong> restante a equipos y máquinas (Terciote, 2006).<br />
En línea con las estimaciones conservadoras <strong>de</strong> productividad presentadas en <strong>el</strong> capítulo<br />
anterior, la estimación <strong><strong>de</strong>l</strong> costo adicional <strong>para</strong> la planta <strong>para</strong> tratamiento e hidrólisis <strong>de</strong><br />
bagazo y residuos <strong>de</strong> cosecha consi<strong>de</strong>ró <strong>el</strong> “near term base case” sugerida por estudios <strong>de</strong> la<br />
Agencia Internacional <strong>de</strong> Energía <strong>para</strong> esa tecnología, <strong>para</strong>metrizados por unidad <strong>de</strong><br />
producción diaria <strong>de</strong> etanol (IEA/EET, 2005). Según estos estudios, <strong>para</strong> una planta las<br />
inversiones previstas en ese caso son <strong>de</strong> 234 millones <strong>de</strong> dólares, <strong>para</strong> una capacidad <strong>de</strong><br />
50
<strong>Potenciales</strong> y <strong>Viabilidad</strong> <strong><strong>de</strong>l</strong> <strong>Uso</strong> <strong>de</strong> <strong>Bioetanol</strong> y <strong>Biodies<strong>el</strong></strong> <strong>para</strong> <strong>el</strong> Transporte en México (SENER-BID-GTZ)<br />
Task 5: Ethanol and ETBE production and end-use in Mexico<br />
procesamiento <strong>de</strong> 2 millones <strong>de</strong> ton<strong>el</strong>adas por día, que resulta una inversión <strong>de</strong> 108 millones<br />
<strong>de</strong> dólares <strong>para</strong> la unidad adicional a la <strong>de</strong>stilería autónoma, no consi<strong>de</strong>rando en ese caso<br />
cualquier efecto <strong>de</strong> escala. Obsérvese que por unidad <strong>de</strong> etanol producida, esta tecnología<br />
presenta costos casi 10 veces más <strong>el</strong>evados com<strong>para</strong>tivamente a tecnología convencional,<br />
mediante jugo directo <strong>de</strong> la caña.<br />
Para <strong>el</strong> maíz como materia prima, se tomaran los datos <strong>de</strong> un estudio <strong>de</strong>tallado <strong>para</strong> la realidad<br />
mexicana, contemplando una unidad productora <strong>de</strong> etanol en Tulla <strong>de</strong> Allen<strong>de</strong>, Hidalgo,<br />
utilizando procesamiento en seco <strong>para</strong> producir 500 miles litros diarios <strong>de</strong> etanol. Para una<br />
planta <strong>de</strong> ese tamaño se <strong>de</strong>terminó un costo unitario <strong>de</strong> 122 dólares por litro <strong>de</strong> capacidad<br />
diaria <strong>de</strong> producción, resultando la inversión total estimada <strong>de</strong> 61 millones <strong>de</strong> dólares<br />
(Fundación Emisión, 2005). Esa inversión está en <strong>el</strong> rango <strong>de</strong> las inversiones típicas en<br />
plantas americanas <strong>para</strong> producción <strong>de</strong> etanol <strong>de</strong> maíz por proceso en seco, que <strong>para</strong> una<br />
unidad <strong>de</strong> 50 millones <strong>de</strong> galones anuales se prevé una inversión <strong>de</strong> 80 millones <strong>de</strong> dólares,<br />
que implican en un costo unitario <strong>de</strong> aproximadamente 127 dólares por litro diario <strong>de</strong> etanol<br />
producido (Yancey, 2006). Las principales características <strong>de</strong> esa planta están indicadas en la<br />
Tabla 5.6.<br />
Tabla 5.6. Módulo productivo <strong>para</strong> fabricación <strong>de</strong> etanol <strong>de</strong> maíz,<br />
proceso<br />
vía seca<br />
módulo industrial<br />
Destilaría autónoma con 500 m 3 /día <strong>de</strong> capacidad, inversiones industriales <strong>de</strong> 60 millones <strong>de</strong><br />
dólares, operando 350 días/año y 86% <strong>de</strong> aprovechamiento <strong><strong>de</strong>l</strong> tiempo, procesando por zafra 378<br />
mil t <strong>de</strong> maíz y produciendo 150,500 m 3 <strong>de</strong> etanol anhidro y 121.4 mil t <strong>de</strong> granos <strong>de</strong> <strong>de</strong>stilería con<br />
10% <strong>de</strong> humedad. Como servicios auxiliares son requeridos 31,605 MWh <strong>de</strong> <strong>el</strong>ectricidad y 1,580<br />
TJ <strong>de</strong> energía térmica a partir <strong>de</strong> gas natural.<br />
Como se mencionó en los tópicos anteriores, la evaluación <strong>de</strong> los módulos productivos <strong>para</strong><br />
las alternativas no convencionales (sorgo, yuca y remolacha) resultó menos fundamentada en<br />
experiencias concretas y se basó esencialmente en semejanzas <strong>de</strong> proceso con materias primas<br />
conocidas y en proyectos conceptuales concebidos <strong>para</strong> otros países. Para todos estos casos se<br />
adoptó un módulo <strong>de</strong> misma dimensión, similar al módulo más pequeño estudiado <strong>para</strong> la<br />
caña, variando naturalmente la cantidad <strong>de</strong> biomasa procesada y utilizando los parámetros<br />
presentados en <strong>el</strong> capítulo anterior. Para <strong>el</strong> sorgo, la configuración básica <strong>de</strong> la planta es<br />
similar a sugerida <strong>para</strong> Tailandia. (Trinda<strong>de</strong>, 1985). Para la yuca, se <strong>de</strong>finió una configuración<br />
<strong>de</strong> la misma capacidad, ajustándose los valores <strong>de</strong> modo <strong>de</strong> mantener la proporcionalidad entre<br />
los costos por procesos con sacáridos y almidones. Para la remolacha, se adoptó <strong>el</strong> balance <strong>de</strong><br />
masa y los indicadores <strong>de</strong> <strong>de</strong>manda energética <strong>de</strong> la literatura (El Sayed et al., 2005). Los<br />
datos <strong>para</strong> esos módulos constan <strong>de</strong> la Tabla 5.7.<br />
En la Tabla 5.8 se sintetizan las inversiones consi<strong>de</strong>radas representativas <strong>para</strong> los módulos<br />
industriales presentados anteriormente. Obsérvese que <strong>para</strong> las tecnologías asociadas a caña <strong>de</strong><br />
azúcar los costos no varían <strong>de</strong> modo r<strong>el</strong>evante, con la comprensible excepción <strong><strong>de</strong>l</strong> caso <strong>de</strong><br />
hidrólisis, bastante <strong>el</strong>evado por ser una tecnología todavía no comercial. En <strong>el</strong> caso <strong>de</strong><br />
consi<strong>de</strong>rar solamente la hidrólisis, <strong>el</strong> costo unitario <strong>de</strong> etanol situase en 1,080 US$/litro diario<br />
<strong>de</strong> etanol producido. No es posible hacer una com<strong>para</strong>ción directa ente los costos <strong>para</strong> los<br />
51
<strong>Potenciales</strong> y <strong>Viabilidad</strong> <strong><strong>de</strong>l</strong> <strong>Uso</strong> <strong>de</strong> <strong>Bioetanol</strong> y <strong>Biodies<strong>el</strong></strong> <strong>para</strong> <strong>el</strong> Transporte en México (SENER-BID-GTZ)<br />
Task 5: Ethanol and ETBE production and end-use in Mexico<br />
diferentes procesos y los casos referentes a la caña en la medida que, a<strong>de</strong>más <strong>de</strong> representar<br />
tecnologías diferentes y <strong>de</strong>sigualmente <strong>de</strong>sarrolladas, <strong>para</strong> las <strong>de</strong>stilerías anexas gran<strong>de</strong> parte<br />
<strong>de</strong> los equipos <strong><strong>de</strong>l</strong> ingenio ya está amortizada, mientras <strong>para</strong> la <strong>de</strong>stilería autónoma la<br />
capacidad <strong>de</strong> producción es bastante diferente.<br />
Tabla 5.7. Módulos <strong>para</strong> fabricación <strong>de</strong> etanol <strong>de</strong> materias primas no convencionales<br />
materia<br />
prima<br />
módulo industrial<br />
sorgo<br />
yuca<br />
Destilaría autónoma con 150 m 3 /día <strong>de</strong> capacidad, inversiones industriales <strong>de</strong> 25 millones <strong>de</strong><br />
dólares, operando 250 días/año y 86% <strong>de</strong> aprovechamiento <strong><strong>de</strong>l</strong> tiempo, procesando por zafra 921<br />
mil <strong>de</strong> t <strong>de</strong> sorgo dulce y produciendo 32,250 m 3 <strong>de</strong> etanol anhidro. Produce <strong>el</strong>ectricidad y vapor<br />
a partir <strong>de</strong> 230 mil t <strong>de</strong> bagazo producido por zafra, sin necesitar <strong>de</strong> aportes energéticos externos.<br />
Destilaría autónoma con 150 m 3 /día <strong>de</strong> capacidad, inversiones industriales <strong>de</strong> 45 millones <strong>de</strong><br />
dólares, operando 250 días/año y 86% <strong>de</strong> aprovechamiento <strong><strong>de</strong>l</strong> tiempo, procesando por zafra<br />
189.7 mil <strong>de</strong> t <strong>de</strong> raíces <strong>de</strong> yuca y produciendo 32,250 m 3 <strong>de</strong> etanol anhidro. Necesita <strong>de</strong> 903 TJ<br />
como combustibles <strong>para</strong> aten<strong>de</strong>r su <strong>de</strong>manda <strong>de</strong> <strong>el</strong>ectricidad y calor <strong>de</strong> proceso.<br />
remolacha<br />
Destilaría autónoma con 150 m 3 /día <strong>de</strong> capacidad, inversiones industriales <strong>de</strong> 30 millones <strong>de</strong><br />
dólares, operando 250 días/año y 86% <strong>de</strong> aprovechamiento <strong><strong>de</strong>l</strong> tiempo, procesando por zafra 375<br />
mil <strong>de</strong> t <strong>de</strong> remolacha y produciendo 32,250 m 3 <strong>de</strong> etanol anhidro. Necesita <strong>de</strong> 2,518 MWh y 212<br />
TJ respectivamente <strong>para</strong> aten<strong>de</strong>r su <strong>de</strong>manda <strong>de</strong> <strong>el</strong>ectricidad y calor <strong>de</strong> proceso.<br />
Tabla 5.8. Inversión en plantas productoras <strong>de</strong> etanol<br />
Materia prima y tecnología<br />
Inversión Capacidad Inversión unitaria<br />
mil US$ m 3 /día US$/litro/día<br />
Cana, mi<strong>el</strong> pobre 15,000 150 100<br />
Caña, mi<strong>el</strong> rica 15,000 150 100<br />
Jugo directo 50,000 450 111<br />
Jugo directo + hidrólisis 158,000 551 287<br />
Maíz vía seca 61,000 500 122<br />
Sorgo 25,000 150 167<br />
Yuca 45,000 150 300<br />
Remolacha 30,000 150 200<br />
52
<strong>Potenciales</strong> y <strong>Viabilidad</strong> <strong><strong>de</strong>l</strong> <strong>Uso</strong> <strong>de</strong> <strong>Bioetanol</strong> y <strong>Biodies<strong>el</strong></strong> <strong>para</strong> <strong>el</strong> Transporte en México (SENER-BID-GTZ)<br />
Task 5: Ethanol and ETBE production and end-use in Mexico<br />
5.2.2. Costos <strong>de</strong> operación y mantenimiento<br />
A continuación se <strong>de</strong>tallan los costos <strong>para</strong> operar una planta productora <strong>de</strong> etanol, incluyendo<br />
básicamente los costos <strong>de</strong> los servicios auxiliares (energía <strong>el</strong>éctrica y vapor <strong>de</strong> proceso), costos<br />
<strong>de</strong> mano <strong>de</strong> obra, costos administrativos, insumos <strong>de</strong> producción y costos <strong>de</strong> mantenimiento y<br />
conservación.<br />
Los costos energéticos o <strong>de</strong> los servicios, <strong>para</strong> las alternativas asociadas a la caña <strong>de</strong> azúcar,<br />
están cubiertos por <strong>el</strong> uso <strong><strong>de</strong>l</strong> bagazo en la producción <strong>de</strong> vapor <strong>de</strong> alta presión y la utilización<br />
<strong>de</strong> esquemas <strong>de</strong> cogeneración, con producción combinada <strong>de</strong> <strong>el</strong>ectricidad y calor útil, <strong>de</strong><br />
manera <strong>de</strong> no requerir <strong>el</strong> aporte <strong>de</strong> energía adicional. De hecho, empleándose cal<strong>de</strong>ras con<br />
presión <strong>de</strong> 21 bar se asegura <strong>el</strong> balance entre las <strong>de</strong>mandas y disponibilida<strong>de</strong>s <strong>de</strong> vapor,<br />
mientras bajo una presión <strong>de</strong> 80 bar pue<strong>de</strong> ser esperada un exce<strong>de</strong>nte <strong>de</strong> 80 kWh por ton<strong>el</strong>ada<br />
<strong>de</strong> caña procesada (Assis, 2006). De modo semejante se consi<strong>de</strong>ró que <strong>el</strong> procesamiento <strong><strong>de</strong>l</strong><br />
sorgo no <strong>de</strong>manda aporte <strong>de</strong> energía externa, por ser procesado <strong>de</strong> forma parecida a la <strong>de</strong> la<br />
caña.<br />
Para <strong>el</strong> procesamiento <strong><strong>de</strong>l</strong> maíz y <strong>de</strong> la yuca, materias primas que no disponen <strong>de</strong> residuos con<br />
potencial energético, es necesario consi<strong>de</strong>rar a <strong>de</strong>manda <strong>de</strong> insumos energéticos externos. Así,<br />
<strong>para</strong> <strong>el</strong> maíz se adoptó 0.21 kWh <strong>de</strong> energía <strong>el</strong>éctrica y 10.2 MJ <strong>de</strong> combustibles por litro <strong>de</strong><br />
etanol producido, valores promedios usuales en plantas reales. Para la yuca, se consi<strong>de</strong>ró<br />
solamente la <strong>de</strong>manda <strong>de</strong> combustibles, al niv<strong>el</strong> <strong>de</strong> 28 MJ por litro (un promedio en <strong>el</strong> rango<br />
presentado en <strong>el</strong> capítulo anterior), asumiendo <strong>el</strong> empleo <strong>de</strong> sistemas <strong>de</strong> cogeneración y la<br />
generación <strong>de</strong> <strong>el</strong>ectricidad en la propia planta. Para la remolacha, conforme observado<br />
anteriormente, se propone que <strong>el</strong> cultivo <strong>de</strong>bería ocurrir en la región <strong><strong>de</strong>l</strong> Valle <strong>de</strong> Mexicali,<br />
r<strong>el</strong>ativamente cerca <strong>de</strong> la Central Geotérmica <strong>de</strong> Cerro Prieto, exactamente buscando utilizar<br />
las disponibilida<strong>de</strong>s <strong>de</strong> calor <strong>de</strong> esa planta, consecuentemente no necesitando <strong>de</strong> aporte<br />
energético externo.<br />
Para la energía <strong>el</strong>éctrica consumida se adoptó un precio <strong>de</strong> 150 US$/MWh y <strong>para</strong> <strong>el</strong> gas<br />
natural, asumido como la fuente complementar <strong>de</strong> energía térmica a ser empleada en cal<strong>de</strong>ras<br />
con 80% <strong>de</strong> rendimiento, se consi<strong>de</strong>ró un precio <strong>de</strong> 5.50 US$/MJ, valores adoptados en<br />
estudios similares <strong>para</strong> México (Fundación Emisión, 2005) y constatados como<br />
representativos.<br />
Con base en datos <strong>de</strong> sistemas reales utilizando caña <strong>de</strong> azúcar, se estimó que los costos <strong>de</strong><br />
mano <strong>de</strong> obra y costos administrativos correspon<strong>de</strong>n respectivamente a 8.5% y 1.2% <strong>de</strong> los<br />
costos con materia prima. Para los costos asociados a los insumos <strong>de</strong> producción y costos <strong>de</strong><br />
mantenimiento y conservación, se adoptó 3% <strong>de</strong> las inversiones <strong>para</strong> ambos casos. Estos<br />
valores fueran <strong>el</strong>egidos a partir <strong>de</strong> datos <strong>de</strong> plantas brasileñas (Assis, 2006) y son com<strong>para</strong>bles<br />
a indicadores similares <strong>para</strong> otros procesos (Henniges y Zeddies, 2003). Como se verá a<br />
continuación, esos costos representan generalmente menos <strong>de</strong> 15% <strong><strong>de</strong>l</strong> costo total <strong><strong>de</strong>l</strong> etanol,<br />
mayormente formado por la materia prima, inversión y energía.<br />
53
<strong>Potenciales</strong> y <strong>Viabilidad</strong> <strong><strong>de</strong>l</strong> <strong>Uso</strong> <strong>de</strong> <strong>Bioetanol</strong> y <strong>Biodies<strong>el</strong></strong> <strong>para</strong> <strong>el</strong> Transporte en México (SENER-BID-GTZ)<br />
Task 5: Ethanol and ETBE production and end-use in Mexico<br />
5.3. Costos totales<br />
Estimándose <strong>el</strong> valor anualizado <strong>de</strong> las inversiones, mediante una tasa <strong>de</strong> <strong>de</strong>scuento <strong>de</strong> 12% y<br />
una vida económica <strong>de</strong> 10 años y agregando los costos <strong>de</strong> materia prima y operación y<br />
mantenimiento anteriormente presentados, se obtiene <strong>el</strong> costo total <strong><strong>de</strong>l</strong> etanol como presentado<br />
en la Tabla 5.9 y la Figura 5.2, con los distintos componentes. Obsérvese que <strong>el</strong> costo <strong><strong>de</strong>l</strong><br />
azúcar no producido, un costo <strong>de</strong> oportunidad, carga en <strong>el</strong> costo <strong><strong>de</strong>l</strong> etanol <strong>de</strong> mi<strong>el</strong> rica <strong>de</strong><br />
caña.<br />
Tabla 5.9. Composición <strong>de</strong> los costos <strong>de</strong> producción <strong>de</strong> etanol (US$/litro)<br />
Caso<br />
Caña mi<strong>el</strong><br />
pobre<br />
Caña mi<strong>el</strong><br />
rica<br />
Caña jugo<br />
directo<br />
Caña jugo +<br />
hidrólisis<br />
Maíz vía seca<br />
Sorgo<br />
Yuca<br />
Remolacha<br />
materia prima 0.26 0.21 0.27 0.22 0.30 0.59 0.30 0.44<br />
inversiones 0.09 0.09 0.10 0.26 0.07 0.13 0.23 0.15<br />
energía 0.00 0.00 0.00 0.00 0.09 0.00 0.15 0.00<br />
otros 0.06 0.21 0.06 0.12 -0.02 0.10 0.11 0.10<br />
total 0.40 0.52 0.43 0.60 0.44 0.82 0.79 0.69<br />
0.90<br />
0.80<br />
0.70<br />
0.60<br />
US$/litro<br />
otros<br />
energía<br />
inversiones<br />
materia prima<br />
0.50<br />
0.40<br />
0.30<br />
0.20<br />
0.10<br />
0.00<br />
-0.10<br />
Cana mi<strong>el</strong><br />
pobre<br />
Cana mi<strong>el</strong><br />
rica<br />
Cana jugo<br />
directo<br />
Cana jugo<br />
+ hidrólisis<br />
Maíz vía<br />
seca<br />
Sorgo<br />
Yuca<br />
Remolacha<br />
Figura 5.2. Costos <strong><strong>de</strong>l</strong> etanol <strong>para</strong> las materias primas y procesos consi<strong>de</strong>rados<br />
54
<strong>Potenciales</strong> y <strong>Viabilidad</strong> <strong><strong>de</strong>l</strong> <strong>Uso</strong> <strong>de</strong> <strong>Bioetanol</strong> y <strong>Biodies<strong>el</strong></strong> <strong>para</strong> <strong>el</strong> Transporte en México (SENER-BID-GTZ)<br />
Task 5: Ethanol and ETBE production and end-use in Mexico<br />
Esos resultados, particularmente <strong>para</strong> las tecnologías convencionales (0.40 a 0.44 US$/litro)<br />
son más <strong>el</strong>evados que los costos <strong><strong>de</strong>l</strong> etanol <strong>de</strong> maíz en Estados Unidos (0.30 a 0.35 US$/litro,<br />
incluyendo los créditos <strong>para</strong> subproductos) y algo más bajos que los valores estimados <strong>para</strong> <strong>el</strong><br />
etanol <strong>de</strong> remolacha y trigo en <strong>el</strong> contexto europeo (0.40 a 0.45 US$/litro) (Henniges, 2003).<br />
Como justificaciones básicas, en <strong>el</strong> caso americano la materia prima es más barata, mientras<br />
en Europa la materia prima es más cara y típicamente las inversiones son cerca <strong>de</strong> 30% más<br />
<strong>el</strong>evadas, particularmente por un niv<strong>el</strong> más <strong>el</strong>evado <strong>de</strong> automatización y exigencias<br />
ambientales (Henniges, 2006).<br />
La importancia <strong>de</strong> los costos <strong>de</strong> la materia prima es evi<strong>de</strong>nte. En <strong>el</strong> caso que se tome <strong>el</strong> maíz<br />
no a niv<strong>el</strong> <strong>de</strong> costos estimados pero utilizando los precios practicados en México, cerca <strong>de</strong> 173<br />
US$/t, resultaría un costo <strong>de</strong> etanol <strong>de</strong> 0.58 US$/litro, incrementandose en 32%.<br />
Analogamente, al asumir <strong>para</strong> la caña <strong>el</strong> precio KARBE <strong>de</strong> la reciente zafra, 33 US$/t, <strong>el</strong> costo<br />
<strong><strong>de</strong>l</strong> etanol <strong>de</strong> jugo directo pasaria a 0.59 US$/litro, incrementandose en 37%.<br />
Se pue<strong>de</strong> observar en la Figura 5.2 la estructura <strong>de</strong> costos agrupando los distintos<br />
componentes, siendo que <strong>para</strong> <strong>el</strong> caso <strong>de</strong> la caña mediante la mi<strong>el</strong> rica se tomó como costo la<br />
reducción <strong>de</strong> producción <strong>de</strong> azúcar, estimada en 20 kg por ton<strong>el</strong>ada <strong>de</strong> caña procesada,<br />
mientras <strong>para</strong> <strong>el</strong> maíz se restó los ingresos correspondientes a los granos <strong>de</strong> <strong>de</strong>stilería, cerca <strong>de</strong><br />
0.07 US$ por litro. El costo <strong><strong>de</strong>l</strong> etanol <strong>de</strong> maíz com<strong>para</strong>ble a los costos a partir <strong>de</strong> caña es<br />
consecuencia básicamente <strong>de</strong> un período <strong>de</strong> producción más largo <strong>para</strong> <strong>el</strong> grano (350 días),<br />
que permite reducir <strong>el</strong> costo <strong>de</strong> capital en <strong>el</strong> producto.<br />
100%<br />
80%<br />
60%<br />
otros<br />
40%<br />
energía<br />
inversiones<br />
20%<br />
materia prima<br />
0%<br />
-20%<br />
Cana mi<strong>el</strong><br />
pobre<br />
Cana mi<strong>el</strong><br />
rica<br />
Cana jugo<br />
directo<br />
Cana jugo<br />
+ hidrólisis<br />
Maíz via<br />
seca<br />
Sorgo Yuca Remolacha<br />
Figura 5.3. Estructura <strong>de</strong> costos <strong><strong>de</strong>l</strong> etanol <strong>para</strong> las materias primas y procesos consi<strong>de</strong>rados<br />
De una manera general y como se esperaba, la materia prima representa más <strong>de</strong> la mitad <strong>de</strong> los<br />
costos, con la excepción <strong><strong>de</strong>l</strong> proceso utilizando hidrólisis, aun en <strong>de</strong>sarrollo exactamente por<br />
su <strong>el</strong>evado costo y <strong>el</strong> caso <strong>de</strong> utilizarse mi<strong>el</strong> rica, cuando se suman a los costos la perdida <strong>de</strong><br />
ingresos producto <strong>de</strong> la reducción <strong>de</strong> producción <strong>de</strong> azúcar. Naturalmente que este costo es un<br />
costo <strong>de</strong> oportunidad, pero efectivamente <strong>de</strong>be ser consi<strong>de</strong>rado, valiendo <strong>para</strong> <strong>el</strong> caso en<br />
estudio cerca <strong>de</strong> 0.18 US$ por litro <strong>de</strong> etanol producido.<br />
55
<strong>Potenciales</strong> y <strong>Viabilidad</strong> <strong><strong>de</strong>l</strong> <strong>Uso</strong> <strong>de</strong> <strong>Bioetanol</strong> y <strong>Biodies<strong>el</strong></strong> <strong>para</strong> <strong>el</strong> Transporte en México (SENER-BID-GTZ)<br />
Task 5: Ethanol and ETBE production and end-use in Mexico<br />
6. Precios <strong>de</strong> indiferencia <strong>para</strong> <strong>el</strong> etanol en México<br />
Precios <strong>de</strong> paridad o <strong>de</strong> indiferencia <strong>para</strong> <strong>el</strong> etanol combustible pue<strong>de</strong>n ser <strong>de</strong>finidos <strong>de</strong><br />
acuerdo con <strong>el</strong> punto <strong>de</strong> vista que se consi<strong>de</strong>re. Para <strong>el</strong> productor <strong>de</strong> etanol, precios <strong>de</strong> paridad<br />
son los niv<strong>el</strong>es <strong>de</strong> precios <strong>para</strong> los cuales es indiferente producir etanol u otro producto a partir<br />
<strong>de</strong> la misma materia prima. Así, <strong>para</strong> <strong>el</strong> sector azucarero, cuya materia prima es la caña <strong>de</strong><br />
azúcar, <strong>el</strong> precio <strong>de</strong> paridad seria como un precio <strong>de</strong> oportunidad o precio <strong>de</strong> indiferencia a<br />
partir <strong>de</strong> lo cual es más motivador producir <strong>el</strong> biocombustible, <strong>el</strong> cual es <strong>de</strong>terminado<br />
basándose en <strong>el</strong> contenido equivalente <strong>de</strong> azúcares <strong><strong>de</strong>l</strong> etanol y adoptando eficiencias <strong>para</strong> los<br />
procesos industriales específicos <strong>de</strong> este producto. La Figura 6.1 sintetiza <strong>el</strong> concepto <strong>de</strong> los<br />
precios <strong>de</strong> paridad <strong><strong>de</strong>l</strong> etanol (PIEA), que <strong>de</strong>ben ser com<strong>para</strong>dos con los precios <strong>de</strong> venta <strong><strong>de</strong>l</strong><br />
producto <strong>para</strong> verificar se existen condiciones por lo menos tan interesantes que los <strong>de</strong>más<br />
productos azucareros.<br />
Interés en producir<br />
azúcar<br />
Interés en producir<br />
etanol<br />
PIEA<br />
precio <strong><strong>de</strong>l</strong> etanol<br />
Figura 6.1. Competitividad <strong>de</strong> la producción <strong>de</strong> etanol<br />
Para <strong>el</strong> consumidor, precios <strong>de</strong> paridad son los precios que hacen los costos operacionales<br />
iguales, utilizando o no etanol. Como se trata <strong>de</strong> discutir la factibilidad <strong>de</strong> la producción local<br />
<strong>de</strong> etanol <strong>para</strong> su inserción sostenible en la matriz energética mexicana, sin consi<strong>de</strong>rar la<br />
posibilidad <strong>de</strong> importar o exportar etanol combustible, son com<strong>para</strong>tivamente más<br />
fundamentales las cuestiones referentes al productor. Para los consumidores, en la eventual<br />
adopción compulsoria <strong>de</strong> una mezcla etanol-gasolina (gasohol), la cuestión <strong>de</strong> precios<br />
(gasohol/gasolina) tendría r<strong>el</strong>evancia esencialmente <strong>para</strong> lograr <strong>el</strong> <strong>de</strong>seable soporte político y<br />
social <strong>para</strong> <strong>el</strong> nuevo combustible. Efectivamente es muy importante que los consumidores<br />
sean informados sobre este nuevo combustible y no se sientan perjudicados por su adopción.<br />
Más difícil es conceptualizar y <strong>de</strong>terminar los precios <strong>de</strong> indiferencia <strong><strong>de</strong>l</strong> etanol <strong>para</strong> la<br />
industria petrolera, <strong>para</strong> quien la inserción <strong>de</strong> ese biocombustible como componente<br />
obligatorio parecería significar siempre una pérdida <strong>de</strong> volúmenes comercializados y<br />
márgenes <strong>de</strong> realización financiera. No obstante, es necesario profundizar esa percepción y<br />
<strong>de</strong>terminar los reales impactos, bastante diferentes según sea <strong>el</strong> contexto. Particularmente en <strong>el</strong><br />
caso <strong>de</strong> México, adon<strong>de</strong> a<strong>de</strong>más <strong>de</strong> importarse gasolina, se utiliza una significativa cantidad<br />
<strong>de</strong> MTBE importado, la utilización <strong>de</strong> etanol nacional podrá traer ventajas interesantes,<br />
reduciendo <strong>el</strong> costo final <strong>de</strong> la gasolina y ampliando la <strong>de</strong>manda <strong>de</strong> corrientes <strong>de</strong> menor valor,<br />
siempre que se reconozca <strong>el</strong> valor anti<strong>de</strong>tonante <strong><strong>de</strong>l</strong> etanol y su precio por unidad oxigenante<br />
sea competitivo.<br />
56
<strong>Potenciales</strong> y <strong>Viabilidad</strong> <strong><strong>de</strong>l</strong> <strong>Uso</strong> <strong>de</strong> <strong>Bioetanol</strong> y <strong>Biodies<strong>el</strong></strong> <strong>para</strong> <strong>el</strong> Transporte en México (SENER-BID-GTZ)<br />
Task 5: Ethanol and ETBE production and end-use in Mexico<br />
6.1. Precios <strong>de</strong> paridad <strong>para</strong> productores <strong>de</strong> etanol<br />
La discusión <strong>de</strong> los precios <strong>de</strong> paridad tiene sentido solamente cuando hay una posibilidad<br />
concreta <strong>de</strong> utilizar la misma materia prima <strong>para</strong> productos diferentes, preciados <strong>de</strong> forma<br />
in<strong>de</strong>pendiente. Esa situación ocurre particularmente <strong>para</strong> la caña, típicamente emp<strong>el</strong>ada <strong>para</strong><br />
fabricar azúcar y que pue<strong>de</strong> ser utilizada <strong>para</strong> producir etanol. Para las otras materias primas,<br />
a<strong>de</strong>más <strong>de</strong> no existir procesos integrados, <strong>el</strong> costo <strong><strong>de</strong>l</strong> insumo se efectuó en condiciones<br />
representativas, no habiendo así una paridad particular por explorar.<br />
En la producción <strong>de</strong> etanol <strong>de</strong> caña <strong>de</strong> azúcar los precios <strong>de</strong> paridad <strong>de</strong>ben ser <strong>de</strong>terminados en<br />
función <strong>de</strong> los precios <strong><strong>de</strong>l</strong> azúcar y <strong>de</strong> las m<strong>el</strong>azas, que representan los productos alternativos<br />
principales <strong>para</strong> esa materia prima. Tales precios son estimados sin tomar en cuenta las<br />
inversiones en sistemas <strong>de</strong> producción, pues representan directamente precios <strong>de</strong> oportunidad<br />
<strong>para</strong> productos alternativos utilizando una misma materia prima. Se adoptó <strong>para</strong> <strong>el</strong> azúcar 96<br />
grados <strong>de</strong> polarización y no se consi<strong>de</strong>raran las pequeñas influencias <strong>de</strong> los distintos<br />
contenidos <strong>de</strong> sacarosa <strong>para</strong> los diferentes tipos <strong>de</strong> azúcar. Así, a partir <strong>de</strong> la ecuación <strong>de</strong> Gay-<br />
Lussac <strong>para</strong> la fermentación <strong>de</strong> azucares a etanol, que resume las expresiones presentadas<br />
anteriormente en <strong>el</strong> apartado 4.1. Procesos utilizando caña <strong>de</strong> azúcar,<br />
C 4<br />
12H22O11<br />
+ H2O<br />
→ 4 C2H6O<br />
+ CO2<br />
sacarosa<br />
etanol<br />
(1)<br />
se observa que en condiciones representativas, un litro <strong>de</strong> etanol requiere 1.67 kilogramos <strong>de</strong><br />
sacarosa <strong>para</strong> ser producido, permitiendo establecer la expresión <strong>para</strong> Precio <strong>de</strong> Indiferencia<br />
<strong><strong>de</strong>l</strong> Etanol Anhidro, PIEA, como función <strong><strong>de</strong>l</strong> precio <strong><strong>de</strong>l</strong> azúcar, PAzu.<br />
PIEA ($/litro) = 1.67 * PAzu ($/kg) (2)<br />
Para las condiciones <strong>de</strong> México, conforme se comentó anteriormente, la producción <strong>de</strong> etanol<br />
podría darse principalmente en complementación a las activida<strong>de</strong>s azucareras, en la extensión<br />
posible expandiendo los cultivos y añadiendo <strong>de</strong>stilerías a las plantas existentes, siempre que<br />
en un marco <strong>de</strong> eficiencia económica. De hecho, las m<strong>el</strong>azas son subproductos siempre<br />
presentes en la fabricación <strong>de</strong> azúcar y bajo condiciones a<strong>de</strong>cuadas <strong>de</strong> precios, pue<strong>de</strong>n ser<br />
materias primas importantes <strong>para</strong> la producción <strong>de</strong> etanol. En ese caso la producción <strong>de</strong> etanol<br />
no implica necesariamente en incrementar <strong>el</strong> área sembrada en caña y consi<strong>de</strong>rando la<br />
conversión <strong>de</strong> una m<strong>el</strong>aza con un contenido <strong>de</strong> azucares (ART) <strong>de</strong> 56%, la expresión (2)<br />
anterior pue<strong>de</strong> ser adaptada <strong>para</strong> <strong>de</strong>terminar <strong>el</strong> Precio <strong>de</strong> Indiferencia <strong><strong>de</strong>l</strong> Etanol Anhidro,<br />
<strong>de</strong>finiéndose PM<strong>el</strong> como precio <strong>de</strong> la m<strong>el</strong>aza:<br />
PIEA ($/litro) = 2.98 * PM<strong>el</strong> ($/kg) (3)<br />
Por lo tanto, los precios <strong>de</strong> indiferencia esencialmente son precios <strong>de</strong> oportunidad <strong>de</strong> la<br />
materia prima sacarosa, expresados en términos <strong>de</strong> etanol. Como existen diferentes productos<br />
azucareros, es oportuno observar la existencia <strong>de</strong> distintos niv<strong>el</strong>es <strong>de</strong> precios, correspondientes<br />
progresivamente a utilizar las m<strong>el</strong>azas agotadas y competir con los mercados <strong>de</strong> productos<br />
azucareros, <strong>de</strong> exce<strong>de</strong>ntes en los mercados libres y <strong>de</strong> cuotas en <strong>el</strong> mercado americano. Para <strong>el</strong><br />
contexto mexicano los productos azucareros son comercializados a precios que difieren <strong>de</strong><br />
57
<strong>Potenciales</strong> y <strong>Viabilidad</strong> <strong><strong>de</strong>l</strong> <strong>Uso</strong> <strong>de</strong> <strong>Bioetanol</strong> y <strong>Biodies<strong>el</strong></strong> <strong>para</strong> <strong>el</strong> Transporte en México (SENER-BID-GTZ)<br />
Task 5: Ethanol and ETBE production and end-use in Mexico<br />
manera sensible según los mercados consi<strong>de</strong>rados, <strong>de</strong>biendo ser evaluados por lo menos <strong>para</strong><br />
dos casos: <strong>el</strong> azúcar <strong>de</strong> consumo interno y <strong>el</strong> azúcar exportado, que pue<strong>de</strong> presentarse en dos<br />
situaciones:<br />
a) contratos preferentes con Estados Unidos, <strong>de</strong>ntro <strong>de</strong> las cuotas establecidas por <strong>el</strong><br />
Departamento <strong>de</strong> Agricultura americano, con precios <strong>de</strong>terminados por los Contratos<br />
No. 14 <strong>de</strong> la Junta <strong>de</strong> Comercio <strong>de</strong> Nueva York (New York Board of Tra<strong>de</strong> -<br />
NYBoT) y con Europa,<br />
b) contratos libres o <strong>de</strong> exce<strong>de</strong>ntes, que pue<strong>de</strong>n seguir los precios <strong>de</strong> los Contratos<br />
No. 5 <strong>de</strong> la Bolsa <strong>de</strong> Londres o los Contratos No. 11 <strong><strong>de</strong>l</strong> NYBoT.<br />
Como se observa en la Figura 5.2, en los últimos años <strong>el</strong> azúcar ha sido comercializado en <strong>el</strong><br />
mercado <strong>de</strong> exce<strong>de</strong>ntes a precios FOB variando entre 0.13 a 0.40 US$/kg, señalando <strong>para</strong> <strong>el</strong><br />
etanol un valor <strong>de</strong> indiferencia entre 0.22 a 0.67 US$/litro. Ya <strong>para</strong> los contratos preferentes<br />
los precios son practicados a niv<strong>el</strong>es más <strong>el</strong>evados, entre 0.37 a 0.56 US$/kg, resultando un<br />
valor <strong>de</strong> indiferencia <strong>para</strong> <strong>el</strong> etanol entre 0.62 a 0.93 US$/litro. Naturalmente que <strong>el</strong> análisis <strong>de</strong><br />
los precios <strong>de</strong> paridad impone asumir los precios <strong>de</strong> exportación en base FOB, con los<br />
<strong>de</strong>scuentos y costos asociados a logística <strong><strong>de</strong>l</strong> producto.<br />
60<br />
US cents/kg<br />
50<br />
40<br />
30<br />
Contrato 14<br />
Contrato 11<br />
20<br />
10<br />
0<br />
fev-02 out-02 jun-03 mar-04 nov-04 jul-05 mar-06<br />
Figura 6.2. Precios <strong>de</strong> cierre en <strong>el</strong> primero día <strong><strong>de</strong>l</strong> mes <strong>para</strong> los Contratos <strong>de</strong> Azúcar <strong>de</strong> la<br />
Bolsa <strong>de</strong> Nueva York (NYBOT, 2006)<br />
Las condiciones <strong>de</strong> exportación preferenciales no representan un volumen muy significativo,<br />
que a<strong>de</strong>más tien<strong>de</strong> a reducirse, como también parecen disminuir en los últimos años <strong>el</strong><br />
diferencial <strong>de</strong> precios observados entre los mercados preferentes y libres. Por otro lado, no<br />
obstante la producción azucarera mexicana, alre<strong>de</strong>dor <strong>de</strong> 5.6 millones <strong>de</strong> ton<strong>el</strong>adas, sea<br />
aproximadamente <strong>de</strong> la misma magnitud <strong><strong>de</strong>l</strong> mercado interno, la cuota mexicana <strong>para</strong><br />
exportación a precios preferentes y sin aranc<strong>el</strong>es, <strong>para</strong> Estados Unidos sería <strong>de</strong> hasta 350 miles<br />
<strong>de</strong> ton<strong>el</strong>adas (siendo efectivamente ejercidas 100 miles <strong>de</strong> ton<strong>el</strong>adas) y <strong>para</strong> la Comunidad<br />
Europea, 250 miles <strong>de</strong> ton<strong>el</strong>adas, esa última ampliada en función <strong>de</strong> acci<strong>de</strong>ntes climáticos en<br />
58
<strong>Potenciales</strong> y <strong>Viabilidad</strong> <strong><strong>de</strong>l</strong> <strong>Uso</strong> <strong>de</strong> <strong>Bioetanol</strong> y <strong>Biodies<strong>el</strong></strong> <strong>para</strong> <strong>el</strong> Transporte en México (SENER-BID-GTZ)<br />
Task 5: Ethanol and ETBE production and end-use in Mexico<br />
otros países exportadores <strong>de</strong> la región (Presi<strong>de</strong>ncia <strong>de</strong> la República, 2005). Las complejas<br />
negociaciones <strong>de</strong> precios y cuotas <strong>de</strong> azúcar en <strong>el</strong> marco <strong><strong>de</strong>l</strong> TLCAN, establecerían que en<br />
principio, <strong>el</strong> mercado americano, con sus altos precios internos, <strong>de</strong>berá abrirse <strong>para</strong> los<br />
productores mexicanos a partir <strong>de</strong> 2008, afectando directamente estos valores, pero tales<br />
negociaciones no parecen cabalmente <strong>de</strong>finidas.<br />
Consi<strong>de</strong>rando los precios <strong>de</strong> la m<strong>el</strong>aza (m<strong>el</strong>aza pobre o mi<strong>el</strong> C), vistos en capítulo anterior, y<br />
la expresión <strong>de</strong> paridad, los precios <strong>de</strong> paridad <strong><strong>de</strong>l</strong> etanol <strong>para</strong> <strong>el</strong> productor <strong>de</strong> m<strong>el</strong>aza estarían<br />
entre 0.283 a 0.298 US$/litro. En síntesis y en la configuración presente <strong>de</strong> precios, <strong>para</strong> los<br />
productores <strong>de</strong> la agroindustria cañera, los precios <strong>de</strong> paridad <strong><strong>de</strong>l</strong> etanol frente al azúcar son<br />
significativamente más <strong>el</strong>evados que consi<strong>de</strong>rando <strong>el</strong> uso <strong>de</strong> m<strong>el</strong>azas.<br />
6.2. Costos <strong>de</strong> paridad frente a gasolina y al MTBE<br />
Las características <strong><strong>de</strong>l</strong> etanol como combustible, <strong>para</strong> su utilización en motores <strong>de</strong> ciclo Otto<br />
puro o en mezclas con gasolina, permiten <strong>de</strong>terminar los precios <strong>de</strong> paridad <strong>para</strong> ese<br />
biocombustible frente a los <strong>de</strong>rivados <strong>de</strong> petróleo. Al com<strong>para</strong>rse <strong>el</strong> po<strong>de</strong>r calorífico<br />
volumétrico <strong><strong>de</strong>l</strong> etanol (21,146 kJ/litro) con <strong>el</strong> correspondiente <strong>para</strong> la gasolina (32,250<br />
kJ/litro), se observa que una unidad <strong>de</strong> volumen <strong>de</strong> etanol presenta 65% <strong><strong>de</strong>l</strong> contenido<br />
energético <strong>de</strong> la gasolina y en tales condiciones, <strong>para</strong> igualdad <strong>de</strong> costos energéticos, <strong>el</strong> etanol<br />
<strong>de</strong>bería costar 35% menos que la gasolina. Consi<strong>de</strong>rando solamente este aspecto, una mezcla<br />
<strong>de</strong> 10% <strong>de</strong> etanol en la gasolina llevaría a un incremento <strong>de</strong> consumo <strong>de</strong> aproximadamente<br />
3.5%, en com<strong>para</strong>ción al consumo con gasolina pura. Sin embargo, hay otras importantes<br />
diferencias entre estos combustibles, que <strong>de</strong>ben ser evaluados en términos <strong>de</strong> energía neta<br />
efectivamente disponibilizada por <strong>el</strong> motor <strong>de</strong> combustión cuando emplea cada uno <strong>de</strong> los<br />
combustibles.<br />
El etanol presenta una <strong>el</strong>evada r<strong>el</strong>ación hidrógeno/carbón en su composición, una r<strong>el</strong>ación<br />
estequiométrica aire/combustible significativamente menor que la gasolina (9 contra 14,5) y<br />
consecuentemente produce un volumen más gran<strong>de</strong> <strong>de</strong> gases por unidad energética. Por eso, la<br />
presión media en los cilindros se incrementa, permitiendo un torque superior, la realización <strong>de</strong><br />
más trabajo por ciclo <strong><strong>de</strong>l</strong> pistón y una eficiencia algo más <strong>el</strong>evada. A<strong>de</strong>más, <strong>el</strong> calor <strong>de</strong><br />
vaporización <strong><strong>de</strong>l</strong> etanol es 2,3 veces más alto que <strong>para</strong> la gasolina, enfriando r<strong>el</strong>ativamente<br />
más la mezcla aire/combustible admitida al cilindro, incrementando su <strong>de</strong>nsidad y reforzando<br />
<strong>el</strong> efecto anterior. De esa manera, las mezclas etanol/gasolina con hasta 10% <strong>de</strong> etanol<br />
promueven un incremento <strong>de</strong> eficiencia <strong>de</strong> 1 a 2% en los motores, que producen más trabajo<br />
por unidad <strong>de</strong> energía <strong><strong>de</strong>l</strong> combustible (Prakash, 1998).<br />
Los efectos comentados en <strong>el</strong> análisis anterior son más o menos potencializados por <strong>el</strong> diseño<br />
<strong><strong>de</strong>l</strong> motor y condiciones <strong>de</strong> utilización, pero muchas pruebas conducidas en diversas<br />
condiciones confirman que la mezcla <strong>de</strong> gasolina etanol casi no afecta <strong>el</strong> consumo y <strong>el</strong><br />
<strong>de</strong>sempeño <strong>de</strong> los vehículos. Es posible prever que los motores más mo<strong>de</strong>rnos, con inyección<br />
<strong>el</strong>ectrónica <strong>de</strong> combustible se comporten mejor con la mezcla gasolina/etanol <strong>de</strong>bido a los<br />
sistemas automáticos <strong>para</strong> controlar la cantidad <strong>de</strong> aire aspirado, sin embargo también en los<br />
motores más antiguos con carburadores se pue<strong>de</strong> esperar un efecto positivo, asociado a<br />
operación con una mezcla ligeramente más pobre. Des<strong>de</strong> 2003 son comercializados en Brasil<br />
vehículos “flex-fu<strong>el</strong>”, capaces <strong>de</strong> utilizar mezclas <strong>de</strong> gasolina e etanol, variando entre 25% (<strong>el</strong><br />
59
<strong>Potenciales</strong> y <strong>Viabilidad</strong> <strong><strong>de</strong>l</strong> <strong>Uso</strong> <strong>de</strong> <strong>Bioetanol</strong> y <strong>Biodies<strong>el</strong></strong> <strong>para</strong> <strong>el</strong> Transporte en México (SENER-BID-GTZ)<br />
Task 5: Ethanol and ETBE production and end-use in Mexico<br />
gasohol en Brasil) y 100% <strong>de</strong> etanol, <strong>de</strong>biendo <strong>el</strong> sistema <strong>de</strong> combustión ser optimizado <strong>para</strong><br />
una proporción entre <strong>el</strong> biocombustible y la gasolina.<br />
Evaluaciones recientes, realizadas por las empresas petroleras ECOPETROL <strong>de</strong> Colombia<br />
(Ximena, 2004) e RECOPE <strong>de</strong> Costa Rica (MINAE, 2005), buscando fundamentar la<br />
adopción <strong>de</strong> mezclas gasolina y etanol en sus países, llevó a los resultados r<strong>el</strong>evantes,<br />
indicando como generalmente positivo <strong>el</strong> efecto sobre la potencia y marginal <strong>el</strong> impacto sobre<br />
<strong>el</strong> consumo, <strong>de</strong>bido a presencia <strong>de</strong> bajos contenidos <strong>de</strong> etanol en la gasolina. Resultados <strong>de</strong><br />
pruebas piloto <strong>de</strong>mostraran que en general la mezcla con etanol mejoró <strong>el</strong> consumo <strong>de</strong><br />
combustible por kilómetro transitado. Diferentes estilos <strong>de</strong> conducir los vehículos y la<br />
diversidad <strong>de</strong> regímenes <strong>de</strong> utilización (ruta, ciudad, etc.) causan variaciones <strong>de</strong> consumo<br />
superiores a 5%, más significativas que <strong>el</strong> efecto <strong>de</strong> la adición <strong>de</strong> etanol en la gasolina.<br />
Sumándose todos los efectos, resulta que por la adicción <strong>de</strong> etanol, se obtiene un combustible<br />
más pobre energéticamente pero <strong>de</strong> calidad <strong>para</strong> conversión térmica más alta que la gasolina,<br />
prácticamente no influyendo en <strong>el</strong> consumo <strong>de</strong> los motores. Luego, un litro <strong>de</strong> etanol presenta<br />
un valor <strong>de</strong> uso igual al <strong>de</strong> un litro <strong>de</strong> gasolina. Por eso, aunque los precios puedan ser<br />
afectados <strong>de</strong> modo diferenciado por los impuestos, siempre se podrá efectuar una com<strong>para</strong>ción<br />
entre los precios <strong>de</strong> la gasolina y <strong>el</strong> gasohol <strong>de</strong> forma directa, en base volumétrica. En este<br />
sentido, sin consi<strong>de</strong>rar los impuestos y tasas, <strong>para</strong> una distribuidora que <strong>de</strong>bería mezclar <strong>el</strong><br />
etanol a gasolina, <strong>el</strong> valor <strong>de</strong> paridad <strong><strong>de</strong>l</strong> etanol <strong>de</strong>be ser igual al <strong>de</strong> la propia gasolina por que<br />
<strong>el</strong> producto presenta igual capacidad <strong>de</strong> producir trabajo. Para los consumidores vale un<br />
raciocinio análogo: <strong>el</strong> etanol en <strong>el</strong> gasohol vale como la gasolina pura, resulta <strong>el</strong> mismo efecto.<br />
En otras palabras y como una conclusión muy importante: in<strong>de</strong>pendientemente <strong><strong>de</strong>l</strong> po<strong>de</strong>r<br />
calorífico, <strong>el</strong> litro <strong>de</strong> etanol anhidro vale, en términos <strong>de</strong> energía útil, lo mismo que un litro <strong>de</strong><br />
gasolina, cuando en mezclas hasta 10% en <strong>el</strong> <strong>de</strong>rivado <strong>de</strong> petróleo.<br />
De esa manera, un precio <strong>de</strong> paridad <strong><strong>de</strong>l</strong> etanol es <strong>el</strong> propio precio <strong>de</strong> la gasolina, valor que ha<br />
cambiado <strong>de</strong> modo importante en los últimos años, siempre respondiendo a las variaciones <strong><strong>de</strong>l</strong><br />
precio <strong><strong>de</strong>l</strong> petróleo. En México, consi<strong>de</strong>rando <strong>el</strong> monopolio estatal <strong>de</strong> la industria petrolera, <strong>el</strong><br />
Estado <strong>de</strong>fine los precios <strong>de</strong> los combustibles <strong>de</strong> acuerdo a una fórmula, <strong>de</strong> responsabilidad <strong>de</strong><br />
la Secretaria <strong>de</strong> Hacienda y Crédito Público, pagándose al productor (PEMEX) un precio<br />
referenciado al precio spot <strong><strong>de</strong>l</strong> producto en la refinerías americanas <strong>de</strong> Houston, ajustado por<br />
factores <strong>de</strong> calidad y logística, como presión <strong>de</strong> vapor, flete y manejo <strong><strong>de</strong>l</strong> producto. Esos<br />
factores incrementan <strong>el</strong> precio <strong><strong>de</strong>l</strong> producto en aproximadamente 7%, <strong>para</strong> <strong>el</strong> caso <strong>de</strong> la<br />
gasolina Magma, sin impuestos. Para esa gasolina, la especificación <strong>de</strong> referencia adoptada es<br />
la gasolina sin plomo, UNL-87 RON Costa Norteamericana <strong><strong>de</strong>l</strong> Golfo <strong>de</strong> México (Rodríguez,<br />
2006). Finalmente, a ese precio se agregan los impuestos y márgenes, que prácticamente<br />
doblan <strong>el</strong> precio final <strong><strong>de</strong>l</strong> producto <strong>para</strong> <strong>el</strong> consumidor (PEMEX, 2004). Mecanismos<br />
semejantes <strong>de</strong> formación <strong>de</strong> precios <strong>de</strong> combustibles son usuales en muchos países.<br />
60
<strong>Potenciales</strong> y <strong>Viabilidad</strong> <strong><strong>de</strong>l</strong> <strong>Uso</strong> <strong>de</strong> <strong>Bioetanol</strong> y <strong>Biodies<strong>el</strong></strong> <strong>para</strong> <strong>el</strong> Transporte en México (SENER-BID-GTZ)<br />
Task 5: Ethanol and ETBE production and end-use in Mexico<br />
120<br />
100<br />
80<br />
US$/barril<br />
Petróleo WTI<br />
UNL-97 CG<br />
Gasolina Magma consumidor<br />
60<br />
40<br />
20<br />
0<br />
1986 1991 1996 2001 2006<br />
Figura 6.3. Evolución <strong><strong>de</strong>l</strong> precio <strong><strong>de</strong>l</strong> petróleo (WTI) y <strong>de</strong> la gasolina spot (sin impuestos) en<br />
Costa <strong><strong>de</strong>l</strong> Golfo (CG) y Los Ang<strong>el</strong>es (LA)<br />
En la Figura 6.3 se presenta la evolución <strong>de</strong> los precios medios anuales <strong><strong>de</strong>l</strong> petróleo crudo<br />
(WTI) y <strong><strong>de</strong>l</strong> precio spot <strong>de</strong> la gasolina UNL-87 en Costa <strong>de</strong> Golfo (CG) (EIA/DOE, 2006),<br />
ambos precios naturalmente sin tributos y <strong>de</strong> los precios <strong>de</strong> la gasolina Magma <strong>para</strong><br />
consumidores, permitiendo observar como efectivamente en los últimos años esos<br />
combustibles incrementaran sus precios <strong>de</strong> modo significativo y <strong>de</strong> un modo general, los<br />
precios <strong>de</strong> la gasolina mexicana mantuvieran alguna r<strong>el</strong>ación con los precios en <strong>el</strong> mercado<br />
americano, constatándose un acercamiento en los últimos años. Los valores <strong>para</strong> 2006 son un<br />
promedio <strong>para</strong> los cinco primeros meses <strong>de</strong> ese año.<br />
A partir <strong>de</strong> esos valores y consi<strong>de</strong>rando como referencia los valores <strong>para</strong> Costa <strong><strong>de</strong>l</strong> Golfo,<br />
efectivamente empleados en la fórmula <strong>de</strong> precios <strong>de</strong> la gasolina, los precios <strong>de</strong> paridad <strong><strong>de</strong>l</strong><br />
etanol en México, <strong><strong>de</strong>l</strong> punto <strong>de</strong> vista <strong><strong>de</strong>l</strong> consumidor, son crecientes, pasando <strong>de</strong> 0.332<br />
US$/litro en 2004 a 0.449 US$/litro en 2005 y 0.523 US$/litro en los primeros meses <strong>de</strong> 2006,<br />
ya agregando los costos adicionales <strong>de</strong> importación y consi<strong>de</strong>rando los ajustes <strong>de</strong> calidad,<br />
tomados como 7%. De esa manera, <strong>el</strong> precio <strong>de</strong> paridad <strong>de</strong> la gasolina <strong>para</strong> <strong>el</strong> mercado<br />
consumidor y <strong>para</strong> los distribuidores <strong>de</strong> gasolina estaría, a valores <strong>de</strong> 2005, alre<strong>de</strong>dor <strong>de</strong> 0,45<br />
US$/litro, o sea, hasta ese niv<strong>el</strong> <strong>de</strong> precio se justifica pagar por <strong>el</strong> etanol, comparándose su<br />
valor <strong>de</strong> uso con la gasolina a los precios mexicanos.<br />
Por supuesto que hay una marcada volatilidad en los precios <strong><strong>de</strong>l</strong> petróleo, con algunos<br />
analistas esperando una reducción y estabilización en los próximos meses. Realmente es difícil<br />
pre<strong>de</strong>cir <strong>el</strong> comportamiento <strong>de</strong> una commodity tan importante, en cuyo precio intervienen<br />
tantos factores, pero aparentemente las posibilida<strong>de</strong>s <strong>de</strong> que este precio se mantenga en niv<strong>el</strong>es<br />
<strong>el</strong>evados es más fuerte, lo que significa que los precios <strong>de</strong> soporte <strong>para</strong> <strong>el</strong> etanol tien<strong>de</strong>n a<br />
mantenerse <strong>el</strong>evados. No obstante algunos estudios <strong>de</strong> la PEMEX señalando sistemáticamente<br />
una reducción en los precios internacionales <strong>de</strong> los combustibles, no parece haber<br />
61
<strong>Potenciales</strong> y <strong>Viabilidad</strong> <strong><strong>de</strong>l</strong> <strong>Uso</strong> <strong>de</strong> <strong>Bioetanol</strong> y <strong>Biodies<strong>el</strong></strong> <strong>para</strong> <strong>el</strong> Transporte en México (SENER-BID-GTZ)<br />
Task 5: Ethanol and ETBE production and end-use in Mexico<br />
fundamentos fuertes <strong>para</strong> esos escenarios optimistas <strong>de</strong> precios <strong>para</strong> los <strong>de</strong>rivados <strong>de</strong> petróleo<br />
en <strong>el</strong> mediano y largo plazo.<br />
La Secretaria <strong>de</strong> Energía <strong><strong>de</strong>l</strong> gobierno americano presentó en <strong>el</strong> comienzo <strong>de</strong> 2006 una<br />
previsión <strong>de</strong> los precios futuros <strong><strong>de</strong>l</strong> petróleo y <strong>de</strong> los <strong>de</strong>rivados, hasta 2030 (DOE, 2006),<br />
sintetizada en la Figura 6.4, indicando que los precios <strong>de</strong> largo plazo <strong><strong>de</strong>l</strong> barril <strong>de</strong> petróleo<br />
<strong>de</strong>berán ubicar-se en niv<strong>el</strong>es superiores a 50 US$/barril. Por su parte, la Agencia Internacional<br />
<strong>de</strong> Energía, revisó sus proyecciones <strong>de</strong> precio <strong><strong>de</strong>l</strong> WTI <strong>para</strong> 2010, pasando <strong>de</strong> 33 US$/barril<br />
<strong>para</strong> 45 US$/barril (Morgan, 2005).<br />
70<br />
US$ (2004)/<br />
barr<strong>el</strong><br />
60<br />
50<br />
40<br />
30<br />
20<br />
10<br />
0<br />
Imported Low Sulfur Light Cru<strong>de</strong> Oil Price<br />
Imported Cru<strong>de</strong> Oil Price<br />
2003 2008 2013 2018 2023 2028<br />
Figura 6.4. Proyecciones <strong>de</strong> precios <strong><strong>de</strong>l</strong> petróleo <strong>de</strong> la EIA/DOE, Febrero <strong>de</strong> 2006<br />
Una manera alternativa y bastante razonable <strong>para</strong> evaluar los precios <strong>de</strong> paridad <strong><strong>de</strong>l</strong> etanol es<br />
consi<strong>de</strong>rando como referencia <strong>el</strong> producto que <strong>el</strong> biocombustible busca sustituir, por lo general<br />
<strong>el</strong> MTBE. En este sentido, cabe notar que los oxigenantes son utilizados en diferentes<br />
contenidos <strong>para</strong> mejorar las características <strong>de</strong> la gasolina, principalmente <strong>el</strong> octanaje y reducir<br />
las emisiones, usualmente <strong>de</strong>finiendo un contenido mínimo <strong>de</strong> oxígeno en la mezcla <strong>de</strong><br />
acuerdo con pautas ambientales. Típicamente se mezcla una cantidad <strong>de</strong> MTBE suficiente <strong>para</strong><br />
asegurar un contenido mínimo <strong>de</strong> oxígeno, que <strong>de</strong>berá ser medido y reportado según la Norma<br />
ASTM D-4185.<br />
Naturalmente que vale <strong>para</strong> <strong>el</strong> MTBE la misma lógica que se utiliza <strong>para</strong> formar <strong>el</strong> precio <strong>de</strong> la<br />
gasolina y <strong>de</strong> los <strong>de</strong>más productos petroleros, o sea, buscar la paridad <strong>de</strong> precios con otros<br />
mercados abiertos. Según datos <strong>de</strong> PEMEX, en promedio <strong>el</strong> precio <strong><strong>de</strong>l</strong> MTBE importado en<br />
2005 fue 87.15 US$/barril, esperándose <strong>para</strong> 2006 un precio cercano a 75 US$/barril. Para<br />
esos niv<strong>el</strong>es, <strong>el</strong> etanol valdría entre 0.472 a 0.548 US$/litro, valores próximos al precio sin<br />
impuestos <strong>de</strong> la gasolina expuesto anteriormente.<br />
Una forma alternativa y conceptualmente correcta <strong>para</strong> se evaluar <strong>el</strong> precio <strong>de</strong> paridad <strong><strong>de</strong>l</strong><br />
MTBE frente al etanol seria con base en su contenido <strong>de</strong> oxigeno. Bajo ese concepto, como <strong>el</strong><br />
62
<strong>Potenciales</strong> y <strong>Viabilidad</strong> <strong><strong>de</strong>l</strong> <strong>Uso</strong> <strong>de</strong> <strong>Bioetanol</strong> y <strong>Biodies<strong>el</strong></strong> <strong>para</strong> <strong>el</strong> Transporte en México (SENER-BID-GTZ)<br />
Task 5: Ethanol and ETBE production and end-use in Mexico<br />
etanol contiene 1.93 veces más oxígeno que <strong>el</strong> MTBE, su valor frente a ese éter es<br />
efectivamente 1.93 veces mayor, correspondiendo a un rango entre 0.911 a 1.058 US$/litro.<br />
De ese modo, los productores <strong>de</strong> combustible que <strong>para</strong> cumplir con las especificaciones <strong>de</strong> las<br />
gasolinas <strong>de</strong>ben agregar componentes oxigenados, estarían en principio dispuestos a pagar por<br />
<strong>el</strong> etanol casi <strong>el</strong> doble <strong><strong>de</strong>l</strong> valor que pagan por la gasolina.<br />
A partir <strong>de</strong> los rangos <strong>de</strong> precios <strong>de</strong> paridad <strong>de</strong>terminados anteriormente <strong>para</strong> <strong>el</strong> etanol frente a<br />
otros productos azucareros y a los combustibles que pue<strong>de</strong> <strong>de</strong>splazar, consi<strong>de</strong>rando los valores<br />
<strong>para</strong> 2005 y comienzo <strong>de</strong> 2006, es posible pre<strong>para</strong>r la Figura 6.5, indicando la existencia <strong>de</strong> un<br />
margen favorable <strong>para</strong> introducción <strong><strong>de</strong>l</strong> etanol <strong>de</strong> caña, en la medida que hay una brecha entre<br />
los precios <strong>de</strong> indiferencia <strong>para</strong> productores y distribuidores <strong>de</strong> combustible. Este espacio<br />
entre los precios es más evi<strong>de</strong>nte entre <strong>el</strong> etanol producido a partir <strong>de</strong> m<strong>el</strong>azas, <strong>de</strong>pen<strong>de</strong> <strong>de</strong> la<br />
coyuntura <strong>de</strong> precios <strong>para</strong> <strong>el</strong> etanol sustituyendo azúcar producido a precios <strong>de</strong> mercado<br />
abierto y ciertamente no existe <strong>para</strong> <strong>el</strong> etanol remplazando azúcar vendido a precios <strong>de</strong> los<br />
mercados preferentes.<br />
1.00<br />
0.90<br />
0.80<br />
0.70<br />
0.60<br />
0.50<br />
0.40<br />
0.30<br />
0.20<br />
0.10<br />
0.00<br />
US$/litro<br />
m<strong>el</strong>aza<br />
azúcar<br />
mercados<br />
abiertos<br />
Productos azucareros<br />
azúcar<br />
mercados<br />
preferentes<br />
gasolina<br />
MTBE<br />
Combustibles<br />
Figura 6.5. Precios <strong>de</strong> paridad <strong>para</strong> <strong>el</strong> etanol <strong>de</strong> caña frente a otros productos azucareros y<br />
combustibles pasibles <strong>de</strong> sustitución.<br />
De toda manera, la figura indica que hay un margen <strong>de</strong> negociación entre productores y<br />
compradores, sin necesidad <strong>de</strong> subsidio directo. Estos comentarios son válidos <strong>para</strong> <strong>el</strong> etanol<br />
<strong>de</strong> caña, <strong>para</strong> otras materias primas <strong>de</strong>pen<strong>de</strong>ría <strong><strong>de</strong>l</strong> margen aplicado sobre <strong>el</strong> costo <strong>de</strong><br />
producción. Particularmente <strong>para</strong> <strong>el</strong> etanol <strong>de</strong> maíz por vía seca, asumiendo que los costos no<br />
divergen sustancialmente <strong>de</strong> la caña, en los casos convencionales presentados en la Tabla 5.9,<br />
pue<strong>de</strong> ser esperado un cuadro igualmente favorable a la introducción <strong><strong>de</strong>l</strong> biocombustible.<br />
63
<strong>Potenciales</strong> y <strong>Viabilidad</strong> <strong><strong>de</strong>l</strong> <strong>Uso</strong> <strong>de</strong> <strong>Bioetanol</strong> y <strong>Biodies<strong>el</strong></strong> <strong>para</strong> <strong>el</strong> Transporte en México (SENER-BID-GTZ)<br />
Task 5: Ethanol and ETBE production and end-use in Mexico<br />
Concluyendo la discusión <strong>de</strong>s<strong>de</strong> <strong>el</strong> punto <strong>de</strong> vista <strong>de</strong> las condiciones <strong>de</strong> uso, cabe observar que<br />
las mezclas <strong>de</strong> etanol con gasolina producen dos efectos principales, <strong>el</strong>evación <strong><strong>de</strong>l</strong> octanaje e<br />
incremento <strong>de</strong> la presión <strong>de</strong> vapor, que pue<strong>de</strong>n ser <strong>de</strong> interés en r<strong>el</strong>ación a los precios y que<br />
cabe comentar brevemente. Con r<strong>el</strong>ación al octanaje, la mejora que <strong>el</strong> etanol induce en la<br />
gasolina <strong>de</strong>pen<strong>de</strong> <strong>de</strong> la composición <strong>de</strong> la gasolina-base, generalmente afectando más <strong>el</strong> RON<br />
(Research Octane Number) que <strong>el</strong> MON (Motor Octane Number), pero implicando claramente<br />
que la gasolina-base pue<strong>de</strong> ser un producto <strong>de</strong> precio inferior, que llega a cumplir las<br />
especificaciones solo con la adición <strong>de</strong> etanol, que le agrega valor. Como regla general,<br />
cuando más baja la calidad <strong>de</strong> la gasolina base, más sensible es <strong>el</strong> efecto <strong><strong>de</strong>l</strong> etanol (CEPAL,<br />
2004).<br />
En r<strong>el</strong>ación a la presión <strong>de</strong> vapor, tratase <strong>de</strong> un parámetro que <strong>de</strong>be ser especificado<br />
a<strong>de</strong>cuadamente <strong>para</strong> permitir arranque en frío sin problemas y al mismo tiempo, sin excesiva<br />
volatilidad <strong>de</strong> la gasolina y consecuente <strong>el</strong>evación <strong>de</strong> las emisiones evaporativas. La presencia<br />
<strong>de</strong> etanol tien<strong>de</strong> a aumentar la presión <strong>de</strong> vapor <strong>de</strong> la mezcla, con un máximo <strong>para</strong> 5% <strong>de</strong><br />
etanol, reduciéndose <strong>de</strong>spués lentamente en la medida en que crece <strong>el</strong> contenido <strong>de</strong> alcohol.<br />
Así, típicamente, <strong>para</strong> 5% <strong>de</strong> etanol la presión <strong>de</strong> vapor sube 7 kPa y <strong>para</strong> 10%, sube 6,5 kPa<br />
(Furey, 1985). Este efecto impone un ajuste en la composición <strong>de</strong> la gasolina base, que <strong>de</strong>be<br />
presentar un contenido más bajo <strong>de</strong> fracciones livianas, como butanos e pentanos. Usualmente<br />
las gasolinas con fracciones más pesadas son <strong>de</strong> menor calidad y <strong>de</strong> menor precio. Es por eso<br />
que, <strong>para</strong> las condiciones brasileñas, se estima <strong>para</strong> las gasolinas base que podrían ser<br />
adoptadas <strong>para</strong> formular gasohol, un precio en <strong>el</strong> mercado americano alre<strong>de</strong>dor <strong>de</strong> 10% menos<br />
que <strong>el</strong> precio <strong>de</strong> una gasolina ya especificada (CEPAL, 2004). Sin embargo, es importante<br />
reconocer que intervienen otros efectos, como las escalas <strong>de</strong> producción, las facilida<strong>de</strong>s y<br />
condiciones disponibles <strong>para</strong> producir, transportar y almacenar la gasolina base requerida, que<br />
frente a volúmenes muy reducidos <strong>de</strong> consumo, pue<strong>de</strong>n llevar a pequeñas reducciones o<br />
mismo alguna <strong>el</strong>evación en <strong>el</strong> precio <strong>de</strong> la gasolina base. Esas variaciones naturalmente<br />
pue<strong>de</strong>n afectar indirectamente los precios <strong>de</strong> paridad.<br />
64
<strong>Potenciales</strong> y <strong>Viabilidad</strong> <strong><strong>de</strong>l</strong> <strong>Uso</strong> <strong>de</strong> <strong>Bioetanol</strong> y <strong>Biodies<strong>el</strong></strong> <strong>para</strong> <strong>el</strong> Transporte en México (SENER-BID-GTZ)<br />
Task 5: Ethanol and ETBE production and end-use in Mexico<br />
7. Mercado <strong>para</strong> etanol combustible en México<br />
Aun que la fuerte expansión <strong>de</strong> la <strong>de</strong>manda <strong>de</strong> etanol combustible en los países <strong>de</strong>sarrollados,<br />
en particular en los Estados Unidos, pueda significar un mercado importante <strong>para</strong> <strong>el</strong> etanol<br />
producido en México, en <strong>el</strong> presente estudio se consi<strong>de</strong>ró apenas <strong>el</strong> mercado interno <strong>para</strong> fines<br />
combustibles.<br />
Conforme los escenarios propuestos <strong>para</strong> la inserción <strong><strong>de</strong>l</strong> etanol en <strong>el</strong> mercado mexicano <strong>de</strong><br />
combustibles, se admitió su utilización en tres situaciones, que consi<strong>de</strong>ran <strong>de</strong>s<strong>de</strong> un consumo<br />
<strong>para</strong> cubrir parte <strong><strong>de</strong>l</strong> mercado <strong>de</strong> oxigenantes, hasta la <strong>de</strong>manda más amplia, alcanzando a toda<br />
la <strong>de</strong>manda <strong>de</strong> gasolina:<br />
Escenario No.1: Sustitución <strong>de</strong> la producción nacional <strong>de</strong> MTBE (Metil Terbutil Éter)<br />
y TAME (Teramil Metil Éter) por ETBE (Etil Terbutil Éter) y TAEE (Teramil Etil<br />
Éter), manteniendo las importaciones <strong>de</strong> MTBE necesarias <strong>para</strong> satisfacer la <strong>de</strong>manda<br />
<strong>de</strong> las gasolinas oxigenadas en las Zonas Metropolitanas <strong>de</strong> Guadalajara, Monterrey y<br />
Valle <strong>de</strong> México 4 .<br />
Escenario No. 2: Eliminación <strong><strong>de</strong>l</strong> empleo <strong>de</strong> éteres <strong>de</strong>rivados <strong>de</strong> petróleo en la<br />
formulación <strong>de</strong> gasolinas, manteniéndose la exigencia <strong>de</strong> oxigenación <strong>de</strong> gasolinas en<br />
las Zonas Metropolitanas al niv<strong>el</strong> <strong>de</strong> 2% en peso, empleando etanol como componente<br />
oxigenante.<br />
Escenario No.3: Mezcla <strong>de</strong> etanol en 10% <strong><strong>de</strong>l</strong> volumen <strong>de</strong> todas las gasolinas<br />
consumidas en México, correspondiendo a un niv<strong>el</strong> <strong>de</strong> oxigenación <strong>de</strong> 3,5% en peso,<br />
valor más frecuentemente utilizado en los <strong>de</strong>más países que utilizan ese<br />
biocombustible. Ese escenario es distinto <strong><strong>de</strong>l</strong> tercero escenario estudiado en la Tarea 2<br />
<strong><strong>de</strong>l</strong> presente proyecto, que consi<strong>de</strong>ró la mezcla <strong>de</strong> 10% <strong>de</strong> etanol solamente en las<br />
gasolinas actualmente no oxigenadas, cerca <strong>de</strong> 60% <strong><strong>de</strong>l</strong> mercado. De esa manera, al<br />
consi<strong>de</strong>rarse 10% <strong>de</strong> etanol en todas las gasolinas <strong>de</strong> México, se espera reproducir<br />
mejor una situación <strong>de</strong> amplia adopción <strong>de</strong> ese biocombustible.<br />
Para cada escenario es posible estimarse la <strong>de</strong>manda potencial <strong>de</strong> etanol, con auxilio <strong>de</strong> las<br />
siguientes hipótesis o consi<strong>de</strong>raciones:<br />
- en las gasolinas oxigenadas se asumió un contenido <strong>de</strong> oxigeno <strong>de</strong> 2%, a pesar <strong>de</strong> la<br />
especificación indicar que se podría oxigenar hasta 2.7% (SEMARNAT, 2006), como<br />
una manera <strong>de</strong> consi<strong>de</strong>rar la necesaria flexibilidad operativa en las refinerías.<br />
- <strong>para</strong> alcanzar un contenido <strong>de</strong> oxigeno <strong>de</strong> 2% en peso en la gasolina, se requiere la<br />
mezcla con 11% <strong>de</strong> MTBE o 12.5% <strong>de</strong> ETBE o 5.7% <strong>de</strong> etanol en volumen.<br />
4 En las discusiones sobre los escenarios <strong>para</strong> inserción <strong><strong>de</strong>l</strong> etanol en México, ese primero escenario,<br />
contemplando sustituir <strong>el</strong> MTBE nacional fue cuestionado en la medida que parece ser más interesante y<br />
económico sustituir la importación <strong>de</strong> MTBE (cerca <strong>de</strong> 12% <strong><strong>de</strong>l</strong> consumo nacional) y mantener la producción <strong>de</strong><br />
MTBE en <strong>el</strong> parque <strong>de</strong> refino <strong>de</strong> PEMEX. Esa posibilidad fue <strong>de</strong>scartada por restricciones logísticas y<br />
características particulares <strong><strong>de</strong>l</strong> mercado mexicano <strong>de</strong> gasolinas, <strong>de</strong> acuerdo con <strong>el</strong> consultor Nicolás Rodríguez,<br />
<strong><strong>de</strong>l</strong> IMP/PEMEX. Habría que encontrar utilidad <strong>para</strong> las plantas <strong>de</strong> MTBE, como por ejemplo, en la fabricación<br />
<strong>de</strong> alquilados e iso-octano, sin embargo cabe evaluar la pérdida <strong>de</strong> capacidad involucrada en esta transformación.<br />
65
<strong>Potenciales</strong> y <strong>Viabilidad</strong> <strong><strong>de</strong>l</strong> <strong>Uso</strong> <strong>de</strong> <strong>Bioetanol</strong> y <strong>Biodies<strong>el</strong></strong> <strong>para</strong> <strong>el</strong> Transporte en México (SENER-BID-GTZ)<br />
Task 5: Ethanol and ETBE production and end-use in Mexico<br />
- <strong>para</strong> efecto <strong>de</strong> los cálculos <strong>de</strong> producción <strong>de</strong> los éteres no se particularizó <strong>el</strong> TAME y<br />
<strong>el</strong> TAEE, respectivamente asumidos como MTBE y ETBE.<br />
- en la conversión <strong>de</strong> las unida<strong>de</strong>s <strong>de</strong> producción <strong>de</strong> MTBE <strong>para</strong> ETBE, asumiéndose<br />
que se mantenga la <strong>de</strong>manda <strong><strong>de</strong>l</strong> principal componente, butileno, <strong>para</strong> igual<br />
rendimiento <strong>de</strong> conversión se <strong>de</strong>be observar un incremento <strong>de</strong> aproximadamente 15%<br />
en la capacidad volumétrica <strong>de</strong> producción <strong>de</strong> éteres. Sin embargo, <strong>el</strong> contenido 14%<br />
más bajo <strong>de</strong> oxigeno en <strong>el</strong> ETBE, com<strong>para</strong>tivamente al MTBE, hacen ambas corrientes<br />
semejantes, en términos <strong>de</strong> capacidad oxigenante.<br />
- la <strong>de</strong>manda específica <strong>de</strong> etanol en la producción <strong>de</strong> ETBE es adoptada como 0.43 m 3<br />
<strong>de</strong> etanol por m 3 <strong>de</strong> ETBE, valor <strong>de</strong>terminado a partir <strong>de</strong> la estequiometria <strong>de</strong> las<br />
reacciones químicas involucradas.<br />
- la <strong>de</strong>manda <strong>de</strong> gasolina PEMEX Magma en las zonas metropolitanas en las cuales ese<br />
combustible <strong>de</strong>be ser oxigenado correspon<strong>de</strong> a 29.3% <strong>de</strong> la <strong>de</strong>manda nacional <strong>de</strong><br />
gasolinas <strong>de</strong> esa calidad, <strong>de</strong> acuerdo a las ventas observadas en 2005. Se asume que esa<br />
participación no se altere.<br />
- se consi<strong>de</strong>ró <strong>de</strong>spreciable <strong>para</strong> los objetivos <strong><strong>de</strong>l</strong> presente estudio la exigencia particular<br />
<strong>de</strong> uso <strong>de</strong> gasolinas oxigenadas en <strong>el</strong> Municipio <strong>de</strong> Ciudad Juárez, (Chihuahua) durante<br />
los meses <strong><strong>de</strong>l</strong> periodo invernal (noviembre a marzo).<br />
- <strong>para</strong> los niv<strong>el</strong>es <strong>de</strong> mezcla <strong>de</strong> etanol consi<strong>de</strong>rados, entre 5.7 y 10% en volumen, no se<br />
observan variaciones sensibles en <strong>el</strong> consumo específico vehicular y consecuentemente<br />
<strong>el</strong> contenido <strong>de</strong> energía útil será admitido constante. En otras palabras, la utilización <strong>de</strong><br />
etanol no afecta la <strong>de</strong>manda <strong>de</strong> gasolina al niv<strong>el</strong> <strong>de</strong> usuario.<br />
Un resumen <strong>de</strong> las ventas <strong>de</strong> gasolina y las correspondientes fracciones <strong>de</strong> MTBE observadas<br />
en 2005, según su calidad y presencia <strong><strong>de</strong>l</strong> oxigenante es presentado en la Tabla 7.1. Las ventas<br />
<strong>de</strong> gasolina correspon<strong>de</strong>n a los datos informados por la empresa productora y suministradora<br />
<strong><strong>de</strong>l</strong> mercado (PEMEX, 2006), mientras <strong>el</strong> volumen <strong>de</strong>mandado <strong>de</strong> MTBE fue estimado <strong>para</strong><br />
una fracción <strong>de</strong> 11% en volumen (2% oxígeno en peso), aun que la presencia <strong>de</strong> ese<br />
oxigenante pueda variar siempre que se mantenga <strong>el</strong> contenido <strong>de</strong> oxigeno hasta 2.7 % <strong>de</strong><br />
oxigeno en peso, <strong>para</strong> la fracción <strong>de</strong> gasolinas especificadas <strong>de</strong> acuerdo con la legislación<br />
mexicana.<br />
Tabla 7.1. Consumo <strong>de</strong> gasolina en México en 2005<br />
Tipo <strong>de</strong> gasolina<br />
Mercado<br />
Volumen <strong>de</strong> gasolina<br />
(MBD)<br />
Volumen <strong>de</strong> MTBE<br />
(MBD)<br />
PEMEX Premium todo <strong>el</strong> país 111.9 12.3<br />
PEMEX Magma 3 zonas metropolitanas 163.7 18.0<br />
PEMEX Magma resto <strong><strong>de</strong>l</strong> país 395.9 0.0<br />
Total - 671.5 30.3<br />
66
<strong>Potenciales</strong> y <strong>Viabilidad</strong> <strong><strong>de</strong>l</strong> <strong>Uso</strong> <strong>de</strong> <strong>Bioetanol</strong> y <strong>Biodies<strong>el</strong></strong> <strong>para</strong> <strong>el</strong> Transporte en México (SENER-BID-GTZ)<br />
Task 5: Ethanol and ETBE production and end-use in Mexico<br />
Para <strong>el</strong> primero escenario, <strong>de</strong> menor <strong>de</strong>manda <strong>de</strong> biocombustible, la estimación <strong>de</strong><br />
requerimiento <strong>de</strong> etanol <strong>de</strong>pen<strong>de</strong> <strong>de</strong> la capacidad nacional <strong>de</strong> producción <strong>de</strong> éteres<br />
oxigenantes, como se analizó en <strong>el</strong> tópico 2. Producción <strong>de</strong> éteres y etanol en México: cuadro<br />
actual. No obstante que en la actualidad <strong>el</strong> parque mexicano <strong>de</strong> producción <strong>de</strong> MTBE y TAME<br />
opere a aproximadamente 70% <strong>de</strong> su capacidad nominal por falta <strong>de</strong> carga <strong>de</strong> las unida<strong>de</strong>s<br />
catalíticas, se asume que pueda operar a plena capacidad al utilizar etanol como materia prima.<br />
En ese caso, consi<strong>de</strong>rando la capacidad total existente <strong>para</strong> producción <strong>de</strong> MTBE en las seis<br />
plantas <strong>de</strong> PEMEX, 15.6 MBD, y asumiendo una eficiencia <strong>de</strong> operación <strong>de</strong> 92%, sería<br />
posible una producción <strong>de</strong> 14.4 MBD <strong>de</strong> MTBE o una 16.5 MBD <strong>de</strong> ETBE, con igual<br />
capacidad oxigenante, cerca <strong>de</strong> la mitad <strong>de</strong> las necesida<strong>de</strong>s <strong>de</strong> México estimadas <strong>para</strong> 2005.<br />
De ese modo, <strong>el</strong> ETBE producido en las plantas <strong>de</strong> PEMEX operando sin restricciones podría<br />
aditivar 47.5% <strong>de</strong> la gasolina mexicana actualmente oxigenada, o sea, 130.9 MBD, al niv<strong>el</strong> <strong>de</strong><br />
2% <strong>de</strong> oxigeno.<br />
Utilizando los coeficientes presentados anteriormente y la <strong>de</strong>manda <strong>de</strong> gasolina con MTBE<br />
observada en la Tabla 7.1, resulta una <strong>de</strong>manda <strong>de</strong> etanol <strong>para</strong> la producción <strong>de</strong> ETBE <strong>de</strong><br />
411.9 mil m 3 (7,097 barriles diarios) <strong>de</strong> etanol por año. Vale observar que ese caso la <strong>de</strong>manda<br />
<strong>de</strong> gasolina se reduce proporcionalmente <strong>de</strong>bido al volumen más alto <strong>de</strong> componente<br />
requerido, o sea, <strong>para</strong> mantener <strong>el</strong> mismo niv<strong>el</strong> <strong>de</strong> oxigenación, la utilización <strong>de</strong> ETBE<br />
<strong>de</strong>splazando <strong>el</strong> MTBE promueve una reducción <strong>de</strong> 1.5% en la <strong>de</strong>manda <strong>de</strong> gasolina. Por<br />
supuesto esa reducción ocurre solamente en las gasolinas a ser aditivadas con ETBE,<br />
significando <strong>para</strong> valores <strong>de</strong> 2005 una reducción <strong>de</strong> 1.96 MBD en las necesida<strong>de</strong>s <strong>de</strong> gasolina<br />
por ese efecto.<br />
Para <strong>el</strong> segundo escenario <strong>de</strong> utilización <strong>de</strong> etanol, se asume que toda la gasolina oxigenada en<br />
2005, 275.6 MBD, <strong>de</strong>ba contener 5.7% <strong>de</strong> etanol <strong>para</strong> alcanzar <strong>el</strong> 2% <strong>de</strong> oxigeno en peso,<br />
resultando en <strong>de</strong>manda anual <strong>de</strong> 911.7 miles m 3 . Análogamente al escenario anterior, es<br />
posible <strong>de</strong>terminar <strong>el</strong> impacto sobre la <strong>de</strong>manda <strong>de</strong> gasolina, resultando en ese caso un<br />
incremento <strong>de</strong> 14.6 MBD, <strong>de</strong>bido a reducción <strong>de</strong> contenido <strong>de</strong> componente. En ese caso <strong>el</strong><br />
ahorro es solo <strong>de</strong> MTBE y TAME, con algún incremento en la <strong>de</strong>manda <strong>de</strong> gasolina.<br />
Para <strong>el</strong> tercero y último escenario, utilizando <strong>el</strong> procedimiento adoptado <strong>para</strong> <strong>el</strong> escenario<br />
anterior y asumiendo que toda gasolina consumida en México, 671.5 MBD en 2005, podría<br />
contener 10% <strong>de</strong> etanol anhidro, existiría una <strong>de</strong>manda anual <strong>de</strong> 3,897 mil m 3 <strong>de</strong> etanol, por su<br />
vez <strong>de</strong>splazando una cantidad <strong>de</strong> 36.8 MBD <strong>de</strong> gasolina, efecto neto <strong>de</strong> la adicción <strong>de</strong> 67.1<br />
MBD <strong>de</strong> etanol y la retirada <strong>de</strong> 30.3 MBD <strong>de</strong> MTBE.<br />
Para las condiciones observadas en 2005, presentase en la Tabla 7.2 la <strong>de</strong>manda <strong>de</strong> etanol<br />
estimada y <strong>el</strong> impacto neto <strong>de</strong> su adopción sobre <strong>el</strong> ahorro anual <strong>de</strong> divisas por la importación<br />
<strong>de</strong> gasolina y MTBE, ambos evaluados a 0.45 US$/litro, valor <strong>de</strong> referencia <strong>para</strong> 2005.<br />
Establecidos los niv<strong>el</strong>es <strong>de</strong> <strong>de</strong>manda <strong>de</strong> etanol en los escenarios propuestos <strong>para</strong> las presentes<br />
condiciones <strong>de</strong> <strong>de</strong>manda <strong>de</strong> combustibles, es oportuno estimar como podrán comportarse tales<br />
valores en mediano plazo, incorporando las previsiones <strong>de</strong> crecimiento <strong><strong>de</strong>l</strong> mercado <strong>de</strong><br />
combustibles. Cabe mencionar que <strong>para</strong> <strong>el</strong> Escenario 1 la <strong>de</strong>manda <strong>de</strong> etanol esta condicionada<br />
a capacidad instalada <strong>de</strong> producción <strong>de</strong> MTBE, a ser convertida <strong>para</strong> ETBE y como no se<br />
dispone <strong>de</strong> informaciones sobre planos <strong>de</strong> expansión <strong>de</strong> esa capacidad, no serán efectuadas<br />
proyecciones <strong>para</strong> ese caso. Por otra parte, <strong>para</strong> los Escenarios 2 y 3, la <strong>de</strong>manda potencial <strong>de</strong><br />
etanol será <strong>de</strong>terminada directamente por la <strong>de</strong>manda <strong>de</strong> gasolina en <strong>el</strong> país, corrientemente<br />
67
<strong>Potenciales</strong> y <strong>Viabilidad</strong> <strong><strong>de</strong>l</strong> <strong>Uso</strong> <strong>de</strong> <strong>Bioetanol</strong> y <strong>Biodies<strong>el</strong></strong> <strong>para</strong> <strong>el</strong> Transporte en México (SENER-BID-GTZ)<br />
Task 5: Ethanol and ETBE production and end-use in Mexico<br />
alre<strong>de</strong>dor <strong>de</strong> 650 mil barriles diarios y naturalmente con perspectivas <strong>de</strong> evolución<br />
<strong>de</strong>terminadas por <strong>el</strong> ambiente económico futuro y la expansión <strong>de</strong> la flota vehicular.<br />
Tabla 7.2. Escenarios <strong>para</strong> introducción <strong><strong>de</strong>l</strong> etanol combustible en México, valores <strong>para</strong> 2005<br />
Escenario<br />
Demanda <strong>de</strong> etanol<br />
(mil m 3 /año)<br />
Ahorro <strong>de</strong> divisas por la reducción<br />
<strong>de</strong> la importación <strong>de</strong> gasolina y<br />
MTBE (mil US$)<br />
1. Sustitución <strong>de</strong> la producción<br />
nacional <strong>de</strong> MTBE por ETBE, en la<br />
capacidad <strong>de</strong> producción<br />
2. Sustitución total <strong>de</strong> los éteres por<br />
etanol a 5.7% en 44% <strong>de</strong> la gasolina<br />
(2% <strong>de</strong> oxigeno)<br />
3. Mezcla <strong>de</strong> 10% <strong>de</strong> etanol en toda<br />
gasolina <strong><strong>de</strong>l</strong> país (3.5% <strong>de</strong> oxigeno)<br />
411.9 185,355<br />
911.7 410,265<br />
3,897.0 1,753,650<br />
Adicionalmente, existen cambios a consi<strong>de</strong>rar en la estructura <strong>de</strong> <strong>de</strong>manda <strong>de</strong> los<br />
combustibles. Por ejemplo, conforme las proyecciones <strong>de</strong> ventas <strong>de</strong> PEMEX y en coherencia<br />
con la ten<strong>de</strong>ncia observada en los últimos años, la <strong>de</strong>manda <strong>de</strong> gasolina PEMEX Premium<br />
<strong>de</strong>berá presentar un tasa <strong>de</strong> crecimiento más <strong>el</strong>evada que la gasolina PEMEX Magma, pasando<br />
<strong>de</strong> 16.7% en 2005 <strong>para</strong> 21.0% en 2010, porcentual que se estima <strong>de</strong>berá mantenerse en los<br />
anos siguientes (PEMEX, 2006). Ese crecimiento diferenciado afecta directamente la <strong>de</strong>manda<br />
<strong>de</strong> etanol, ya que en la gasolina PEMEX Premium es obligatoria la presencia <strong>de</strong> un aditivo<br />
oxigenante.<br />
Para estimar las <strong>de</strong>mandas <strong>de</strong> etanol en 2010 <strong>para</strong> los escenarios evaluados, fueron<br />
consi<strong>de</strong>rados dos proyecciones <strong>para</strong> <strong>el</strong> mercado <strong>de</strong> gasolina en México, ambas presentadas por<br />
PEMEX y representando dos niv<strong>el</strong>es <strong>de</strong> crecimiento <strong><strong>de</strong>l</strong> mercado. En las estimaciones <strong>de</strong><br />
<strong>de</strong>manda <strong>de</strong> gasolina <strong><strong>de</strong>l</strong> Plan <strong>de</strong> Negocios <strong>de</strong> PEMEX <strong>para</strong> <strong>el</strong> período 2004-2012, se adopta<br />
una tasa <strong>de</strong> crecimiento promedio anual <strong>de</strong> 3.3%, proyectada hasta 2024 y correspondiente al<br />
escenario <strong>de</strong> crecimiento alto <strong>para</strong> la gasolina (Flores Cotera, 2006). Como escenario <strong>de</strong><br />
menor expansión, se tomó <strong>el</strong> Pronóstico <strong>de</strong> Ventas <strong>de</strong> gasolinas y dies<strong>el</strong>, pre<strong>para</strong>do por<br />
PEMEX <strong>para</strong> <strong>el</strong> período 2006-2014, que consi<strong>de</strong>ra una tasa <strong>de</strong> 3.0% (PEMEX, 3006). Los<br />
resultados <strong>de</strong> esas proyecciones son presentados en la Figura 7.1, <strong>para</strong> los periodos asumidos<br />
en cada estudio.<br />
68
<strong>Potenciales</strong> y <strong>Viabilidad</strong> <strong><strong>de</strong>l</strong> <strong>Uso</strong> <strong>de</strong> <strong>Bioetanol</strong> y <strong>Biodies<strong>el</strong></strong> <strong>para</strong> <strong>el</strong> Transporte en México (SENER-BID-GTZ)<br />
Task 5: Ethanol and ETBE production and end-use in Mexico<br />
1.200<br />
MBDO<br />
1.000<br />
800<br />
600<br />
400<br />
200<br />
crecimiento <strong>de</strong> la <strong>de</strong>manda a 3,3%<br />
crecimiento <strong>de</strong> la <strong>de</strong>manda a 3,0%<br />
0<br />
2000 2005 2010 2015 2020<br />
Figura 3.1. Estimaciones <strong>de</strong> evolución <strong>de</strong> la <strong>de</strong>manda <strong>de</strong> gasolina en México<br />
Tabla 7.3. Estimativa <strong>de</strong> <strong>de</strong>manda <strong>de</strong> etanol combustible en México en 2010<br />
crecimiento <strong>de</strong> la<br />
<strong>de</strong>manda a 3.0%<br />
crecimiento <strong>de</strong> la<br />
<strong>de</strong>manda a 3.3%<br />
Demanda <strong>de</strong> Gasolina (MBD)<br />
PEMEX Premium 160.2 165.8<br />
Gasolina PEMEX Magma con MTBE 175.5 182.8<br />
Gasolina PEMEX Magma sin MTBE 423.5 441.0<br />
Gasolina total 759.3 789.6<br />
Demanda <strong>de</strong> etanol (miles <strong>de</strong> m 3 por año)<br />
Escenario 2 (etanol a 5,7% en 44% <strong><strong>de</strong>l</strong> mercado) 1,110.6 1,153.1<br />
Escenario 3 (etanol a 10% en todo <strong>el</strong> mercado) 4,406.3 4,582.4<br />
69
<strong>Potenciales</strong> y <strong>Viabilidad</strong> <strong><strong>de</strong>l</strong> <strong>Uso</strong> <strong>de</strong> <strong>Bioetanol</strong> y <strong>Biodies<strong>el</strong></strong> <strong>para</strong> <strong>el</strong> Transporte en México (SENER-BID-GTZ)<br />
Task 5: Ethanol and ETBE production and end-use in Mexico<br />
Con base en esas proyecciones y los valores <strong>de</strong> la Tabla 7.3, fue posible estimar las <strong>de</strong>mandas<br />
potenciales <strong>de</strong> etanol <strong>para</strong> o final <strong>de</strong> la década <strong>para</strong> los Escenarios 2 y 3, como se presenta en<br />
la Tabla 7.3. Con efecto <strong>de</strong> com<strong>para</strong>r los tres escenarios, en la Figura 7.2 se incluyen todos los<br />
resultados, inclusive <strong>el</strong> Escenario 1, que <strong>de</strong>pen<strong>de</strong> únicamente <strong>de</strong> la capacidad existente <strong>de</strong><br />
producción <strong>de</strong> MTBE.<br />
5,000<br />
mil m 3 crecimiento <strong><strong>de</strong>l</strong> mercado a 3.0%<br />
4,000<br />
3,000<br />
crecimiento <strong><strong>de</strong>l</strong> mercado a 3.3%<br />
2,000<br />
1,000<br />
0<br />
Escenario 1 (2005) Escenario 2 (2010) Escenario 3 (2010)<br />
Figura 7.2. Escenarios <strong>de</strong> <strong>de</strong>manda <strong>de</strong> etanol en México <strong>para</strong> dos escenarios <strong>de</strong> crecimiento<br />
<strong><strong>de</strong>l</strong> mercado <strong>de</strong> gasolinas<br />
Como se evi<strong>de</strong>ncia por esos resultados, la <strong>de</strong>manda potencial <strong>de</strong> etanol en México es bastante<br />
más afectada por los escenarios <strong>de</strong> introducción <strong>de</strong> ese biocombustible que por las<br />
expectativas <strong>de</strong> evolución <strong>de</strong> la <strong>de</strong>manda en <strong>el</strong> mercado <strong>de</strong> combustibles. Vale recordar que la<br />
presente evaluación consi<strong>de</strong>ró un contenido <strong>de</strong> 2% <strong>de</strong> oxigeno en peso; en la hipótesis <strong>de</strong> se<br />
trabajar con un contenido inferior, los valores estimados <strong>para</strong> <strong>el</strong> Escenario 2 se reducen<br />
proporcionalmente, mientras <strong>para</strong> <strong>el</strong> Escenario 1 y 3 se mantienen, en la medida que<br />
correspon<strong>de</strong>n respectivamente a utilizar la capacidad nacional <strong>de</strong> producción <strong>de</strong> éteres <strong>para</strong><br />
consumir etanol o mezclar etanol al niv<strong>el</strong> <strong>de</strong> 10% en toda gasolina <strong><strong>de</strong>l</strong> país.<br />
70
<strong>Potenciales</strong> y <strong>Viabilidad</strong> <strong><strong>de</strong>l</strong> <strong>Uso</strong> <strong>de</strong> <strong>Bioetanol</strong> y <strong>Biodies<strong>el</strong></strong> <strong>para</strong> <strong>el</strong> Transporte en México (SENER-BID-GTZ)<br />
Task 5: Ethanol and ETBE production and end-use in Mexico<br />
8. Factibilidad económica <strong>de</strong> la producción y uso <strong>de</strong> etanol<br />
A partir <strong>de</strong> los temas explorados en los capítulos prece<strong>de</strong>ntes, que fundamentaran las<br />
condiciones actuales y potenciales <strong>de</strong> oferta y producción <strong>de</strong> etanol, es posible <strong>de</strong>finir mejor<br />
los contextos más favorables cotejando las necesida<strong>de</strong>s con las posibles fuentes <strong>de</strong> producto.<br />
Así, en los párrafos siguientes se aborda inicialmente la dimensión <strong>de</strong> los parques productores<br />
<strong>de</strong> etanol <strong>para</strong> México, <strong>para</strong> las diferentes tecnologías <strong>de</strong> producción, especificadas por los<br />
módulos productivos, y escenarios <strong>de</strong> <strong>de</strong>manda, permitiendo estimar <strong>el</strong> niv<strong>el</strong> <strong>de</strong> inversión y<br />
requerimientos <strong>de</strong> tierra <strong>para</strong> suministrar la cantidad necesaria <strong>de</strong> materia prima. En seguida se<br />
efectúa un análisis económico <strong>para</strong> la producción <strong>de</strong> etanol en México, consi<strong>de</strong>rando los<br />
escenarios anteriores, basándose en los costos estimados <strong>para</strong> producción y los precios <strong>de</strong><br />
paridad evaluados prece<strong>de</strong>ntemente. No se consi<strong>de</strong>ro la posibilidad <strong>de</strong> comercio internacional<br />
<strong>de</strong> etanol combustible. Al final se presenta un análisis <strong>de</strong> sensibilidad <strong>de</strong> los principales<br />
parámetros que afectan los precios <strong><strong>de</strong>l</strong> etanol, <strong>de</strong> modo a robustecer la eventual toma <strong>de</strong><br />
<strong>de</strong>cisiones sobre la oportunidad y factibilidad económica <strong><strong>de</strong>l</strong> etanol combustible <strong>para</strong> México.<br />
Los aspectos explorados en ese capítulo evi<strong>de</strong>ntemente no agotan las amplias implicaciones <strong>de</strong><br />
la producción y uso <strong><strong>de</strong>l</strong> etanol, siendo imperativo agregar informaciones e indicadores <strong>de</strong><br />
sostenabilidad <strong>para</strong> las distintas opciones, objeto <strong>de</strong> otros estudios. No obstante, la viabilidad<br />
económica es <strong>el</strong> punto <strong>de</strong> partida <strong>para</strong> propuestas consistentes buscando implementar<br />
programas <strong>de</strong> biocombustibles.<br />
8.1. Dimensiones <strong><strong>de</strong>l</strong> parque productor <strong>de</strong> etanol en México<br />
Consi<strong>de</strong>rando los escenarios <strong>de</strong> <strong>de</strong>manda <strong>de</strong> etanol estudiados en Capítulo 7. Mercado <strong>para</strong><br />
etanol combustible en México y las producciones potenciales <strong>de</strong> etanol <strong>para</strong> los diferentes<br />
módulos productivos presentados en <strong>el</strong> Capítulo 4. Procesos tecnológicos r<strong>el</strong>evantes <strong>para</strong><br />
producción <strong>de</strong> etanol, las tablas siguientes presentan <strong>el</strong> número <strong>de</strong> unida<strong>de</strong>s productivas<br />
necesarias, las inversiones asociadas a su implantación y las superficies <strong>de</strong> cultivo requeridas<br />
<strong>para</strong> cada caso. Los requerimientos <strong>de</strong> tierra y las inversiones fueran graficados en las Figuras<br />
8.1 y 8.2, evi<strong>de</strong>nciando como los impactos son nítidamente diferenciados entre las diversas<br />
posibilida<strong>de</strong>s estudiadas.<br />
Tabla 8.1. Número <strong>de</strong> unida<strong>de</strong>s productivas necesarias (tecnologías convencionales)<br />
Materia prima y tecnología<br />
Caña mi<strong>el</strong><br />
pobre<br />
Caña mi<strong>el</strong><br />
rica<br />
Caña jugo<br />
directo<br />
Maíz vía seca<br />
Capacidad (m 3 /día) 150 150 450 500<br />
Inversión industrial por unidad (mil US$) 15,000 15,000 50,000 61,000<br />
Producción anual (m 3 /año) 27,090 27,090 81,270 150,500<br />
Escenario<br />
1. Sustitución <strong>de</strong> la producción nacional <strong>de</strong><br />
MTBE por ETBE<br />
2. Sustitución total <strong>de</strong> los éteres por etanol a<br />
5,7% en volumen<br />
3. Mezcla <strong>de</strong> 10% <strong>de</strong> etanol en volumen en toda<br />
gasolina <strong><strong>de</strong>l</strong> país<br />
Número <strong>de</strong> módulos<br />
16 16 6 3<br />
34 34 12 7<br />
144 144 48 26<br />
71
<strong>Potenciales</strong> y <strong>Viabilidad</strong> <strong><strong>de</strong>l</strong> <strong>Uso</strong> <strong>de</strong> <strong>Bioetanol</strong> y <strong>Biodies<strong>el</strong></strong> <strong>para</strong> <strong>el</strong> Transporte en México (SENER-BID-GTZ)<br />
Task 5: Ethanol and ETBE production and end-use in Mexico<br />
Tabla 8.2. Número <strong>de</strong> unida<strong>de</strong>s productivas necesarias (tecnologías innovadoras)<br />
Materia prima y tecnología<br />
Caña jugo +<br />
hidrólisis<br />
Sorgo Yuca Remolacha<br />
Capacidad (m 3 /día) 551 150 150 150<br />
Inversión industrial por unidad (mil US$) 150,000 20,000 20,000 20,000<br />
Producción anual (m 3 /año) 99,556 32,250 32,250 32,250<br />
Escenario<br />
1. Sustitución <strong>de</strong> la producción nacional <strong>de</strong><br />
MTBE por ETBE<br />
2. Sustitución total <strong>de</strong> los éteres por etanol a<br />
5,7% en volumen<br />
3. Mezcla <strong>de</strong> 10% <strong>de</strong> etanol en volumen en toda<br />
gasolina <strong><strong>de</strong>l</strong> país<br />
Número <strong>de</strong> módulos<br />
5 13 13 13<br />
10 29 29 29<br />
40 121 121 121<br />
Escenario<br />
Tabla 8.3. Inversión industrial total (tecnologías convencionales)<br />
Caña mi<strong>el</strong> Caña mi<strong>el</strong> Caña jugo<br />
Materia prima y tecnología<br />
pobre rica directo<br />
1. Sustitución <strong>de</strong> la producción nacional <strong>de</strong><br />
MTBE por ETBE<br />
2. Sustitución total <strong>de</strong> los éteres por etanol a<br />
5,7% en volumen<br />
3. Mezcla <strong>de</strong> 10% <strong>de</strong> etanol en volumen en<br />
toda gasolina <strong><strong>de</strong>l</strong> país<br />
Inversión industrial (millones <strong>de</strong> US$)<br />
Maíz vía seca<br />
240 240 300 183<br />
510 510 600 427<br />
2,160 2,160 2,400 1,586<br />
Escenario<br />
Tabla 8.4. Inversión industrial total (tecnologías innovadoras)<br />
Caña jugo +<br />
Materia prima y tecnología<br />
Sorgo Yuca Remolacha<br />
hidrólisis<br />
1. Sustitución <strong>de</strong> la producción nacional <strong>de</strong><br />
MTBE por ETBE<br />
2. Sustitución total <strong>de</strong> los éteres por etanol a<br />
5,7% en volumen<br />
3. Mezcla <strong>de</strong> 10% <strong>de</strong> etanol en volumen en<br />
toda gasolina <strong><strong>de</strong>l</strong> país<br />
Inversión industrial (millones <strong>de</strong> US$)<br />
790 325 585 390<br />
1,580 725 1,305 870<br />
6,320 3,025 5,445 3,630<br />
De acuerdo a lo esperado, coherentemente a los previos estudios <strong>de</strong> costos <strong>de</strong> capital <strong>para</strong> la<br />
producción <strong>de</strong> etanol, las inversiones más bajas se asociaran a tecnologías conocidas. El maíz<br />
se <strong>de</strong>staca en ese sentido, principalmente por <strong>el</strong> largo período <strong>de</strong> utilización <strong>de</strong> la unidad<br />
industrial, posible <strong>de</strong>bido al almacenamiento <strong>de</strong> los granos y operación durante todo <strong>el</strong> año.<br />
Luego vienen las <strong>de</strong>stilerías anexas a ingenios azucareros, adon<strong>de</strong> la inversión más importante,<br />
72
<strong>Potenciales</strong> y <strong>Viabilidad</strong> <strong><strong>de</strong>l</strong> <strong>Uso</strong> <strong>de</strong> <strong>Bioetanol</strong> y <strong>Biodies<strong>el</strong></strong> <strong>para</strong> <strong>el</strong> Transporte en México (SENER-BID-GTZ)<br />
Task 5: Ethanol and ETBE production and end-use in Mexico<br />
<strong>para</strong> extracción <strong><strong>de</strong>l</strong> jugo <strong>de</strong> la caña, ya está hecha. En seguida se presentan las <strong>de</strong>stilerías<br />
autónomas. La alternativa <strong>de</strong> más alto costo es la producción por jugo directo asociada a<br />
hidrólisis <strong>de</strong> residuos c<strong>el</strong>ulósicos, que implicaría en inversiones más que 4 veces más<br />
<strong>el</strong>evadas, com<strong>para</strong>tivamente al caso <strong><strong>de</strong>l</strong> maíz.<br />
Se estima que <strong>el</strong> efecto <strong>de</strong> escala en las inversiones <strong>para</strong> producción <strong>de</strong> etanol pue<strong>de</strong> ser<br />
importante y explica la ten<strong>de</strong>ncia <strong>de</strong> crecimiento <strong>de</strong> las capacida<strong>de</strong>s unitarias instaladas.<br />
Particularmente <strong>para</strong> <strong>el</strong> caso <strong><strong>de</strong>l</strong> maíz, se consi<strong>de</strong>ró que triplicar la capacidad <strong>de</strong> una planta<br />
pue<strong>de</strong> llevar a reducciones <strong>de</strong> costo entre 15 y 20% (Henniges, 2003). Así, caso se<br />
implementen capacida<strong>de</strong>s instaladas más <strong>el</strong>evadas, pue<strong>de</strong>n ser esperadas menores inversiones.<br />
Tabla 8.5. Superficie <strong>de</strong> cultivo requerida (tecnologías convencionales)<br />
Materia prima y tecnología<br />
Caña mi<strong>el</strong><br />
pobre<br />
Caña mi<strong>el</strong><br />
rica<br />
Caña jugo<br />
directo<br />
Maíz vía seca<br />
Productividad agrícola (t/ha) 61 61 61 10<br />
Productividad industrial (litro/t) 8.8 17.1 80 398<br />
Escenario<br />
Superficie <strong>de</strong> cultivo (miles <strong>de</strong> ha)<br />
1. Sustitución <strong>de</strong> la producción nacional <strong>de</strong><br />
MTBE por ETBE 767 395 84 103<br />
2. Sustitución total <strong>de</strong> los éteres por etanol a<br />
5,7% en volumen 1,698 874 187 229<br />
3. Mezcla <strong>de</strong> 10% <strong>de</strong> etanol en volumen en<br />
toda gasolina <strong><strong>de</strong>l</strong> país 7,260 3,736 799 979<br />
Tabla 8.6. Superficie <strong>de</strong> cultivo requerida (tecnologías innovadoras)<br />
Materia prima y tecnología<br />
Caña jugo +<br />
hidrólisis<br />
Sorgo Yuca Remolacha<br />
Productividad agrícola (t/ha) 61 40 14 51<br />
Productividad industrial (litro/t) 98 35 170 86<br />
Escenario<br />
1. Sustitución <strong>de</strong> la producción nacional <strong>de</strong><br />
MTBE por ETBE<br />
2. Sustitución total <strong>de</strong> los éteres por etanol a<br />
5,7% en volumen<br />
3. Mezcla <strong>de</strong> 10% <strong>de</strong> etanol en volumen en<br />
toda gasolina <strong><strong>de</strong>l</strong> país<br />
Superficie <strong>de</strong> cultivo (miles <strong>de</strong> ha)<br />
69 294 173 94<br />
153 651 383 208<br />
652 2,784 1,637 889<br />
73
<strong>Potenciales</strong> y <strong>Viabilidad</strong> <strong><strong>de</strong>l</strong> <strong>Uso</strong> <strong>de</strong> <strong>Bioetanol</strong> y <strong>Biodies<strong>el</strong></strong> <strong>para</strong> <strong>el</strong> Transporte en México (SENER-BID-GTZ)<br />
Task 5: Ethanol and ETBE production and end-use in Mexico<br />
7,000<br />
6,000<br />
5,000<br />
4,000<br />
millones US$<br />
Sustitución <strong>de</strong> la producción nacional <strong>de</strong> MTBE por<br />
ETBE<br />
Sustitución total <strong>de</strong> los éteres por etanol a 5,7%<br />
Mezcla <strong>de</strong> 10% <strong>de</strong> etanol en toda gasolina<br />
3,000<br />
2,000<br />
1,000<br />
0<br />
Cana mi<strong>el</strong><br />
pobre<br />
Cana mi<strong>el</strong><br />
rica<br />
Cana jugo<br />
directo<br />
Maíz via<br />
seca<br />
Cana jugo<br />
+ hidrólisis<br />
Sorgo Yuca Remolacha<br />
Figura 8.1. Inversiones industriales necesarias<br />
3,000<br />
miles <strong>de</strong> ha<br />
2,500<br />
2,000<br />
1,500<br />
Sustitución <strong>de</strong> la producción nacional <strong>de</strong> MTBE<br />
por ETBE<br />
Sustitución total <strong>de</strong> los éteres por etanol a 5,7%<br />
Mezcla <strong>de</strong> 10% <strong>de</strong> etanol en toda gasolina<br />
1,000<br />
500<br />
0<br />
Cana jugo<br />
directo<br />
Maíz via seca Cana jugo +<br />
hidrólisis<br />
Sorgo Yuca Remolacha<br />
Figura 8.2. Superficies <strong>de</strong> cultivo necesarias <strong>para</strong> producción <strong>de</strong> etanol<br />
74
<strong>Potenciales</strong> y <strong>Viabilidad</strong> <strong><strong>de</strong>l</strong> <strong>Uso</strong> <strong>de</strong> <strong>Bioetanol</strong> y <strong>Biodies<strong>el</strong></strong> <strong>para</strong> <strong>el</strong> Transporte en México (SENER-BID-GTZ)<br />
Task 5: Ethanol and ETBE production and end-use in Mexico<br />
Como la utilización <strong>de</strong> las m<strong>el</strong>azas correspon<strong>de</strong> al aprovechamiento <strong>de</strong> un coproducto <strong>de</strong> la<br />
fabricación <strong><strong>de</strong>l</strong> azúcar, no hay mucho sentido en estimar <strong>el</strong> área necesaria a ser cultivada en<br />
ese caso. Es interesante observar que, consi<strong>de</strong>rando <strong>el</strong> escenario <strong>de</strong> <strong>de</strong>manda más <strong>el</strong>evada, con<br />
una mezcla <strong>de</strong> 10% en toda la gasolina, la opción caña/jugo directo implica en<br />
aproximadamente doblar <strong>el</strong> área plantada, cerca <strong>de</strong> 600 mil ha. En esa evaluación se adoptó<br />
una productividad <strong>de</strong> 61 t/ha, que pue<strong>de</strong> ser consi<strong>de</strong>rada r<strong>el</strong>ativamente conservadora, ya que <strong>el</strong><br />
rendimiento medio nacional en 2005 fue 75 t/ha (Lazcano, 2006). En <strong>el</strong> caso que se consi<strong>de</strong>re<br />
<strong>el</strong> maíz como materia prima, <strong>para</strong> ese mismo escenario, seria necesario incrementar en 12% <strong>el</strong><br />
área actualmente sembrada <strong>de</strong> 8 millones <strong>de</strong> ha (FAOSTAT, 2006). Cabe observar también<br />
que en ese caso la productividad adoptada <strong>para</strong> <strong>el</strong> maíz fue <strong>de</strong> 10 t/ha, mientras la<br />
productividad media mexicana, en 2004, fue 2.77 t/ha.<br />
8.2. Análisis económico <strong>de</strong> la producción y utilización <strong>de</strong> etanol<br />
Tomando los costos <strong>de</strong> producción <strong><strong>de</strong>l</strong> etanol <strong>para</strong> los diferentes contextos estudiados<br />
(presentados en la Tabla 5.9) y asumiendo un precio <strong>de</strong> venta al niv<strong>el</strong> <strong>de</strong> los precios <strong>de</strong><br />
paridad, es posible evaluar económicamente esa agroindustria energética. Obsérvese que <strong>el</strong><br />
precio <strong>de</strong> las materias primas fue <strong>de</strong>finido con base a costos <strong>de</strong> producción y los <strong>de</strong>más costos<br />
se refieren a módulos productivos basados en situaciones reales, en la extensión posible.<br />
Como indicador <strong>de</strong> sostenabilidad económica, se <strong>de</strong>terminó <strong>el</strong> resultado final neto <strong>de</strong> la<br />
actividad productiva, expresado en dólares por litro <strong>de</strong> etanol producido, consi<strong>de</strong>rando<br />
adicionalmente los siguientes parámetros <strong>para</strong> los cálculos, en un escenario <strong>de</strong> referencia: tasa<br />
<strong>de</strong> <strong>de</strong>scuento <strong>de</strong> 12%, vida económica útil <strong>de</strong> 10 años, un factor <strong>de</strong> <strong>de</strong>preciación <strong>de</strong> 10% anual<br />
y una tasa <strong>de</strong> impuestos <strong>de</strong> 28% sobre <strong>el</strong> resultado bruto. La energía <strong>el</strong>éctrica y <strong>el</strong> gas natural<br />
fueran valorados respectivamente a 150 US$/MWH y 5.50 US$/MJ. Para los precios <strong><strong>de</strong>l</strong><br />
etanol, fueran evaluados tres casos: 0.45, 0.55 y 0.65 US$/litro, siendo los dos primeros los<br />
extremos <strong><strong>de</strong>l</strong> rango <strong>de</strong> precios <strong>de</strong> paridad estudiados anteriormente y <strong>el</strong> valor más <strong>el</strong>evado<br />
como un ejercicio suponiendo un subsidio o compensación fiscal por las externalida<strong>de</strong>s. Vale<br />
comentar que ese niv<strong>el</strong> <strong>de</strong> precio es representativo <strong>de</strong> los valores practicados en <strong>el</strong> mercado<br />
americano <strong>de</strong> etanol durante los meses <strong>de</strong> abril a junio <strong>de</strong> 2006 (K<strong>el</strong>ly, 2006). Bajo esas<br />
condiciones, se obtuvo la Figura 8.3, indicando como la atractividad <strong>de</strong> la producción <strong>de</strong><br />
etanol <strong>de</strong>pen<strong>de</strong> fuertemente <strong><strong>de</strong>l</strong> precio <strong>de</strong> su producto, como se podría esperar.<br />
Buscando complementar <strong>el</strong> análisis prece<strong>de</strong>nte, <strong>para</strong> las tecnologías asociadas a la caña y <strong>el</strong><br />
maiz, se efectuó un breve estudio <strong>de</strong> sensibilidad <strong><strong>de</strong>l</strong> costo <strong><strong>de</strong>l</strong> etanol frente a variaciones <strong>de</strong><br />
los principales parámetros que afectan ese valor, como las inversiones y los costos <strong>de</strong> energía,<br />
como presentado en las Figuras 8.4 y subsecuentes. Por supuesto que <strong>para</strong> costos distintos <strong>de</strong><br />
los costos <strong>de</strong> referencia, se alteran proporcionalmente los indicadores <strong>de</strong> factibilidad. Así, esos<br />
gráficos permiten evaluar cuales podrían ser los aspectos prioritarios a tener en cuenta <strong>para</strong><br />
mejorar los indicadores <strong>de</strong> una tecnología eventualmente todavía poco atractiva en términos<br />
económicos.<br />
75
<strong>Potenciales</strong> y <strong>Viabilidad</strong> <strong><strong>de</strong>l</strong> <strong>Uso</strong> <strong>de</strong> <strong>Bioetanol</strong> y <strong>Biodies<strong>el</strong></strong> <strong>para</strong> <strong>el</strong> Transporte en México (SENER-BID-GTZ)<br />
Task 5: Ethanol and ETBE production and end-use in Mexico<br />
0.20<br />
0.10<br />
US$/litro<br />
0.45 US$/litro<br />
0.55 US$/litro<br />
0.65 US$/litro<br />
0.00<br />
-0.10<br />
Cana mi<strong>el</strong><br />
pobre<br />
Cana mi<strong>el</strong><br />
rica<br />
Cana jugo<br />
directo<br />
Cana jugo +<br />
hidrólisis<br />
Maíz vía<br />
seca<br />
Sorgo Yuca Remolacha<br />
-0.20<br />
-0.30<br />
-0.40<br />
-0.50<br />
Figura 8.3. Resultado neto <strong>de</strong> la producción <strong>de</strong> etanol, <strong>para</strong> las materias primas y tecnologías<br />
estudiadas, en <strong>el</strong> escenario <strong>de</strong> referencia<br />
inversión<br />
precio mat.prima<br />
20%<br />
15%<br />
10%<br />
5%<br />
variación en<br />
<strong>el</strong> precio <strong>de</strong><br />
etanol<br />
0%<br />
-25% -20% -15% -10% -5% 0% 5% 10% 15% 20% 25%<br />
-5%<br />
-10%<br />
-15%<br />
-20%<br />
Figura 8.4. Sensibilidad <strong><strong>de</strong>l</strong> costo <strong><strong>de</strong>l</strong> etanol producido <strong>de</strong> mi<strong>el</strong> pobre <strong>de</strong> caña<br />
76
<strong>Potenciales</strong> y <strong>Viabilidad</strong> <strong><strong>de</strong>l</strong> <strong>Uso</strong> <strong>de</strong> <strong>Bioetanol</strong> y <strong>Biodies<strong>el</strong></strong> <strong>para</strong> <strong>el</strong> Transporte en México (SENER-BID-GTZ)<br />
Task 5: Ethanol and ETBE production and end-use in Mexico<br />
inversión<br />
precio mat.prima<br />
precio <strong><strong>de</strong>l</strong> coproducto<br />
10%<br />
8%<br />
6%<br />
4%<br />
2%<br />
variación en<br />
<strong>el</strong> precio <strong>de</strong><br />
etanol<br />
0%<br />
-25% -20% -15% -10% -5% 0% 5% 10% 15% 20% 25%<br />
-2%<br />
-4%<br />
-6%<br />
-8%<br />
-10%<br />
Figura 8.5. Sensibilidad <strong><strong>de</strong>l</strong> costo <strong><strong>de</strong>l</strong> etanol producido <strong>de</strong> mi<strong>el</strong> rico <strong>de</strong> caña (azúcar es <strong>el</strong><br />
coproducto)<br />
inversión<br />
precio mat.prima<br />
20%<br />
15%<br />
10%<br />
5%<br />
variación en<br />
<strong>el</strong> precio <strong>de</strong><br />
etanol<br />
0%<br />
-25% -20% -15% -10% -5% 0% 5% 10% 15% 20% 25%<br />
-5%<br />
-10%<br />
-15%<br />
-20%<br />
Figura 8.6. Sensibilidad <strong><strong>de</strong>l</strong> costo <strong><strong>de</strong>l</strong> etanol producido <strong>de</strong> jugo directo <strong>de</strong> caña<br />
77
<strong>Potenciales</strong> y <strong>Viabilidad</strong> <strong><strong>de</strong>l</strong> <strong>Uso</strong> <strong>de</strong> <strong>Bioetanol</strong> y <strong>Biodies<strong>el</strong></strong> <strong>para</strong> <strong>el</strong> Transporte en México (SENER-BID-GTZ)<br />
Task 5: Ethanol and ETBE production and end-use in Mexico<br />
inversión<br />
precio mat.prima<br />
15%<br />
10%<br />
variación en<br />
<strong>el</strong> precio <strong>de</strong><br />
etanol<br />
5%<br />
0%<br />
-25% -20% -15% -10% -5% 0% 5% 10% 15% 20% 25%<br />
-5%<br />
-10%<br />
-15%<br />
Figura 8.7. Sensibilidad <strong><strong>de</strong>l</strong> costo <strong><strong>de</strong>l</strong> etanol producido <strong>de</strong> jugo directo <strong>de</strong> caña más hidrólisis<br />
<strong>de</strong> los residuos c<strong>el</strong>ulósicos<br />
10%<br />
8%<br />
6%<br />
variación en <strong>el</strong><br />
precio <strong>de</strong><br />
etanol<br />
4%<br />
2%<br />
0%<br />
-25% -20% -15% -10% -5% 0%<br />
-2%<br />
5% 10% 15% 20% 25%<br />
inversión<br />
precio mat.prima<br />
precio <strong><strong>de</strong>l</strong> coproducto<br />
precio energía<br />
-4%<br />
-6%<br />
-8%<br />
-10%<br />
Figura 8.8. Sensibilidad <strong><strong>de</strong>l</strong> costo <strong><strong>de</strong>l</strong> etanol producido <strong>de</strong> maíz vía seca<br />
78
<strong>Potenciales</strong> y <strong>Viabilidad</strong> <strong><strong>de</strong>l</strong> <strong>Uso</strong> <strong>de</strong> <strong>Bioetanol</strong> y <strong>Biodies<strong>el</strong></strong> <strong>para</strong> <strong>el</strong> Transporte en México (SENER-BID-GTZ)<br />
Task 5: Ethanol and ETBE production and end-use in Mexico<br />
En las gráficas anteriores se observa como, <strong>de</strong> una manera general, variaciones en <strong>el</strong> precio <strong>de</strong><br />
la materia prima afecta bastante <strong>el</strong> precio final <strong><strong>de</strong>l</strong> etanol. Eso es más evi<strong>de</strong>nte <strong>para</strong> los<br />
contextos adon<strong>de</strong> la inversión no es tan r<strong>el</strong>evante, sea porque se trata <strong>de</strong> una <strong>de</strong>stilería anexa,<br />
casos <strong><strong>de</strong>l</strong> uso <strong>de</strong> las mi<strong>el</strong>es, sea porque <strong>el</strong> factor <strong>de</strong> utilización reduce <strong>el</strong> peso r<strong>el</strong>ativo <strong>de</strong> las<br />
inversiones, como <strong>para</strong> <strong>el</strong> maíz. Para <strong>el</strong> caso en que se incluye la hidrólisis, ocurre<br />
exactamente al revés, con las inversiones siendo <strong>el</strong> factor más importante. Otro punto a<br />
comentar es la manera como los coproductos afectan: <strong>para</strong> la mi<strong>el</strong> rica <strong>de</strong> caña, <strong>el</strong> azúcar que<br />
se <strong>de</strong>ja <strong>de</strong> producir es una perdida, y por lo tanto, altos precios significan mayores perdidas,<br />
mientras <strong>para</strong> <strong>el</strong> maíz, buenos precios <strong>para</strong> <strong>el</strong> DDG representan un <strong>de</strong>scuento adicional en <strong>el</strong><br />
precio, sin indicar impactos r<strong>el</strong>evantes.<br />
Concluyendo <strong>el</strong> capítulo, un comentario metodológico. Las inversiones presentadas reflejan<br />
únicamente los costos <strong>de</strong> capital <strong>para</strong> la planta agroindustrial y no consi<strong>de</strong>ran los costos<br />
agrícolas, <strong>de</strong> <strong>de</strong>sarrollo <strong>de</strong> plantaciones, evi<strong>de</strong>ntemente necesarios <strong>para</strong> promover la<br />
producción <strong>de</strong> materia prima. Estos costos están contabilizados en la formación <strong><strong>de</strong>l</strong> precio <strong>de</strong><br />
la materia prima, cuyo precio <strong>de</strong>be tomar en cuenta todos los costos efectivamente incurridos.<br />
De esa forma, es correcto y más sencillo adoptar la biomasa utilizada a precios exógenos y<br />
consi<strong>de</strong>rar como un insumo <strong>de</strong> producción. Sin embargo, es interesante reconocer que la<br />
formación <strong>de</strong> campos <strong>de</strong> cultivo, incluyendo por ejemplo pre<strong>para</strong>ción <strong>de</strong> su<strong>el</strong>o, eventualmente<br />
obras <strong>de</strong> drenaje o riego, pue<strong>de</strong> representar costos significativos. Como una referencia que<br />
indica la magnitud r<strong>el</strong>ativa <strong>de</strong> tales costos, en Brasil, las inversiones permanentes <strong>para</strong><br />
producción <strong>de</strong> caña son consi<strong>de</strong>radas como formación <strong>de</strong> capital fijo agrícola y valen 47% <strong>de</strong><br />
las inversiones industriales (Consecana, 2006). Igualmente podrían ser consi<strong>de</strong>radas las<br />
inversiones aguas abajo <strong><strong>de</strong>l</strong> proceso productivo <strong>de</strong> etanol, asociadas al almacenamiento y<br />
logística, pero son r<strong>el</strong>ativamente reducidas frente a los costos usuales en la movimentación <strong>de</strong><br />
combustibles.<br />
79
<strong>Potenciales</strong> y <strong>Viabilidad</strong> <strong><strong>de</strong>l</strong> <strong>Uso</strong> <strong>de</strong> <strong>Bioetanol</strong> y <strong>Biodies<strong>el</strong></strong> <strong>para</strong> <strong>el</strong> Transporte en México (SENER-BID-GTZ)<br />
Task 5: Ethanol and ETBE production and end-use in Mexico<br />
9. Conclusiones<br />
México presenta condiciones a<strong>de</strong>cuadas <strong>para</strong> promover la producción y uso <strong>de</strong> etanol<br />
combustible, con potenciales ventajas económicas, sociales y ambientales. Des<strong>de</strong> <strong>el</strong> punto <strong>de</strong><br />
vista <strong>de</strong> la <strong>de</strong>manda, la adopción <strong><strong>de</strong>l</strong> etanol ofrece la posibilidad <strong>de</strong> sustituir o disminuir <strong>el</strong><br />
consumo <strong>de</strong> gasolina y componentes oxigenantes (MTBE y TAME), productos importados en<br />
volúmenes crecientes 5 . A<strong>de</strong>más, esos aditivos son compuestos ambientalmente cuestionados y<br />
progresivamente prohibidos en diversos estados <strong>de</strong> Estados Unidos. Por <strong>el</strong> lado <strong>de</strong> la oferta,<br />
condiciones favorables <strong>de</strong> clima y disponibilida<strong>de</strong>s <strong>de</strong> tierra, conjugadas a oportunidad <strong>de</strong><br />
dinamizar activida<strong>de</strong>s agroindustriales y mejorar la participación <strong>de</strong> fuentes renovables en la<br />
matriz energética, son algunos <strong>de</strong> los factores que tien<strong>de</strong>n a impulsar <strong>el</strong> etanol combustible en<br />
la realidad mexicana.<br />
En los estudios <strong>de</strong>sarrollados en los párrafos anteriores <strong>para</strong> caracterizar las necesida<strong>de</strong>s y<br />
disponibilida<strong>de</strong>s prospectivas <strong>de</strong> etanol, fueran consi<strong>de</strong>rados diversas materias primas y<br />
tecnologías <strong>de</strong> conversión, <strong>de</strong>terminándose los costos e inversiones unitarias respectivas, que<br />
permitirán estimar los requerimientos <strong>de</strong> área cultivada, número <strong>de</strong> unida<strong>de</strong>s <strong>de</strong> producción e<br />
inversiones, frente a tres escenarios <strong>de</strong> <strong>de</strong>manda <strong>de</strong> etanol. De una manera general, la caña <strong>de</strong><br />
azúcar, como mi<strong>el</strong> pobre y jugo directo, y <strong>el</strong> maíz (con <strong>el</strong>evada productividad) en proceso vía<br />
seca presentaran costos más bajos. Obsérvese que estos casos correspon<strong>de</strong>n a tecnologías<br />
convencionales y conocidas. Los casos evaluados <strong>de</strong> materias primas innovadoras y procesos<br />
en <strong>de</strong>sarrollo presentaran indicadores económicos con baja competitividad.<br />
Para los tres escenarios <strong>de</strong> <strong>de</strong>manda <strong>de</strong> etanol, se estimó una <strong>de</strong>manda <strong>de</strong> 412 mil m 3 /año <strong>para</strong><br />
sustitución <strong>de</strong> la producción local <strong>de</strong> MTBE por ETBE, 912 mil m 3 /año <strong>para</strong> sustitución total<br />
<strong>de</strong> MTBE por etanol por etanol en 44% <strong>de</strong> la gasolina utilizada en México y 3,897 mil m 3 /año<br />
<strong>para</strong> mezcla <strong>de</strong> 10% <strong>de</strong> etanol en toda la gasolina <strong><strong>de</strong>l</strong> país. Para dar una i<strong>de</strong>a <strong>de</strong> los resultados<br />
cuanto a producción <strong>de</strong> etanol, <strong>para</strong> <strong>el</strong> escenario <strong>de</strong> <strong>de</strong>manda más alta y consi<strong>de</strong>rando<br />
respectivamente la caña <strong>de</strong> azúcar (jugo directo) y <strong>el</strong> maíz como materias primas, serian<br />
requeridas aproximadamente 800 mil y 980 mil hectáreas, con inversiones <strong>de</strong> 2,400 y 1,586<br />
millones <strong>de</strong> dólares en las plantas agroindustriales. A ese niv<strong>el</strong> <strong>de</strong> producción, <strong>el</strong> ahorro <strong>de</strong><br />
divisas anual seria, a precios actuales, <strong>de</strong> 1,754 millones <strong>de</strong> dólares.<br />
Asumiendo precios <strong>para</strong> <strong>el</strong> etanol al niv<strong>el</strong> <strong>de</strong> paridad con otros productos <strong>de</strong> la industria<br />
azucarera, se constata que <strong>el</strong> biocombustible producido a partir <strong>de</strong> caña y maíz mediante<br />
procesos convencionales presenta competitividad económica frente a los precios recientes y<br />
corrientes <strong>de</strong> la gasolina y <strong><strong>de</strong>l</strong> MTBE. Particularmente <strong>para</strong> <strong>el</strong> etanol <strong>de</strong> caña, esta<br />
competitividad es clara <strong>para</strong> <strong>el</strong> etanol producido a partir <strong>de</strong> m<strong>el</strong>azas, <strong>de</strong>pen<strong>de</strong> <strong>de</strong> la<br />
configuración <strong>de</strong> precios <strong>para</strong> <strong>el</strong> etanol sustituyendo azúcar producido a precios <strong>de</strong> mercado<br />
abierto y ciertamente no existe <strong>para</strong> <strong>el</strong> etanol remplazando azúcar vendido a precios <strong>de</strong> los<br />
mercados preferentes.<br />
Cabe observar que las conclusiones r<strong>el</strong>ativas a costos <strong>de</strong> etanol a partir <strong>de</strong> jugo directo y maíz<br />
se basan en materias primas evaluadas a su costo agrícola, al niv<strong>el</strong> <strong>de</strong> factores <strong>de</strong> producción.<br />
En <strong>el</strong> caso que se tome la materia prima a precios <strong>de</strong> mercado mexicano (por ejemplo <strong>el</strong> precio<br />
5 Cabe recordar que en <strong>el</strong> Escenario 1, se propone reducir la producción nacional <strong>de</strong> MTBE, no<br />
sustituir la importación <strong>de</strong> ese componente.<br />
80
<strong>Potenciales</strong> y <strong>Viabilidad</strong> <strong><strong>de</strong>l</strong> <strong>Uso</strong> <strong>de</strong> <strong>Bioetanol</strong> y <strong>Biodies<strong>el</strong></strong> <strong>para</strong> <strong>el</strong> Transporte en México (SENER-BID-GTZ)<br />
Task 5: Ethanol and ETBE production and end-use in Mexico<br />
KARBE <strong>para</strong> la caña), resulta un costo <strong>de</strong> producción <strong>para</strong> <strong>el</strong> etanol significativamente más<br />
<strong>el</strong>evado, que solamente con soporte fiscal podría alcanzar competitividad, ya que estaría<br />
típicamente por arriba <strong>de</strong> los precios <strong>de</strong> paridad frente a los combustibles convencionales.<br />
En <strong>el</strong> estudio <strong>de</strong> sensibilidad efectuado sobre los precios <strong><strong>de</strong>l</strong> etanol se observó que la materia<br />
prima influye mayormente, seguida <strong>de</strong> las inversiones efectuadas en la unidad agroindustrial.<br />
Es interesante notar que <strong>para</strong> <strong>el</strong> maíz, los costos más <strong>el</strong>evados <strong>de</strong> la materia prima<br />
com<strong>para</strong>tivamente a la caña, la más <strong>de</strong>morada utilización <strong>de</strong> la unidad agroindustrial al largo<br />
<strong><strong>de</strong>l</strong> año llevó a resultados finales semejantes, <strong>para</strong> <strong>el</strong> costo <strong><strong>de</strong>l</strong> etanol.<br />
Los estudios realizados <strong>de</strong>jan algunas respuestas y nuevas cuestiones. Un primer tema a ser<br />
explorado y <strong>de</strong>finido se refiere a las materias primas a utilizar <strong>para</strong> producción <strong>de</strong> etanol. Entre<br />
las diversas posibilida<strong>de</strong>s se <strong>de</strong>stacan las m<strong>el</strong>azas, <strong>el</strong> jugo directo <strong>de</strong> caña y <strong>el</strong> maíz, por su<br />
productividad, costos y conocimiento agronómico en México. Por los resultados económicos<br />
no es posible afirmarse categóricamente que la caña representa una opción superior al maíz, no<br />
obstante la menor disponibilidad <strong>de</strong> tierras bajo riego, la importancia en usos alimentarios y la<br />
<strong>de</strong>pen<strong>de</strong>ncia <strong>de</strong> maíz importado sean aspectos estratégicos a reducir <strong>el</strong> interés en ese cultivo<br />
<strong>para</strong> fines bioenergéticos. A<strong>de</strong>más, <strong>para</strong> <strong>el</strong> maíz se adoptaran indicadores bastante optimistas,<br />
com<strong>para</strong>tivamente a los adoptados <strong>para</strong> la caña. Otros cultivos también pue<strong>de</strong>n ser<br />
consi<strong>de</strong>rados, pero siempre en nichos específicos pues todavía carecen <strong>de</strong> mejor<br />
fundamentación y los resultados obtenidos no son exactamente estimulantes. En síntesis, sobre<br />
esto punto, es importante enfocar las materias primas <strong>de</strong> manera no restrictiva pero teniendo<br />
en cuenta experiencias previas y datos económicos.<br />
La cuestión anterior inci<strong>de</strong> necesariamente en los precios <strong>de</strong> las materias primas, un tema<br />
crucial <strong>para</strong> <strong>el</strong> sustentado <strong>de</strong>sarrollo <strong><strong>de</strong>l</strong> etanol en México. Por gran participación en los<br />
precios finales y por en<strong>de</strong> en la competitividad, es esencial establecer maneras <strong>de</strong> ampliar la<br />
producción <strong>de</strong> materias primas a bajos precios, mediante incrementos <strong>de</strong> productividad y<br />
otros mecanismos, sin los cuales la sostenabilidad económica <strong><strong>de</strong>l</strong> etanol en México estará<br />
siempre perjudicada.<br />
El presente estudio por supuesto que no agotó <strong>el</strong> amplio y complejo tema <strong>de</strong> las necesida<strong>de</strong>s y<br />
potencialida<strong>de</strong>s <strong><strong>de</strong>l</strong> etanol en la matriz energética mexicana. Seguramente otros y más<br />
<strong>de</strong>tallados trabajos <strong>de</strong>ban ser realizados a partir <strong>de</strong> esa base, sin embargo ya es posible<br />
discernir que México presenta <strong>el</strong>ementos r<strong>el</strong>evantes que favorecen esa evolución energética y<br />
visualizar que, temprano o tar<strong>de</strong>, los mexicanos estarán utilizando combustibles renovables.<br />
En ese sentido es vital pre<strong>para</strong>r <strong>de</strong>s<strong>de</strong> ahora la introducción progresiva <strong>de</strong> la producción y uso<br />
<strong><strong>de</strong>l</strong> etanol en bases consistentes, mirando su efectiva sostenabilidad.<br />
81
<strong>Potenciales</strong> y <strong>Viabilidad</strong> <strong><strong>de</strong>l</strong> <strong>Uso</strong> <strong>de</strong> <strong>Bioetanol</strong> y <strong>Biodies<strong>el</strong></strong> <strong>para</strong> <strong>el</strong> Transporte en México (SENER-BID-GTZ)<br />
Task 5: Ethanol and ETBE production and end-use in Mexico<br />
Bibliografía<br />
ABAM, 2006, “Álcool <strong>de</strong> mandioca atrai investimentos”, Revista da Associação Brasileira<br />
<strong>de</strong> Produtores <strong>de</strong> Amido <strong>de</strong> Mandioca, Paranavaí, Vol 4, nº 13<br />
Almazán, O y González, L. (ICIDCA), 1999, “Estudio <strong>de</strong> alternativas <strong>de</strong> materias primas,<br />
fuentes <strong>de</strong> energía y recursos tecnológicos <strong>para</strong> la producción <strong>de</strong> alcohol carburante en <strong>el</strong><br />
sector azucarero y su impacto en la industria cubana <strong>de</strong> azúcar y <strong>de</strong>rivados”, Proyecto<br />
Promoción <strong>de</strong> Programas <strong>de</strong> Alcohol Carburante: reporte final, FCPB - Fondo<br />
Común <strong>de</strong> Productos Básicos, OIA - Organización Internacional <strong><strong>de</strong>l</strong> Azúcar y<br />
GEPLACEA - Grupo <strong>de</strong> Países Latinoamericanos y <strong><strong>de</strong>l</strong> Caribe Exportadores <strong>de</strong> Azúcar,<br />
São Paulo<br />
An<strong>de</strong>rson, I.C., 2002, Ethanol from Sweet Sorghum, Iowa Energy Center, disponible en<br />
www.energy.iastate.edu/renewable/biomass/cs-anerobic2.html, consultado en mayo <strong>de</strong><br />
2006<br />
ANUR, 2005, “Producción <strong>de</strong> Etanol con Caña <strong>de</strong> Azúcar”, Estrategia <strong>para</strong> áreas <strong>de</strong> riego<br />
con Mo<strong>de</strong>rnización Integral, Asociación Nacional <strong>de</strong> Usuarios <strong>de</strong> Riego, México, D.F<br />
ASAZGUA, 2006, Fabricación <strong>de</strong> Azúcar, Asociación Azucarera <strong>de</strong> Guatemala,<br />
www.asazgua.com.gt, consultado en mayo <strong>de</strong> 2006<br />
Assis, P., 2006, Cogeneración <strong>de</strong> Energía en Ingenios Azucareros, presentación en <strong>el</strong><br />
Encontro Interamericano sobre Biocombustibles, MAPA/IICA, São Paulo<br />
Badger, P.C., 2002, “Ethanol from c<strong>el</strong>lulose: a general review” in: J. Janick and A. Whipkey<br />
(eds.), Trends in new crops and new uses, ASHS Press<br />
CEFP, 2005, Centro <strong>de</strong> Estudios <strong>de</strong> las Finanzas Públicas <strong>de</strong> la H. Cámara <strong>de</strong> Diputados,<br />
disponible en www.cefp.gob.mx, consultado en mayo <strong>de</strong> 2006<br />
CEPAL, 2004, Perspectivas <strong>de</strong> un Programa <strong>de</strong> Biocombustibles en América Central y<br />
Aspectos complementarios <strong>para</strong> la <strong>de</strong>finición <strong>de</strong> un Programa <strong>de</strong> <strong>Bioetanol</strong> en<br />
América Central (pre<strong>para</strong>dos por Horta Nogueira, L.A.), Proyecto CEPAL/GTZ <strong>Uso</strong><br />
Sustentable <strong>de</strong> Hidrocarburos, México, D.F.<br />
CEPAL, 2006, Costos y precios <strong>para</strong> etanol en Centro América, (pre<strong>para</strong>do por Horta<br />
Nogueira, L.A.), Proyecto CEPAL/Gobierno <strong>de</strong> Italia, México, D.F.<br />
CGEE, 2006, Projeto Etanol,documento pr<strong>el</strong>iminar, Centro <strong>de</strong> Gestão <strong>de</strong> Estudos<br />
Estratégicos, Brasília<br />
Chaves Solera, M., 2003, citación en <strong>el</strong> XV Congreso <strong>de</strong> ATACORI, Asociación <strong>de</strong> Técnicos<br />
Azucareros <strong>de</strong> Costa Rica, San José, septiembre <strong>de</strong> 2003<br />
Chaves Solera, M., 2004, La Caña <strong>de</strong> Azúcar como materia prima <strong>para</strong> la Producción <strong>de</strong><br />
Alcohol Carburante, DIECA/LAICA, Costa Rica<br />
CNIAA, 2006, Manual Azucarero Mexicano 2006, Cámara Nacional <strong>de</strong> las Industrias<br />
Azucarera y Alcoholera, México, D.F.<br />
COAAZUCAR, 2005, Desarrollo Operativo Histórico <strong>de</strong> Campo-Fabrica 1988/2004,<br />
Comité <strong>de</strong> la Agroindustria Azucarera, www.coaazucar.org.mx, consultado en mayo <strong>de</strong><br />
2006<br />
82
<strong>Potenciales</strong> y <strong>Viabilidad</strong> <strong><strong>de</strong>l</strong> <strong>Uso</strong> <strong>de</strong> <strong>Bioetanol</strong> y <strong>Biodies<strong>el</strong></strong> <strong>para</strong> <strong>el</strong> Transporte en México (SENER-BID-GTZ)<br />
Task 5: Ethanol and ETBE production and end-use in Mexico<br />
Consecana, 2006, Revisão Consecana- Resultado Final, Documento <strong>de</strong> trabalho, Cons<strong>el</strong>ho<br />
dos Produtores <strong>de</strong> Cana-<strong>de</strong>-açúcar, Açúcar e Álcool do Estado <strong>de</strong> São Paulo<br />
DOE, 2006, Annual Energy Outlook 2006, Department of Energy, Report #:DOE/EIA-0383,<br />
Washington<br />
EIA/DOE, 2006, Energy Information Administration , Departament of Energy,<br />
www.eia.doe.gov, consultado en junio <strong>de</strong> 2006<br />
El Sayed, M.A., Matthews, R., Mortimer, N.D., 2005, Production of Ethanol from Sugar Beet<br />
(Appendix Q), Carbon and Energy Balance for a range o f Biofu<strong>el</strong>s options, DTI<br />
Project B/B6,/00784, URN 03/083, London<br />
ERS/USDA, 2006, Sugar and Sweeteners: Data Tables, Economic Research Service, United<br />
States Department of Agriculture, Washington,<br />
http://www.ers.usda.gov/briefing/sugar/data.htm, acesado en julio <strong>de</strong> 2006<br />
F.O.Licht, 2005, International Sugar and Sweetener Report, Vol.137, no. 27<br />
F.O.Licht, 2006, World Molasses & Feed Ingredients Report, Vol.4, No. 9, January<br />
FAOSTAT, 2006, FAO, disponible en www.fao.org, consultado en mayo y junio <strong>de</strong> 2006<br />
Fi<strong><strong>de</strong>l</strong> Flores Cotera, F. (PEMEX), 2006, Presentación <strong>para</strong> los consultores <strong><strong>de</strong>l</strong> proyecto en<br />
PEMEX Subdirección <strong>de</strong> Planeación, Coordinación y Evaluación en 16/03/2006,<br />
México, D.F.<br />
Finguerut, J., 2005, Simultaneous production of sugar and alcohol from sugarcane,<br />
Proceedings of the XXV Congress of ISSCTnternational Society of Sugar Cane<br />
Technologists, International Society of Sugar Cane Technologists, Guatemala, 2005<br />
Finguerut, J., 2006, Sugar and alcohol integration in Brasil, Encontro Interamericano <strong>de</strong><br />
Biocombustíveis, IICA y Ministério da Agricultura, São Paulo<br />
FSA/USDA, 2006, Price Support Programs: Crop Corn, Grains Sorghum and Soybeans,<br />
Farm Service Agency, United States Department of Agriculture, Washington, 2006<br />
Fundación Emisión, 2005, Feasibility Study for Ethanol Production in Mexico from Maize<br />
and Sugar Cane, BBI International Consulting, México<br />
Furey, R.L., 1985, Volatility Characteristics of Gasoline-Alcohol and Gasoline-Ether Fu<strong>el</strong><br />
Blends, SAE Paper 852116<br />
García, R., 2006, Profesor <strong>de</strong> la Universidad Veracruzana, informaciones personales en<br />
Febrero <strong>de</strong> 2006<br />
GEPLACEA, IICA, OLADE, 1984, Experiencia y Perspectivas en América Latina sobre<br />
Alcohol Carburante, editores Campodónico, M., Diaz, M.A., Veras, A.I., Cáceres, R.,<br />
México D.F.<br />
Gol<strong>de</strong>mberg, J., 1996, "The Evolution of Ethanol Costs in Brazil", Energy Policy, vol. 24,<br />
p.1127-1128<br />
Gómez Fuster, I., 1998, Proyecto Yucalcol (Desarrollo Agroindustrial com Aprovechaminto<br />
<strong>de</strong> las Biomasas Agrícolas Tropicales), Yucalcol SA <strong>de</strong> CV, México, D.F.<br />
Gulati, M. et alli., 1996, “Assessment of ethanol production options for corn products”,<br />
Bioresource Technology, Vol 5, Elsevier Press<br />
83
<strong>Potenciales</strong> y <strong>Viabilidad</strong> <strong><strong>de</strong>l</strong> <strong>Uso</strong> <strong>de</strong> <strong>Bioetanol</strong> y <strong>Biodies<strong>el</strong></strong> <strong>para</strong> <strong>el</strong> Transporte en México (SENER-BID-GTZ)<br />
Task 5: Ethanol and ETBE production and end-use in Mexico<br />
Henniges, O. (Universitat Hohenhein, Department of Agricultural Economics), información<br />
personal, junio <strong>de</strong> 2006<br />
Henniges, O., Zeddies, J., 2003, Fu<strong>el</strong> ethanol production in the USA and Germany - a cost<br />
comparison, F. O. Licht’s World Ethanol and Biofu<strong>el</strong>s Report, Vol 1, No. 11<br />
How<strong>el</strong>er, R., 2003, Cassava in Asia: Present Situation and its Future Potential in Agro-<br />
Industry, CIAT Cassava Office for Asia, Departament of Agriculture, Bangkok<br />
Hurt, C., 2006, “Ethanol and Animals in The Eastern Corn B<strong>el</strong>t: The New Dynamics”,<br />
Weekly Outlook, February 2006, Purdue University and University of Illinois<br />
ICRISAT, 2004, ICRISAT <strong>de</strong>v<strong>el</strong>ops sweet sorghum for ethanol production, International<br />
Crops Research Institute for the Semi-Arid Tropics Report, disponible en<br />
www.icrisat.org/media/2004/media13.htm, consultado en mayo <strong>de</strong> 2006<br />
IEA/EET, 2005, Biofu<strong>el</strong>s for Transport: An International Perspective, International<br />
Energy Agency, Paris<br />
INEGI, 2005, Banco <strong>de</strong> Información Económica y Comité <strong>de</strong> la Agroindustria Azucarera,<br />
según Poy, M.E., 2005<br />
InfoAgro, 2006, Proceso General <strong>de</strong> Fabricación <strong>de</strong> Azúcar, in El cultivo <strong>de</strong> la remolacha<br />
azucarera, disponible en www.infoagro.com/herbaceos/industriales/industriales.asp,<br />
consultado en mayo <strong>de</strong> 2006<br />
Keawsompong, S. et alli., 2003, Ethanol Production from Cassava Chips: Simultaneous<br />
Saccharification and Fermentation Process, disponible en<br />
http://knowledge.biotec.or.th, consultado en mayo <strong>de</strong> 2006<br />
K<strong>el</strong>ly, S., 2006, “Ethanol supplies taut as refiners drop MTBE”, Ethanol Producers<br />
Magazine, June, disponible en www.ethanolproducer.com/article.jsp?article_id=2067,<br />
consultado en julio <strong>de</strong> 2006<br />
Lazcano, I., 2006, Ethanol Feedstock (Borrador final), Documento <strong>de</strong> trabajo <strong><strong>de</strong>l</strong> Proyecto<br />
Feasibility of Biomass-Derived Ethanol as a Fu<strong>el</strong> for Transportation, SENER/BID<br />
Leon<strong>el</strong>, M. et alli., 1999, “Aproveitamento do resíduo da produção <strong>de</strong> etanol a partir <strong>de</strong> far<strong>el</strong>o<br />
<strong>de</strong> mandioca, como fonte <strong>de</strong> fibras dietéticas”, Ciência e Tecnologia dos Alimentos,<br />
vol.19 n.2, Campinas<br />
Macedo, I. C., 2000, Commercial Perspectives of Bioalcohol in Brazil, 1 st . World Conference<br />
on Biomass for Energy and Industry, Sevilla<br />
Macedo, I.C., 2005, Biomass as a Source of Energy, Report prepared for the InterAca<strong>de</strong>my<br />
Council study on “Transitions to Sustainable Energy Systems”, draft<br />
Macedo, I.C., Leal, M.R.L.V., Hassuani, J.S., 2001, Sugar Cane Residues for Power<br />
generation in the Sugar / Ethanol Mills in Brazil, Energy for Sustainable<br />
Dev<strong>el</strong>opment, v. 5, n. 1, p. 77-82, 2001<br />
McAloon, A. et alli, 2000, Determining the Cost of Producing Ethanol from Corn Starch<br />
and Lignoc<strong>el</strong>lulosic Feedstocks, Report NREL/TP -580-28893, October 2000<br />
MINAE, 2005, Avances Plan Piloto <strong>de</strong> Gasohol en Costa Rica, I Encontro Interamericano<br />
<strong>de</strong> Biocombustíveis, MAPA/IICA , São Paulo<br />
84
<strong>Potenciales</strong> y <strong>Viabilidad</strong> <strong><strong>de</strong>l</strong> <strong>Uso</strong> <strong>de</strong> <strong>Bioetanol</strong> y <strong>Biodies<strong>el</strong></strong> <strong>para</strong> <strong>el</strong> Transporte en México (SENER-BID-GTZ)<br />
Task 5: Ethanol and ETBE production and end-use in Mexico<br />
Morgan, O., IEA forecast of future oil price rises by a third, The Guardian, 6/11/2005<br />
Nan, L., Best.G. and Carvalho Neto, C.C., 1994, Integrated energy systems in China - The<br />
cold Northeastern region experience, FAO, Rome<br />
Nastari, P.M., 2005, Etanol <strong>de</strong> Cana <strong>de</strong> Açúcar: o combustív<strong>el</strong> <strong>de</strong> hoje, Seminário<br />
PROÁLCOOL- 30 anos <strong>de</strong>pois, Agência Estado - Única, São Paulo, Novembro 2005<br />
NYBOT, 2006, NYBOT Markets: Sugar, New Cork Board of Tra<strong>de</strong>, www.nybot.com,<br />
consultado en mayo <strong>de</strong> 2006<br />
Oliverio, L, 2006, informaciones personales sobre tecnología e inversiones en <strong>de</strong>stilerías <strong>de</strong><br />
etanol, Piracicaba<br />
Oliverio, L., 2005, Processo DHR - Dedini Hidrólise Rápida, Dedini Indústrias <strong>de</strong> Base,<br />
Piracicaba<br />
PEMEX, 2004, Mecanismos <strong>de</strong> Precios <strong>de</strong> Gasolina y Dies<strong>el</strong> en México, Gerencia <strong>de</strong><br />
Evaluación <strong>de</strong> Operaciones, Dirección Corporativa <strong>de</strong> Operaciones, México, D.F.<br />
PEMEX, 2005, Etanol <strong>de</strong> origen agrícola como oxigenante <strong>para</strong> combustibles,<br />
presentación <strong>de</strong> Bueno T, J en <strong>el</strong> Foro: Etanol, Caña <strong>de</strong> Azúcar, SAGARPA, Noviembre<br />
<strong>de</strong> 2005<br />
PEMEX, 2006, Pronóstico <strong>de</strong> Ventas <strong>de</strong> gasolinas y dies<strong>el</strong>, 2006-2014, Gerencia <strong>de</strong><br />
Evaluación <strong>de</strong> Operaciones, Dirección Corporativa <strong>de</strong> Operaciones, México, D.F.<br />
Poy, M.E, 2005, "Prospectiva <strong>de</strong> la Competitividad <strong>de</strong> la Producción Azucarera en México y<br />
Alternativas", Foro: La Competencia Económica <strong><strong>de</strong>l</strong> Sector Agropecuario Mexicano<br />
en <strong>el</strong> Ámbito <strong><strong>de</strong>l</strong> Libre Comercio, México, D.F.<br />
Poy, M.E., 1998, “Representa <strong>el</strong> etanol una alternativa viable <strong>para</strong> la agroindustria <strong>de</strong> la caña<br />
<strong>de</strong> azúcar?”, Revista Ingenio, CNIAA, Octubre <strong>de</strong> 1998<br />
Poy, M.E., 2005A, “Retos y Perspectivas <strong>de</strong> la Agroindustria <strong>de</strong> la Caña <strong>de</strong> Azúcar Nacional<br />
bajo las Condiciones <strong>de</strong> Transición Imperantes”, Capacitación <strong>para</strong> la Competitividad<br />
en Fábricas <strong>de</strong> Azúcar, Centro <strong>de</strong> Tecnología Avanzada CIATEQ, Queretaro<br />
Prakash, C., 1998, Use of Higher than 10 volume percent Ethanol/Gasoline Blends In<br />
Gasoline Powered Vehicles, Transportation Systems Branch/Air Pollution Prevention<br />
Directorate/Environment Canada<br />
Presi<strong>de</strong>ncia <strong>de</strong> la República, 2005, Exportará México 100 mil ton<strong>el</strong>adas <strong>de</strong> azúcar a EU sin<br />
aranc<strong>el</strong>, disponible en www.presi<strong>de</strong>ncia.gob.mx/buenasnoticias/?contenido=22573, 18<br />
<strong>de</strong> Diciembre <strong>de</strong> 2005<br />
Quintero, L.E. et al., Costos <strong>de</strong> Producción <strong>de</strong> Yuca en Colombia, Observatorio<br />
Agroca<strong>de</strong>nas Colombia, Ministerio <strong>de</strong> Agricultura y Desarrollo Rural, Bogotá, 2004<br />
Rains G.C. et al., 2005, “Sweet Sorghum for a Piedmont Ethanol Industry”, New Crops,<br />
Wiley, New York<br />
RIRDC, 2005, Pr<strong>el</strong>iminary feasibility of ethanol production from sugar beet in NE<br />
Tasmania, Rural Industries Research and Dev<strong>el</strong>opment Corporation, Publication No<br />
05/012<br />
85
<strong>Potenciales</strong> y <strong>Viabilidad</strong> <strong><strong>de</strong>l</strong> <strong>Uso</strong> <strong>de</strong> <strong>Bioetanol</strong> y <strong>Biodies<strong>el</strong></strong> <strong>para</strong> <strong>el</strong> Transporte en México (SENER-BID-GTZ)<br />
Task 5: Ethanol and ETBE production and end-use in Mexico<br />
Rodríguez, N., 2006, México´s Energy Picture (Borrador final), Documento <strong>de</strong> trabajo <strong><strong>de</strong>l</strong><br />
Proyecto Feasibility of Biomass-Derived Ethanol as a Fu<strong>el</strong> for Transportation,<br />
SENER/BID<br />
Ross<strong>el</strong>, C.E.V., 2005, Hidrólise do bagaço, Grupo Energia, Projeto Etanol, NIPE,<br />
Universida<strong>de</strong> Estadual <strong>de</strong> Campinas, Campinas<br />
SAGARPA, 2004, Economía <strong><strong>de</strong>l</strong> Etanol, Subsecretaría <strong>de</strong> Fomento a los Agronegocios,<br />
México, D.F.<br />
Sánchez O..J., Carlos Ari<strong>el</strong> Cardona, C.A., 2005, Producción biotecnológica <strong>de</strong> alcohol<br />
carburante I: obtención a partir <strong>de</strong> diferentes materias primas,<br />
INCI v.30 n.11, Caracas<br />
SEMARNAT, 2006, Especificaciones adicionales <strong>de</strong> Gasolinas por Región (Tabla 6),<br />
Normativa 086, SEMARNAT-SENER-SCFI-2005, Especificaciones <strong>de</strong> los<br />
combustibles fósiles <strong>para</strong> protección ambiental, publicada en 30 <strong>de</strong> enero <strong>de</strong> 2006<br />
SENER, 2005, Prospectiva sobre la Utilización <strong>de</strong> las Energías Renovables en México:<br />
Una Visión al Año 2030, Secretaría <strong>de</strong> Energía, Subsecretaria <strong>de</strong> Planeación Energética<br />
y Desarrollo Tecnológico, México, D.F.<br />
Sun, Y., Cheng, J., 2002, “Hydrolysis of lignoc<strong>el</strong>lulosic materials for ethanol production: a<br />
review”, Bioresource Technology, vol 83, Elsevier Press<br />
Terciote, R., “Análise e Estimativa dos Impactos Econômicos do Investimento na<br />
Implementação <strong>de</strong> Usinas <strong>de</strong> Cana <strong>de</strong> Açúcar”, V Congresso Brasileiro <strong>de</strong><br />
Planejamento Energético, Brasília, 2006<br />
TEREOS, 2006, Bio-Ethanol, http://www.tereos.com, consultado en mayo <strong>de</strong> 2006<br />
Trinda<strong>de</strong>, S., 1985, Fu<strong>el</strong> Ethanol Issues in Thailand: Ethanol Production, Stillage Disposal<br />
and Market Penetration, Report to UN/DTCD (draft), New York<br />
Venturi, P., Venturi, G., 2003, “Analysis of energy comparison for crops in European<br />
agricultural systems”, Biomass and Bioenergy, 25, pg. 235 – 255.<br />
Worldwatch Institute, 2006, Biofu<strong>el</strong>s for Transportation: Global Potential and<br />
Implications for Sustainable Agriculture and Energy in the 21st Century, prepared<br />
for the German Fe<strong>de</strong>ral Ministry of Food, Agriculture and Consumer Protection<br />
(BMELV), in cooperation with the Agency for Technical Cooperation (GTZ) and the<br />
AAgency of Renewable Resources (FNR), Washington, D.C.<br />
Ximena, C. (ECOPETROL), Programa <strong>de</strong> Alcohol Carburante en Colombia, ASOCAÑA,<br />
Bogotá, 2004<br />
Yancey, M., “Project Dev<strong>el</strong>opment in a Booming Ethanol Industry”, Joint Forum on<br />
Biomass, Biofu<strong>el</strong>s and Bioproducts, University of California, Davis/California Institute<br />
of Food and Agricultural Research, CIFAR Research Conference XXI, 2006<br />
86
Anexo 1.<br />
<strong>Potenciales</strong> y <strong>Viabilidad</strong> <strong><strong>de</strong>l</strong> <strong>Uso</strong> <strong>de</strong> <strong>Bioetanol</strong> y <strong>Biodies<strong>el</strong></strong> <strong>para</strong> <strong>el</strong> Transporte en México (SENER-BID-GTZ)<br />
Task 5: Ethanol and ETBE production and end-use in Mexico<br />
Procesamiento y transformación <strong>de</strong> la caña en azúcar y etanol<br />
(adaptado <strong>de</strong> AZAGUA, 2006)<br />
1. Recepción y Lavado<br />
Una vez que la caña <strong>de</strong> azúcar llega al patio <strong>de</strong> recepción en <strong>el</strong> ingenio es <strong>de</strong>scargada y <strong>el</strong><br />
exceso <strong>de</strong> tierra y piedras son removidos mediante <strong>el</strong> lavado <strong>de</strong> la caña. Esta etapa es intensiva<br />
en <strong>el</strong> consumo <strong>de</strong> agua y uno <strong>de</strong> los puntos críticos <strong>de</strong> contaminación <strong>de</strong> no tomarse las<br />
medidas <strong>para</strong> la recuperación y ahorro <strong><strong>de</strong>l</strong> agua utilizada, especialmente si se <strong>de</strong>scarga sucia a<br />
los ríos. Se lava la caña <strong>para</strong> <strong>el</strong>iminar las impurezas y materia extraña como tierra que le resta<br />
pureza y color al azúcar refinado y disminuye <strong>el</strong> rendimiento <strong>de</strong> azúcar por ton<strong>el</strong>ada <strong>de</strong> caña<br />
molida.<br />
2. Molienda o trapiche<br />
Luego la caña lavada pasa a cuchillos picadores que reducen <strong>el</strong> tamaño <strong>de</strong> la estaca, pasando<br />
entonces por los molinos que se<strong>para</strong> <strong>el</strong> bagazo <strong><strong>de</strong>l</strong> jugo o guarapo <strong>de</strong> caña. El bagazo es<br />
aprovechado por los ingenios como fuente <strong>de</strong> combustible <strong>para</strong> las cal<strong>de</strong>ras que suplen las<br />
necesida<strong>de</strong>s energéticas <strong><strong>de</strong>l</strong> proceso, pudiendo lograr la autosuficiencia <strong>de</strong> energía y incluso<br />
generar exce<strong>de</strong>ntes.<br />
3. Clarificación<br />
El jugo que lleva un color ver<strong>de</strong> oscuro, es ácido con un grado <strong>de</strong> turbi<strong>de</strong>z, pasa al clarificador<br />
don<strong>de</strong> se remueven las impurezas solubles e insolubles. El proceso emplea cal, cerca <strong>de</strong> medio<br />
kg por ton<strong>el</strong>ada <strong>de</strong> caña, neutralizando la aci<strong>de</strong>z. Al calentarse la pre<strong>para</strong>ción se coagulan las<br />
albúminas, grasas, ceras y gomas y <strong>el</strong> precipitado atrapa los sólidos que pasan a formar parte<br />
<strong>de</strong> la cachaza que pue<strong>de</strong> ser utilizado como abono orgánico.<br />
4. Evaporación<br />
El jugo clarificado pasa a un proceso <strong>de</strong> evaporación al vacío don<strong>de</strong> pier<strong>de</strong> dos terceras parte<br />
<strong>de</strong> su agua al final <strong>de</strong> 3 o 4 <strong>de</strong> las torres <strong>de</strong> evaporación en serie, que van produciendo un<br />
vacío progresivo. El vapor <strong>de</strong> la última torre va a un con<strong>de</strong>nsador don<strong>de</strong> se pue<strong>de</strong> recuperar<br />
agua <strong>para</strong> las necesida<strong>de</strong>s <strong><strong>de</strong>l</strong> procesamiento en <strong>el</strong> ingenio.<br />
5. Cristalización<br />
El jarabe o m<strong>el</strong>adura (65% sólidos y 35% agua) producido en la evaporación pasa a un tacho<br />
don<strong>de</strong> se evapora al vacío aún más hasta alcanzar <strong>el</strong> punto <strong>de</strong> saturación. Se aña<strong>de</strong>n pequeños<br />
granos <strong>de</strong> azúcar al tacho <strong>para</strong> servir <strong>de</strong> semilla, <strong><strong>de</strong>l</strong> cual sirven <strong>de</strong> núcleo <strong>para</strong> la formación <strong>de</strong><br />
los cristales <strong>de</strong> azúcar.<br />
87
<strong>Potenciales</strong> y <strong>Viabilidad</strong> <strong><strong>de</strong>l</strong> <strong>Uso</strong> <strong>de</strong> <strong>Bioetanol</strong> y <strong>Biodies<strong>el</strong></strong> <strong>para</strong> <strong>el</strong> Transporte en México (SENER-BID-GTZ)<br />
Task 5: Ethanol and ETBE production and end-use in Mexico<br />
6. Centrífugas<br />
La mezcla espesa <strong>de</strong> mi<strong>el</strong> y cristales <strong>de</strong> azúcar es conocido como “massecuite” y <strong><strong>de</strong>l</strong> tacho<br />
pasa a las centrífugas don<strong>de</strong> se se<strong>para</strong> la m<strong>el</strong>aza <strong>de</strong> la azúcar cruda mediante la fuerza<br />
centrífuga. La m<strong>el</strong>aza va a los tanques <strong>de</strong> almacenamiento y su uso final es múltiple<br />
(alcoholes, licores, sucroquímicos y pienso animal).<br />
7. Secadores<br />
El azúcar crudo centrifugado pasa a los secadores <strong>para</strong> <strong>el</strong>iminar la humedad restante y luego es<br />
almacenada en sacos o a gran<strong>el</strong>. El azúcar crudo pue<strong>de</strong> seguir al siguiente paso, cual es la<br />
refinación, sin embargo <strong>el</strong> grueso <strong>de</strong> la producción se almacena y exporta en este estado.<br />
8. Refinación<br />
En esta etapa se se<strong>para</strong> y clasifica <strong>el</strong> azúcar por su calidad y granulometría antes <strong>de</strong> enviar al<br />
consumo nacional o exportación.<br />
9. Fermentación<br />
La fermentación alcohólica pue<strong>de</strong> llevarse a cabo por lotes (80% <strong>de</strong> los casos en Brasil) o en<br />
forma continua. El proceso típico <strong>de</strong> producción <strong>de</strong> alcohol a partir <strong>de</strong> m<strong>el</strong>azas o jugo <strong>de</strong> caña<br />
(proceso M<strong>el</strong>le-Boinot), compren<strong>de</strong> la esterilización previa <strong>de</strong> la materia prima seguida <strong><strong>de</strong>l</strong><br />
ajuste <strong><strong>de</strong>l</strong> pH con H 2 SO 4 y <strong>de</strong> los azucares a valores <strong>de</strong> 14-22º Brix. El mosto obtenido se<br />
somete a fermentación. El vino resultante se <strong>de</strong>canta y centrifuga <strong>para</strong> enviar a <strong>de</strong>stilación,<br />
mientras la levadura se recircula a los fermentadores, luego <strong>de</strong> su reactivación. Durante la<br />
fermentación es necesario añadir algunas nutrientes como fuentes <strong>de</strong> nitrógeno y fósforo <strong>para</strong><br />
obtener óptimos resultados, siendo los principales sulfato <strong>de</strong> amonio, urea y fosfato<br />
diamónico.<br />
10. Destilación<br />
La fermentación produce una solución diluida <strong>de</strong> etanol en agua <strong>de</strong> menos 10% en peso <strong>de</strong><br />
etanol. buscando obtener una concentración más <strong>el</strong>evada, la se<strong>para</strong>ción <strong><strong>de</strong>l</strong> etanol <strong><strong>de</strong>l</strong> vino se<br />
procesa en columnas <strong>de</strong> <strong>de</strong>stilación que progresivamente concentran la solución alcohólica,<br />
hasta <strong>el</strong> estado azeotrópico (aproximadamente 95,6% en peso <strong>de</strong> etanol). Un subproducto<br />
importante <strong>de</strong> la <strong>de</strong>stilación es la vinaza, un efluente con alto contenido <strong>de</strong> potasa que pue<strong>de</strong><br />
ser usado como abono, producido a razón <strong>de</strong> cerca <strong>de</strong> 10 a 16 litros por litro <strong>de</strong> etanol<br />
producido.<br />
11. Deshidratación<br />
Debido a que las mezclas <strong>de</strong> etanol y gasolina <strong>de</strong>ben estar libres <strong>de</strong> agua <strong>para</strong> evitar problemas<br />
<strong>de</strong> se<strong>para</strong>ción <strong>de</strong> fases en los tanques <strong>de</strong> almacenamiento y suministro, <strong>el</strong> etanol a ser<br />
mezclado a la gasolina <strong>de</strong>be contener menos que 0,5% <strong>de</strong> agua. En ese caso no es posible<br />
utilizar procesos clásicos <strong>de</strong> <strong>de</strong>stilación, siendo necesario emplear otras tecnologías, como la<br />
88
<strong>Potenciales</strong> y <strong>Viabilidad</strong> <strong><strong>de</strong>l</strong> <strong>Uso</strong> <strong>de</strong> <strong>Bioetanol</strong> y <strong>Biodies<strong>el</strong></strong> <strong>para</strong> <strong>el</strong> Transporte en México (SENER-BID-GTZ)<br />
Task 5: Ethanol and ETBE production and end-use in Mexico<br />
<strong>de</strong>stilación azeotrópica empleando benceno, ciclohexano o pentano como agentes <strong>de</strong><br />
se<strong>para</strong>ción o la adsorción por balanceo <strong>de</strong> presión usando tamices moleculares o monoetileno<br />
glicol.<br />
En la próxima página se presenta <strong>el</strong> esquema <strong>de</strong> equipos y <strong>el</strong> flujograma <strong>de</strong> un ingenio<br />
brasileño (Usina Costa Pinto, Grupo COSAN, Piracicaba), evi<strong>de</strong>nciando las etapas anteriores<br />
y la producción simultanea <strong>de</strong> azúcar y etanol. En la actualidad, tal planta utiliza<br />
aproximadamente 80% <strong><strong>de</strong>l</strong> azúcar <strong>de</strong> la caña <strong>para</strong> azúcar y <strong>el</strong> restante <strong>para</strong> producción <strong>de</strong><br />
etanol.<br />
89
<strong>Potenciales</strong> y <strong>Viabilidad</strong> <strong><strong>de</strong>l</strong> <strong>Uso</strong> <strong>de</strong> <strong>Bioetanol</strong> y <strong>Biodies<strong>el</strong></strong> <strong>para</strong> <strong>el</strong> Transporte en México (SENER-BID-GTZ)<br />
Task 5: Ethanol and ETBE production and end-use in Mexico<br />
90
<strong>Potenciales</strong> y <strong>Viabilidad</strong> <strong><strong>de</strong>l</strong> <strong>Uso</strong> <strong>de</strong> <strong>Bioetanol</strong> y <strong>Biodies<strong>el</strong></strong> <strong>para</strong> <strong>el</strong> Transporte en México (SENER-BID-GTZ)<br />
Task 5: Ethanol and ETBE production and end-use in Mexico<br />
Anexo 2.<br />
Comentarios sobre costos <strong>de</strong> producción <strong>de</strong> etanol <strong>de</strong> caña <strong>de</strong><br />
azúcar<br />
Es oportuno en los aspectos <strong>de</strong> costo <strong>de</strong> producción <strong>de</strong> etanol empleando caña, mencionar dos<br />
comentarios <strong>de</strong> un estudioso <strong>de</strong> la industria azucarera centroamericana, Chaves Solera. Al<br />
analizar la cuestión <strong>de</strong> los precios <strong><strong>de</strong>l</strong> alcohol <strong>para</strong> su introducción en <strong>el</strong> mercado <strong>de</strong><br />
combustibles <strong>de</strong> Costa Rica, reforzando la dificultad <strong>de</strong> conocer valores consistentes <strong>de</strong> costo<br />
<strong>para</strong> <strong>el</strong> etanol, dijo que “este resulta ser uno <strong>de</strong> los puntos más álgidos <strong>de</strong> cualquier iniciativa<br />
<strong>de</strong> esta naturaleza que se pretenda <strong>de</strong>sarrollar, la cual no es sin embargo exclusiva <strong><strong>de</strong>l</strong> país,<br />
puesto que otras naciones don<strong>de</strong> se han adoptado programas con biocombustibles similares<br />
también han surgido diferencia entre las partes. La dificultad surge fundamentalmente porque<br />
en la <strong>de</strong>finición <strong><strong>de</strong>l</strong> precio a pagar por <strong>el</strong> etanol intermedian varios actores (públicos y<br />
privados, institucionales e individuales), y están involucrados a<strong>de</strong>más asuntos <strong>de</strong> índole<br />
económica, social, técnica y <strong>de</strong> infraestructura, que son <strong>de</strong>terminantes”, (Chaves Solera,<br />
2003). Los stakehol<strong>de</strong>rs tienen que estar involucrados en los procesos <strong>de</strong>cisorios <strong>para</strong> que haya<br />
sostenabilidad <strong>de</strong> etanol <strong>de</strong> caña <strong>de</strong> azúcar en México. En un trabajo presentado en 2003, este<br />
mismo investigador presentó una revisión <strong>de</strong> costos <strong>de</strong> producción <strong>de</strong> etanol <strong>de</strong> caña <strong>de</strong><br />
azúcar, que muestra una gran dispersión entre los países:<br />
“Según Echeverri (2003), en Colombia los costos <strong>de</strong> producción <strong><strong>de</strong>l</strong> alcohol<br />
obtenidos a partir <strong>de</strong> la caña <strong>de</strong> azúcar se estiman entre 0,27 y 0,30 US$/litro.<br />
Bonomi (2003) reporta <strong>para</strong> <strong>el</strong> caso <strong>de</strong> Brasil, costos <strong>de</strong> producción entre 0,20 y<br />
0,19 US$/litro. Cala (2003) señala que en <strong>el</strong> caso <strong>de</strong> Colombia, se estiman costos<br />
<strong>de</strong> producción variando entre US$ 0,24 y 0,30 US$/litro. En otros países se<br />
reportan (LMC, 2003) como promedio <strong>para</strong> <strong>el</strong> periodo 1998-2001, costos <strong>de</strong><br />
producción muy variables <strong>para</strong> <strong>el</strong> alcohol, como acontece en Australia (0,145<br />
US$/litro), Brasil (0,222 US$/litro), Francia (0,386 US$/litro), India (0,261<br />
US$/litro), México (0,185 US$/litro), Tailandia (0,152 US$/litro), USA (0,231 a<br />
0,286 US$/litro)” (Chaves Solera, 2004).<br />
Una indicación <strong><strong>de</strong>l</strong> proceso <strong>de</strong> aprendizaje y la consecuente reducción <strong>de</strong> los costos en la<br />
agroindustrial <strong><strong>de</strong>l</strong> etanol en Brasil es presentada en la Figura A.1 indicando como los precios<br />
pagados a los productores brasileños <strong>de</strong> etanol fueran bajando en las últimas dos décadas,<br />
mientras se incrementaba la producción acumulada <strong>de</strong> etanol en <strong>el</strong> país (Nastari, 2005).<br />
Evaluando este período y la reducción <strong>de</strong> costos observada en Brasil, un experto brasileño<br />
apunta como razones básicas los incrementos <strong>de</strong> 33% en la producción <strong>de</strong> caña por ha,<br />
<strong>el</strong>evación <strong>de</strong> 8% en <strong>el</strong> contenido <strong>de</strong> azucares <strong>de</strong> la caña y incrementos <strong>de</strong> 14% en la<br />
conversión <strong>de</strong> sucrosa <strong>para</strong> etanol (Macedo, 2000).<br />
91
<strong>Potenciales</strong> y <strong>Viabilidad</strong> <strong><strong>de</strong>l</strong> <strong>Uso</strong> <strong>de</strong> <strong>Bioetanol</strong> y <strong>Biodies<strong>el</strong></strong> <strong>para</strong> <strong>el</strong> Transporte en México (SENER-BID-GTZ)<br />
Task 5: Ethanol and ETBE production and end-use in Mexico<br />
100<br />
(2004) US$ / GJ úteis<br />
10<br />
1980<br />
1986<br />
1990<br />
2002<br />
2004<br />
2005<br />
1995<br />
1999<br />
1<br />
0 50000 100000 150000 200000 250000 300000<br />
Produção Acumulada <strong>de</strong> Etanol (mil m 3 )<br />
Ethanol prices in Brazil<br />
Rotterdam regular gasoline price<br />
trend (Rotterdam gasoline prices)<br />
trend (Ethanol prices)<br />
Figura A.1. Evolución <strong>de</strong> los precios al productor <strong>de</strong> etanol (CIF) y la producción acumulada<br />
en Brasil, <strong>para</strong> <strong>el</strong> período 1980 a 2005, frente a evolución <strong><strong>de</strong>l</strong> precio <strong>de</strong> la gasolina.<br />
Finalmente y muy importante, al mencionar los costos <strong><strong>de</strong>l</strong> etanol es preciso reconocer que los<br />
estudios y datos disponibles consi<strong>de</strong>ran solamente los costos económicos directos, sin incluir<br />
aspectos más amplios, como pue<strong>de</strong>n ser los costos sociales y ambientales, que constituyen<br />
típicamente las externalida<strong>de</strong>s positivas y negativas <strong>de</strong> este vector energético. D<strong>el</strong> mismo<br />
modo, las diferentes unida<strong>de</strong>s monetarias necesariamente adoptadas en las estimaciones<br />
implican asumir tasas <strong>de</strong> cambio que pue<strong>de</strong>n falsear los resultados <strong><strong>de</strong>l</strong> análisis económica,<br />
principalmente entre países distintos.<br />
92
Task 6: Potentials in r<strong>el</strong>ation to sustainability criteria<br />
Isaias C. Macedo
<strong>Potenciales</strong> y <strong>Viabilidad</strong> <strong><strong>de</strong>l</strong> <strong>Uso</strong> <strong>de</strong> <strong>Bioetanol</strong> y <strong>Biodies<strong>el</strong></strong> <strong>para</strong> <strong>el</strong> Transporte en México (SENER-BID-GTZ)<br />
Task 6: Potentials in r<strong>el</strong>ation to sustainability criteria<br />
Contents<br />
1. INTRODUCTION ............................................................................................................9<br />
1.1 ENERGY SUSTAINABILITY............................................................................................9<br />
1.2 CONTEXT: THE ETHANOL MARKETS ...........................................................................12<br />
2. IMPACTS IN THE USE OF FOSSIL ENERGY ........................................................14<br />
2.1 INTRODUCTION: THE WORLD CONTEXT......................................................................14<br />
2.2 SUPPLY AND USE OF ELECTRICITY AND FUELS IN MEXICO .........................................14<br />
2.3 BIO-ETHANOL (AND CO-GENERATED ELECTRICITY) AND ITS IMPACT ON THE ENERGY<br />
SUPPLY: THE SUBSTITUTION OF FOSSIL FUELS ........................................................................15<br />
2.4 ENERGY BALANCES FOR THE SUGAR CANE TO ETHANOL INDUSTRY...........................17<br />
2.5 ENERGY BALANCE FOR THE CORN TO ETHANOL INDUSTRY ........................................21<br />
2.6 ESTIMATES FOR SORGHUM, BEETS, CASSAVA, OTHER ................................................22<br />
2.7 IMPACTS ON THE ENERGY SECTOR .............................................................................23<br />
2.8 SUMMARY AND CONCLUSIONS ..................................................................................25<br />
3. IMPACTS ON GLOBAL CLIMATE: GREENHOUSE GAS EMISSIONS ...........26<br />
3.1 INTRODUCTION; CONCEPTS AND THE WORLD CONTEXT .............................................26<br />
3.2 GREENHOUSE GASES EMISSIONS IN ETHANOL FROM SUGAR CANE PRODUCTION AND<br />
USE; ESTIMATES FOR MEXICO................................................................................................27<br />
3.3 GREENHOUSE GASES EMISSIONS IN ETHANOL FROM CORN PRODUCTION AND USE ....28<br />
3.4 GHG EMISSIONS: ETHANOL FROM CASSAVA, SORGHUM, SUGAR BEETS, WHEAT ......28<br />
3.5 IMPACTS IN GREENHOUSE GAS EMISSIONS IN MEXICO...............................................29<br />
3.6 SUMMARY AND CONCLUSIONS ..................................................................................30<br />
4. EMISSIONS AND MITIGATION OF LOCAL ATMOSPHERIC POLLUTANTS<br />
FROM GASOLINE – ETHANOL AND ETBE BLENDS .................................................31<br />
4.1 INTRODUCTION..........................................................................................................31<br />
4.2 THE EXPERIENCE WITH ETHANOL BLENDS, WORLDWIDE............................................31<br />
4.2.1 General results ..................................................................................................31<br />
4.2.2 Al<strong>de</strong>hy<strong>de</strong> emissions..........................................................................................33<br />
4.2.3 The NOx emissions ..........................................................................................34<br />
4.2.4 Vapor Pressure of gasoline - ethanol and blends..............................................35<br />
4.3 IMPACTS OF ETBE BLENDS .......................................................................................39<br />
4.4 SUMMARY AND CONCLUSIONS ..................................................................................40<br />
5. EMISSIONS FROM SUGAR CANE BURNING AND BAGASSE BOILERS:<br />
POSSIBLE HEALTH EFFECTS, OTHER RISKS ............................................................41<br />
5.1 SUGAR CANE BURNING EMISSIONS.............................................................................41<br />
5.2 BAGASSE BOILER EMISSIONS .....................................................................................42<br />
5.3 SUMMARY AND CONCLUSIONS ..................................................................................43
<strong>Potenciales</strong> y <strong>Viabilidad</strong> <strong><strong>de</strong>l</strong> <strong>Uso</strong> <strong>de</strong> <strong>Bioetanol</strong> y <strong>Biodies<strong>el</strong></strong> <strong>para</strong> <strong>el</strong> Transporte en México (SENER-BID-GTZ)<br />
Task 6: Potentials in r<strong>el</strong>ation to sustainability criteria<br />
6. LAND AVAILABILITY; FOOD SECURITY AND ENERGY CROPS.................. 44<br />
6.1 LAND UTILIZATION: THE WORLD CONTEXT................................................................ 44<br />
6.2 MEXICO’S LAND AVAILABILITY FOR AGRICULTURE................................................... 46<br />
6.3 AREAS NEEDED TO SUPPLY THE BIOMASS ETHANOL PRODUCTION IN THE PROPOSED<br />
SCENARIOS............................................................................................................................ 48<br />
6.4 AGRICULTURE IN MEXICO; FOOD PRODUCTION ......................................................... 50<br />
6.5 SUGAR CANE IN MEXICO ........................................................................................... 51<br />
6.6 SUMMARY AND CONCLUSIONS.................................................................................. 52<br />
7. WATER UTILIZATION: AGRICULTURE AND INDUSTRY............................... 53<br />
7.1 WATER UTILIZATION IN AGRICULTURE ..................................................................... 53<br />
7.2 WATER UTILIZATION IN THE INDUSTRIAL PRODUCTION............................................. 54<br />
7.3 SUMMARY AND CONCLUSIONS.................................................................................. 55<br />
8. IMPACTS IN WATER SUPPLY: WATER CONTAMINATION WITH THE USE<br />
OF ETHANOL - GASOLINE AND ETBE – GASOLINE BLENDS ............................... 56<br />
8.1 INTRODUCTION.......................................................................................................... 56<br />
8.2 ETHANOL – GASOLINE BLENDS ................................................................................. 56<br />
8.2.1 Effects of ethanol leakage / spillage................................................................. 56<br />
8.2.2 Ethanol leakage / spillage prevention............................................................... 57<br />
8.3 ETBE – GASOLINE BLENDS....................................................................................... 58<br />
8.4 SUMMARY AND CONCLUSIONS.................................................................................. 58<br />
9. STILLAGE UTILIZATION ......................................................................................... 60<br />
9.1 INTRODUCTION.......................................................................................................... 60<br />
9.2 STILLAGE TREATMENT AND DISPOSITION .................................................................. 62<br />
9.2.1 The ferti-irrigation process (Souza 2005) ...................................................... 63<br />
9.2.1.1 Ferti-irrigation advantages and limitations .................................................. 64<br />
9.2.2 Stillage Concentration...................................................................................... 65<br />
9.2.3 Anaerobic Digestion of Stillage ....................................................................... 66<br />
9.2.3.1 Anaerobic digestion processes today ........................................................... 66<br />
9.2.3.2 Anaerobic Digestion systems: experience with stillage............................... 67<br />
9.2.4 Aerobic fermentation of stillage....................................................................... 68<br />
9.3 SUMMARY AND CONCLUSIONS.................................................................................. 68<br />
10. PRODUCTION SUSTAINABILITY: THE SUPPLY OF ADEQUATE BIOMASS<br />
(GENETIC) MATERIAL AND PRODUCTION TECHNOLOGY.................................. 70<br />
10.1 THE AGRICULTURAL PRODUCTION BASE: VARIETIES ................................................. 70<br />
10.1.1 Sugar cane varieties <strong>de</strong>v<strong>el</strong>opment in Mexico................................................... 70<br />
10.2 TECHNOLOGY AVAILABILITY FOR AGRONOMIC PRODUCTION AND INDUSTRIAL<br />
CONVERSION ......................................................................................................................... 71<br />
10.3 SUMMARY AND CONCLUSIONS.................................................................................. 72<br />
11. ENVIRONMENT: IMPACTS OF FERTILIZERS AND AGRO-CHEMICALS;<br />
SOIL EROSION..................................................................................................................... 73<br />
11.1 INTRODUCTION: THE MAIN PROBLEMS....................................................................... 73<br />
11.2 CHARACTERISTICS OF THE CROPS CONSIDERED FOR BIO-ETHANOL IN MEXICO......... 73<br />
11.3 SUMMARY AND CONCLUSIONS.................................................................................. 77
<strong>Potenciales</strong> y <strong>Viabilidad</strong> <strong><strong>de</strong>l</strong> <strong>Uso</strong> <strong>de</strong> <strong>Bioetanol</strong> y <strong>Biodies<strong>el</strong></strong> <strong>para</strong> <strong>el</strong> Transporte en México (SENER-BID-GTZ)<br />
Task 6: Potentials in r<strong>el</strong>ation to sustainability criteria<br />
12. ECONOMIC AND SOCIAL IMPACTS..................................................................79<br />
12.1 INTRODUCTION..........................................................................................................79<br />
12.2 BIOETHANOL COSTS AND NEEDED INVESTMENTS (FROM TASK 5) .............................79<br />
12.3 OTHER IMPACTS: BALANCE OF PAYMENTS, LOCAL INDUSTRY....................................80<br />
12.4 IMPACTS ON JOB CREATION........................................................................................81<br />
12.5 SUMMARY AND CONCLUSIONS ..................................................................................82
<strong>Potenciales</strong> y <strong>Viabilidad</strong> <strong><strong>de</strong>l</strong> <strong>Uso</strong> <strong>de</strong> <strong>Bioetanol</strong> y <strong>Biodies<strong>el</strong></strong> <strong>para</strong> <strong>el</strong> Transporte en México (SENER-BID-GTZ)<br />
Task 6: Potentials in r<strong>el</strong>ation to sustainability criteria<br />
Tables<br />
Table 1.1 Ethanol <strong>de</strong>mand for the three proposed scenarios, M m 3 / year<br />
Table 1.2 Pr<strong>el</strong>iminary s<strong>el</strong>ection: biomass option, water, technologies<br />
Table 1.3 Ethanol blends used, 2005<br />
Table 2.1 Energy ratios for ethanol production from s<strong>el</strong>ected feedstocks<br />
Table 2.2 Final Energy Consumption, Mexico 2004; % Total (Total: 4141. PJ)<br />
Table 2.3 Ethanol <strong>de</strong>mand for the three scenarios, M m 3 / year<br />
Table 2.4 Fertilizers in cane production, Brazil, 2002<br />
Table 2.5 Energy Generation and Consumption in the Production of Sugar Cane and<br />
Ethanol, Brazil, 2002<br />
Table 2.6 External Energy Flows: ethanol and <strong>el</strong>ectricity, Case Studies (Annex 1)<br />
Table 2.7 Energy Ratios for Ethanol Plants: corn and sugar cane<br />
Table 2.8 Expected impacts in the energy production and use in Mexico with the<br />
introduction of 10% ethanol in gasoline<br />
Table 3.1 Summary of Greenhouse Gas Emissions and Avoi<strong>de</strong>d Emissions, ethanol from<br />
sugar cane, Mexico Case Studies (Annex 1)<br />
Table 3.2 Expected impacts in the GHG emissions in Mexico with the introduction of 10%<br />
ethanol in gasoline; values for 2004<br />
Table 4.1 Average tail pipe emissions, new vehicles; ethanol blends, Brazil (CETESB<br />
2004) (g/km)<br />
Table 4.2 CARB 3 RFG Standards (s<strong>el</strong>ected <strong>para</strong>meters)<br />
Table 4.3 Standards for vapor lock prevention; Mexican specifications<br />
Table 4.4 Vapor pressure and distillation temperatures for gasoline, for each<br />
volatility class; Mexican specifications<br />
Table 4.5 Volatility of gasoline; Brazilian specifications (ANP 2001)<br />
Table 5.1 Cane Burning Reduction Schedule; Brazil and São Paulo State<br />
Table 6.1 Land distribution in the World<br />
Table 6.2 Main soil utilization and vegetation, 2002
<strong>Potenciales</strong> y <strong>Viabilidad</strong> <strong><strong>de</strong>l</strong> <strong>Uso</strong> <strong>de</strong> <strong>Bioetanol</strong> y <strong>Biodies<strong>el</strong></strong> <strong>para</strong> <strong>el</strong> Transporte en México (SENER-BID-GTZ)<br />
Task 6: Potentials in r<strong>el</strong>ation to sustainability criteria<br />
Table 6.3 Areas for some s<strong>el</strong>ected products, 2004<br />
Table 6.4 Areas nee<strong>de</strong>d for ethanol production in the proposed Scenarios<br />
Table 9.1 Chemical composition of stillage from different kinds of must, from<br />
sugar cane<br />
Table 9.2 Analytical characterization of stillage, sugar cane, Brazil<br />
Table 9.3 Stillage from cassava, Brazil<br />
Table 9.4 Stillage application systems in the State of São Paulo<br />
Table A1.1 Parameters for the autonomous distilleries, Mexico (Cases 2, 3, 4)<br />
Table A1.2 Ethanol and Electricity production, Distilleries in México<br />
Table A1.3 Energy inputs / outputs for cane production and conversion to ethanol<br />
Table A1.4 Greenhouse Gas Emissions and Avoi<strong>de</strong>d Emissions, Sugar cane to ethanol<br />
distilleries<br />
Table A3.1 Water uses (mean values) in mills having an annexed distillery<br />
Table A7.1 NOx emissions for gasoline – ethanol blends, (AIST 2005).<br />
Figures<br />
Figure 1.1<br />
Evolution of anhydrous ethanol content in gasoline, Brazil<br />
Figure 4.1 Air pollutants emissions with gasoline-ETBE blends<br />
Figure 10.1 Evolution of ethanol price paid to producers compared to gasoline prices<br />
(taxes exclu<strong>de</strong>d) at the same time<br />
Figure A4.1 Plant for stillage concentration<br />
Figure A6.1 Percentage area occupation by the main sugar-cane varieties in Brazil<br />
from 1984 to 2003
<strong>Potenciales</strong> y <strong>Viabilidad</strong> <strong><strong>de</strong>l</strong> <strong>Uso</strong> <strong>de</strong> <strong>Bioetanol</strong> y <strong>Biodies<strong>el</strong></strong> <strong>para</strong> <strong>el</strong> Transporte en México (SENER-BID-GTZ)<br />
Task 6: Potentials in r<strong>el</strong>ation to sustainability criteria<br />
Annexes<br />
Annex 1<br />
Ethanol from sugar cane: energy ratios and greenhouse gas emissions for<br />
s<strong>el</strong>ected production schemes in Mexico<br />
Annex 2<br />
Annex 3<br />
Annex 4<br />
Annex 5<br />
Annex 6.<br />
Annex 7.<br />
Standards for ethanol storage tanks and systems, and ethanol transportation in<br />
Brazil<br />
Water utilization in a sugar mill with annexed distillery<br />
Stillage Concentration System<br />
System for Anaerobic Digestion of Stillage<br />
Aspects of the sugar cane breeding program in Brazil<br />
Emissions of NOx from ethanol – gasoline blends
<strong>Potenciales</strong> y <strong>Viabilidad</strong> <strong><strong>de</strong>l</strong> <strong>Uso</strong> <strong>de</strong> <strong>Bioetanol</strong> y <strong>Biodies<strong>el</strong></strong> <strong>para</strong> <strong>el</strong> Transporte en México (SENER-BID-GTZ)<br />
Task 6: Potentials in r<strong>el</strong>ation to sustainability criteria<br />
Summary and Key Points<br />
The objective of this report is to look at the consequences (social, environmental and<br />
economic) of the introduction of ethanol in limited quantities as a blend with gasoline (at<br />
most, 10% in volume) in the Mexican transportation fu<strong>el</strong> pool. Some biomass feedstocks were<br />
pre-s<strong>el</strong>ected, as w<strong>el</strong>l as the use (or not) of irrigation and the conversion processes to ethanol<br />
(Table 1.2). To evaluate the sustainability of bio-ethanol production and use in Mexico we<br />
consi<strong>de</strong>r the main social, economic and environmental impacts r<strong>el</strong>ated to:<br />
The biomass feedstock<br />
Land utilization<br />
The agricultural production<br />
The industrial conversion to ethanol<br />
The ethanol end use<br />
Most of the issues analyzed in this matrix context present some positive and some negative<br />
impacts, simultaneously; different process options usually mean “compromising” between the<br />
impacts. As an example, in agricultural production higher fertilizer lev<strong>el</strong>s and irrigation may<br />
lead (in some cases) to lower biomass cost and less land utilization, but also to higher water<br />
utilization, contamination and topsoil loss. Harvesting mechanization may lead to lower<br />
biomass cost, but also to higher fossil fu<strong>el</strong> use (with associated GHG emissions) and to fewer<br />
jobs. Besi<strong>de</strong>s, <strong>de</strong>pending on combinations of the production factors (for example, specific<br />
biomass and soil characteristics) these impacts may change consi<strong>de</strong>rably. Also the production<br />
/ utilization factors are not in<strong>de</strong>pen<strong>de</strong>nt; the s<strong>el</strong>ection a specific biomass (corn, sugar cane, etc)<br />
implies in (partial) <strong>de</strong>finition of the industrial conversion process.<br />
In the following <strong>para</strong>graphs some of the main findings in this study are presented for each of<br />
the five production / utilization factors listed above the three dimensions of expected impacts:<br />
environmental, economic and social. This implies in some simplifications, but the results are<br />
useful for this stage of the study, which is a survey of many possible options. Quantitative<br />
results are usually referred to specific situations (process options); they are w<strong>el</strong>l established in<br />
the main text.<br />
The biomass feedstock<br />
The impacts <strong>de</strong>rived from the quality of the biomass feedstock are mostly economic, but<br />
evi<strong>de</strong>ntly environmental implications are important (high quality varieties may require less<br />
fertilizers, agrochemicals and production areas).<br />
The sustainable agricultural production must respond to pests and diseases of the plant and to<br />
periodical climate changes; this requires an efficient disease and pest-resistant variety supply<br />
program. Important grain crops use large scale multi-national genetic improvement facilities<br />
(corn, wheat); sugar beets and sorghum will need more local testing and s<strong>el</strong>ection; sugar cane<br />
and cassava would benefit much more from local s<strong>el</strong>ection programs. Mexico has reduced its<br />
important sugar cane variety <strong>de</strong>v<strong>el</strong>opment program in the last years (Chapter 10); it is essential<br />
to provi<strong>de</strong> material for sugar cane expansion areas, and this position should be re-consi<strong>de</strong>red.<br />
1
<strong>Potenciales</strong> y <strong>Viabilidad</strong> <strong><strong>de</strong>l</strong> <strong>Uso</strong> <strong>de</strong> <strong>Bioetanol</strong> y <strong>Biodies<strong>el</strong></strong> <strong>para</strong> <strong>el</strong> Transporte en México (SENER-BID-GTZ)<br />
Task 6: Potentials in r<strong>el</strong>ation to sustainability criteria<br />
A strong, in<strong>de</strong>pen<strong>de</strong>nt agricultural extension service is nee<strong>de</strong>d, not r<strong>el</strong>ying entir<strong>el</strong>y in<br />
equipment manufacturers and s<strong>el</strong>lers of agro-chemicals and irrigation systems. Biomass to<br />
energy programs worldwi<strong>de</strong> are expected to present at least a good perspective for feedstock<br />
cost reduction (since they are not, in most cases, competitive with the conventional energy<br />
supply); this needs the technology <strong>de</strong>v<strong>el</strong>opment and implementation.<br />
Land utilization<br />
Food security is seen in different ways for each country; but providing a fair amount of their<br />
“basic food products” with their own resources is usually a goal. Energy crops add complexity<br />
to the problem; the use of wastes or <strong>de</strong>gra<strong>de</strong>d lands for energy has been much analyzed<br />
recently (Chapter 6).<br />
The impacts are essentially economic and environmental.<br />
In Mexico ~ 61% of the territory presents a humidity <strong>de</strong>ficit (severe, for 45%) with arid or<br />
semi-arid climate. Agriculture may use ~16% of the area, or 30. M ha; in 2003 the cultivated<br />
area was 21.8 M ha (16.7 rain fed, 5 irrigated). Pasture land covers a similar area (27.7 M ha),<br />
and in some regions (South-Southeast) it could be partially used for energy crops. The s<strong>el</strong>fsufficiency<br />
in food production (though of course it is not an objective per se) would need more<br />
than the 21.8 M ha used in 2003 (~5 M ha, with today’s productivities). The structure of<br />
Mexican agriculture has changed in the last ten years; changes will continue, and their<br />
influence in any agricultural program has to be consi<strong>de</strong>red (Chapter 6).<br />
Agricultural productivity increased in Mexico in the last years, but there is room for<br />
improvements, leading to more area available. Irrigation (when possible) plays an important<br />
role in this issue.<br />
Two energy crops (sugar cane and sugar beets) would need less than 1 M ha to reach the<br />
production for 10% of gasoline substitution; corn would also be in this range, while wheat and<br />
cassava would need two times that, and sorghum ~6 times. Therefore, within the limits of the<br />
proposed Scenarios, the land requirements could be met without compromising the food<br />
production system, for some of the crops.<br />
The agricultural production<br />
Environmental impacts of the agricultural production are very much <strong>de</strong>pen<strong>de</strong>nt on the specific<br />
crop.<br />
Water use for irrigation takes 70% of the water uses in the world; Mexico has reached 85%<br />
(1/3 with un<strong>de</strong>rground water; 9000 m 3 / ha, average); efficiency in water use is estimated as<br />
~24 – 34%. Important inversions in infrastructure are nee<strong>de</strong>d, to control floods and soil loss<br />
(Chapter 7.1). It is expected that regulations for the use of water will be more limiting in the<br />
future; energy crops will naturally be required to use less irrigation whenever possible;<br />
technologies for efficient use of water are expected to be consi<strong>de</strong>red. Water needs for<br />
irrigation was one of the consi<strong>de</strong>rations when the s<strong>el</strong>ection of the feedstocks was ma<strong>de</strong>, for<br />
this study.<br />
2
<strong>Potenciales</strong> y <strong>Viabilidad</strong> <strong><strong>de</strong>l</strong> <strong>Uso</strong> <strong>de</strong> <strong>Bioetanol</strong> y <strong>Biodies<strong>el</strong></strong> <strong>para</strong> <strong>el</strong> Transporte en México (SENER-BID-GTZ)<br />
Task 6: Potentials in r<strong>el</strong>ation to sustainability criteria<br />
The recovery of the riparian vegetation in agricultural areas, and legal protection for all<br />
expansion in new areas, are recommen<strong>de</strong>d.<br />
The environmental impacts of producing the energy crops are different from crop to crop. The<br />
knowledge of the environmental impacts of these crops worldwi<strong>de</strong> (soil erosion with water<br />
and wind; use of agro-chemicals: fertilizers, pestici<strong>de</strong>s, herbici<strong>de</strong>s; water utilization and<br />
contamination) and the large experience in Mexico with some of them h<strong>el</strong>p establishing limits,<br />
consi<strong>de</strong>ring the local conditions. A summary for each crop is presented, emphasizing soil loss,<br />
agrochemicals use and trends in mitigation (Chapter 11).<br />
An important <strong>para</strong>meter is the use (or not) of irrigation; it impacts the water supply, and may<br />
lead to soil erosion, salinization, and to un<strong>de</strong>rground and surface water contamination.<br />
Agricultural expansion will imply in using anthropized, to some extent <strong>de</strong>gra<strong>de</strong>d lands; in<br />
culture substitution or in habitat loss.<br />
For some crops the use of stillage in ferti-irrigation can reduce fertilizers (mostly potassium)<br />
and supply a small amount of water in s<strong>el</strong>ected areas.<br />
For the sugar cane production, environmental impacts of sugar cane burning must be<br />
consi<strong>de</strong>red. Most of the sugar cane in Mexico is harvested after burning; although cane<br />
burning emissions have not been associated to chronic diseases, the r<strong>el</strong>ease of particulate<br />
matter may cause discomfort in urban areas, and the smoke may cause risks in areas with<br />
<strong>el</strong>ectric networks and highways, and fire hazards (Chapter 5.1). Green cane harvesting has<br />
been associated with mechanical harvest, with limitations in areas of high <strong>de</strong>clivity and<br />
reducing the number of jobs. Solutions are local, <strong>de</strong>pending on the areas involved. Controls<br />
may inclu<strong>de</strong> burning prohibition in some areas (urban perimeters, highways, railways,<br />
airports, forest reserves and preservation units) and gradual phasing out in other areas. Sugar<br />
cane trash is becoming valuable as a source of additional clean energy, and this will acc<strong>el</strong>erate<br />
the implementation of green cane harvesting in many places.<br />
The agricultural production presents a special economic problem with strong social<br />
implications. The sugar cane based industry, with the existing legislation, can not compete<br />
with imported corn fructose; and export prices for sugar are lower than allowed by the cane<br />
price (Chapter 6.4 and 6.5). Problems caused in part by the small scale cane production and a<br />
cane price fixing system that do not “integrate” cane producers and mill owners will need<br />
a<strong>de</strong>quate solution. Both cane production and cane processing present good opportunities for<br />
increasing efficiencies and reducing costs, once the institutional problems are solved. Among<br />
the opportunities, diversification to ethanol (and <strong>el</strong>ectricity co-generation) may be of great<br />
importance to strengthen the whole sugar cane agro-industry.<br />
The industrial conversion to ethanol<br />
Environmental impacts of the industrial conversion are also <strong>de</strong>pen<strong>de</strong>nt on the specific crop<br />
and process.<br />
Water utilization: all processes to produce ethanol from biomass today may be improved to<br />
use less water withdrawal from the sources; legal measures may inclu<strong>de</strong> a<strong>de</strong>quate payment for<br />
water withdrawal and consumption, and strict specifications for discharged water quality. For<br />
sugar beets, the pre-processing washing at the industry uses up to 10 – 30% of the beets<br />
3
<strong>Potenciales</strong> y <strong>Viabilidad</strong> <strong><strong>de</strong>l</strong> <strong>Uso</strong> <strong>de</strong> <strong>Bioetanol</strong> y <strong>Biodies<strong>el</strong></strong> <strong>para</strong> <strong>el</strong> Transporte en México (SENER-BID-GTZ)<br />
Task 6: Potentials in r<strong>el</strong>ation to sustainability criteria<br />
weight (in water). Cassava also uses large quantities of water. For sugar cane the average<br />
water withdrawal from the sources (rivers, lakes, un<strong>de</strong>rground water) in Brazil 1.8 m 3 / t cane,<br />
but the system can be improved (Chapter 7.2).<br />
Sugar cane (and sorghum): air pollution with bagasse boilers: bagasse boilers are conventional<br />
biomass boilers (r<strong>el</strong>ativ<strong>el</strong>y low temperatures) and the emissions associated are w<strong>el</strong>l known<br />
(PM, NOx, ozone); they can be controlled in all mo<strong>de</strong>rn boilers (Chapter 5.2).<br />
Stillage disposal / utilization: stillage treatment is required to avoid the discharge of high<br />
organic matter loads in rivers. This concept is still true, but the possibility of profiting with<br />
ferti-irrigation has been <strong>de</strong>monstrated with the evolution in the last 25 years: the nutrients<br />
(mainly the Potassium) and water in stillage can pay for all application costs with increased<br />
productivity (Chapter 9). Ferti-irrigation must be the first priority in stillage use, whenever<br />
possible; it requires a better management, but this will be nee<strong>de</strong>d for all the agricultural<br />
procedures in the near future, approaching a “precision agriculture” for the energy crops.<br />
Some lev<strong>el</strong> of concentration (or some process <strong>de</strong>v<strong>el</strong>opment to reduce stillage volume) may be<br />
economically feasible, to improve the distribution in ferti-irrigation, <strong>de</strong>pending on the<br />
topography.<br />
High concentration (~60 Brix) to allow for burning is a process intensive in capital and<br />
energy, being difficult to justify, except in very special situations.<br />
Anaerobic Digestion is an option to be reserved for situations where full ferti-irrigation is not<br />
possible. It usually is not sufficient to comply with the local requirements set by the<br />
environmental legislation; and an aerobic complementation may be mandatory.<br />
The ethanol end use<br />
Ethanol partial substitution for gasoline h<strong>el</strong>ps increasing energy security and reducing gasoline<br />
/ additives imports (economic impacts). Economic impacts are also seen in the r<strong>el</strong>ative costs of<br />
ethanol and the (expected) gasoline cost; in the economic <strong>de</strong>v<strong>el</strong>opment due to equipment and<br />
services suppliers for the new energy sector; and in the strengthening of the rural area, with<br />
job creation.<br />
Bio-ethanol (and co-generated <strong>el</strong>ectricity) show positive environmental impacts by reducing<br />
the use of natural resources (fossil fu<strong>el</strong>s) and the corresponding GHG emissions.<br />
Ethanol use in blends with gasoline (and also the use of ETBE) presents different atmospheric<br />
emissions (than those from gasoline). The possibility and consequences of leakage and<br />
contamination of groundwater must be consi<strong>de</strong>red.<br />
The main environmental impacts are summarized b<strong>el</strong>ow.<br />
The biomass and conversion processes proposed, for Mexico conditions (Chapter 2), present<br />
energy ratios (energy output / fossil energy inputs) varying from nearly one (corn: 1.3) to ten<br />
(sugar cane, with co-generation). Sweet sorghum ratio is ~4; wheat and sugar beets ratios are<br />
~2; and cassava is ~1. Impacts in fossil energy utilization are shown b<strong>el</strong>ow, for 10% blend of<br />
4
<strong>Potenciales</strong> y <strong>Viabilidad</strong> <strong><strong>de</strong>l</strong> <strong>Uso</strong> <strong>de</strong> <strong>Bioetanol</strong> y <strong>Biodies<strong>el</strong></strong> <strong>para</strong> <strong>el</strong> Transporte en México (SENER-BID-GTZ)<br />
Task 6: Potentials in r<strong>el</strong>ation to sustainability criteria<br />
ethanol and gasoline; the % refers to the total energy consumption for each category, in<br />
Mexico. So, sugar cane ethanol replaces 10% of the gasoline and 1.8% of the <strong>el</strong>ectricity used<br />
in Mexico, and uses 1% of fu<strong>el</strong>s (Dies<strong>el</strong>, Natural gas and Fu<strong>el</strong> Oil).<br />
Gasoline substituted<br />
% total gasoline<br />
Electricity substituted<br />
% total <strong>el</strong>ectricity<br />
(D+NG+FO) used,<br />
% total (D+NG+FO)<br />
Sugar cane 10 1.8 1.<br />
Corn 10 7.8<br />
Sugar beets 10 5.1<br />
Sweet Sorghum 10 2.6<br />
Wheat 10 5.1<br />
Cassava 10 10.2<br />
(D + NG + FO): dies<strong>el</strong> + natural gas + fu<strong>el</strong> oil<br />
For the same Scenario 3, the GHG emissions for the life cycle of ethanol production and use<br />
and the avoi<strong>de</strong>d emissions in Mexico (Chapter 3) are:<br />
Corn<br />
Sugar Cane<br />
Sugar beets<br />
Sweet Sorghum<br />
Wheat<br />
Processes, kg CO 2 eq. / l<br />
anhydrous ethanol<br />
1.8<br />
0.43<br />
1.4<br />
0.7<br />
1.8<br />
Mitigation, Mexico; Scenario 3<br />
10 6 t CO 2 eq. / year<br />
3.9<br />
10.6<br />
5.4<br />
8.2<br />
3.9<br />
Atmospheric emissions from blends of ethanol with gasoline are much better known than from<br />
ETBE blends (Chapter 4). Ethanol – gasoline blends lead to important reductions in CO, HC<br />
and toxic emissions (benzene, toluene, and xylene); nearly zero sulphur and lower particulate<br />
matter. Al<strong>de</strong>hy<strong>de</strong> (formal<strong>de</strong>hy<strong>de</strong> and acetal<strong>de</strong>hy<strong>de</strong>) emissions have always been w<strong>el</strong>l b<strong>el</strong>ow<br />
allowed limits, and present much lower toxicity and photochemical reactivity than the<br />
formal<strong>de</strong>hy<strong>de</strong> emissions from dies<strong>el</strong> or gasoline. Existing data indicates that the NOx increase<br />
with the use of ethanol-gasoline blends is very small. Blends of ethanol and gasoline increase<br />
of 1.0 to 1.2 psi in RVP, up to the oxygen content of ~5% by volume; higher oxygen content<br />
leads to a slowly <strong>de</strong>creasing RVP. The improvement in refining base gasoline led to<br />
acceptable evaporative emissions; and airborne ethanol has very low toxicity. ETBE blends<br />
with gasoline result in lower RVP; it also has been effective with reductions at ~15% for CO,<br />
toxics and VOCS (blend at 2.7% Oxygen, in RFG).<br />
The experience with MTBE showed the risk of groundwater and surface water contamination;<br />
oxygenates are consi<strong>de</strong>red according to their solubility in water; the rate of <strong>de</strong>gradation in the<br />
5
<strong>Potenciales</strong> y <strong>Viabilidad</strong> <strong><strong>de</strong>l</strong> <strong>Uso</strong> <strong>de</strong> <strong>Bioetanol</strong> y <strong>Biodies<strong>el</strong></strong> <strong>para</strong> <strong>el</strong> Transporte en México (SENER-BID-GTZ)<br />
Task 6: Potentials in r<strong>el</strong>ation to sustainability criteria<br />
environment; anticipated human exposures; the toxicity to aquatic life, and the effects to<br />
human health. Leaking un<strong>de</strong>rground storage tanks (UST) are b<strong>el</strong>ieved to be the primary source<br />
of localized r<strong>el</strong>eases. Ethanol – gasoline blends are r<strong>el</strong>ativ<strong>el</strong>y harmless: ethanol is readily<br />
<strong>de</strong>gra<strong>de</strong>d in the environment, human exposures are very low, and the expected exposures<br />
would have no adverse health impact (Chapter 8). However it is possible that the fast bio<strong>de</strong>gradation<br />
of ethanol in water <strong>de</strong>pletes oxygen at the leading edge of a groundwater plume,<br />
extending the BTEX plume. There is little information on the behavior of ETBE or TAME,<br />
when leaked or spilled. Ether contamination of soils and surface/ground water is difficult to<br />
remediate. ETBE has some advantages compared to MTBE due to the physicochemical<br />
properties, but the risk of groundwater contamination from leaking un<strong>de</strong>rground storage tanks<br />
is not substantially smaller (Chapter 8.3).<br />
The main economic impacts (although some may be consi<strong>de</strong>red essentially social, like job<br />
creation, rural <strong>de</strong>v<strong>el</strong>opment) are:<br />
Reducing gasoline and MTBE importation as in Scenario 3 (10% ethanol blend) would lead to<br />
savings of up to US$ 1.75 10 9 (2005) in foreign exchange (~2.0 10 9 in 2010) (Chapter 12).<br />
Equipment for ethanol production and combined heat and power generation may have a<br />
nationalization in<strong>de</strong>x of nearly 100 percent in Mexico, creating jobs and strengthening the<br />
industry.<br />
Reaching 10% ethanol in all gasoline (Scenario 3) would require doubling the jobs in sugar<br />
cane agro-industry; or, alternativ<strong>el</strong>y, increasing in 45% the jobs in corn production. New<br />
production structures (larger areas, mechanization and automation) would lead to lower<br />
figures; however job creation (at r<strong>el</strong>ativ<strong>el</strong>y low investment) could be one of the most<br />
important social contributions of the program (Chapter 12).<br />
A reference “value” (parity cost) for ethanol when substituting for gasoline and MTBE was<br />
taken at ~US$ 0.45 / l (Task 5). Ethanol cost estimates (also in Task 5) indicate that the net<br />
economic result (US$ / l) is negative for all cases, with ethanol prices at US$ 0.45 / l; it is<br />
positive for the “conventional” combinations of biomass / technologies (sugar cane and corn)<br />
and ethanol prices between US$0.45 and US$ 0.55 / l. It remains negative for all “new”<br />
technologies, even at US$ 0.65 / l ethanol. The feedstock cost is the most important item; 10%<br />
lower cane cost leads to 6% reduction in ethanol cost (4% in corn).<br />
Sugar cane seems attractive, since costs can still be significantly reduced; corn follows<br />
clos<strong>el</strong>y.<br />
Conventional processes have the lowest investment needs (with corn leading); sugar cane<br />
requires less area, while sugar beets and corn are r<strong>el</strong>ativ<strong>el</strong>y close (~10 – 20% more).<br />
6
Key Points<br />
<strong>Potenciales</strong> y <strong>Viabilidad</strong> <strong><strong>de</strong>l</strong> <strong>Uso</strong> <strong>de</strong> <strong>Bioetanol</strong> y <strong>Biodies<strong>el</strong></strong> <strong>para</strong> <strong>el</strong> Transporte en México (SENER-BID-GTZ)<br />
Task 6: Potentials in r<strong>el</strong>ation to sustainability criteria<br />
• Replacing 10% of the gasoline in Mexico with ethanol could be accomplished with ~1<br />
M ha, using suitable crops; land is available without competition for food production.<br />
• Water use for irrigation must be controlled, using whenever possible rainfed<br />
production; irrigation efficiencies must be improved, as w<strong>el</strong>l as protection to the<br />
springs and water ways. Water withdrawal for industrial use can be minimized, and the<br />
discharged water quality controlled.<br />
• The use of stillage for ferti-irrigation must be a priority; however it needs suitable<br />
planning (and a specific legislation) to avoid water contamination. For sugar cane, the<br />
trend toward green cane harvesting will mitigate the environmental impacts of sugar<br />
cane burning, which also requires planning and regulation.<br />
• Efficient disease and pest-resistant variety supply programs are required, as w<strong>el</strong> as<br />
a<strong>de</strong>quate agricultural extension services.<br />
• Impacts in fossil energy utilization are shown b<strong>el</strong>ow, for 10% blend of ethanol and<br />
gasoline, as percentage of the total energy consumption for each category, in Mexico.<br />
So, sugar cane ethanol replaces 10% of the gasoline and 1.8% of the <strong>el</strong>ectricity used in<br />
Mexico, and uses 1% of fu<strong>el</strong>s (Dies<strong>el</strong>, Natural gas and Fu<strong>el</strong> Oil).<br />
Gasoline substituted<br />
% total gasoline<br />
Electricity substituted<br />
% total <strong>el</strong>ectricity<br />
(D+NG+FO) used,<br />
% total (D+NG+FO)<br />
Sugar cane 10 1.8 1.<br />
Corn 10 7.8<br />
Sugar beets 10 5.1<br />
Sweet Sorghum 10 2.6<br />
Wheat 10 5.1<br />
Cassava 10 10.2<br />
(D + NG + FO): dies<strong>el</strong> + natural gas + fu<strong>el</strong> oil<br />
For the Scenarios 1, 2 and 3-b all the values would be respectiv<strong>el</strong>y 10.5 %, 23% and<br />
59% of the above.<br />
• For the same Scenario (10% ethanol blen<strong>de</strong>d), the GHG emissions for the life cycle of<br />
ethanol production and use and the avoi<strong>de</strong>d emissions in Mexico are:<br />
Corn<br />
Sugar Cane<br />
Sugar beets<br />
Sweet Sorghum<br />
Wheat<br />
Processes, kg CO 2 eq. / l<br />
anhydrous ethanol<br />
1.8<br />
0.43<br />
1.4<br />
0.7<br />
1.8<br />
Mitigation, Mexico; Scenario 3<br />
10 6 t CO 2 eq. / year<br />
3.9<br />
10.6<br />
5.4<br />
8.2<br />
3.9<br />
7
<strong>Potenciales</strong> y <strong>Viabilidad</strong> <strong><strong>de</strong>l</strong> <strong>Uso</strong> <strong>de</strong> <strong>Bioetanol</strong> y <strong>Biodies<strong>el</strong></strong> <strong>para</strong> <strong>el</strong> Transporte en México (SENER-BID-GTZ)<br />
Task 6: Potentials in r<strong>el</strong>ation to sustainability criteria<br />
For the Scenarios 1, 2 and 3-b all the values would be respectiv<strong>el</strong>y 10.5 %, 23% and 59%<br />
of the above. Emissions from gasoline today are ~ 117. 10 6 t CO 2 eq. / year.<br />
• Ethanol – gasoline blends lead to important reductions in CO, HC, toxic emissions and<br />
to lower PM. Al<strong>de</strong>hy<strong>de</strong> emissions have always been w<strong>el</strong>l b<strong>el</strong>ow allowed limits; and the<br />
NOx increase is very small (with respect to the absolute limits). The improvement in<br />
refining base gasoline led to acceptable evaporative emissions.<br />
• Ethanol – gasoline blends are r<strong>el</strong>ativ<strong>el</strong>y harmless for groundwater and surface water<br />
contamination; ETBE may present problems as MTBE.<br />
• The 10% ethanol blend) would lead to savings of up to US$ 1.75 10 9 (2005) in foreign<br />
exchange; it would also boost the equipment manufacturing industry. It would require<br />
doubling the jobs in sugar cane agro-industry; or, alternativ<strong>el</strong>y, increasing in 45% the<br />
jobs in corn production.<br />
• The net economic result (US$ / l) is positive for the “conventional” combinations of<br />
biomass / technologies (sugar cane and corn) and ethanol prices between US$0.45 and<br />
US$ 0.55 / l. The feedstock cost is the most important item; 10% lower cane cost leads<br />
to 6% reduction in ethanol cost (4% in corn). Sugar cane seems attractive, since costs<br />
can still be significantly reduced; corn follows clos<strong>el</strong>y.<br />
• Conventional processes have the lowest investment needs (with corn leading); sugar<br />
cane requires less area, while sugar beets and corn are r<strong>el</strong>ativ<strong>el</strong>y close (~10 – 20%<br />
more).<br />
8
1. Introduction<br />
<strong>Potenciales</strong> y <strong>Viabilidad</strong> <strong><strong>de</strong>l</strong> <strong>Uso</strong> <strong>de</strong> <strong>Bioetanol</strong> y <strong>Biodies<strong>el</strong></strong> <strong>para</strong> <strong>el</strong> Transporte en México (SENER-BID-GTZ)<br />
Task 6: Potentials in r<strong>el</strong>ation to sustainability criteria<br />
The last twenty years saw an extraordinary improvement of our knowledge of the<br />
consequences of human interaction with the environment, as w<strong>el</strong>l as the social consequences<br />
of political and economic action in a much more interr<strong>el</strong>ated (globalized) world. Sustainability<br />
(in all its three aspects: social, environmental and economic) is becoming a key <strong>para</strong>meter to<br />
measure the a<strong>de</strong>quacy of proposed <strong>de</strong>v<strong>el</strong>opment programs.<br />
1.1 Energy Sustainability<br />
In many ways, energy and sustainability issues are interr<strong>el</strong>ated. Energy plays an essential role<br />
in most of the social / economic <strong>de</strong>v<strong>el</strong>opment issues; any time we try to establish <strong>de</strong>v<strong>el</strong>opment<br />
“targets” we will face the (sustainable) energy requirements, limitations and in some cases<br />
advantages. A good example is seen in the analyses of energy (direct and indirect) linkages to<br />
each one of the Millennium Dev<strong>el</strong>opment Goals (UNDP 2004); for topics as diverse as:<br />
Extreme poverty and hunger<br />
Universal primary education<br />
Gen<strong>de</strong>r equality and women’s empowerment<br />
Child mortality<br />
Maternal health<br />
HIV/AIDS, malaria and other major diseases<br />
Environmental sustainability<br />
energy availability, production and utilization remain as important issues.<br />
The recent growth in the supply of (commercial) energy using biomass resources (mostly bioethanol<br />
and biodies<strong>el</strong>) has brought to attention important sustainability issues linked to the<br />
production and use of these fu<strong>el</strong>s. The problems cover a large spectrum of human activities,<br />
including all the sustainability questions r<strong>el</strong>ated to agriculture, and the air and water pollution<br />
aspects of the commercial fu<strong>el</strong>s. A recent analysis of the ethanol from sugarcane production<br />
and use as fu<strong>el</strong> in Brazil (Macedo 2005) has looked at questions as diverse as:<br />
• Impacts on natural resources<br />
Use of fossil energy, materials, and water<br />
• Environmental impacts<br />
Air quality; global climate; soil occupation and bio- diversity; agricultural soil<br />
preservation; utilization of agro-toxics and fertilizers<br />
• Sustainability of the agricultural production base<br />
• Production impacts in commercial actions<br />
• Socio-economic impacts (job creation and quality)<br />
9
<strong>Potenciales</strong> y <strong>Viabilidad</strong> <strong><strong>de</strong>l</strong> <strong>Uso</strong> <strong>de</strong> <strong>Bioetanol</strong> y <strong>Biodies<strong>el</strong></strong> <strong>para</strong> <strong>el</strong> Transporte en México (SENER-BID-GTZ)<br />
Task 6: Potentials in r<strong>el</strong>ation to sustainability criteria<br />
There are significant differences among the environmental, social and economic impacts of<br />
producing and using bio-fu<strong>el</strong>s from different biomass feed stocks, conversion and utilization<br />
processes, and regions in the world. Some of the impacts can be extrem<strong>el</strong>y positive; for<br />
instance, when looking at bio-ethanol to reduce energy <strong>de</strong>pen<strong>de</strong>nce on fossil fu<strong>el</strong>s, one might<br />
find important reductions also in green house gases emissions (in some cases), improvement in<br />
urban air pollution, and increase in jobs. In some areas there might be competition for land<br />
(for food), higher use of water resources, and water contamination with agro-chemicals. A<br />
balance must be sought, leading to an overall positive effect with a minimum of (acceptable)<br />
negative impacts. Some bio-fu<strong>el</strong>s, in proper conditions, have led to what we can <strong>de</strong>finit<strong>el</strong>y<br />
i<strong>de</strong>ntify as “responsive sustainability”: not only minimizing their impact in some area, but<br />
going much beyond in positive results, h<strong>el</strong>ping to balance the action of other sectors.<br />
The objective of this report is to look as broadly as possible at the consequences (social,<br />
environmental and economic) of the introduction of ethanol in limited quantities as a blend<br />
with gasoline in the Mexican transportation fu<strong>el</strong> pool.<br />
The limits in ethanol volumes to be produced and used are stated in the three scenarios <strong>de</strong>fined<br />
previously. The scenarios have been presented and discussed in (Rodriguez N. 2006) and in<br />
(Nogueira 2006). The summary is shown b<strong>el</strong>ow, and also the respective volumes of ethanol<br />
required.<br />
Scenario 1: Substitution of ETBE (Ethyl Terbutyl Ether) and TAEE (Teramyl Ethyl<br />
Ether) for the national production of MTBE (Methyl Terbutyl Ether) and TAME<br />
(Teramyl Methyl Ether), keeping the MTBE imports nee<strong>de</strong>d to satisfy the oxygenated<br />
gasoline <strong>de</strong>mand in the Metropolitan areas of Guadalajara, Monterrey y Valle <strong>de</strong><br />
México.<br />
Scenario 2: Elimination of all oil <strong>de</strong>rived ethers in gasoline, keeping the 2% (weight)<br />
oxygen in the gasoline in the Metropolitan areas, and using only ethanol as the oxygen<br />
source.<br />
Scenario 3: Blending of 10% ethanol (volume) in all gasoline in Mexico, leading to<br />
3.5% oxygen in weight, as in many of the ethanol programs in other countries today.<br />
Scenario 3-b: Blending of 10% ethanol in all the gasoline in areas where today there is<br />
no oxygenates.<br />
Scenario 3-b was consi<strong>de</strong>red initially, but according to the exposition in the Report in Task 5<br />
the “full” 10% gasoline substitution was taken as a basis for the evaluation of impacts. For all<br />
quantitative impacts, Scenario 3-b would imply in using 59% of the ethanol nee<strong>de</strong>d for<br />
Scenario 3, (and, correspondingly, 59% of the GHG mitigation would be achieved, as w<strong>el</strong>l as<br />
for the impacts in fossil fu<strong>el</strong> use for ethanol production, land utilization, etc).<br />
The volumes of ethanol nee<strong>de</strong>d in each case (Nogueira 2006) are shown in (Table 1.1).<br />
10
<strong>Potenciales</strong> y <strong>Viabilidad</strong> <strong><strong>de</strong>l</strong> <strong>Uso</strong> <strong>de</strong> <strong>Bioetanol</strong> y <strong>Biodies<strong>el</strong></strong> <strong>para</strong> <strong>el</strong> Transporte en México (SENER-BID-GTZ)<br />
Task 6: Potentials in r<strong>el</strong>ation to sustainability criteria<br />
Table 1.1<br />
Ethanol <strong>de</strong>mand for the three proposed scenarios, M m 3 / year<br />
Scenario 1 0.412<br />
2006 2010 (1)<br />
Scenario 2 0.912 1.11 to 1.153<br />
Scenario 3 3.897 4.406 to 4.582<br />
Scenario 3-b 2.298 2.599 to 2.703<br />
(1) The two values for 2010 are based on market growth estimates by<br />
PEMEX (3% or 3.3% /year) as discussed in (Nogueira L. A. H. 2006).<br />
Although the ethanol <strong>de</strong>mands in two of the proposed scenarios seem r<strong>el</strong>ativ<strong>el</strong>y small, they are<br />
quite realistic in representing the way the introduction of biofu<strong>el</strong>s is being ma<strong>de</strong> in many<br />
countries, and (especially in Scenario 3) the nature and magnitu<strong>de</strong> of the most important<br />
impacts, positive or negative, can be established.<br />
For the scenarios proposed, the working group (SENER-BID-GTZ-Consultores) s<strong>el</strong>ected for<br />
evaluation the biomass options and technologies shown in (Table 1.2).<br />
Table 1.2 Pr<strong>el</strong>iminary s<strong>el</strong>ection: biomass option, water, technologies<br />
Crop Region Water Technologies<br />
Sugar Cane Bajo Papaloapan, Huastecas, Balsas Rain fed and Irrigation Conventional and Hydrolysis<br />
Corn Mar <strong>de</strong> Cortés Irrigation Conventional<br />
Wheat Mar <strong>de</strong> Cortés Irrigation Conventional<br />
Sorghum (grain) Golfo Norte Rain fed Conventional<br />
Sugar beets Mar <strong>de</strong> Cortés Irrigation Conventional<br />
Tropical beets Bajo Papaloapan and Peninsular Rain fed Conventional<br />
Cassava Bajo Papaloapan and Peninsular Rain fed Conventional<br />
Latter the analysis <strong>de</strong>v<strong>el</strong>oped in (Lazcano 2006b) consi<strong>de</strong>red the options of biomass feedstock<br />
for ethanol in Mexico, taking into account the experience with the culture, and the water and<br />
soil conditions and availability (already with some insights on the possible competition for<br />
land for food crops). The subject was also consi<strong>de</strong>red when looking specifically at the<br />
processes availability (Nogueira 2006) and some limitation in the scope was introduced. The<br />
analysis (with different <strong>de</strong>pths, due to data availability) was performed for sugar cane, corn,<br />
sweet sorghum, cassava and sugar beets.<br />
11
<strong>Potenciales</strong> y <strong>Viabilidad</strong> <strong><strong>de</strong>l</strong> <strong>Uso</strong> <strong>de</strong> <strong>Bioetanol</strong> y <strong>Biodies<strong>el</strong></strong> <strong>para</strong> <strong>el</strong> Transporte en México (SENER-BID-GTZ)<br />
Task 6: Potentials in r<strong>el</strong>ation to sustainability criteria<br />
1.2 Context: the ethanol markets<br />
The search for alternative energy supplies is growing, un<strong>de</strong>r the pressure of oil supply<br />
difficulties and the threat of green house gases emissions and global climate change. Some<br />
figures for the end of 2004 are representative of the oil supply situation: the world’s oil<br />
<strong>de</strong>mand was at 83 M barr<strong>el</strong>s / day, very close to the limit of extraction; OECD economies<br />
already had a <strong>de</strong>ficit of 25 M barr<strong>el</strong>s / day. Main concerns were the rise in energy<br />
consumption of the so called emerging economies: China produced 3.57 M barr<strong>el</strong>s / day<br />
(2004) and the <strong>de</strong>mand was already 6.35 M barr<strong>el</strong>s / day; India produced 0.8 M barr<strong>el</strong>s / day,<br />
with a <strong>de</strong>mand of 2.3 M b/ day. The US alone imported 11.7 M barr<strong>el</strong>s / day (cru<strong>de</strong>) and 0.85<br />
M barr<strong>el</strong>s / day of gasoline.<br />
Ethanol production and use is in rapid expansion worldwi<strong>de</strong>; in 2005 production was expected<br />
to reach 38.2 M m3 (16 M m3 from Brazil). Estimates for 2010 are above 60M m3 (F O<br />
Lichts 2004). Recently IEA estimates, consi<strong>de</strong>ring the established programs in the EU, USA,<br />
Canada and Brazil, indicated a <strong>de</strong>mand for 66 M m3 ethanol, in 2010 (Fulton and Howes<br />
2004). Ethanol corresponds to 90% of the biofu<strong>el</strong>s (10% is biodies<strong>el</strong>) today. Forecasts beyond<br />
2010 still indicate strong growth, most of it coming from the rapid spreading of blends up to<br />
10% ethanol (volume) (in many countries, but especially the U.S.) and to the impact of the<br />
Flex Fu<strong>el</strong> cars in Brazil. National policies lead in this direction, and some countries (in<br />
Europe, or Japan) are looking also to the use of ethanol in ETBE.<br />
The most common way to use ethanol is through its blending with gasoline, since the<br />
miscibility of both is very good (especially if the ethanol is anhydrous) and the application in<br />
spark ignition (Otto cycle) engines does not require vehicle modifications when it is ben<strong>de</strong>d up<br />
to 10% ethanol by volume (Joseph Jr. 2005).<br />
In the USA, public acceptance, automakers endorsement and refu<strong>el</strong>ing infrastructure<br />
investments led to the routine use of ethanol in blends with gasoline; today, one out of every<br />
eight gallons of gasoline sold in the USA contains ethanol. In Brazil, all the gasoline sold<br />
contains 20% ethanol and the sales of flexible fu<strong>el</strong> vehicles and pure ethanol vehicles led to<br />
more than 40% (average) ethanol in the fu<strong>el</strong> for all Otto cycle engines.<br />
Countries already using ethanol blends in 2004 are shown in (Table 1.3).<br />
Table 1.3 Ethanol blends used, 2005<br />
Ethanol<br />
Blend, % v<br />
5 Swe<strong>de</strong>n, India<br />
7 Paraguay<br />
10 Canada, Australia, Thailand, China, Colombia, Peru, U.S.A (also E-85)<br />
25 Brazil (also E-100 and Flex-Fu<strong>el</strong> cars)<br />
12
<strong>Potenciales</strong> y <strong>Viabilidad</strong> <strong><strong>de</strong>l</strong> <strong>Uso</strong> <strong>de</strong> <strong>Bioetanol</strong> y <strong>Biodies<strong>el</strong></strong> <strong>para</strong> <strong>el</strong> Transporte en México (SENER-BID-GTZ)<br />
Task 6: Potentials in r<strong>el</strong>ation to sustainability criteria<br />
The main reasons for the fast spreading of the use of ethanol blends have been:<br />
It is an effective and environmentally-sound way to complement gasoline supplies;<br />
Miscibility of ethanol and gasoline is good;<br />
Durability of gasoline is not affected by ethanol;<br />
Vehicle performance is maintained;<br />
Vehicle drivability is kept or improved;<br />
Corrosion on vehicle metallic materials is not affected; and<br />
The vehicle durability is maintained.<br />
The <strong>de</strong>v<strong>el</strong>opment of markets for ethanol has followed different routes in each country. The<br />
most advanced case, in Brazil, can be summarized as follows:<br />
• The increase in the % of anhydrous ethanol ad<strong>de</strong>d to gasoline to the maximum<br />
lev<strong>el</strong> acceptable by the existing fleet of gasoline vehicles; firstly to 22% (objective<br />
achieved in 1984), and more recently increased to 25% +/- 1%.<br />
• Introduction of pure-ethanol cars (starting August 1979).<br />
• A third stage is now un<strong>de</strong>rway with the introduction of “flex-fu<strong>el</strong>” cars in March<br />
2003, currently accounting for more than 70% of total light auto-vehicle sales.<br />
Blends have been used to allow for fluctuations in ethanol production / <strong>de</strong>mand, as shown in<br />
(Figure 1.1) for Brazil (Macedo and Nogueira 2005).<br />
25%<br />
20%<br />
15%<br />
10%<br />
5%<br />
0%<br />
1974 1978 1982 1986 1990 1994 1998 2002<br />
Figure 1.1 Evolution of anhydrous ethanol content in gasoline, Brazil<br />
13
<strong>Potenciales</strong> y <strong>Viabilidad</strong> <strong><strong>de</strong>l</strong> <strong>Uso</strong> <strong>de</strong> <strong>Bioetanol</strong> y <strong>Biodies<strong>el</strong></strong> <strong>para</strong> <strong>el</strong> Transporte en México (SENER-BID-GTZ)<br />
Task 6: Potentials in r<strong>el</strong>ation to sustainability criteria<br />
2. Impacts in the use of fossil energy<br />
2.1 Introduction: the world context<br />
The world supply of energy is based on fossil fu<strong>el</strong>s (75%); the scale on which fossil fu<strong>el</strong>s are<br />
used quickly leads to <strong>de</strong>pletion of some sources, leaving a heavy additional load for the future<br />
generations. Additionally, the use of fossil fu<strong>el</strong>s is responsible for a large load of local<br />
pollution and most of the greenhouse gases emissions. The use of energy should grow as a<br />
result of the advance of many of the world’s <strong>de</strong>v<strong>el</strong>oping regions. The current challenge is to<br />
seek renewable energy sources and to increase efficiencies in energy generation and use on an<br />
unprece<strong>de</strong>nted scale.<br />
The answers to this challenge have been, for some time, the efforts towards energy efficiency<br />
(generation and end use). They have been successful to some extent, including the public<br />
awareness of the problem; however the growing evi<strong>de</strong>nce on the Global Warming problems<br />
and the fast <strong>de</strong>v<strong>el</strong>opment in many of the world’s regions leave no doubt about the need for<br />
reducing fossil fu<strong>el</strong> utilization. Today most nations are looking for alternative, renewable<br />
energy sources; a significant number of programs are un<strong>de</strong>r way, most of them using subsidies<br />
to promote insertion in the national energy systems.<br />
The diversification of energy sources, with focus on renewable energy, aims at increasing<br />
energy security and reducing the global environmental problems with the emission of<br />
greenhouse gases.<br />
2.2 Supply and use of <strong>el</strong>ectricity and fu<strong>el</strong>s in Mexico<br />
Mexico shows a strong <strong>de</strong>pen<strong>de</strong>ncy on oil as a primary energy source (un<strong>de</strong>rstandably, due to<br />
the large production today). Oil and Gas represented 82.4% of Mexico’s Domestic Energy<br />
Supply in 2004 (SENER 2005); in Brazil (MME 2005) it was 48.0%, in the same year; and<br />
the world’s final energy consumption from oil and gas was 59.2% in 2002.<br />
The need for consi<strong>de</strong>ring the <strong>de</strong>v<strong>el</strong>opment of new energy sources seems to be w<strong>el</strong>l un<strong>de</strong>rstood<br />
and some measures are being taken in this direction. A comprehensive analysis of the situation<br />
and possibilities for <strong>de</strong>v<strong>el</strong>opments in one of the renewable energy areas (bio-energy) has<br />
recently been published by the Comisión Nacional Forestal (Masera 2006). Many other<br />
documents have focused in the <strong>de</strong>v<strong>el</strong>opment of bio-ethanol programs.<br />
The legislation for Promotion and Dev<strong>el</strong>opment of Bioenergy, in discussion, establishes a<br />
maximum of 10% of ethanol blend in the gasoline. It consi<strong>de</strong>rs the agricultural <strong>de</strong>v<strong>el</strong>opment<br />
nee<strong>de</strong>d for the implementation (Martinez 2006).<br />
14
<strong>Potenciales</strong> y <strong>Viabilidad</strong> <strong><strong>de</strong>l</strong> <strong>Uso</strong> <strong>de</strong> <strong>Bioetanol</strong> y <strong>Biodies<strong>el</strong></strong> <strong>para</strong> <strong>el</strong> Transporte en México (SENER-BID-GTZ)<br />
Task 6: Potentials in r<strong>el</strong>ation to sustainability criteria<br />
2.3 Bio-ethanol (and co-generated <strong>el</strong>ectricity) and its impact on<br />
the energy supply: the substitution of fossil fu<strong>el</strong>s<br />
When bio-ethanol is consi<strong>de</strong>red for fossil energy substitution it is necessary to take into<br />
account not only positive effect of the gasoline substitution, but also the fossil energy used in<br />
the production and utilization of ethanol, and the other (renewable) energy outputs of the<br />
ethanol production system.<br />
With the technologies (and biomass materials) used today, we have two very different<br />
situations:<br />
• The biomass material is sufficient (and a<strong>de</strong>quate) as feedstock for the conversion to<br />
ethanol and to supply the energy required for the conversion process (sugar cane, for<br />
example; and the ethanol from hydrolysis of lignoc<strong>el</strong>lulosic material, in the future)<br />
• The conversion process needs energy inputs from fossil fu<strong>el</strong>s (in general, all the cereal<br />
grains, other starch materials, sugar beets, etc)<br />
Typically, the ethanol from sugar cane in Brazil uses one unit of fossil fu<strong>el</strong> input to produce 8<br />
units of renewable energy (even without the surplus <strong>el</strong>ectricity production), while the ethanol<br />
from corn (U.S.) today yi<strong>el</strong>ds ~1.5 units of renewable energy for each unit of fossil fu<strong>el</strong> used.<br />
This value varies according to the consi<strong>de</strong>ration given to by-products and data on agricultural<br />
inputs, as shown in (Farrr<strong>el</strong>l 2006). So, the impacts obtained with the substitution for (fossil)<br />
energy are significantly different.<br />
This topic has to be consi<strong>de</strong>red carefully, because the r<strong>el</strong>ativ<strong>el</strong>y “low” energy gains with some<br />
of the biomass materials / processes used will be <strong>de</strong>terminant for the corresponding GHG<br />
emissions; in some cases (the ethanol from corn, today, is a good example) the energy gain<br />
will not be sufficient to promote a significant GHG reduction (with respect to the use of<br />
gasoline) in the life cycle.<br />
A second point to be noted is that, today, we do not have a commercially available, w<strong>el</strong>l tested<br />
process to produce ethanol from lignoc<strong>el</strong>lulosic feedstock. The very interesting processes of<br />
biomass gasification leading to fu<strong>el</strong> syntheses are also in <strong>de</strong>v<strong>el</strong>opment stage. Both processes<br />
could lead to liquid fu<strong>el</strong>s with very high ratios of (fu<strong>el</strong> energy output / (fossil energy input),<br />
and they may be important in the r<strong>el</strong>ativ<strong>el</strong>y near future.<br />
Since the Scenarios <strong>de</strong>fined for this study consi<strong>de</strong>r one of the two “future” options (nam<strong>el</strong>y,<br />
the use of part of the sugar cane biomass, bagasse and trash, as c<strong>el</strong>lulose feedstock to produce<br />
ethanol from hydrolysis / fermentation), we will also present estimates for the amount of<br />
energy (and the avoi<strong>de</strong>d GHG emissions) for an option consi<strong>de</strong>red closer to reality in the next<br />
ten years; however the results are only approximate, due to uncertainties in process<br />
efficiencies.<br />
A recent survey (Worldwatch 2006) of the results found the energy ratios for biomass to<br />
ethanol processes indicated:<br />
15
<strong>Potenciales</strong> y <strong>Viabilidad</strong> <strong><strong>de</strong>l</strong> <strong>Uso</strong> <strong>de</strong> <strong>Bioetanol</strong> y <strong>Biodies<strong>el</strong></strong> <strong>para</strong> <strong>el</strong> Transporte en México (SENER-BID-GTZ)<br />
Task 6: Potentials in r<strong>el</strong>ation to sustainability criteria<br />
Table 2.1 Energy ratios for ethanol production from s<strong>el</strong>ected feedstock<br />
Biomass Fossil Energy Ratio (1)<br />
Wheat ~ 2<br />
Sugar Beets ~ 2<br />
Corn ~ 1.5<br />
Sugar Cane ~ 8<br />
(1) (fu<strong>el</strong> energy output) / (fossil energy input)<br />
It must be noted that Dies<strong>el</strong> Oil and Gasoline have Fossil Energy Ratios (from cru<strong>de</strong> oil) of<br />
0.8-0.9 and 0.8, approximat<strong>el</strong>y.<br />
The Primary Energy Production in Mexico was (in 2003) 10300. PJ (from which 9300. in<br />
hydrocarbons). The Domestic Energy Supply was 6049. PJ (Martinez 2006), and the Final<br />
Energy Consumption was 4141. PJ.<br />
To evaluate the impact of ethanol production / utilization in reducing the fossil energy<br />
<strong>de</strong>mand, according to the three scenarios proposed for this study, we must compare the net<br />
fossil energy “saved” and the total energy utilization.<br />
In 2004 the final energy utilization for each type of energy r<strong>el</strong>evant to this study, in Mexico,<br />
was (Martinez 2006):<br />
Table 2.2<br />
Final Energy Consumption, Mexico 2004; % Total<br />
Total consumption: 4141. PJ<br />
Energy, % Total<br />
Gasoline and Nafta 30.0<br />
Dies<strong>el</strong> 15.1<br />
Natural Gas 10.7<br />
LPG 11.0<br />
Fu<strong>el</strong> Oil 3.4<br />
Electricity 14.2<br />
Most of the <strong>el</strong>ectricity in Mexico is produced in thermal power stations (based on fossil fu<strong>el</strong>s:<br />
fu<strong>el</strong> oil or Natural gas). For bio-ethanol production, the Fossil Energy Ratio as used here:<br />
(ethanol energy output) / (fossil energy input) indicates the impact on the use of fossil fu<strong>el</strong>s<br />
(how much fossil energy is “saved” with the use of ethanol).<br />
16
<strong>Potenciales</strong> y <strong>Viabilidad</strong> <strong><strong>de</strong>l</strong> <strong>Uso</strong> <strong>de</strong> <strong>Bioetanol</strong> y <strong>Biodies<strong>el</strong></strong> <strong>para</strong> <strong>el</strong> Transporte en México (SENER-BID-GTZ)<br />
Task 6: Potentials in r<strong>el</strong>ation to sustainability criteria<br />
The three Scenarios for ethanol production / use consi<strong>de</strong>red in this study, as discussed in the<br />
Introduction (see Table 1.1), lead to the following ethanol <strong>de</strong>mands for 2006 and 2010:<br />
Table 2.3<br />
Ethanol <strong>de</strong>mand for the three scenarios, M m 3 / year<br />
2006 2010 (1)<br />
Scenario 1 0.412<br />
Scenario 2 0.912 1.110 to 1.153<br />
Scenario 3 3.897 4.406 to 4.582<br />
2.4 Energy balances for the sugar cane to ethanol industry<br />
The energy ratios for ethanol production from sugar cane (as w<strong>el</strong>l as for other raw materials)<br />
can vary substantially <strong>de</strong>pending on the agricultural practices and productivities and the<br />
conversion processes and efficiencies. Since sugar cane and corn may become important<br />
choices for ethanol production in Mexico, and since consi<strong>de</strong>rable information is available for<br />
both (in Brazil and the U.S., respectiv<strong>el</strong>y) it is important to evaluate the range of values found.<br />
To <strong>de</strong>fine the methodology in use, the evaluation of the energy ratio for the conditions for<br />
cane production and conversion to ethanol in Brazil is summarized in the following<br />
<strong>para</strong>graphs, as w<strong>el</strong>l as for the ethanol from corn in the U.S. After that, three specific scenarios<br />
(technologies and conversion processes) for the Mexican production from sugar cane are<br />
analyzed, following the same methodology.<br />
The results for the ethanol production in Brazil have been updated to 2002 (Macedo, Leal and<br />
Silva 2003); very briefly, the production / utilization of ethanol were <strong>de</strong>fined by the following<br />
agricultural <strong>para</strong>meters:<br />
• Brazilian Center South region (85% of the sugar cane produced) uses 35% of<br />
mechanical harvesting; and 20% of unburned cane harvest.<br />
• Averages for 5 years (1998 to 2002) are:<br />
Pol % cane : 14.53%<br />
Fiber % cane : 13.46%<br />
Cane productivity: 82.4 t/ha (harvested area)<br />
Mean harvested area distance from sugar mill: 20 km<br />
Vinasse application in 30% of the ratoon area<br />
Fertilizer application: (Table 2.4)<br />
17
<strong>Potenciales</strong> y <strong>Viabilidad</strong> <strong><strong>de</strong>l</strong> <strong>Uso</strong> <strong>de</strong> <strong>Bioetanol</strong> y <strong>Biodies<strong>el</strong></strong> <strong>para</strong> <strong>el</strong> Transporte en México (SENER-BID-GTZ)<br />
Task 6: Potentials in r<strong>el</strong>ation to sustainability criteria<br />
Table 2.4 Fertilizers in cane production, Brazil, 2002<br />
Plant Cane (kg/ha)<br />
Ratoon (kg/ha)<br />
Scenario 1 Scenario 2* Scenario 1 Scenario 2*<br />
Nitrogen N 30 - 80 90<br />
Phosphorus - P 2 O 5 120 50 25 -<br />
Potassium - K 2 O 120 80 120 -<br />
* Areas with the application of filter mud cake and vinasse (30%)<br />
Scenario 1: averages Scenario 2: best values<br />
• Energy for the production and use of lime, herbici<strong>de</strong>s and pestici<strong>de</strong>s was also<br />
consi<strong>de</strong>red, as w<strong>el</strong>l as the energy use for the production and maintenance of<br />
agricultural equipment<br />
For the industrial processing of cane to ethanol, the basic (average) <strong>para</strong>meters were, for the<br />
2001/2002 crushing season:<br />
RS (reducing sugars) 0.545%<br />
Mill extraction efficiency 96.2%<br />
Juice treatment efficiency 99.2%<br />
Sugar loss in cane washing 0.61%<br />
Fermentation efficiency 91.1%<br />
Distillation efficiency 99.6%<br />
leading to 88.7 l/t cane (anhydrous ethanol). A value of 86 l/t cane (anhydrous ethanol) was<br />
used to inclu<strong>de</strong> the averages for the North / North-East production.<br />
• The mills are s<strong>el</strong>f-sufficient in energy (both thermal energy and <strong>el</strong>ectricity). Surplus<br />
bagasse was assumed (average, ethanol plant) at 8%.<br />
• All the inputs (chemicals, lubricants, etc) and the energy spent in the construction<br />
and maintenance of buildings and equipment were consi<strong>de</strong>red (Macedo, Leal and<br />
Silva 2003)<br />
Results (Macedo, Leal and Silva 2003) are shown in the (Table 2.5), where Scenario 1<br />
represents the “average conditions” and Scenario 2 represents the “best results” achieved. The<br />
energy balance was calculated consi<strong>de</strong>ring three lev<strong>el</strong>s of energy flows: the direct<br />
consumption of external fu<strong>el</strong>s and <strong>el</strong>ectricity; the additional energy required for the production<br />
of chemicals and materials used in the agricultural and industrial processes (fertilizers, lime,<br />
seeds, herbici<strong>de</strong>s, etc); and the additional energy necessary for the manufacture, construction<br />
and maintenance of equipment and buildings.<br />
18
<strong>Potenciales</strong> y <strong>Viabilidad</strong> <strong><strong>de</strong>l</strong> <strong>Uso</strong> <strong>de</strong> <strong>Bioetanol</strong> y <strong>Biodies<strong>el</strong></strong> <strong>para</strong> <strong>el</strong> Transporte en México (SENER-BID-GTZ)<br />
Task 6: Potentials in r<strong>el</strong>ation to sustainability criteria<br />
Table 2.5<br />
Energy Generation and Consumption in the Production of Sugar Cane<br />
and Ethanol, Brazil, 2002 (Macedo, Leal and Silva 2003)<br />
Energy Consumption<br />
Scenario 1<br />
(kcal/TC)<br />
Scenario 2<br />
(kcal/TC)<br />
Sugar cane production (total) 48,208 45,861<br />
Agricultural operations 9,097 9,097<br />
Transportation 10,261 8,720<br />
Fertilizers 15,890 15,152<br />
Lime, herbici<strong>de</strong>s, pestici<strong>de</strong>s, etc. 4,586 4,586<br />
Seeds 1,404 1,336<br />
Equipment 6,970 6,970<br />
Ethanol production (total) 11,800 9,510<br />
Electricity 0 0<br />
Chemicals, lubricants 1,520 1,520<br />
Buildings 2,860 2,220<br />
Equipment 7,429 5,770<br />
External Energy Flows Input Output Input Output<br />
Agriculture 48,208 - 45,861 -<br />
Factory 11,800 - 9,510 -<br />
Ethanol produced - 459,100 - 490,100<br />
Surplus bagasse - 40,300 - 75,600<br />
Total 60,008 499,400 55,371 565,700<br />
Energy Ratio, Output / Input (fossil) 8.3 10.2<br />
The production of ethanol from sugar cane in Mexico may inclu<strong>de</strong> many options (processes<br />
and agricultural / industrial efficiencies); they have important consequences for the Fossil<br />
Energy Ratio (and consequently for the impacts in the energy sector) and for the emissions of<br />
greenhouse gases. Estimates were ma<strong>de</strong> for four cases consi<strong>de</strong>red suitable to analyze the<br />
possibilities in Mexico:<br />
• Case 1: small annexed distillery, operating with exhausted molasses. The sugar mill<br />
operating <strong>para</strong>meters and efficiencies are the average for today’s sugar mills in<br />
Mexico; only the distillery is “new”, with mo<strong>de</strong>rn fermentation / distillation systems,<br />
and conversion efficiencies equivalent to the “state of the art”.<br />
• Case 2: Autonomous (in<strong>de</strong>pen<strong>de</strong>nt) distillery, operating with cane juice. The operating<br />
<strong>para</strong>meters correspond to a new, mo<strong>de</strong>rn factory, with efficiencies equivalent to the<br />
best (commercial) systems; a co-generation system in inclu<strong>de</strong>d, at 62 bar (abs) -<br />
450°C; CEST. The steam consumption in processes corresponds to the “average”<br />
Brazilian mills (high: ~500 kg steam at 2.5 bar (abs)). This is the trend for new<br />
Brazilian ethanol distilleries (except for the CEST, existing but not used yet) aiming at<br />
increasing power exports.<br />
• Case 3: Autonomous distillery; the only differences to Case 2 are the introduction of<br />
energy efficient systems to reduce the thermal energy requirements of the processes at<br />
19
<strong>Potenciales</strong> y <strong>Viabilidad</strong> <strong><strong>de</strong>l</strong> <strong>Uso</strong> <strong>de</strong> <strong>Bioetanol</strong> y <strong>Biodies<strong>el</strong></strong> <strong>para</strong> <strong>el</strong> Transporte en México (SENER-BID-GTZ)<br />
Task 6: Potentials in r<strong>el</strong>ation to sustainability criteria<br />
the industry. They are all commercial systems; the steam consumption lowers to 350<br />
kg steam at 2.5 bar (abs) / t cane. This improves <strong>el</strong>ectricity surplus (using he CEST cogeneration<br />
scheme); many mills are consi<strong>de</strong>ring this option for the next years, in<br />
Brazil, because it will be necessary if the hydrolysis of bagasse / trash becomes<br />
commercial.<br />
• Case 4: This is an option including non-commercial technology; it would be a first step<br />
towards future (possible) systems to use hydrolysis of the cane wastes to increase<br />
ethanol production. Consi<strong>de</strong>ring Case 3, the difference is the recovery of some of the<br />
trash (40% over the 20% of the area harvested without burning; so, only 8% of the total<br />
trash). This biomass, together with the “saved” bagasse from the low steam<br />
consumption processes, is used for producing ethanol. No <strong>el</strong>ectricity surplus is sought:<br />
all biomass goes to ethanol.<br />
A summary of the <strong>de</strong>tailed estimates are inclu<strong>de</strong>d in the Annex 1; the final results are:<br />
Table 2.6<br />
External Energy Flows: ethanol and <strong>el</strong>ectricity, Case Studies<br />
(Annex 1)<br />
Unity Case 1 Case 2 Case 3 Case 4 (1)<br />
Production<br />
Ethanol m³/t cane 10.8 (2) 83.5 83.5 102. (3)<br />
Electricity<br />
Total kWh/t cane 73 84 45<br />
Surplus (sold) MW/mill n.a. 25 30 0<br />
kWh/t cane (-1.25) (4) 54 65 0<br />
Fossil Energy Ratio 2.7 9.7 10.2 8.6<br />
(1) Ethanol production from sucrose and from c<strong>el</strong>lulose<br />
(2) Ethanol from molasses, only; a value of 10.8 l / t cane was used.<br />
(3) From sucrose (84 l/t cane) plus hydrolysis and fermentation (268 l/t (Dry Matter).<br />
(4) Applying to all cane (sugar + ethanol)<br />
It is clear that Case 1 (corresponding to the lowest investment, immediate adding of a small<br />
distillery to the existing sugar mill) carries the inefficiency of external fu<strong>el</strong> oil and <strong>el</strong>ectricity<br />
use at the industry today (not s<strong>el</strong>f sufficient) leading to a r<strong>el</strong>ativ<strong>el</strong>y low energy ratio. Case 1 is<br />
presented in Annex 1, with the <strong>para</strong>meters for the sugar mills today; the calculations follow<br />
clos<strong>el</strong>y the mo<strong><strong>de</strong>l</strong> presented in (Macedo, Leal and Silva 2003). Case 4 is a future, hypothetical<br />
system but probably possible in some years; actually, much higher biomass use (from trash)<br />
may eventually be possible. Cases 2 and 3 are w<strong>el</strong>l representative of the expected new,<br />
mo<strong>de</strong>rn in<strong>de</strong>pen<strong>de</strong>nt distilleries including co-generation; so an energy ratio ~10 is expected.<br />
20
<strong>Potenciales</strong> y <strong>Viabilidad</strong> <strong><strong>de</strong>l</strong> <strong>Uso</strong> <strong>de</strong> <strong>Bioetanol</strong> y <strong>Biodies<strong>el</strong></strong> <strong>para</strong> <strong>el</strong> Transporte en México (SENER-BID-GTZ)<br />
Task 6: Potentials in r<strong>el</strong>ation to sustainability criteria<br />
2.5 Energy balance for the corn to ethanol industry<br />
There has been much public <strong>de</strong>bate in the US about the net energy of ethanol from corn:<br />
whether producing ethanol takes more non-renewable energy than the resulting fu<strong>el</strong> provi<strong>de</strong>s.<br />
Actually the ratio of output/input energy (fossil energy ratio) is much smaller than the ratio<br />
found in the production of ethanol from sugar cane in Brazil; of course the difference comes<br />
mainly from the fact that ethanol from corn needs external (usually fossil) fu<strong>el</strong> for the<br />
conversion process, while ethanol from sugar cane uses only its own bagasse as a source of<br />
energy. Detailed calculations of the energy ratio and its variations, as w<strong>el</strong>l as the direct<br />
calculations of the GHG emissions (and the mitigation, consi<strong>de</strong>ring the gasoline substituted<br />
for) are found in (Farr<strong>el</strong>l 2006).<br />
The last analyses show clearly that (Farr<strong>el</strong>l 2006), for the production conditions found today,<br />
current ethanol technologies are less fossil fu<strong>el</strong> <strong>de</strong>pen<strong>de</strong>nt than gasoline. The best estimate<br />
indicates that GHG emissions reduction, with respect to gasoline, are small (~13 %); the<br />
energy ratios (energy output as ethanol to energy input, including oil, natural gas , coal and<br />
other) have been reported in studies from 1995 to 2002 to be from 1.24 to 1.34, and in 2004<br />
the USDA reported a 1.67 value. This corresponds to much larger corn yi<strong>el</strong>ds (125<br />
bu/harvested acre); larger corn to ethanol conversion ratios (2. to 2.8 gallons / bu) and lower<br />
fertilizer (Nitrogen) inputs. Also the se<strong>para</strong>te account of the energy used in by-products was<br />
consi<strong>de</strong>red (USDA 2004).<br />
The values chosen for this study are the “ethanol today” results presented recently (Farr<strong>el</strong>l<br />
2006) with the actual values for the U. S. agro-industry; for the productivities assumed, the<br />
agricultural inputs will be similar to the used in the U.S., and the industrial conversion would<br />
be essentially the same. Net energy values consi<strong>de</strong>red the input energy (energy in ethanol,<br />
less all energy used in production of the ethanol); but they also inclu<strong>de</strong>d co-products energy<br />
credits. Parameters used for the “ethanol today” study consi<strong>de</strong>red the current mix of wet and<br />
dry milling; current crop and ethanol yi<strong>el</strong>ds; and the current inputs (fertilizers, fu<strong>el</strong>s, etc).<br />
Some values for the agricultural production are:<br />
Total energy, direct and indirect, MJ/ha: 19361 (LHV)<br />
Fertilizers: Nitrogen: 150 kg/ha; P2O5: 64 kg/ha; K2O: 99 kg/ha<br />
Herbici<strong>de</strong>: 2.8 kg/ha; Insectici<strong>de</strong>: 0.21 kg/ha;<br />
Transportation inputs: 934 MJ/ha; Gasoline 1.277 MJ/ha; Dies<strong>el</strong> 2.719 MJ/ha;<br />
Natural Gas: 670; LPG: 765; Electricity: 820<br />
Energy for irrigation: 49 MJ/ha<br />
The enegy ratio for the “ethanol today” case is 1.27 (Farr<strong>el</strong>l 2006).<br />
(Table 2.7) compares the energy use / production results for the ethanol from corn in the U.S.<br />
(wet and dry milling ) in another recent study, and the ethanol from sugar cane in Brazil<br />
(Eggeman and Verser 2005).<br />
21
<strong>Potenciales</strong> y <strong>Viabilidad</strong> <strong><strong>de</strong>l</strong> <strong>Uso</strong> <strong>de</strong> <strong>Bioetanol</strong> y <strong>Biodies<strong>el</strong></strong> <strong>para</strong> <strong>el</strong> Transporte en México (SENER-BID-GTZ)<br />
Task 6: Potentials in r<strong>el</strong>ation to sustainability criteria<br />
Table 2.7<br />
Energy Ratios for Ethanol Plants: corn and sugar cane (Eggeman and<br />
Verser 2005); (MJ/m3 ethanol)<br />
Standard Dry<br />
Mill<br />
Standard<br />
Wet Mill<br />
Cane Mill,<br />
Average (1)<br />
Fossil Energy Use<br />
Crop Products 6027 5973 1847<br />
Crop Transport 637 626 500<br />
Other Feed Stocks 0 0 0<br />
Ethanol Conversion 13594 15117 574<br />
Ethanol Distribution 443 443 0<br />
Sub Total 20751 22159 2921<br />
Co-products credit<br />
Mill Co-products 3655 4126 0<br />
Fu<strong>el</strong> or Power Exports 0 0 2921<br />
NEV (2) 6307 5369 21387<br />
Energy Ratio (3) 1.37 1.30 8.32<br />
(1) Values for Sugar Cane in Brazilian Center-South (Macedo I. C.; Leal M. R. and Silva<br />
J.R. 2003)<br />
(2) NEV: Net Energy Value: (Heating Value of Ethanol) – (Fossil Fu<strong>el</strong> Energy Use – Coproducts<br />
credits)<br />
(3) Energy ratio: (Heating Value of Ethanol + Energy Exports) / (Fossil fu<strong>el</strong> Energy Use –<br />
Mill co-products)<br />
In Mexico, the proposed ethanol from corn process would be exactly like the industrial<br />
processes in the U.S. today; the productivities expected (see Table 6.4, Chapter 6) for irrigated<br />
areas would need the same lev<strong>el</strong>s of agricultural inputs. So, for this study we assume that the<br />
energy ratio today will also be close to 1.3. We are aware that the actual productivities today,<br />
for most of the areas in Mexico, are much lower; however, as pointed out by Nogueira in<br />
theReport on Task 5, we are consistently using the estimates provi<strong>de</strong>d by the studies on the<br />
Tasks 3 and 4, for future conditions.<br />
2.6 Estimates for sorghum, beets, cassava, other<br />
For sweet sorghum, the best information available is based on the important agronomic studies<br />
in Southern Africa (mostly in Zimbabwe) in the last <strong>de</strong>ca<strong>de</strong>. Analyzing different production /<br />
utilization systems (including the combined production with sugarcane) and using essentially<br />
the same processing (milling) systems as for sugar cane, energy ratios of ~4 were achieved<br />
(simulation) (Woods 2000). This inclu<strong>de</strong>d the agronomic and industrial processes. Again, as<br />
in sugar cane, the use of the bagasse to supply energy to the industrial unit is essential for the<br />
r<strong>el</strong>ativ<strong>el</strong>y high energy ratio.<br />
22
<strong>Potenciales</strong> y <strong>Viabilidad</strong> <strong><strong>de</strong>l</strong> <strong>Uso</strong> <strong>de</strong> <strong>Bioetanol</strong> y <strong>Biodies<strong>el</strong></strong> <strong>para</strong> <strong>el</strong> Transporte en México (SENER-BID-GTZ)<br />
Task 6: Potentials in r<strong>el</strong>ation to sustainability criteria<br />
In Mexico the important sorghum production is almost all grain sorghum (not sweet sorghum).<br />
It will present the problem of all cereal grains: since they can not provi<strong>de</strong> all the biomass<br />
nee<strong>de</strong>d for the energy requirements in the industrial processing, they need external energy (as<br />
corn) and this leads to low energy ratios. In general, studies of processes for ethanol from<br />
grains (corn, wheat) presents energy ratios at 1.3 – 1.8 (corn) and 1.0 – 1.2 (wheat) and some<br />
results are even
<strong>Potenciales</strong> y <strong>Viabilidad</strong> <strong><strong>de</strong>l</strong> <strong>Uso</strong> <strong>de</strong> <strong>Bioetanol</strong> y <strong>Biodies<strong>el</strong></strong> <strong>para</strong> <strong>el</strong> Transporte en México (SENER-BID-GTZ)<br />
Task 6: Potentials in r<strong>el</strong>ation to sustainability criteria<br />
(Table 2.8) shows the expected impacts from the use of different biomass sources to substitute<br />
for 10% of the ethanol in Mexico. The Final Energy Use profile is for 2004 (Table 1-02). As<br />
expected, there are large differences <strong>de</strong>pending on the biomass source (processes). In some<br />
cases the energy use in the processes may be very high, and if the biomass source does not<br />
supply it the balance may be close to zero. The outstanding position of sugar cane is due to the<br />
use of bagasse; sugar cane biomass is 2/3 c<strong>el</strong>lulosic (bagasse and trash) and only 1/3 is<br />
sucrose, converted to ethanol. Bagasse can supply the energy for processes and produce<br />
surpluses (in this case, <strong>el</strong>ectricity). This is also important for the balance of GHG emissions, as<br />
seen in Chapter 3.<br />
Table 2.8<br />
Expected impacts in the energy production and use in Mexico with the<br />
introduction of 10% ethanol in gasoline; values for 2004<br />
Fossil<br />
Energy<br />
Ratio<br />
Bio-Energy Produced Energy Used (5)<br />
Ethanol, % Electricity, % Energy, % (Dies<strong>el</strong><br />
Gasoline Total Electricity +NG+ Fu<strong>el</strong> Oil)<br />
(1)<br />
(2)<br />
(3)<br />
Corn 1.3 10.0 0.0 7.8<br />
Sugar Cane (4) 10.0 (7) 10.0 2.4 (T); 1.8 (S<strong>el</strong>l) 1.0<br />
Sugar beets 2.0 10.0 0.0 5.1<br />
Sweet Sorghum 4.0 10.0 0.0 (6) 2.6<br />
Wheat 2.0 10.0 0.0 5.1<br />
Cassava 1.0 10.0 0.0 10.2<br />
(1) Ethanol Produced as percentage of the Total Gasoline Consumption, 2004: 1242. PJ<br />
(Table 2.2); programs <strong>de</strong>fined for 10% blend in all gasoline (Scenario 3)<br />
(2) Electricity co-generated in the program, as percentage of Total Electricity Used in<br />
2004: 588. PJ (Table 1-02)<br />
(3) Total use of Dies<strong>el</strong>, NG and Fu<strong>el</strong> Oil in 2004: 1209. PJ (Table 1-02)<br />
(4) Electricity production: 14.2 PJ (total); 10.9 PJ (surplus, to s<strong>el</strong>l); 3.3 PJ (internal use)<br />
(5) Energy (external) used by the processes to produce the ethanol, as percentage of the fu<strong>el</strong><br />
supply in 2004 (Dies<strong>el</strong> +NG+ Fu<strong>el</strong> Oil). When <strong>el</strong>ectricity is bought, the value equivalent to<br />
the primary energy for generation (fu<strong>el</strong>) is consi<strong>de</strong>red here<br />
(6) Sweet sorghum co-generated energy (with residues) covers a portion of the <strong>el</strong>ectricity<br />
needs, but here it is not producing surplus power. It may improve in the future.<br />
(7) Corresponds to the installation of new units (Cases 2 and 3)<br />
As an example, sugar cane based ethanol, in Scenario 3, would substitute for 10% of the<br />
gasoline utilization; it also would supply (with co-generation) 1.8% of the <strong>el</strong>ectricity used in<br />
Mexico (for all other sectors) and 0.6% of the total <strong>el</strong>ectricity in Mexico (for its own needs).<br />
On the other hand, the production system would need to use 1.0% of the fossil energy used in<br />
Mexico (dies<strong>el</strong>, Natural gas or fu<strong>el</strong> oil).<br />
24
<strong>Potenciales</strong> y <strong>Viabilidad</strong> <strong><strong>de</strong>l</strong> <strong>Uso</strong> <strong>de</strong> <strong>Bioetanol</strong> y <strong>Biodies<strong>el</strong></strong> <strong>para</strong> <strong>el</strong> Transporte en México (SENER-BID-GTZ)<br />
Task 6: Potentials in r<strong>el</strong>ation to sustainability criteria<br />
2.8 Summary and Conclusions<br />
Mexico’s strong <strong>de</strong>pen<strong>de</strong>ncy on oil and gas as primary energy sources (82.4% of Domestic<br />
Energy Supply) led to consi<strong>de</strong>r the possibilities for bio-ethanol blends with gasoline. The<br />
various biomass feedstock and conversion processes proposed, for Mexico conditions, present<br />
energy ratios (energy output / fossil energy inputs) varying from nearly one (corn: 1.3) to ten<br />
(sugar cane, with co-generation). Sweet sorghum ratio is ~4; wheat and sugar beets ratios are<br />
~2; and cassava is ~1.<br />
Four process options for sugar cane were analyzed; the energy ratio for the annexed distillery<br />
(energy efficiencies as today) would be only 2.7. The s<strong>el</strong>ected case is for a mo<strong>de</strong>rn distillery<br />
with co-generation, using only bagasse.<br />
The impacts in the energy sector of using ethanol blends are basically: the reduction of<br />
<strong>de</strong>mand for gasoline and <strong>el</strong>ectricity (when there is surplus power co-generated) and the<br />
increase in <strong>de</strong>mand of dies<strong>el</strong> and some <strong>el</strong>ectricity (for agricultural and industrial processes).<br />
Impacts of the introduction of 10% ethanol in gasoline in Mexico would be:<br />
Gasoline substituted<br />
% total gasoline<br />
Electricity substituted<br />
% total <strong>el</strong>ectricity<br />
(D+NG+FO) used,<br />
% total (D+NG+FO)<br />
Sugar cane 10 1.8 1.<br />
Corn 10 7.8<br />
Sugar beets 10 5.1<br />
Sweet Sorghum 10 2.6<br />
Wheat 10 5.1<br />
Cassava 10 10.2<br />
(D + NG + FO): dies<strong>el</strong> + natural gas + fu<strong>el</strong> oil<br />
With the choice of suitable systems the introduction of ethanol in gasoline in Mexico can<br />
provi<strong>de</strong> a fast and efficient diversification of energy sources. Other opportunities (like the<br />
efficient use of bagasse / trash energy in the existing sugar mills, even for sugar production)<br />
would also be important.<br />
25
<strong>Potenciales</strong> y <strong>Viabilidad</strong> <strong><strong>de</strong>l</strong> <strong>Uso</strong> <strong>de</strong> <strong>Bioetanol</strong> y <strong>Biodies<strong>el</strong></strong> <strong>para</strong> <strong>el</strong> Transporte en México (SENER-BID-GTZ)<br />
Task 6: Potentials in r<strong>el</strong>ation to sustainability criteria<br />
3. Impacts on global climate: greenhouse gas emissions<br />
3.1 Introduction; concepts and the world context<br />
The 30-percent increase in the concentration of greenhouse gases in the atmosphere since preindustrial<br />
times corresponds to an average increase of 0.6ºC in the surface temperature of the<br />
planet. In the 21 st century, the mean temperature may increase by more than 3ºC if the current<br />
trend is not changed. The Kyoto Protocol represents one step towards preventing an increase<br />
of up to 2ºC by 2050. The global climate mo<strong><strong>de</strong>l</strong>s, yet evolving, always point to temperature<br />
rises but the uncertainties about the rainfall are high. There is no agreement on the results for<br />
rainfall, but climate extremes (droughts, severe storms) are expected to occur more often.<br />
A vulnerability assessment of the agricultural sector should consi<strong>de</strong>r the simultaneous effects<br />
of the temperature (and rains) and the “fertilization” by the increased concentration of CO 2 .<br />
There are not sufficient studies, and very little is known about specific regions.<br />
Biofu<strong>el</strong>s production and use, substituting for fossil fu<strong>el</strong>s, may be of great importance to h<strong>el</strong>p<br />
mitigating GHG emissions in the near future. This <strong>de</strong>pends strongly on the processes used to<br />
obtain the biofu<strong>el</strong>, particularly on the use of fossil fu<strong>el</strong>s in the life cycle of biofu<strong>el</strong>s production<br />
/ utilization. In the Brazilian sugar-cane to ethanol industry, the “renewable energy produced<br />
to fossil energy used” ratio is 8.3; this is an extraordinary performance, allowing the industry<br />
to h<strong>el</strong>p avoiding GHG emissions equivalent to 13 percent of the emissions from Brazil’s entire<br />
energy sector (1994).<br />
Each biofu<strong>el</strong> (in its production / utilization life cycle) has a different ability to mitigate GHG<br />
emissions. In the following sections we will report the results for the ethanol from sugar cane<br />
(in Brazil) and ethanol from corn (USA), based on the two w<strong>el</strong>l known production systems,<br />
and estimate the values for the equivalent production in Mexico, with the production<br />
<strong>para</strong>meters today and some possible gains in the near future.<br />
Some estimates for GHG emissions from cassava, wheat and sorghum ethanol production,<br />
with possible production systems in Mexico, are also <strong>de</strong>v<strong>el</strong>oped. Actual data on these<br />
processes is still scarce and the estimates are much less accurate than for corn or sugar cane;<br />
but they are sufficient to allow for a pr<strong>el</strong>iminary evaluation of impacts.<br />
It is important to note again (as we did in Chapter 2) that Bio-ethanol substitutes for gasoline;<br />
in blends up to 10%, it may be assumed (based on experimental data) that the substitution is<br />
nearly 1 liter ethanol for 1 liter gasoline (Nogueira 2006), concerning the vehicle economy<br />
(km/liter of fu<strong>el</strong>). This equivalence is used to calculate the avoi<strong>de</strong>d GHG emissions when<br />
using bio-ethanol, in this study. This is not done when consi<strong>de</strong>ring higher blends, or even<br />
straight ethanol; in each case, the “practical” (achieved) r<strong>el</strong>ation for the commercial engines<br />
must be used. Even for the E-100 the use of the ratio between the heating values of gasoline<br />
and ethanol is not a<strong>de</strong>quate, since the E-100 engines have a higher compression ratio (and<br />
consequently higher efficiency).<br />
26
<strong>Potenciales</strong> y <strong>Viabilidad</strong> <strong><strong>de</strong>l</strong> <strong>Uso</strong> <strong>de</strong> <strong>Bioetanol</strong> y <strong>Biodies<strong>el</strong></strong> <strong>para</strong> <strong>el</strong> Transporte en México (SENER-BID-GTZ)<br />
Task 6: Potentials in r<strong>el</strong>ation to sustainability criteria<br />
3.2 Greenhouse gases emissions in ethanol from sugar cane<br />
production and use; estimates for Mexico<br />
The analysis of GHG emissions in the ethanol production in Brazil has been updated to 2002<br />
(Macedo, Leal and Silva 2003). The summary of the main results in fossil energy use are<br />
presented in Chapter 2. The emissions of GHG were evaluated consi<strong>de</strong>ring the fossil fu<strong>el</strong> uses<br />
in agriculture and in the industry, and also the emissions associated with sugar cane<br />
production, cane processing for ethanol and final use of ethanol (as fu<strong>el</strong>) that are not <strong>de</strong>rived<br />
from use of fossil fu<strong>el</strong>s; the most important are:<br />
• Methane and N 2 O emissions from the burning of sugar cane trash before harvesting;<br />
• N 2 O emissions from soil, due to fertilizer application<br />
Results (Macedo, Leal and Silva 2003) show that for each ton of cane produced and<br />
processed to ethanol the average total emissions of GHG is 34.5 kg CO 2 eq. / t cane; best<br />
values are 33.0 kg CO 2 eq. / t cane. Those values correspond to 0.40 kg CO 2 eq. / l<br />
anhydrous ethanol (average), for the Brazilian cane productivity and industrial yi<strong>el</strong>d.<br />
The emissions avoi<strong>de</strong>d with the use of ethanol substituting for gasoline <strong>de</strong>pend strongly on the<br />
engine technology used: in Brazil, it is accepted (based on the vehicle performance) that:<br />
1 l of hydrous ethanol (E-100 engines) = 0.7 l of gasoline<br />
1 l of anhydrous ethanol (E-25 engine) = 1 liter of gasoline<br />
Since gasoline has (direct + indirect) GHG emissions of 2.80 kg CO 2 eq. / l gasoline, it is seen<br />
that the use of ethanol in blends with gasoline can avoid the emission of 2.40 t CO 2 eq. / m 3<br />
anhydrous ethanol, or 17.9 g CO 2 eq / MJ.<br />
Using the same methodology for the four Cases studied in Annex 1 to represent different<br />
ethanol from sugar cane production systems in Mexico (near term) the following results are<br />
obtained:<br />
Table 3.1<br />
Summary of Greenhouse Gas Emissions and Avoi<strong>de</strong>d Emissions,<br />
ethanol from sugar cane, Mexico Case Studies (Annex 1)<br />
(kg CO 2 eq / l anhydrous ethanol)<br />
Case 1 Case 2 Case 3 Case 4<br />
Emissions from processes 0.84 0.43 0.43 0.36<br />
Dies<strong>el</strong> oil 0.07 0.07 0.07 0.06<br />
Fu<strong>el</strong> oil 0.55 0.16 0.16 0.14<br />
Natural Gas (power generation) 0.01 0.00 0.00 0.00<br />
Cane burning 0.13 0.11 0.11 0.09<br />
N 2 O from soil 0.08 0.09 0.09 0.07<br />
Avoi<strong>de</strong>d emissions -2.80 -3.15 -3.22 -2.80<br />
Surplus <strong>el</strong>ectricity 0.00 -0.35 -0.42 0.00<br />
Anhydrous ethanol (1) -2.80 -2.80 -2.80 -2.80<br />
Net Avoi<strong>de</strong>d Emissions -1.96 -2.72 -2.79 -2.44<br />
27
<strong>Potenciales</strong> y <strong>Viabilidad</strong> <strong><strong>de</strong>l</strong> <strong>Uso</strong> <strong>de</strong> <strong>Bioetanol</strong> y <strong>Biodies<strong>el</strong></strong> <strong>para</strong> <strong>el</strong> Transporte en México (SENER-BID-GTZ)<br />
Task 6: Potentials in r<strong>el</strong>ation to sustainability criteria<br />
(1) 1 L anhydrous ethanol ≅ 1 L gasoline, used in blends up to 10% vol. This has been shown<br />
in the Report on Task 5.<br />
As in the study of energy impacts, we will consi<strong>de</strong>r an option like Cases 2 or 3 to be a<strong>de</strong>quate<br />
for this analysis; They are w<strong>el</strong>l representative of the expected new, mo<strong>de</strong>rn in<strong>de</strong>pen<strong>de</strong>nt<br />
distilleries including co-generation; so emissions of ~ 0.43 kg CO 2 eq / l anhydrous ethanol<br />
and avoi<strong>de</strong>d emissions of 2.72 kg CO 2 eq / l anhydrous ethanol will be consi<strong>de</strong>red.<br />
3.3 Greenhouse gases emissions in ethanol from corn production<br />
and use<br />
The values presented for the energy ratio (see Chapter 2) are the “ethanol today” results from<br />
(Farr<strong>el</strong>l 2006) with today’s values for the U. S. agro-industry. The GHG emissions were<br />
calculated for the feedstock and fu<strong>el</strong> production (agricultural and bio-refinery) without<br />
including soil carbon sequestration. Again, CO 2 , N 2 0 and methane were the gases consi<strong>de</strong>red,<br />
with their GWP for 100 years and IPCC coefficients. As in the case for sugar cane, emissions<br />
<strong>de</strong>rived from fossil fu<strong>el</strong> utilization (direct and indirect) were consi<strong>de</strong>red, as w<strong>el</strong>l as emissions<br />
not r<strong>el</strong>ated to fossil fu<strong>el</strong>s (nitrous oxi<strong>de</strong> from fertilizers, for example).<br />
The results for the “ethanol today” case is: GHG emissions (kg CO 2 eq. / l anhydrous ethanol)<br />
are ~ 1.81 (kg CO 2 eq. / l anhydrous ethanol. Note that in that study the equivalence between<br />
gasoline and ethanol is not 1 liter to 1 liter, but is fixed by the heating value of the fu<strong>el</strong>s; then<br />
the avoi<strong>de</strong>d emissions are r<strong>el</strong>ativ<strong>el</strong>y low (~13% with respect to gasoline).<br />
Gasoline emissions (direct + indirect) are taken as 3.0 kg CO 2 eq. / l gasoline. This is a usual<br />
value for today’s conditions (Farr<strong>el</strong>l 2006).<br />
The proposed ethanol from corn process in Mexico would be very much like the industrial<br />
processes in the U.S. today; also the productivities expected (see Table 6.4, Chapter 6) for<br />
irrigated areas would need the same lev<strong>el</strong>s of agricultural inputs, leading to approximat<strong>el</strong>y the<br />
same emissions. For this study we assume that the GHG emissions would be 1.8 kg CO 2 eq. / l<br />
anhydrous ethanol. With gasoline emissions of 2.8 kg/l, avoi<strong>de</strong>d emissions ~1.0 kg CO 2 eq. / l<br />
anhydrous ethanol are achieved consi<strong>de</strong>ring that one liter of ethanol substitutes for one liter of<br />
gasoline, in low ethanol content blends.<br />
3.4 GHG emissions: ethanol from cassava, sorghum, sugar<br />
beets, wheat<br />
As seen in the energy analysis of ethanol production from those substrates, in some cases<br />
(sugar beets, wheat) there is r<strong>el</strong>iable information available (due to the existence of operating<br />
plants for some time). For sweet sorghum a significant volume of information was obtained<br />
from studies (yet at laboratory, pilot plant and agronomic testing scale) in Southern Africa<br />
(Woods 2000; Woods 2001). Cassava is a problem, since most of the data is old, based in very<br />
small ethanol plants; and the energy consumption values may be overestimated for today’s<br />
technologies, as seen in Chapter 2.<br />
28
<strong>Potenciales</strong> y <strong>Viabilidad</strong> <strong><strong>de</strong>l</strong> <strong>Uso</strong> <strong>de</strong> <strong>Bioetanol</strong> y <strong>Biodies<strong>el</strong></strong> <strong>para</strong> <strong>el</strong> Transporte en México (SENER-BID-GTZ)<br />
Task 6: Potentials in r<strong>el</strong>ation to sustainability criteria<br />
With a Fossil Energy Ratio ~ 2.0, European studies for ethanol from sugar beets, from 1993 to<br />
2002 (Fulton and Howes 2004) indicate GHG emissions reductions from 41 to 56% with<br />
respect to gasoline. Taking the estimate at 50%, the emissions would be ~1.40 kg CO 2 eq. / l<br />
anhydrous ethanol, and the avoi<strong>de</strong>d emissions would be also 1.40 kg CO 2 eq. / l anhydrous<br />
ethanol. The same conditions apply to Mexico.<br />
For sweet sorghum the fossil energy ratio <strong>de</strong>termined in Southern Africa (Woods 2000),<br />
including both the agricultural and industrial processes, was 4.0; an approximation (ignoring<br />
emissions not r<strong>el</strong>ate to energy use) leads to emissions of ~ 0.70 kg CO 2 eq. / l anhydrous<br />
ethanol, and avoi<strong>de</strong>d emissions of ~ 2.10 kg CO 2 eq. / l anhydrous ethanol.<br />
For wheat, results from European studies from 1993 -2000 (Fulton and Howes 2004) indicate<br />
a range of reduction in GHG emissions from 19 to 47% against gasoline. However it is<br />
consi<strong>de</strong>red that values very close to the results for corn, in the U.S., seem to be reasonable; so<br />
the emissions are ~ 1.8 kg CO 2 eq. / l anhydrous ethanol, and the avoi<strong>de</strong>d emissions are ~ 1.0<br />
kg CO 2 eq. / l anhydrous ethanol.<br />
For cassava the assumed energy ratio (~1.0) leads to nearly zero avoi<strong>de</strong>d emissions; it will<br />
<strong>de</strong>pend on the characteristics (GHG emissions) of the fossil fu<strong>el</strong>s used in the process.<br />
3.5 Impacts in Greenhouse gas emissions in Mexico<br />
With the above consi<strong>de</strong>rations (and within the limitations of the data available) the expected<br />
impacts in the Greenhouse gas emissions in Mexico, for the Scenario 3 (10% ethanol blends)<br />
can be estimated as in Table 3.2.<br />
Table 3.2<br />
Expected impacts in the GHG emissions in Mexico with the introduction<br />
of 10% ethanol in gasoline; values for 2004<br />
Fossil<br />
Energy<br />
GHG emissions,<br />
kg CO 2 eq. / l anhydrous ethanol GHG emissions<br />
Ratio In ethanol Net avoi<strong>de</strong>d mitigation, Mexico<br />
production emissions (1) 10 6 t CO 2 eq. / year<br />
Corn 1.3 1.8 1.0 3.9<br />
Sugar Cane (2) 10.0 0.43 2.72 10.6<br />
Sugar beets 2.0 1.4 1.4 5.4<br />
Sweet Sorghum 4.0 0.7 2.1 8.2<br />
Wheat 2.0 1.8 1.0 3.9<br />
Cassava (3) 1.0 ~ 0. -<br />
(1) Consi<strong>de</strong>ring the emissions from gasoline as 2.8 kg CO 2 eq. / l gasoline, and the<br />
equivalence (in volume) of the two fu<strong>el</strong>s when using blends with less than 10%<br />
ethanol.<br />
(2) Avoi<strong>de</strong>d emissions with ethanol and surplus <strong>el</strong>ectricity use; Cases 2 and 3 (new<br />
units)<br />
29
<strong>Potenciales</strong> y <strong>Viabilidad</strong> <strong><strong>de</strong>l</strong> <strong>Uso</strong> <strong>de</strong> <strong>Bioetanol</strong> y <strong>Biodies<strong>el</strong></strong> <strong>para</strong> <strong>el</strong> Transporte en México (SENER-BID-GTZ)<br />
Task 6: Potentials in r<strong>el</strong>ation to sustainability criteria<br />
(3) Mo<strong>de</strong>rn technologies (commercial) may improve the Fossil Energy Ratio, eventually<br />
making this an option closer to other starch (no residues) based systems<br />
(5) Energy (external) used by the processes to produce the ethanol, as percentage of the fu<strong>el</strong><br />
supply in 2004 (Dies<strong>el</strong> +NG+ Fu<strong>el</strong> Oil). When <strong>el</strong>ectricity is bought, the value equivalent to<br />
the primary energy for generation (fu<strong>el</strong>) is consi<strong>de</strong>red here.<br />
(6) Sweet sorghum co-generated energy (with residues) covers a portion of the <strong>el</strong>ectricity<br />
needs, but here it is not producing surplus power. It may improve in the future.<br />
(7) Corresponds to the installation of new units (Cases 2 and 3)<br />
For the Scenario 2 the mitigation values (10 6 t CO 2 eq. / year ) are proportional to the use of<br />
ethanol; in 2006 the use would be 0.912 M m 3 ethanol / year, against 3.897 M m 3 ethanol /<br />
year in Scenario 1; and the mitigation would be 23% of the indicated in (Table 3.2).<br />
For Scenario 1, the ethanol nee<strong>de</strong>d (2004) for producing ETBE would be 0.412 M m 3 , leading<br />
to a mitigation of approximat<strong>el</strong>y 10% of the indicated in (Table 3.2).<br />
3.6 Summary and Conclusions<br />
The greenhouse gas emissions in the production of ethanol (agriculture and industry) were<br />
estimated for the s<strong>el</strong>ected biomass feedstock and processes. As with energy, four cases were<br />
consi<strong>de</strong>red for sugar cane; and Case 3 (mo<strong>de</strong>rn distillery, with co-generation) is inclu<strong>de</strong>d here.<br />
Results for the ethanol production process emissions, and the avoi<strong>de</strong>d emissions in Mexico for<br />
Scenario 3 (10% blend in all gasoline) are:<br />
Processes, kg CO 2 eq. / l Mitigation, Mexico; Scenario 3<br />
anhydrous ethanol<br />
10 6 t CO 2 eq. / year<br />
Corn 1.8 3.9<br />
Sugar Cane 0.43 10.6<br />
Sugar beets 1.4 5.4<br />
Sweet Sorghum 0.7 8.2<br />
Wheat 1.8 3.9<br />
Mitigation in the other Scenarios is proportional to the ethanol used. As expected, processes<br />
with higher energy ratio lead to higher mitigation values. Sugar cane (and c<strong>el</strong>lulosic feedstock,<br />
once the processes are <strong>de</strong>v<strong>el</strong>oped) may give a substantial contribution for reducing emissions.<br />
30
<strong>Potenciales</strong> y <strong>Viabilidad</strong> <strong><strong>de</strong>l</strong> <strong>Uso</strong> <strong>de</strong> <strong>Bioetanol</strong> y <strong>Biodies<strong>el</strong></strong> <strong>para</strong> <strong>el</strong> Transporte en México (SENER-BID-GTZ)<br />
Task 6: Potentials in r<strong>el</strong>ation to sustainability criteria<br />
4. Emissions and mitigation of local atmospheric pollutants<br />
from gasoline – ethanol and ETBE blends<br />
4.1 Introduction<br />
Emission of atmospheric pollutants from ethanol – gasoline blends have been evaluated for<br />
many years, benefiting from many programs in different countries; some of them in a large<br />
scale, and blends varying up to E-100 vehicles. The information for ETBE blends is more<br />
restrict, due to a much smaller utilization; actually, much of the available information is<br />
<strong>de</strong>rived from simulation mo<strong><strong>de</strong>l</strong>s, and comparisons with MTBE behavior. The installed<br />
capacity for ETBE production in Europe was only 1 M t / year, in 2005 (Koene and Puttmann<br />
2005), although substantial conversion from MTBE plants is taking place. Fu<strong>el</strong> ethanol is<br />
being used in a much larger scale (see Chapter 1).<br />
In the following <strong>para</strong>graphs the main issues concerning the emissions of the most known<br />
pollutants are consi<strong>de</strong>red; then the cases of Al<strong>de</strong>hy<strong>de</strong> emissions, NOx and the implications of<br />
the increase in RVP due to ethanol blending are treated se<strong>para</strong>t<strong>el</strong>y. The general behavior of air<br />
pollutants emissions with ETBE blends is presented.<br />
4.2 The experience with ethanol blends, worldwi<strong>de</strong><br />
4.2.1 General results<br />
The large scale Brazilian experience with ethanol blen<strong>de</strong>d gasoline since 1977, and with pure<br />
ethanol engines (from 1979) indicates important environmental benefits concerning urban air<br />
pollution. The context (size and technology of the automotive fleet, local conditions, local<br />
legislation) has been extensiv<strong>el</strong>y evaluated and allows some use of the results for other areas.<br />
Consi<strong>de</strong>ring the main pollutants usually observed in automotive (gasoline) engine emissions, a<br />
summary of significant results is shown in (Table 4.1) (CETESB 2004). They refer to the<br />
Brazilian automotive fleet from ~1978 to 1994, including engines using pure gasoline, C-<br />
gasoline (blend: anhydrous ethanol- 22%, gasoline 78%, volume) and pure (hydrous) ethanol.<br />
It is seen that the use of ethanol led to important reductions in emissions of CO, HC and NOx<br />
from 1980 to 1994.<br />
31
<strong>Potenciales</strong> y <strong>Viabilidad</strong> <strong><strong>de</strong>l</strong> <strong>Uso</strong> <strong>de</strong> <strong>Bioetanol</strong> y <strong>Biodies<strong>el</strong></strong> <strong>para</strong> <strong>el</strong> Transporte en México (SENER-BID-GTZ)<br />
Task 6: Potentials in r<strong>el</strong>ation to sustainability criteria<br />
Table 4.1 Average tail pipe emissions, new vehicles; ethanol blends, Brazil (CETESB<br />
2004) (g/km)<br />
Mo<strong><strong>de</strong>l</strong> - Year Fu<strong>el</strong> CO HC NOx R-CHO<br />
Before 1980 Gasoline (pure) 54,0 4,7 1,2 0,05<br />
Gasoline C 33,0 3,0 1,4 0,05<br />
1980-1983 Ethanol 18,0 1,6 1,0 0,16<br />
Gasoline C 28,0 2,4 1,6 0,05<br />
1984-1985 Ethanol 16,9 1,6 1,2 0,18<br />
Gasoline C 22,0 2,0 1,9 0,04<br />
1986-1987 Ethanol 16,0 1,6 1,8 0,11<br />
Gasoline C 18,5 1,7 1,8 0,04<br />
1988 Ethanol 13,3 1,6 1,4 0,11<br />
Gasoline C 15,2 1,6 1,6 0,04<br />
1989 Ethanol 12,8 1,4 1,1 0,11<br />
Gasoline C 13,3 1,3 1,4 0,04<br />
1990 Ethanol 10,8 1,3 1,2 0,11<br />
Gasoline C 11,5 1,1 1,3 0,04<br />
1991 Ethanol 8,4 0,6 1,0 0,11<br />
Gasoline C 6,2 0,6 0,6 0,013<br />
1992 Ethanol 3,6 0,6 0,5 0,035<br />
Gasoline C 6,3 0,6 0,8 0,022<br />
1993 Ethanol 4,2 0,7 0,6 0,04<br />
Gasoline C 6,0 0,6 0,7 0,036<br />
1994 Ethanol 4,6 0,7 0,7 0,042<br />
In<strong>de</strong>pen<strong>de</strong>ntly of the technological advances implemented by the automotive industry (1980 to<br />
1988) and technologies for emission control (from 1989) the pure ethanol vehicles (E-100)<br />
reduced more the emission of CO, HC e NOx than the vehicles using the gasoline blen<strong>de</strong>d (E-<br />
22).<br />
Even in Brazil there is no extensive data to compare emissions resulting from pure gasoline<br />
and gasoline - ethanol blends, because very rapidly the E-22 became the only gasoline sold in<br />
the country. Using data up to 1989, a comparison between scenarios for the São Paulo<br />
Metropolitan Region (RMSP) (CNI 1990) indicated that, for vehicles at the same<br />
technological stage, the use of gasoline C (blen<strong>de</strong>d: E-22) instead of pure gasoline, for the<br />
entire fleet, would lead to less CO (- 39%) and less HC (- 33%) emissions. However, NO x<br />
would increase 10%. The same study shows that if pure ethanol (hydrous) were used, less CO<br />
(-65%), less HC (58%) and no changes in NOx would be observed with respect to the use of<br />
pure gasoline. The results refer to the fleet up to 1989 (with the commercial technologies used<br />
at that time).<br />
Ethanol had another very important effect in Brazil: its high octane number led to the phasing<br />
out of the lead based additives to gasoline (since 1990). Concentrations of toxic lead<br />
compounds in the atmosphere were reduced in 75% in the RMSP (CETESB 1989). High<br />
ethanol (22%) blends allowed for the use of gasoline with lower aromatic compound<br />
concentration, thus with lower toxicity and photochemical reactivity.<br />
32
<strong>Potenciales</strong> y <strong>Viabilidad</strong> <strong><strong>de</strong>l</strong> <strong>Uso</strong> <strong>de</strong> <strong>Bioetanol</strong> y <strong>Biodies<strong>el</strong></strong> <strong>para</strong> <strong>el</strong> Transporte en México (SENER-BID-GTZ)<br />
Task 6: Potentials in r<strong>el</strong>ation to sustainability criteria<br />
Vehicles with <strong>el</strong>ectronic injection systems and evaporative emission control (standard in<br />
today’s production) are very efficient in controlling emissions from gasoline – ethanol blends.<br />
In Brazil, the 2003 vehicles using 22% ethanol blends averaged emissions of 0.75 g/test<br />
(CETESB 2003), (U.S. SHED test procedure). The current limit (2 g/test) is adopted in most<br />
countries with advanced emission control programs.<br />
It is interesting to note that test results for all the E-100 mo<strong><strong>de</strong>l</strong>s in Brazil (in 2001) indicate the<br />
following averages (U. S. FTP-75 driving cycle): CO: 0,66 g/km; HC: 0,15 g/km; NOx: 0,08<br />
g/km; Al<strong>de</strong>hy<strong>de</strong>s: 0,017 g/km. Evaporative emissions (U.S. Shed test) were 1,3 g/km, without<br />
the use of Activated Carbon canisters.<br />
Since 1995 the more efficient emission control systems ma<strong>de</strong> the gasoline or blen<strong>de</strong>d gasoline<br />
cars almost equal with respect to the classical pollutants; however the ethanol blends still lead<br />
to lower CO emissions, lower toxicity and photochemical reactivity of the emissions (organic<br />
compounds), nearly zero Sulphur and lower particulate matter.<br />
Data from some other countries is available. A comprehensive Australian study (Apace 1998)<br />
found that the use of E10:<br />
– Decreased CO emission by 32%;<br />
– Decreased HC emission by 12% ;<br />
– Decreased toxic emissions of 1-3 butadiene (19%), benzene (27%), toluene<br />
(30%) and xylene (27%);<br />
– Decreased carcinogenic risk by 24%.<br />
The use of E10 blends to reduce harmful wintertime CO emissions has proven to be a very<br />
effective strategy in the USA. Tests at the National Center for Vehicle Emissions Control and<br />
Safety at Colorado State University document a 25% to 30% reduction in CO when<br />
automobiles burn E10 (Apace 1998).<br />
4.2.2 Al<strong>de</strong>hy<strong>de</strong> emissions<br />
Al<strong>de</strong>hy<strong>de</strong> (R-CHO) emissions have been traditionally associated with ethanol, although they<br />
appear also with gasoline and dies<strong>el</strong>. Actually, dies<strong>el</strong> can be a much more important al<strong>de</strong>hy<strong>de</strong><br />
source than gasoline-ethanol blends in urban areas. In Table 4.1 it is seen that in Brazil<br />
al<strong>de</strong>hy<strong>de</strong> emissions did not increase significantly with gasoline blends up to 22%, and they<br />
were further reduced in the 80’s and 90’s. They were higher for pure ethanol, but they were<br />
gradually reduced reaching in 1992 lev<strong>el</strong>s equivalent to pure gasoline emissions, in the 70’s.<br />
Al<strong>de</strong>hy<strong>de</strong> emissions from high ethanol content blends, in Brazil, typically reached in 2003 a<br />
value of 0.004 g/km (acetal<strong>de</strong>hy<strong>de</strong> + formal<strong>de</strong>hy<strong>de</strong>), which is about 45% of the strict<br />
California limit (required only for formal<strong>de</strong>hy<strong>de</strong>).<br />
Al<strong>de</strong>hy<strong>de</strong> emissions when using blends with low ethanol content (E-10) were evaluated in the<br />
U.S.; measurements of ambient al<strong>de</strong>hy<strong>de</strong> concentrations in Denver, Colorado, from 1987 to<br />
1995 (before and after the introduction of E-10) showed no significant difference for both<br />
formal<strong>de</strong>hy<strong>de</strong> and acetal<strong>de</strong>hy<strong>de</strong> (An<strong>de</strong>rson 1997) emissions. A study by the California Air<br />
33
<strong>Potenciales</strong> y <strong>Viabilidad</strong> <strong><strong>de</strong>l</strong> <strong>Uso</strong> <strong>de</strong> <strong>Bioetanol</strong> y <strong>Biodies<strong>el</strong></strong> <strong>para</strong> <strong>el</strong> Transporte en México (SENER-BID-GTZ)<br />
Task 6: Potentials in r<strong>el</strong>ation to sustainability criteria<br />
Resources Board Commission (CARB 1999) predicted no increase in acetal<strong>de</strong>hy<strong>de</strong><br />
concentration in 2003, as compared to 1997 (when no E-10 was used). Actually, reductions of<br />
10% in formal<strong>de</strong>hy<strong>de</strong>, 30% in benzene and 45% in 1,3 butadiene were predicted.<br />
It must be said that the al<strong>de</strong>hy<strong>de</strong> emissions due to ethanol (mostly acetal<strong>de</strong>hy<strong>de</strong>) present much<br />
lower toxicity and photochemical reactivity (as precursors of smog formation) than the<br />
formal<strong>de</strong>hy<strong>de</strong> emissions from dies<strong>el</strong> or gasoline.<br />
4.2.3 The NOx emissions<br />
In the last years, there has been some concern that the use of ethanol-gasoline blends could<br />
result in an increase of nitrogen oxi<strong>de</strong>s (NOx) emissions. The emission of NOx from internal<br />
combustion engines has been extensiv<strong>el</strong>y studied since the early sixties; according to the<br />
Tokyo Metropolitan Government (Kankio 2003) vehicles are responsible for 65% of total<br />
NOx emissions in the region, being dies<strong>el</strong> vehicles responsible for 70% of overall NOx<br />
vehicle contribution. However, emission limits for dies<strong>el</strong> vehicles have been usually more<br />
lenient than those established for gasoline vehicles; the current NOx emission limit in Japan<br />
for light-duty gasoline vehicles in 2005 was 0.05 g/km but for the same class of dies<strong>el</strong> vehicles<br />
the limit is 0.14 g/km.<br />
Emission of NO corresponds to nearly 90% of the NOx, in gasoline engines; formation of NO<br />
occurs within the combustion chamber, and the combustion gas temperature is the key factor<br />
that controls the NO formation process and not the fu<strong>el</strong> its<strong>el</strong>f. For this, the most important<br />
engine operating variables are air-fu<strong>el</strong> ratio, spark-timing, air-fu<strong>el</strong> charge dilution, engine load<br />
and speed. Engine <strong>de</strong>sign <strong>para</strong>meters have also an important role in thermal NO formation<br />
(Sher 1998).<br />
So, NOx emissions can vary substantially <strong>de</strong>pending on vehicle <strong>de</strong>sign, engine characteristics<br />
and calibration, emission control technology, maintenance and vehicle operation conditions.<br />
Ethanol is an oxygenated fu<strong>el</strong>; blending ethanol to gasoline leads to an "air-fu<strong>el</strong> enleanment"<br />
that may either increase or <strong>de</strong>crease NOx emission or even have no effect, <strong>de</strong>pending on<br />
vehicle characteristics and maintenance. Also ethanol has a higher “latent heat of<br />
vaporization” than gasoline and may contribute to lower combustion temperature (h<strong>el</strong>ping to<br />
reduce NOx); besi<strong>de</strong>s, the ”solvent” effect of ethanol (cleaning the combustion chamber from<br />
<strong>de</strong>posits) might h<strong>el</strong>p to avoid the increase of NOx with mileage accumulation or even reduce<br />
NOx after cleanup is completed.<br />
Some comments might h<strong>el</strong>p in the evaluation of ethanol blends and their NOx emissions<br />
(Szwarc 2005):<br />
34<br />
• NOx emission varies according vehicle operating conditions; at idle, a common<br />
situation in congested traffic, the emission is nearly zero and enleanment effects due to<br />
ethanol will be hardly noticed. At part throttle and low load conditions, a very<br />
common situation during urban driving, NOx emissions may not be greatly affected<br />
due to enleanment by blends. At full load vehicles may experience a more pronounced<br />
“enleanment” effect. Traffic is important: data from the Japan Automobile Research<br />
Institute shows that a reduction of average speed from 40 km/h to 10 km/h can double<br />
NOx emission, due to the stop-and-go driving pattern.
<strong>Potenciales</strong> y <strong>Viabilidad</strong> <strong><strong>de</strong>l</strong> <strong>Uso</strong> <strong>de</strong> <strong>Bioetanol</strong> y <strong>Biodies<strong>el</strong></strong> <strong>para</strong> <strong>el</strong> Transporte en México (SENER-BID-GTZ)<br />
Task 6: Potentials in r<strong>el</strong>ation to sustainability criteria<br />
• The portion of the fleet in Mexico equipped with state-of-the-art “adaptive-learn<br />
closed-loop” three-way catalytic converter systems can reach high emission control<br />
efficiency of volatile organic compounds (VOC), carbon monoxi<strong>de</strong> (CO) and NOx.<br />
These vehicles are capable of s<strong>el</strong>f-adjustment within ranges that may accommodate<br />
ethanol blends in various operating conditions.<br />
• More important: existing data indicates that the possible NOx increase due to the use<br />
of ethanol-gasoline blends is generally marginal or of small r<strong>el</strong>evance especially if<br />
analyzed on a mass basis contribution to air pollution. Actually it can be questioned<br />
whether this increase is significant when consi<strong>de</strong>ring that standard <strong>de</strong>viation of current<br />
emission test measurements may be as high as 40%. Current emission values have<br />
reached extrem<strong>el</strong>y low lev<strong>el</strong>s and laboratory tests uncertainty is a challenge to<br />
emission data interpretation. This point is further analized in Annex 7, when the recent<br />
evaluation ma<strong>de</strong> in Japan is presented.<br />
• Southern California, USA, has been fighting smog precursors such as NO 2 for<br />
<strong>de</strong>ca<strong>de</strong>s. Ethanol-gasoline blends started to be used in California in a sizable scale<br />
during 2002 and the transition from MTBE-gasoline blends to ethanol-gasoline blends<br />
was completed in 2003. Ambient concentrations in two important air basins located in<br />
Southern California – San Diego Air Basin and South Coast Air Basin – indicate that<br />
annual average lev<strong>el</strong>s of NO 2 have not increased with ethanol use from the period<br />
MTBE was the prime oxygenate blend stock (CARB 2004).<br />
Mexico and Brazil (as w<strong>el</strong>l as many other countries) has established more strict limits for NOx<br />
emissions in the next years; this is presented in Annex 7. It seems that the proposed limits can<br />
be achieved with ethanol blends (in fact, they have already been achieved with current<br />
technology as shown in the Japanese tests).<br />
If analyzed in a balanced way it becomes clear that the issue of NOx emission from ethanolgasoline<br />
blends is not serious as initially thought. In fact dies<strong>el</strong> vehicles and congested traffic<br />
tend to be far more critical in this regard, not to mention NOx emissions from other common<br />
sources that are difficult to control such as household cooking; therefore NOx should not be<br />
taken as a limiting factor for use of ethanol-gasoline blends. Overall benefits of ethanol<br />
blends use with regard to both urban pollution and greenhouse gas emissions should be the<br />
key reference.<br />
4.2.4 Vapor Pressure of gasoline - ethanol and blends<br />
The vapor pressure expresses the fu<strong>el</strong> volatility; at 37.8 C (and in specified measuring<br />
conditions) it is called the Reid Vapor Pressure (RVP). For gasoline, RVP is between 45 and<br />
65 kPa (1 kPa = 0.145 psi). For anhydrous ethanol it is 18 kPa, and for hydrous ethanol it is 16<br />
kPa. For ETBE the RVP is 28 kPa. The RVP is an indicator of the gasoline ability to allow<br />
the engine cold start; but also the possibility of vapor bubbles in the fu<strong>el</strong> pump (vapor lock),<br />
and of the r<strong>el</strong>ative lev<strong>el</strong> of evaporative emissions. Before consi<strong>de</strong>ring ethanol – gasoline<br />
blends, it must be remembered that even for pure gasoline the RVP is adjusted to pre<strong>de</strong>termined<br />
lev<strong>el</strong>s with the addition or removal of light hydrocarbons (C1 to C5) so that fu<strong>el</strong><br />
specifications are reached to comply with weather conditions and environmental protection<br />
(evaporative emissions). The same procedures are used for ethanol – gasoline blends, since the<br />
35
<strong>Potenciales</strong> y <strong>Viabilidad</strong> <strong><strong>de</strong>l</strong> <strong>Uso</strong> <strong>de</strong> <strong>Bioetanol</strong> y <strong>Biodies<strong>el</strong></strong> <strong>para</strong> <strong>el</strong> Transporte en México (SENER-BID-GTZ)<br />
Task 6: Potentials in r<strong>el</strong>ation to sustainability criteria<br />
blend composition is pre-<strong>de</strong>termined and the influence of ethanol in any gasoline can be<br />
measured.<br />
The experience with blen<strong>de</strong>d gasoline shows that:<br />
• Blend volatility varies as a function of the base gasoline composition (and can be<br />
adjusted)<br />
• Blend volatility varies as a function of the ethanol content in the blend; for a given<br />
gasoline there is a peak in volatility for a certain ethanol concentration (it varies with<br />
the gasoline); beyond that concentration, the volatility will be reduced.<br />
• RVP is a very limited indicator for volatility for ethanol – gasoline blends; a more<br />
accurate <strong>de</strong>scription would use also the Distillation Curve, and the vapor-liquid ratio,<br />
at a given temperature, as the Mexican specifications (SEMARNAT 2006) in 2006.<br />
Typically, blends of ethanol in gasoline will lead to an increase of 1.0 to 1.2 psi in RVP,<br />
<strong>de</strong>pending on the formulation of the base gasoline, up to the oxygen content of ~5% by<br />
volume; higher oxygen content leads to a slowly <strong>de</strong>creasing RVP (NEIWPCC 2001; Furey<br />
1985).<br />
Standards for gasoline with the <strong>para</strong>meters to h<strong>el</strong>p controlling evaporative emissions have<br />
been modified in the last years; in the U.S., the EPA Reformulated Gasoline (RFG), the<br />
California Reformulated Gasoline (CA RFG); the Arizona Cleaner Burning Gasoline (Arizona<br />
CBG); the Nevada Cleaner Burning Gasoline (LVCBG) are some examples. Also gasoline<br />
blend stocks for oxygenate blending have been specified, as w<strong>el</strong>l as gasoline for specific<br />
months.<br />
The California Air Resources Board Reformulated Gasoline – Phase 3 Standards (CARB 3<br />
RFG), from January 2003, r<strong>el</strong>axed standards for distillation temperatures (T 50 and T 90 ), adding<br />
flexibility to allow for MTBE substitution (ethanol, other) and ad<strong>de</strong>d flexibility to RVP<br />
standards (Drogos 2000). The r<strong>el</strong>evant <strong>para</strong>meters are shown in (Table 4.2).<br />
Table 4.2<br />
CARB 3 RFG Standards (s<strong>el</strong>ected <strong>para</strong>meters)<br />
Flat Limit Average Limit Cap Limits<br />
RVP, psi 7.0 N A 6.4 - 7.2<br />
Oxygen %, W 1.8 – 2.2 NA 0 – 3.5<br />
T 50 , o F 213 203 220<br />
T 90 , o F 305 295 330<br />
T 50, T 90 : temperatures at which 50% and 90% of the gasoline volume is<br />
vaporized<br />
36
<strong>Potenciales</strong> y <strong>Viabilidad</strong> <strong><strong>de</strong>l</strong> <strong>Uso</strong> <strong>de</strong> <strong>Bioetanol</strong> y <strong>Biodies<strong>el</strong></strong> <strong>para</strong> <strong>el</strong> Transporte en México (SENER-BID-GTZ)<br />
Task 6: Potentials in r<strong>el</strong>ation to sustainability criteria<br />
In another example, the average properties of the gasoline supplied to the CBG (Arizona’s<br />
Cleaner Burning Gasoline Program) covered area in Arizona, 2003 – 2004, indicate a RVP of<br />
6.5 psi (Summer) and 8.6 psi (Winter) with an ethanol blend of 10% volume (Winter)<br />
(MathPro 2005).<br />
The specifications for gasoline in Mexico are <strong>de</strong>termined in the Norma Oficial Mexicana<br />
NOM-086-SEMARNAT-SENER-SCFI-2005, “Especificaciones <strong>de</strong> los combustibles fósiles<br />
<strong>para</strong> la protección ambiental” (10-January-2006); (SEMARNAT 2006).<br />
Gasoline volatility lev<strong>el</strong>s are <strong>de</strong>fined with the Volatility Class (ranges of Reid Vapor Pressure<br />
and Distillation Temperatures for 10, 50 and 90% of the gasoline), and Protection against<br />
vapor lock (temperatures to reach a vapor/liquid value of 20). The essential figures are in<br />
(Table 4.3) and (Table 4.4).<br />
Table 4.3<br />
Standards for vapor lock prevention; Mexican specifications<br />
Vapor Lock Protection Class 1 2 3 4 5<br />
Temperature ( o C) to reach a vapor/liquid ratio of<br />
20 (ASTM D 2533-99)<br />
60 56 51 47 41<br />
Table 4.4<br />
Vapor pressure and distillation temperatures for gasoline, for each<br />
volatility class; Mexican specifications (1)<br />
Volatility Class (1)<br />
Property Unity AA A B C<br />
RVP (2)<br />
Distillation Temp, 10%<br />
Distillation Temp, 50%<br />
Distillation Temp, 90%<br />
Final Ebullition Temp<br />
kPa<br />
(psi)<br />
45 to 54<br />
6.5 to 7.8<br />
54 to 62<br />
7.8 to 9.0<br />
62 to 69<br />
9 to 10.0<br />
69 to 79<br />
10 to 11.5<br />
o C (3) 70 70 65 60<br />
o C 77 a 121 77 a 121 77 a 118 77 a 116<br />
o C 190 190 190 185<br />
o C 225 225 225 225<br />
Distillation Residue, max. % vol 2 2 2 2<br />
(1) Corresponding to the ASTM D 4814-04be1 standard<br />
(2) Determination as in ASTM 0323-99 a<br />
(3) All temperatures normalized at 101.3 kPa; <strong>de</strong>termined by STM 086-05<br />
37
<strong>Potenciales</strong> y <strong>Viabilidad</strong> <strong><strong>de</strong>l</strong> <strong>Uso</strong> <strong>de</strong> <strong>Bioetanol</strong> y <strong>Biodies<strong>el</strong></strong> <strong>para</strong> <strong>el</strong> Transporte en México (SENER-BID-GTZ)<br />
Task 6: Potentials in r<strong>el</strong>ation to sustainability criteria<br />
Acceptable volatility lev<strong>el</strong>s are assigned for each of six geographic regions (Noreste, Centro-<br />
NE, Sureste, Bajío, Centro and Pacífico, this with four sub-regions) plus the special cases of<br />
the Metropolitan areas of Valle <strong>de</strong> México, Guadalajara and Monterrey, for each month of the<br />
year.<br />
For most of the cases, the volatility limits for the winter season (June to August) are set at A-1,<br />
and at B-2 (eventually C-3) for the rest of the year. Exceptions are the ZMVM and ZMG, with<br />
much more severe restrictions: AA-2 (March to June) and AA-3 for the rest of the year; and<br />
Monterrey, with B-2 (March-September) and C-3 for the rest. The AA-2 volatility is similar to<br />
the CARB 3 RFG standards set for summer.<br />
In Brazil, the volatility characteristics in the gasoline standards (for ethanol blends up to 24%,<br />
volume) (ANP 2001) are shown in (Table 4.5).<br />
Table 4.5 Volatility of gasoline; Brazilian specifications (ANP 2001)<br />
Properties Unity Normal Gasoline<br />
Premium Gasoline<br />
A C A C<br />
Distillation<br />
10% evap. max.<br />
o C 65 65 65 65<br />
50% evap. max.<br />
o C 120 80 120 80<br />
90% evap. max.<br />
o C 190 190 190 190<br />
Ebullition, max.<br />
o C 220 220 220 220<br />
Residue % vol 2.0 .0 2.0 2.0<br />
RVP, 37.8 o C kPa 45.0 to 62.0 60.0 max 45.0 to 62.0 69.0<br />
Gasoline A: pure gasoline base (to be blen<strong>de</strong>d)<br />
Gasoline C: blen<strong>de</strong>d gasoline<br />
“It is highly unlik<strong>el</strong>y that exposure to airborne ethanol associated with gasoline use could<br />
produce toxic effects. The reasons for this are (a) the tiny doses that might be received, which<br />
might not be observable in light of endogenous lev<strong>el</strong>s of ethanol in blood, (b) the body’s rapid<br />
<strong>el</strong>imination of ethanol, and (c) the r<strong>el</strong>ativ<strong>el</strong>y large doses of ethanol and high blood lev<strong>el</strong>s of<br />
ethanol associated with toxic effects in people” (Armstrong 1999). Ethanol at low air<br />
concentrations should not constitute a risk for the general population (An<strong>de</strong>rsson and Victorin<br />
1996).<br />
Looking at all the experience with ethanol – gasoline blends, it can be said that the evolution<br />
of the standards and the improvement in refining suitable base gasoline led to the safe use of<br />
the blends as far as evaporative emissions are concerned. Also, the use of E-10 at high<br />
altitu<strong>de</strong>s (such as in Colorado, U.S.) and in high ambient temperatures (Brazil, Australia and<br />
South Africa) has not led to problems with vapor lock.<br />
38
<strong>Potenciales</strong> y <strong>Viabilidad</strong> <strong><strong>de</strong>l</strong> <strong>Uso</strong> <strong>de</strong> <strong>Bioetanol</strong> y <strong>Biodies<strong>el</strong></strong> <strong>para</strong> <strong>el</strong> Transporte en México (SENER-BID-GTZ)<br />
Task 6: Potentials in r<strong>el</strong>ation to sustainability criteria<br />
4.3 Impacts of ETBE blends<br />
ETBE (Ethyl Tertiary Butyl Ether) is produced reacting ethanol and isobutylene; it was<br />
proposed as an oxygenate (as w<strong>el</strong>l as MTBE) because they can use the excess butanes in the<br />
refining industry resulting from the phase-out of lead. It is also an octane enhancer; and its low<br />
solubility in water (compared to ethanol) was one of the advantages much consi<strong>de</strong>red in the<br />
early 1990’s with respect to the use of neat ethanol. One important effect of ETBE blending in<br />
gasoline properties is its ability to lower the blend RVP; for example, when ad<strong>de</strong>d at 2.0 %<br />
oxygen to Reformulated Gasoline (at 7.1 psi RVP) it lowers the RVP (- 0.48); with MTBE at<br />
the same oxygen lev<strong>el</strong>, the result would be a small increase in RVP (+ 0.02) (CFDC 1998).<br />
The overall effect of using ETBE – gasoline blends on air pollutant emissions may be seen in<br />
the (Figure 4.1) (CFDC 1998).<br />
Figure 4.1 Air pollutants emissions with gasoline-ETBE blends<br />
As it is seen, ETBE would present results similar to MTBE as far as air pollutants are<br />
concerned.<br />
39
<strong>Potenciales</strong> y <strong>Viabilidad</strong> <strong><strong>de</strong>l</strong> <strong>Uso</strong> <strong>de</strong> <strong>Bioetanol</strong> y <strong>Biodies<strong>el</strong></strong> <strong>para</strong> <strong>el</strong> Transporte en México (SENER-BID-GTZ)<br />
Task 6: Potentials in r<strong>el</strong>ation to sustainability criteria<br />
4.4 Summary and Conclusions<br />
Atmospheric emissions from ethanol – gasoline blends have been w<strong>el</strong>l evaluated, but the<br />
information for ETBE blends is very limited, for its much smaller utilization. Ethanol blends<br />
have been used in Brazil and in the U.S. for the last 30 years.<br />
The large volume of information (in many countries) on ethanol – gasoline blends indicates<br />
important reductions in CO emissions (as expected) in<strong>de</strong>pen<strong>de</strong>ntly of engine technology; also<br />
reductions in HC and toxic emissions (benzene, toluene, xylene); nearly zero Sulphur and<br />
lower particulate matter.<br />
Al<strong>de</strong>hy<strong>de</strong> (formal<strong>de</strong>hy<strong>de</strong> and acetal<strong>de</strong>hy<strong>de</strong>) emissions even from high ethanol content blends<br />
were in 2003 (Brazil) less than half of the California limit; low ethanol blends (E-10)<br />
evaluated in the U.S. showed no difference in emissions before and after the blend<br />
introduction (An<strong>de</strong>rson 1997). This is also found in simulation studies (CARB 1999).<br />
Al<strong>de</strong>hy<strong>de</strong> emissions due to ethanol blends present much lower toxicity and photochemical<br />
reactivity than the formal<strong>de</strong>hy<strong>de</strong> emissions from dies<strong>el</strong> or gasoline.<br />
NOx emissions from gasoline – ethanol blends: NO corresponds to nearly 90% of the NOx, in<br />
gasoline engines; the combustion gas temperature is the key factor that controls the NO<br />
formation process and not the fu<strong>el</strong> its<strong>el</strong>f (Sher 1998). NOx emissions vary <strong>de</strong>pending on<br />
vehicle <strong>de</strong>sign, engine characteristics and calibration, emission control technology,<br />
maintenance and vehicle operation conditions (also traffic conditions). Existing data indicates<br />
that the possible NOx increase due to the use of ethanol-gasoline blends is generally very<br />
small (Szwarc 2005). The ambient concentrations of NO 2 in two areas in Southern California<br />
have not increased with ethanol blends use (CARB 2004).<br />
Vapor Pressure of gasoline - ethanol and blends: blends of ethanol in gasoline lead to an<br />
increase of 1.0 to 1.2 psi in RVP, <strong>de</strong>pending on the formulation of the base gasoline, up to the<br />
oxygen content of ~5% by volume; higher oxygen content leads to a slowly <strong>de</strong>creasing RVP<br />
(NEIWPCC 2001; Furey 1985). As with pure gasoline the volatility must be adjusted to pre<strong>de</strong>termined<br />
lev<strong>el</strong>s with the addition or removal of light hydrocarbons (C1 to C5) so that fu<strong>el</strong><br />
specifications are reached (after blending) to comply with weather conditions and<br />
environmental protection (evaporative emissions). The evolution of the standards and the<br />
improvement in refining suitable base gasoline led to the safe use of the blends as far as<br />
evaporative emissions are concerned. Also, it is highly unlik<strong>el</strong>y that exposure to airborne<br />
ethanol associated with gasoline use could produce toxic effects (Armstrong 1999).<br />
ETBE blends with gasoline result in lower RVP; at 2.0 % oxygen to Reformulated Gasoline<br />
(7.1 psi RVP) a reduction of (- 0.48) is obtained (CFDC 1998). It has been effective with<br />
reductions at ~15% for CO, toxics and VOCS (blend at 2.7% Oxygen, in RFG).<br />
40
<strong>Potenciales</strong> y <strong>Viabilidad</strong> <strong><strong>de</strong>l</strong> <strong>Uso</strong> <strong>de</strong> <strong>Bioetanol</strong> y <strong>Biodies<strong>el</strong></strong> <strong>para</strong> <strong>el</strong> Transporte en México (SENER-BID-GTZ)<br />
Task 6: Potentials in r<strong>el</strong>ation to sustainability criteria<br />
5. Emissions from sugar cane burning and bagasse boilers:<br />
possible health effects, other risks<br />
5.1 Sugar cane burning emissions<br />
This Chapter refers specifically to air pollution issues pertinent to the sugar cane industry (not<br />
the other biomass feedstock consi<strong>de</strong>red in the study). Today, most of the sugar cane in Mexico<br />
is harvested after burning portion of the trash (dry and some green leaves) in the fi<strong>el</strong>d. This is<br />
a common practice in most of the 97 countries in the world that grow sugar cane<br />
commercially; it aims at improving worker’s safety and harvesting yi<strong>el</strong>ds.<br />
Neverth<strong>el</strong>ess, it has been subject to discussion and specific regulations in some places, mostly<br />
due to the possibility of health problems arising from the smoke near urban areas (Paes 2005).<br />
Several works were conducted in the U S, Brazil (Miranda, Dorado and Assunção 1994) and<br />
other countries in the 1980’s and 90’s in or<strong>de</strong>r to clarify whether the emissions from sugarcane<br />
burning were harmful to health. Several papers show no direct r<strong>el</strong>ationship between<br />
exposure to cane burning smoke and damage to health; the occurrence of respiratory diseases<br />
and mesoth<strong>el</strong>ioma (lung cancer) were not associated with BSF exposure. However, the<br />
incomplete burning of sugar cane trash promotes the r<strong>el</strong>ease of particulate matter, causing<br />
discomfort in urban areas and the smoke may cause risks to areas with <strong>el</strong>ectric networks and<br />
highways.<br />
The emission of greenhouse gases in sugarcane burning has been consi<strong>de</strong>red in Chapter 3.<br />
The pressure to avoid cane burning practices, today, comes from two main points:<br />
The discomfort to people and possible risks in specific areas<br />
The (more recent) possibilities of using portion of the trash biomass to produce<br />
commercial “clean” energy<br />
On the other si<strong>de</strong>, green cane harvesting in the large scale required for the sugar cane<br />
plantations implies in the use of mechanical harvesting, with the characteristics:<br />
Today limited to areas with small <strong>de</strong>clivity (< 12 <strong>de</strong>grees)<br />
Drastic reduction in the labor force required for harvesting (in Brazil, one harvester<br />
substitutes for 120 workers; this causes problems, in some regions)<br />
Solutions are clearly regional, <strong>de</strong>pending on the specifics of the areas involved. In many<br />
situations the areas involved are far from urban areas, and the emissions are not f<strong>el</strong>t as a<br />
nuisance. In the S. Paulo state (Brazil), with a high population <strong>de</strong>nsity and a large area of<br />
sugar cane plantations (39 M inhabitants; 158 hab/km 2 ; sugar cane area 2.8 M ha in 2003) the<br />
legislation passed gradually prohibits the burning, with a schedule that consi<strong>de</strong>rs the<br />
technologies available and the expected unemployment, including immediate prohibition in<br />
risk areas. The control of sugar-cane burning in Brazil was first based in a law (São Paulo<br />
State government, 1997). Today the Law 11241 (2002, State of São Paulo), and <strong>de</strong>cree 2661<br />
(1998, Fe<strong>de</strong>ral Government) regulate the procedures. Both of them provi<strong>de</strong> for a burning<br />
<strong>el</strong>imination schedule and specify prohibition areas as protection ranges near urban perimeters,<br />
highways, railways, airports, forest reserves and preservation units, among other. They also<br />
41
<strong>Potenciales</strong> y <strong>Viabilidad</strong> <strong><strong>de</strong>l</strong> <strong>Uso</strong> <strong>de</strong> <strong>Bioetanol</strong> y <strong>Biodies<strong>el</strong></strong> <strong>para</strong> <strong>el</strong> Transporte en México (SENER-BID-GTZ)<br />
Task 6: Potentials in r<strong>el</strong>ation to sustainability criteria<br />
<strong>de</strong>termine specific safety procedures for the burning operation. (Table 5.1) shows the sugarcane<br />
burning reduction schedule set forth by the fe<strong>de</strong>ral and state legislations.<br />
Table 5.1<br />
Cane Burning Reduction Schedule; Brazil and São Paulo State<br />
Year<br />
State Decree (São Paulo)<br />
2002<br />
Areas Where Areas Where<br />
Mechanical Mechanical<br />
Harvesting is Harvesting is Not<br />
Possible (1) Possible (1)<br />
Year<br />
Fe<strong>de</strong>ral Law (Brazil)<br />
1998<br />
Areas Where Areas Where<br />
Mechanical Mechanical<br />
Harvesting is Harvesting is<br />
Possible (1) Not Possible (1)<br />
2002 20%<br />
2006 (5 th year) 30% 2003 (5 th year) 25% -<br />
2011 (10 th year) 50% 10% 2008 (10 th year) 50% -<br />
2016 (15 th year) 80% 20% 2013 (15 th year) 75% -<br />
2021 (20 th year) 100% 30% 2018 (20 th year) 100% -<br />
2026 (25 th year) 50%<br />
2031 (30 th year) 100%<br />
(1) Area where mechanical harvesting is possible: tilt
<strong>Potenciales</strong> y <strong>Viabilidad</strong> <strong><strong>de</strong>l</strong> <strong>Uso</strong> <strong>de</strong> <strong>Bioetanol</strong> y <strong>Biodies<strong>el</strong></strong> <strong>para</strong> <strong>el</strong> Transporte en México (SENER-BID-GTZ)<br />
Task 6: Potentials in r<strong>el</strong>ation to sustainability criteria<br />
It is consi<strong>de</strong>red that the equipment available today is able to limit emissions to the specified<br />
values (they vary with location, even within a country). The gradual phasing out of old boilers<br />
is h<strong>el</strong>ping to improve the performance. A program for ethanol from sugar cane in Mexico<br />
using new distilleries would have no problem with boiler emissions, with the current<br />
technology.<br />
5.3 Summary and Conclusions<br />
Most of the sugar cane in Mexico is harvested after burning portion of the trash (dry and some<br />
green leaves), as in most countries. Cane burning emissions have not been associated to<br />
chronic diseases; however the r<strong>el</strong>ease of particulate matter may cause discomfort in urban<br />
areas, and the smoke may cause risks in areas with <strong>el</strong>ectric networks and highways, and fire<br />
hazards. Green cane harvesting has been associated with mechanical harvest, with limitations<br />
in areas of high <strong>de</strong>clivity and reducing the number of jobs.<br />
Solutions are local, <strong>de</strong>pending on the specifics of the areas involved. Controls may inclu<strong>de</strong><br />
burning prohibition in some areas (urban perimeters, highways, railways, airports, forest<br />
reserves and preservation units) and gradual phasing out in other areas. Sugar cane trash is<br />
becoming valuable as a source of additional clean energy, and this will acc<strong>el</strong>erate the<br />
implementation of green cane harvesting in many places.<br />
Bagasse boilers are conventional biomass boilers (r<strong>el</strong>ativ<strong>el</strong>y low temperatures) and the<br />
emissions associated are w<strong>el</strong>l known (PM, NOx, ozone); they can be controlled in mo<strong>de</strong>rn<br />
boilers.<br />
43
<strong>Potenciales</strong> y <strong>Viabilidad</strong> <strong><strong>de</strong>l</strong> <strong>Uso</strong> <strong>de</strong> <strong>Bioetanol</strong> y <strong>Biodies<strong>el</strong></strong> <strong>para</strong> <strong>el</strong> Transporte en México (SENER-BID-GTZ)<br />
Task 6: Potentials in r<strong>el</strong>ation to sustainability criteria<br />
6. Land availability; food security and energy crops<br />
6.1 Land utilization: the world context<br />
Land utilization (in a sustainable way) is a growing concern for every country. The possibility<br />
of using land to produce energy (as in the case un<strong>de</strong>r study here) is to be consi<strong>de</strong>red in the<br />
context of other needs, among which food production is the most important. Environmental<br />
restrictions (preserved areas for biodiversity, for waterways protection, etc) may correspond to<br />
very large areas, in some countries.<br />
Most governments will look for one main objective, when consi<strong>de</strong>ring agriculture: ensure<br />
secure and low cost food supplies. There are different ways to meet this objective; among<br />
them, investments in infrastructure, technology, subsidies, protectionism, etc. Fast<br />
urbanization has been a consequence (and puts more pressure) on the impoverishment of rural<br />
populations, led to increase production with less jobs and lower prices of foodstuffs.<br />
The issues r<strong>el</strong>ated to “food security” are seen in different ways for each country,<br />
in<strong>de</strong>pen<strong>de</strong>ntly of being <strong>de</strong>v<strong>el</strong>oped or in <strong>de</strong>v<strong>el</strong>opment. The <strong>de</strong>finition of “food security” is not<br />
really universal; it may be based on being s<strong>el</strong>f sufficient in food production to feed its<br />
population (at least in the so <strong>de</strong>fined “basic foods” for the specific country); or in being able<br />
(in the foreseeable future) to keep the necessary economic conditions to import some of the<br />
food nee<strong>de</strong>d and not produced locally. Today’s trend to a more global economy leads to a<br />
growing use of imported food products in almost any country, and most countries are<br />
importers and exporters of those products, simultaneously; in the other si<strong>de</strong>, the uncertainties<br />
of the international markets make it difficult to r<strong>el</strong>y on specific tra<strong>de</strong> surpluses as a basis for<br />
importing large amounts of food products for a long time. So, except in some special cases<br />
(and large oil exporters today are one of those exceptions) countries will look for providing at<br />
least a fair amount of the “basic food products” they need for internal consumption with their<br />
own resources.<br />
It is important to consi<strong>de</strong>r that almost 90 % of the agricultural production worldwi<strong>de</strong> is<br />
consumed in the country of origin; this gives an i<strong>de</strong>a of the strength of the “food security”<br />
concepts. Some facts illustrate the situation today (Clay 2004):<br />
• Dev<strong>el</strong>oped countries are net exporters of all cereals (except Japan), and most<br />
<strong>de</strong>v<strong>el</strong>oping countries are net cereal importers (except for some South American)<br />
• Similarly, <strong>de</strong>v<strong>el</strong>oped regions are net exporters of meat (except Japan, Eastern Europe)<br />
and most <strong>de</strong>v<strong>el</strong>oping countries are net importers (except, again, some of Latin<br />
America).<br />
On the other si<strong>de</strong>, in many countries the transition to more open markets is leading to very<br />
difficult situations with regard to food security. India (with 25% of the farmers in the world)<br />
recently opened its markets (Fulton L. 2005); imports led to much lower prices for foodstuffs<br />
and <strong>el</strong>iminated some of the local production (edible oils, for instance). In some regions<br />
(Andhra Pra<strong>de</strong>sh for example) rural population will <strong>de</strong>cline for 70 to 40%, in the next years.<br />
The recent interest in Energy crops adds more complexity to the problem of a<strong>de</strong>quate land<br />
utilization. Biomass feedstock for energy may be based on existing food/feed crops (such as<br />
44
<strong>Potenciales</strong> y <strong>Viabilidad</strong> <strong><strong>de</strong>l</strong> <strong>Uso</strong> <strong>de</strong> <strong>Bioetanol</strong> y <strong>Biodies<strong>el</strong></strong> <strong>para</strong> <strong>el</strong> Transporte en México (SENER-BID-GTZ)<br />
Task 6: Potentials in r<strong>el</strong>ation to sustainability criteria<br />
sugar cane sucrose or corn starch for ethanol; soy beans for biodies<strong>el</strong>); on residues from<br />
existing food/feed crops (bagasse from sugar cane, corn stover); on residues and waste from<br />
forest (wood) products; and on organic municipal solid waste (MSW). However, the potential<br />
for <strong>de</strong>dicated “energy” crops is the most important to be consi<strong>de</strong>red and each region may have<br />
a different set of options. The use of wastes will not present any conflict (land availability)<br />
with food production. Some recent studies are a<strong>de</strong>quate to provi<strong>de</strong> a world context for the<br />
situation in Mexico.<br />
From 13 billion ha of land in the Earth, 1.5 billion are used for crops today; 3.5 are<br />
pastur<strong>el</strong>and; 0.5 are “built up” and the balance is forest land or “wast<strong>el</strong>and” (Fulton 2005).<br />
Regional distribution of used and available land may be summarized as shown in (Table 6.1).<br />
Important regional differences are clear: seven countries (four in South America, three in Sub-<br />
Saharan Africa) have 50% of all the suitable (for agriculture), not used land in the world.<br />
Table 6.1<br />
Land distribution in the World<br />
Suitable for rain fed crops<br />
10 9 ha<br />
Arable land in use,<br />
1997-1999, %<br />
Latin America and Caribbean 1.07 19<br />
Sub-Saharan Africa 1.03 22<br />
Industrial Countries 0.87 44<br />
Transition Countries 0.50 53<br />
Asia 0.59 75<br />
Near East and North Africa 0.10 86<br />
Basic questions to evaluate the food /energy situation are:<br />
• what cropland area will be nee<strong>de</strong>d in the next 50 years, and how much pastur<strong>el</strong>and can<br />
be converted to cropland;<br />
• how can new technologies (both agricultural and industrial) change those figures, and<br />
the possible extent of “energy” farming; and what would be the implications for<br />
sustainability.<br />
A recent study (Smeets, Faaij and Lewandowski 2004) looked at the history and projected<br />
(1961 to 2050) per capita regional food intake and crop yi<strong>el</strong>ds (9 main crops); at the<br />
“abandoned” crop/pasture areas; the (renewable) water availability and the water uses (up to<br />
2030); and consi<strong>de</strong>red four scenarios (crop yi<strong>el</strong>ds: with irrigation, with “high technology”<br />
plants, with confined livestock, etc). It arrived at the possibility of 200 – 1200 EJ / year of<br />
(primary) bioenergy. If used for transportation fu<strong>el</strong>s production, half of this biomass would<br />
yi<strong>el</strong>d 50 – 300 EJ/year. The use today is 80 EJ; projection for 2050 is 175 EJ (Smeets, Faaij<br />
and Lewandowski 2004).<br />
Region (and crop) specific studies ma<strong>de</strong> in the last years have focused on the availability of<br />
c<strong>el</strong>lulosic feedstock, including crop and forest residues, and urban / mill wastes, besi<strong>de</strong>s<br />
energy crops. They are usually more conservative than a “global” estimate, including<br />
45
<strong>Potenciales</strong> y <strong>Viabilidad</strong> <strong><strong>de</strong>l</strong> <strong>Uso</strong> <strong>de</strong> <strong>Bioetanol</strong> y <strong>Biodies<strong>el</strong></strong> <strong>para</strong> <strong>el</strong> Transporte en México (SENER-BID-GTZ)<br />
Task 6: Potentials in r<strong>el</strong>ation to sustainability criteria<br />
restrictions known to the specific location. Examples are (Sheehan 2000); (Walsh 2000); (Haq<br />
and Easterly 2005), in the USA; and (Ham<strong>el</strong>inck, van Hooijdonk and Faaij 2005) in Western<br />
Europe.<br />
6.2 Mexico’s land availability for agriculture<br />
The Report on Task 3, in this Project (Lazcano 2006a) shows that from the 197 M ha of<br />
territory in Mexico about 61% present a humidity <strong>de</strong>ficit (severe, for 45%) with arid or semiarid<br />
climate; not only in the Mexican Altiplano and Northwest, but extending to some of the<br />
Central and South regions. Rain usually falls in the hot season (May – October); the arid<br />
regions (45%) receive up to 300 mm water /year, the semi-arid humid (16%) 300 – 600 mm<br />
water; and the humid regions from 600 to 4000 mm. For altitu<strong>de</strong>s lower than 1000 m,<br />
temperature averages above 20 C are found south of the 20 o N <strong>para</strong>ll<strong>el</strong>; and temperatures<br />
above 24 C north of the 20 o N <strong>para</strong>ll<strong>el</strong>.<br />
Consi<strong>de</strong>ring the water availability, temperatures, soil fertility, and topography, the conclusion<br />
(Lazcano 2006a) is that the regions that can support rain fed agriculture are located in<br />
Tabasco, Veracruz, Jalisco, Nayarit, Mor<strong>el</strong>os, Chiapas, Colima, Campeche, and México. The<br />
regions where irrigation is nee<strong>de</strong>d are in Baja California, Sonora, Sinaloa, Chihuahua,<br />
Coahuila, Durango, Tamaulipas, Guanajuato, Querétaro y Puebla.<br />
A summary of soil utilization in Mexico is shown in (Table 6.2).<br />
Agriculture (including wood plantations) may use ~16% of the area, or 30. M ha; in 2003 the<br />
cultivated area was only 21.8 M ha (16.7 rain fed, 5 irrigated) (Lazcano 2006a). Irrigation<br />
uses 9 000. m 3 water /ha (average) and its use must be carefully planned; today 1/3 already<br />
uses un<strong>de</strong>rground water. Irrigation corresponds to 84% of the total water consumption<br />
(agriculture, domestic and industrial sectors) according to the Comisión Nacional <strong><strong>de</strong>l</strong> Agua<br />
(Lazcano 2006a).<br />
Besi<strong>de</strong>s that area, the conversion of some pasture land (mainly the extensive cattle rising,<br />
natural pastur<strong>el</strong>and) to cropland is one of the possibilities to extend the so called “agricultural<br />
frontier”. In many places in the world large portions of the pastur<strong>el</strong>and area correspond to<br />
highly anthropized, <strong>de</strong>gra<strong>de</strong>d lands, and most of it can be reclaimed for other purposes with<br />
the introduction of more advanced technology.<br />
46
<strong>Potenciales</strong> y <strong>Viabilidad</strong> <strong><strong>de</strong>l</strong> <strong>Uso</strong> <strong>de</strong> <strong>Bioetanol</strong> y <strong>Biodies<strong>el</strong></strong> <strong>para</strong> <strong>el</strong> Transporte en México (SENER-BID-GTZ)<br />
Task 6: Potentials in r<strong>el</strong>ation to sustainability criteria<br />
Table 6.2 Main soil utilization and vegetation, 2002<br />
Soil utilization Area, M ha %<br />
Forests (disturbed or not) 69.0 35.7<br />
Arid region vegetation 57.6 29.8<br />
Pasture land<br />
Natural 10.2 5.3<br />
Cultivated 17.5 9.1<br />
Agricultural land<br />
Irrigated 8.5 4.6<br />
Rain fed 21.3 11.0<br />
Other uses 0.8 4.0<br />
Urban areas 0.1 0.6<br />
Source: Semarnat, Compendio <strong>de</strong> Estadisticas Ambientales 2002, Mexico DF 2003; quoted by<br />
(Lazcano 2006a)<br />
As stated in the Report on Task 3 (Lazcano 2006a), in the regions on the South-Southeast<br />
(Veracruz, Chiapas. Tabasco, Campeche y Yucatán) the pastur<strong>el</strong>and occupies 7 M ha and in<br />
suitable places the production of energy crops could be <strong>de</strong>v<strong>el</strong>oped. Sugar cane could be<br />
<strong>de</strong>v<strong>el</strong>oped (in rain fed conditions) to achieve more than 70 t / ha in ten years. Sugar cane is<br />
the most profitable culture in rain fed conditions.<br />
The first conclusion is that, today, there are areas suitable to produce energy crops without<br />
direct competition with food production. However Mexico’s agriculture is un<strong>de</strong>rgoing a strong<br />
structural transition in the last ten years, and the future is still unclear; the problems (today)<br />
and possibilities are outlined in the next pages.<br />
Increasing productivities in the agricultural areas has also to be consi<strong>de</strong>red when looking for<br />
land availability. In general productivity has increased in Mexico for the last years for most<br />
products, but there is room for improvements. The main factors have been summarized as<br />
follows:<br />
• Water utilization (irrigation): it is already larg<strong>el</strong>y used; water availability is a problem,<br />
but in some regions it may increase<br />
• Genetic material: seed quality is a<strong>de</strong>quate to the specific needs (either improved or<br />
“criollas”). For clone propagation (sugar cane) the genetic improvement program must<br />
be re-established to provi<strong>de</strong> a stronger varietal basis (higher productivities, quality and<br />
production safety).<br />
• Fertilizer utilization: there is a <strong>de</strong>ficit in fertilizer utilization today in almost all areas,<br />
due mainly to higher costs (80% is imported)<br />
• Mechanization: mostly at medium / low lev<strong>el</strong>s; this is due to topography and to the<br />
ina<strong>de</strong>quacy of the equipment to very small agricultural properties.<br />
47
<strong>Potenciales</strong> y <strong>Viabilidad</strong> <strong><strong>de</strong>l</strong> <strong>Uso</strong> <strong>de</strong> <strong>Bioetanol</strong> y <strong>Biodies<strong>el</strong></strong> <strong>para</strong> <strong>el</strong> Transporte en México (SENER-BID-GTZ)<br />
Task 6: Potentials in r<strong>el</strong>ation to sustainability criteria<br />
Among the main crops in Mexico, three may be consi<strong>de</strong>red for ethanol production: corn,<br />
sorghum (grain) and sugar cane. They use today a significant area, as seen b<strong>el</strong>ow:<br />
Table 6.3 Areas for some s<strong>el</strong>ected products, 2004<br />
Crops<br />
Rain fed<br />
M ha<br />
Irrigated<br />
M ha<br />
Total<br />
M ha<br />
Production<br />
M t / year<br />
Corn (annual) 7.08 1.33 8.41 21.70<br />
Sorghum (annual) 1.60 0.35 1.95 7.00<br />
Sugar cane (perennial) (1) 0.24 0.37 0.61 47.80<br />
(1) 2003/04<br />
The differences in productivity between irrigated and rain fed crops, in the average Mexican<br />
conditions, are very high: sugar cane, 88.4 to 65 t / ha; corn, 6.36 to 1.87 t /ha; and sorghum<br />
(grain), 6.21 to 3.0 t / ha. Correspondingly, the average value of the agricultural production /<br />
ha (2003) was 3.5 times higher for irrigated crops (Lazcano 2006a).<br />
In general, it is seen that there is room for improvement in productivities. Consi<strong>de</strong>ring the area<br />
and water availabilities, pursuing higher productivities is of course essential and it is one of<br />
the issues in the complex transition of the Mexican agriculture to a new situation, as discussed<br />
in the following <strong>para</strong>graphs.<br />
6.3 Areas nee<strong>de</strong>d to supply the biomass ethanol production in the<br />
proposed Scenarios<br />
(Table 6.4) shows the approximate areas nee<strong>de</strong>d to support the programs consi<strong>de</strong>red in the<br />
three Scenarios. The previous work done in this project (Lazcano 2006b) indicated the areas<br />
and conditions used to prepare this summary. It is seen that at least two crops (sugar cane and<br />
sugar beets) would need less than 1 M ha to reach the production for 10% of gasoline<br />
substitution (Scenario 3). This seems to be within the possibilities today, since agriculture<br />
used only 21.8 M (2003) out of ~16% of the “available” area, or 30. M ha; and pasture land<br />
(27.7 M ha) in some regions (South-Southeast) could be partially used for energy crops. Corn<br />
would also be in this range, while cassava and sorghum would require much larger areas.<br />
48
<strong>Potenciales</strong> y <strong>Viabilidad</strong> <strong><strong>de</strong>l</strong> <strong>Uso</strong> <strong>de</strong> <strong>Bioetanol</strong> y <strong>Biodies<strong>el</strong></strong> <strong>para</strong> <strong>el</strong> Transporte en México (SENER-BID-GTZ)<br />
Task 6: Potentials in r<strong>el</strong>ation to sustainability criteria<br />
Table 6.4<br />
Areas nee<strong>de</strong>d for ethanol production in the proposed Scenarios<br />
Productivity, t/ha Conversion,<br />
l ethanol / t<br />
Areas nee<strong>de</strong>d, 2010<br />
M ha (4)<br />
Average Expected (8) Scenario 1 Scenario 2 Scenario 3<br />
today (1)<br />
Sugar Cane 74 65 (2) 83 (3) 0.08 0.21 0.85<br />
Corn 2.8 9.1 (5) 400 0.11 0.32 1.26<br />
Sorghum (grain) 2 2 (6) 400 0.51 1.44 5.73<br />
Cassava 10.6 (10) 170 0.23 0.64 2.54<br />
Wheat 6.0 6.0 (7) 440 0.16 0.44 1.73<br />
Sugar beets 40 85- 60 (9) 86 (12) 0.06-0.09 0.16- 0.11 0.63-0.89<br />
(1) For the conditions (irrigation or rain fed, etc) proposed in the scenarios<br />
(2) For rain fed areas (indicated for expansion to produce ethanol). Except for Tabasco and<br />
some areas of Chiapas and Veracruz (sufficient rain) all other areas will need at least two<br />
water applications to reach ~70 t cane / ha (Lazcano 2006b)<br />
(3) New distilleries; from the average in Brazil (2002) corrected by the pol% cane.<br />
(4) Scenario 1: 0. 412 M m 3 ethanol / year<br />
Scenario 2: 1.153 M m 3 ethanol / year<br />
Scenario 3: 4.582 M m 3 ethanol / year<br />
(5) With irrigation; Mar <strong>de</strong> Cortés, Center-North of Sinaloa; as proposed (Lazcano 2006b )<br />
(6) Rain fed; as proposed, in the San Fernando Tamps, Pacifico Norte (Lazcano 2006b)<br />
(7) With irrigation; Valles <strong>de</strong> Mexicali, <strong><strong>de</strong>l</strong> Yaki and B.C. (Lazcano 2006b)<br />
(8) In all cases (when applicable) the use of c<strong>el</strong>lulosic residues to produce ethanol from<br />
hydrolysis is not consi<strong>de</strong>red in this table, although it is inclu<strong>de</strong>d (with the necessary<br />
restrictions) in the study.<br />
(9) With irrigation; as proposed, in the Valle <strong>de</strong> Mexicali and may be the Valle <strong><strong>de</strong>l</strong> Fuerte,<br />
Sinaloa (Lazcano 2006b) the value of 85 would be achieved. The second value (~60) is the<br />
average 5- year productivity (2000-2004) for the best producers in Europe (France, Germany,<br />
B<strong>el</strong>gium), (F O Lichts 2005).<br />
(10) Rain fed; Bajo Papaloapan, Peninsular<br />
(11) This was the world average in 2000; in many conditions higher values can be obtained<br />
(soils, water) (FAO 2002)<br />
(12) See (El Sayed, Matthews and Mortimer 2005)<br />
49
<strong>Potenciales</strong> y <strong>Viabilidad</strong> <strong><strong>de</strong>l</strong> <strong>Uso</strong> <strong>de</strong> <strong>Bioetanol</strong> y <strong>Biodies<strong>el</strong></strong> <strong>para</strong> <strong>el</strong> Transporte en México (SENER-BID-GTZ)<br />
Task 6: Potentials in r<strong>el</strong>ation to sustainability criteria<br />
6.4 Agriculture in Mexico; food production<br />
The organization of the Mexican agriculture has gone through very strong changes in the last<br />
ten years, as w<strong>el</strong>l shown in both the Reports on Task 1 (Masera and Prehn 2006) and Task 3<br />
(Lazcano 2006a), in this study. Those changes will persist for the next years, and their<br />
influence in any agricultural program has to be consi<strong>de</strong>red. They are based on economic<br />
opening, with market driven orientation; a series of international treaties including the<br />
NAFTA, were signed. A landmark for agriculture was the change of the Article 27 of the<br />
Mexican Constitution in 1992; it allowed the transformation of the social land property<br />
(“ejidos” and the common areas) into private properties. The new commercial orientation with<br />
the NAFTA (1994) reduced the protection for the agricultural sectors (mainly for cereal grains<br />
and small farmers), though beneficial to the export crops. The NAFTA improved the offer of<br />
products in Mexico (quality, lower prices) and concurred (within the context of other actions)<br />
to the gradual disappearance of many local products (Lazcano 2006a).<br />
The extension of this change may be seen from the analysis of the situation before: the<br />
“ejidos” and communal properties correspon<strong>de</strong>d to ~105 M ha of land (half of the total area of<br />
the country). This was changed, and in 2004, already 69% of the area was already certified to<br />
be rented or sold (but small action was actually registered in this direction). The land<br />
distribution indicates 3.8 M production units (in 2005: estimated 2.6 M “ejidal”, 1.2 M<br />
private), more than 60% with less than 5 ha. The “ejidos” had support programs for credit,<br />
technology and commercialization (INEGI 2001).<br />
The losses in income (and production) in the last years led to the need for the direct financial<br />
support from the PROCAMPO to some 3 M workers, and to strong migration. Agriculture<br />
provi<strong>de</strong>d 6.37 M jobs (diminishing), against 7.7 in industry and 17.5 in services, in 2003.<br />
Although all Mexican agriculture is affected by the changes, there are differences among<br />
specific areas. Within the NAFTA, for instance, import tariffs to Mexico still hold (till 2008)<br />
for some agricultural products, including sugar and corn.<br />
Institutional support for agriculture (financing, with three <strong>de</strong>v<strong>el</strong>opment banks; insurance, with<br />
the Ley <strong><strong>de</strong>l</strong> Seguro Agrícola, and the Aseguradora Nacional Agrícola y Gana<strong>de</strong>ra; minimum<br />
prices for basic products, the CONASUPO; and storage / distribution systems) was greatly<br />
reduced.<br />
The impact of these changes in food production is very clear. From 1994 to 2003 the<br />
importation of the main basic grain ad oil seeds (food or feed) grew from 10.7 M t (~27% of<br />
the total <strong>de</strong>mand) to 20.6 M t (~40% of total <strong>de</strong>mand), (APPAMEX 2004). There was an<br />
increase in production, but the internal <strong>de</strong>mand grew faster.<br />
The Mexican Balance of Payments (Masera and Prehn 2006) shows a small <strong>de</strong>ficit (0.74% of<br />
the GDP) in 2005; and a positive result (1.8% of the GDP) in the capital flows. Two important<br />
items were the transfer from the resi<strong>de</strong>nts outsi<strong>de</strong> Mexico (2.6% of the GDP); and the net oil<br />
and refined products tra<strong>de</strong> (2.0 % of the GDP). For a GDP of US$ 770000. M, the exports<br />
correspon<strong>de</strong>d to 27.7% (88.7% to the U. S.).<br />
The estimates for the food products export /import balance (agriculture, fish and meat,<br />
processed foods) (INEGI, 2005; quoted in Lazcano 2006a) show US$ 11860. M and 14300.<br />
50
<strong>Potenciales</strong> y <strong>Viabilidad</strong> <strong><strong>de</strong>l</strong> <strong>Uso</strong> <strong>de</strong> <strong>Bioetanol</strong> y <strong>Biodies<strong>el</strong></strong> <strong>para</strong> <strong>el</strong> Transporte en México (SENER-BID-GTZ)<br />
Task 6: Potentials in r<strong>el</strong>ation to sustainability criteria<br />
M, respectiv<strong>el</strong>y, with a <strong>de</strong>ficit of US$ 2440. M. This corresponds to approximat<strong>el</strong>y 10% of the<br />
non-oil commercial tra<strong>de</strong> <strong>de</strong>ficit, in 2005. The imports inclu<strong>de</strong>d 16.6 M t of grains (including<br />
6 M t corn, and 3.7 M t wheat) and 0.75 M t meat. Some estimates for 2015-16 (keeping the<br />
trends) indicate 21.8 M t grains to be imported (only corn, wheat and sorghum). Mexico<br />
evi<strong>de</strong>ntly has the capacity to import the food products nee<strong>de</strong>d; however the s<strong>el</strong>f-sufficiency in<br />
food production (though of course it is not an objective) would need more area than the 21.8<br />
M ha used in 2003 (~5 M ha). Also, the increasing meat imports are “freeing” land (pasture<br />
areas) which may be reclaimed latter, should the economic policies change.<br />
6.5 Sugar cane in Mexico<br />
The situation for sugar (and sugar cane) is particularly difficult: the surpluses generated in the<br />
last years (and some of the future production) will suffer competition from imported fructose<br />
(from corn). After the privatization of the sector in 1990, the contractual r<strong>el</strong>ationship between<br />
cane growers and mills (with government fixed prices), based on the existing rules, was not<br />
compatible with the economic opening and the external market prices. Besi<strong>de</strong>s, the regulations<br />
did not lead to measures to reduce production costs (both in cane production and processing).<br />
So in 2000 almost half of the sugar mills were again controlled by the State and the problem<br />
persists.<br />
It is w<strong>el</strong>l recognized that the sugar cane based industry, with the existing legislation, will have<br />
serious difficulties to compete with imported corn fructose. Export prices for sugar are much<br />
lower than allowed by the cane price. The small scale cane production makes it difficult to<br />
adopt higher productivity technologies; the cane price fixing system do not “integrate” cane<br />
producers and mill owners (they do not have common interests). The legal aspects, the<br />
r<strong>el</strong>ationship between cane producers and industrials, and possibilities for improvement have<br />
been discussed by the involved parties (Poy 2005a). Cane producers will stay in the old<br />
system, un<strong>de</strong>rstandably, since it inclu<strong>de</strong>s health insurance, social security, retirement; and this<br />
is not yet universal in the whole agriculture. However the system may soon lead to more<br />
unemployment.<br />
Although all sectors involved (government, cane producers, mill owners) clearly un<strong>de</strong>rstand<br />
the issues, a general solution has not evolved yet. The main issue is to reduce production costs;<br />
it is agreed that there is a large margin to do this, both in agriculture and in industry, within the<br />
regional differences (Poy 2005b). Some of the measures mentioned are:<br />
• Industry: mo<strong>de</strong>rnizing equipment for higher efficiencies; promoting efficient energy<br />
production, including diversification (ethanol and co-generated <strong>el</strong>ectricity); better<br />
(technical) management<br />
• Cane production: production areas (scale) must be sufficient to allow for higher<br />
productivity technologies (some mechanization); strong support in the availability of<br />
new varieties; availability of affordable fertilizers.<br />
To reach this point, the institutional problems remain the most difficult. It will be essential to<br />
establish a new r<strong>el</strong>ationship between the cane producers and the mill owners; they must have<br />
common interest in the business. This is not to say that the mill owners must have total land<br />
ownership (in Brazil, they have approximat<strong>el</strong>y 35%; they rent ~35%, and the remaining is<br />
51
<strong>Potenciales</strong> y <strong>Viabilidad</strong> <strong><strong>de</strong>l</strong> <strong>Uso</strong> <strong>de</strong> <strong>Bioetanol</strong> y <strong>Biodies<strong>el</strong></strong> <strong>para</strong> <strong>el</strong> Transporte en México (SENER-BID-GTZ)<br />
Task 6: Potentials in r<strong>el</strong>ation to sustainability criteria<br />
owned by 40 000. cane suppliers). The CONSECANA system, for instance (São Paulo)<br />
intermediates the r<strong>el</strong>ationships between ~15000. cane suppliers and ~100 mill owners;<br />
reference prices are agreed between parties in the beginning of the season, including<br />
corrections for (measured) sugar content and impurities in cane; and corrections for the prices<br />
obtained with the s<strong>el</strong>ling of products (sugar and ethanol). The pertinent values (cane quality,<br />
and product s<strong>el</strong>ling prices) are audited by in<strong>de</strong>pen<strong>de</strong>nt organizations; the government has no<br />
participation in the system.<br />
Among the proposed solutions in Mexico, some are based on the b<strong>el</strong>ief that the existing sugar<br />
cane system will not be changed; so, the i<strong>de</strong>a to start an ethanol (or ethanol and <strong>el</strong>ectricity)<br />
program would be <strong>de</strong>v<strong>el</strong>oped in “new” cane areas, with new regulations. The cane producers<br />
would be partners in the whole production system (including the industry). This is similar to<br />
what is being consi<strong>de</strong>red for ethanol from corn.<br />
This would of course be simpler; but still the 150000. cane growers today would be left in a<br />
difficult position.<br />
The use of corn as a feedstock would be following the same institutional lines (as in the U.S.<br />
today). These alternative institutional scenarios and their implications will be discussed in the<br />
Reports on Tasks 7 and 8.<br />
6.6 Summary and Conclusions<br />
Sustainable land utilization is a concern for every country. Environmental restrictions<br />
(preserved areas) and agriculture (to ensure secure and low cost food supplies) play a central<br />
role in the discussion. Although “food security” is seen in different ways for each country in<br />
today’s more global economy, providing a fair amount of their “basic food products” with<br />
their own resources is usually a goal. The interest in Energy crops adds more complexity to<br />
the problem; the use of wastes, or <strong>de</strong>gra<strong>de</strong>d lands, has been much analyzed recently.<br />
In Mexico ~ 61% of the territory presents a humidity <strong>de</strong>ficit (severe, for 45%) with arid or<br />
semi-arid climate (Lazcano 2006a). Agriculture may use ~16% of the area, or 30. M ha; in<br />
2003 the cultivated area was 21.8 M ha (16.7 rain fed, 5 irrigated). Pasture land covers a<br />
similar area (27.7 M ha), and in some regions (South-Southeast) it could be partially used for<br />
energy crops.<br />
Agricultural productivity increased in Mexico for the last years, but there is room for<br />
improvements, leading to more area available. Irrigation (water availability) plays a central<br />
role in this issue.<br />
Two crops (sugar cane and sugar beets) would need less than 1 M ha to reach the production<br />
for 10% of gasoline substitution; corn would also be in this range, while cassava and sorghum<br />
would require much larger areas.<br />
The structure of Mexican agriculture has gone through very strong changes in the last ten<br />
years; changes will continue in the next years, and their influence in any agricultural program<br />
has to be consi<strong>de</strong>red. Institutional support was greatly reduced, together with land ownership<br />
52
<strong>Potenciales</strong> y <strong>Viabilidad</strong> <strong><strong>de</strong>l</strong> <strong>Uso</strong> <strong>de</strong> <strong>Bioetanol</strong> y <strong>Biodies<strong>el</strong></strong> <strong>para</strong> <strong>el</strong> Transporte en México (SENER-BID-GTZ)<br />
Task 6: Potentials in r<strong>el</strong>ation to sustainability criteria<br />
structure. The traditional agriculture is not able to compete with many imported products;<br />
from 1994 to 2003 the importation of the main basic grain ad oil seeds (food or feed) grew<br />
from 10.7 M t (~27% of the total <strong>de</strong>mand) to 20.6 M t (~40% of total <strong>de</strong>mand), (APPAMEX<br />
2004). The s<strong>el</strong>f-sufficiency in food production (though of course it is not an objective) would<br />
need more than the 21.8 M ha used in 2003 (~5 M ha, with today’s productivities).<br />
The sugar cane based industry, with the existing legislation, can not compete with imported<br />
corn fructose; and export prices for sugar are lower than allowed by the cane price. Problems<br />
caused by the small scale cane production and a cane price fixing system that do not<br />
“integrate” cane producers and mill owners will need a<strong>de</strong>quate solution. Both cane production<br />
and cane processing present good opportunities for increasing efficiencies and reducing costs,<br />
once the institutional problems are solved. Among the opportunities, diversification to ethanol<br />
(and <strong>el</strong>ectricity co-generation) may be of great importance to strengthen the whole sugar cane<br />
agro-industry.<br />
7. Water Utilization: agriculture and industry<br />
7.1 Water utilization in Agriculture<br />
The largest use of water resources in agro-industries is due to irrigation (except of course in<br />
rain fed production). The water used in agricultural production worldwi<strong>de</strong> (2,595 km 3 in 2000)<br />
correspon<strong>de</strong>d to an average of 9,436 m 3 /ha/year; it is estimated that the average can be<br />
reduced to 8,100 m 3 /ha/year by 2025 (Macedo 2005). Irrigation competes with all the other<br />
water uses worldwi<strong>de</strong>; the average is 70% of all the water used (agriculture, domestic and<br />
industrial sectors).<br />
In Mexico the figure is still higher: 84%, with 9000. m 3 water /ha (average); today 1/3 already<br />
uses un<strong>de</strong>rground water (Lazcano 2006a). It is estimated that irrigation in Mexico (as in many<br />
other countries) presents an overall efficiency of only 24 – 34% (Lazcano 2006a); there is<br />
need for important inversions in infrastructure. Investments have been ma<strong>de</strong> in water<br />
reservoirs (to control floods); but there is evi<strong>de</strong>nce of severe problems with erosion and soil<br />
loss due to <strong>de</strong>forestation (large areas), limiting the storage capacities and reducing water<br />
flows.<br />
The water availability problems lead to limitations in the use of some areas for energy crops; it<br />
has been consi<strong>de</strong>red in the s<strong>el</strong>ection of biomass feedstocks and productivities (Lazcano<br />
2006a); and Chapter 6 in this study. Among the s<strong>el</strong>ected crops, sorghum and cassava are the<br />
most resistant to drought, requiring less water (see Chapter 11). In the world most corn and<br />
wheat are produced without irrigation; but the large production makes them some of the<br />
largest water consumers. Sugar cane may use no irrigation (as in Brazil) or some irrigated area<br />
(in Mexico: 39%).<br />
For each case, as in all other agricultural production, the use of water for irrigation must be<br />
authorized by the SEMARNAT (Secretaría <strong>de</strong> Medio Ambiente y Recursos Naturales). It is<br />
expected that irrigated areas would be primarily <strong>de</strong>stined to food production. It is also<br />
expected that (as in many other regions in the world) more efficient use of water for irrigation<br />
53
<strong>Potenciales</strong> y <strong>Viabilidad</strong> <strong><strong>de</strong>l</strong> <strong>Uso</strong> <strong>de</strong> <strong>Bioetanol</strong> y <strong>Biodies<strong>el</strong></strong> <strong>para</strong> <strong>el</strong> Transporte en México (SENER-BID-GTZ)<br />
Task 6: Potentials in r<strong>el</strong>ation to sustainability criteria<br />
will be achieved, with new technologies. They have been studied for different situations, like<br />
the new areas for sugar cane in Brazil (Souza 2005b).<br />
7.2 Water utilization in the Industrial production<br />
Some conversion processes at the industry may require significant use of water. This is the<br />
case for sugar beets and cassava, with the washing at the mill. For sugar beets, the preprocessing<br />
washing at the industry uses up to 10 – 30% of the beets weight (in water) (Clay<br />
2004).<br />
In sugar cane processing, most of the washing has been <strong>el</strong>iminated with mechanical harvesting<br />
(Brazil) and also for manual harvesting (Brazil, Mexico). Improvements have been ma<strong>de</strong> with<br />
water recycling; in Brazil, the average water withdrawal from the sources (rivers, lakes,<br />
un<strong>de</strong>rground water) was 5.6 m 3 / t cane in 1990 (with consumption of 1.8, and r<strong>el</strong>easing 3.8<br />
m 3 / t cane of treated water). After a sucessful program to reduce the water withdrawal<br />
(increasing recycle) the value in 2005 was 1.8 m 3 / t cane (see Annex 3).<br />
All water not consumed in the process must be treated before disposition in the water ways,<br />
and it is expected that regulations will be fully implemented in a biomass to energy program.<br />
Excluding stillage (discussed in <strong>de</strong>tail in Chapter 9) the main effluents in sugar cane<br />
processing and their treatment systems are (Elia Neto 2005):<br />
• Sugar-cane washing water: 180-500mg/l of BOD 5 and high concentration of solids.<br />
Treated with settling and stabilization ponds for the case of r<strong>el</strong>ease to water bodies. For<br />
reuse, the treatment consists of settling and pH correction of 9-10. Cane washing is<br />
being <strong>el</strong>iminated; in Mexico, only 10% of the mills wash the sugar cane (information<br />
from Ing. I. Lazcano Martinez, 2006).<br />
• Multijet and barometric con<strong>de</strong>nser waters: low pollutant potential (10-40 mg/BOD 5 )<br />
and high temperature (~50ºC). Treatment with sprinkler tanks or cooling towers, with<br />
recirculation or r<strong>el</strong>ease.<br />
• Fermentation Vats and ethanol con<strong>de</strong>nser cooling waters: high temperature (~50ºC).<br />
Treatment with cooling towers or sprinkler tanks for return or r<strong>el</strong>ease.<br />
The water <strong>de</strong>mand for corn processing to ethanol, using the dry milling process, was estimated<br />
at 1.5 to 5.5 m 3 water / m 3 ethanol (BBI 2005) <strong>de</strong>pending on make-up water quality and plant<br />
<strong>de</strong>sign. It is expected that similar values apply to wheat and grain sorghum.<br />
Besi<strong>de</strong>s addressing the specific problems with water use due to irrigation (more efficient<br />
technologies) and industrial utilization (technology and a<strong>de</strong>quate water prices) there is room<br />
for improvement in the protection of waterways and water sources. The substitution of the<br />
riparian vegetation, to act as a buffer between the agricultural activity and the waterways, is an<br />
important practice. Riversi<strong>de</strong> woods are essential plant systems for environmental equilibrium.<br />
Their functions inclu<strong>de</strong> controlling erosion on banks of water streams, thereby and quality of<br />
the waters, filtering any possible waste resulting from the chemicals used as pestici<strong>de</strong>s and<br />
fertilizers, and h<strong>el</strong>ping to preserve biodiversity and the genetic inheritance of the flora and<br />
fauna. The environmental legislation usually establishes limits forbidding the use of areas<br />
54
<strong>Potenciales</strong> y <strong>Viabilidad</strong> <strong><strong>de</strong>l</strong> <strong>Uso</strong> <strong>de</strong> <strong>Bioetanol</strong> y <strong>Biodies<strong>el</strong></strong> <strong>para</strong> <strong>el</strong> Transporte en México (SENER-BID-GTZ)<br />
Task 6: Potentials in r<strong>el</strong>ation to sustainability criteria<br />
along the rivers and springs; the Brazilian legislation, for instance, establishes the limits<br />
(riversi<strong>de</strong> woods are Permanent Preservation Areas) but does <strong>de</strong>termine that riversi<strong>de</strong> woods<br />
should be recovered if previously <strong>de</strong>gra<strong>de</strong>d (Ricci Jr 2005b). In São Paulo, 2005, the riversi<strong>de</strong><br />
woods area (Permanent Preservation) correspon<strong>de</strong>d, in the sugar cane area, to 8.1% of the total<br />
area; nearly half were covered with natural or planted forests (Ricci Jr 2005b).<br />
In Mexico, the residual water discharge in waterways is regulated by the Norma Oficial<br />
Mexicana NOM-001-SEMARNAT-1996 (Jan 06, 1997). For the efficient (and safe) utilization<br />
of stillage in ferti-irrigation, special legislation is nee<strong>de</strong>d, as seen in Chapter 9.<br />
7.3 Summary and Conclusions<br />
Water use in irrigation is nee<strong>de</strong>d in many conditions; irrigation takes 70% of the water uses in<br />
the world. Mexico has reached 85% (1/3 with un<strong>de</strong>rground water; 9000 m 3 / ha, average). It is<br />
expected that regulations for the use of water will be more limiting in the future. Energy crops<br />
will naturally be required to use less irrigation whenever possible; technologies for efficient<br />
use of water are expected to be consi<strong>de</strong>red.<br />
Programs to recover the riparian vegetation in existing agricultural areas, and legal protection<br />
for all expansion in new areas, are recommen<strong>de</strong>d to protect the waterways and reduce risks of<br />
contamination, and must be contemplated in all agricultural <strong>de</strong>v<strong>el</strong>opments.<br />
All processes to produce ethanol from biomass today may be improved to use less water<br />
withdrawal from the sources; legal measures (which can be applied to all industrial systems)<br />
may inclu<strong>de</strong> a<strong>de</strong>quate payment for water withdrawal and consumption, and strict<br />
specifications for discharged water quality.<br />
55
<strong>Potenciales</strong> y <strong>Viabilidad</strong> <strong><strong>de</strong>l</strong> <strong>Uso</strong> <strong>de</strong> <strong>Bioetanol</strong> y <strong>Biodies<strong>el</strong></strong> <strong>para</strong> <strong>el</strong> Transporte en México (SENER-BID-GTZ)<br />
Task 6: Potentials in r<strong>el</strong>ation to sustainability criteria<br />
8. Impacts in water supply: water contamination with the use of<br />
ethanol - gasoline and ETBE – gasoline blends<br />
8.1 Introduction<br />
MTBE, ETBE and Ethanol are oxygenates which are ad<strong>de</strong>d to gasoline in or<strong>de</strong>r to increase the<br />
octane number and to <strong>de</strong>crease the emission of air pollutants resulting from combustion of the<br />
fu<strong>el</strong>s. The use of oxygenates in gasoline leads to an improvement of the air quality. However,<br />
the experience with MTBE showed that the risk of groundwater and surface water<br />
contamination may be broadly increased by the use of these substances. In 1998 the EPA<br />
r<strong>el</strong>eased a report about the critical information and research needs for oxygenates in water: the<br />
sources, transport, transformation, occurrence, exposure, aquatic toxicity, health effects,<br />
r<strong>el</strong>ease prevention, and contaminant removal (EPA 1998).<br />
MTBE was banned in many regions in the following years, essentially for the problems found<br />
with water contamination. Research in the area has clarified many points, but still insufficient<br />
information exists for ETBE (mainly due to its r<strong>el</strong>ativ<strong>el</strong>y low utilization). Leaking<br />
un<strong>de</strong>rground storage tanks (UST) are b<strong>el</strong>ieved to be the primary source of localized r<strong>el</strong>eases of<br />
MTBE in high concentrations; but it is not clear whether the greater impact from MTBE (or<br />
other oxygenates) to ground water is from diffuse or point sources. Gasoline spills, and<br />
permeation through plastic membranes / tubes, have been evaluated in the context.<br />
Some important factors (r<strong>el</strong>ated to the oxygenate) are consi<strong>de</strong>red when evaluating risks.<br />
Among them are:<br />
The solubility of the oxygenate in water<br />
The oxygenate rate of <strong>de</strong>gradation in the environment<br />
The anticipated human exposures<br />
The toxicity to aquatic life, and the effects to human health.<br />
In the next <strong>para</strong>graphs we consi<strong>de</strong>r the r<strong>el</strong>evant facts r<strong>el</strong>ated to the risks with ethanol –<br />
gasoline blends, and the information available r<strong>el</strong>ated to gasoline – ETBE blends.<br />
8.2 Ethanol – Gasoline blends<br />
8.2.1 Effects of ethanol leakage / spillage<br />
Ethanol – gasoline blends have been analyzed for the risks posed by eventual groundwater<br />
contamination by leakages and spills. Summarizing (Armstrong 1999):<br />
• ethanol is readily <strong>de</strong>gra<strong>de</strong>d in the environment<br />
• anticipated human exposures to ethanol are very low<br />
56<br />
• voluminous information on metabolism of ethanol by humans, and on the health<br />
effects of ingested ethanol, suggests that environmental exposures to ethanol will have<br />
no adverse health impact.
<strong>Potenciales</strong> y <strong>Viabilidad</strong> <strong><strong>de</strong>l</strong> <strong>Uso</strong> <strong>de</strong> <strong>Bioetanol</strong> y <strong>Biodies<strong>el</strong></strong> <strong>para</strong> <strong>el</strong> Transporte en México (SENER-BID-GTZ)<br />
Task 6: Potentials in r<strong>el</strong>ation to sustainability criteria<br />
Ethanol <strong>de</strong>gra<strong>de</strong>s rapidly (2 to 4 hours) in subsurface environment; it is totally miscible in<br />
water, and adsorption to aquifer materials is not expected. One possibility is being investigated<br />
(no facts yet): the fast bio-<strong>de</strong>gradation of ethanol in water <strong>de</strong>pletes oxygen at the leading edge<br />
of a groundwater plume, extending the BTEX (benzene, toluene, ethyl benzene, xylenes)<br />
plume and <strong><strong>de</strong>l</strong>aying BTEX <strong>de</strong>gradation.<br />
Water treatment is not nee<strong>de</strong>d for ethanol leakages / spills, due to its natural <strong>de</strong>gradation in<br />
water.<br />
Ethanol is lik<strong>el</strong>y to have small adverse impacts in small gasoline spills; impacts of large spills<br />
are difficult to generalize, due to uncertainties on the effects of ethanol in BTEX plume<br />
lengths. Un<strong>de</strong>r acute exposure conditions, ethanol is 3.7 times less toxic to aquatic life than<br />
MTBE (NEIWPCC 2001).<br />
Given current information ethanol appears to be one of the least toxic of the major<br />
components of gasoline when consi<strong>de</strong>ring common toxicological endpoints, such as<br />
carcinogenicity and central nervous system <strong>de</strong>pression. Pr<strong>el</strong>iminary analyses indicate that<br />
direct exposure to fu<strong>el</strong> ethanol in the air and in contaminated drinking water is not expected to<br />
pose public health risks. Low lev<strong>el</strong> ethanol contamination of groundwater (< 400 µg/l) is not<br />
expected to substantially alter blood alcohol concentrations or produce a significant health risk<br />
(NEIWPCC 2001).<br />
The potential for other adverse impacts, including <strong>de</strong>v<strong>el</strong>opmental effects associated with large<br />
scale exposure to low lev<strong>el</strong>s of ethanol is uncertain (NEIWPCC 2001).<br />
8.2.2 Ethanol leakage / spillage prevention<br />
The large scale use of ethanol as automotive fu<strong>el</strong> in Brazil and in the U.S. has led to the<br />
<strong>de</strong>v<strong>el</strong>opment of specific standards for equipment, systems and procedures to assure the safety<br />
against spillage and fire hazards. In particular, the Brazilian distribution network is spread<br />
through the whole country, with the corresponding blending centers, transportation and<br />
storage systems and service stations; all fu<strong>el</strong> service stations in Brazil have an ethanol pump,<br />
and also <strong><strong>de</strong>l</strong>iver gasoline with 20-25% ethanol.<br />
The storage systems at the distilleries are also built according to specific legislation. Due to<br />
seasonal production of ethanol, the distilleries in Brazil have storage systems (arrangements of<br />
storage tanks, interconnected, with fire prevention and protection systems, within contention<br />
barriers) with capacity to hold the production of the year.<br />
After 30 years of experience, it is agreed that these systems are a<strong>de</strong>quate to provi<strong>de</strong> protection<br />
at least with the same quality as that for the conventional fu<strong>el</strong>s (gasoline, dies<strong>el</strong>, and fu<strong>el</strong> oil).<br />
Technical norms, operational procedures, engineering and technical criteria are presently<br />
available in the production units and ethanol transport logistics companies (Gue<strong>de</strong>s, Gomes<br />
and Lepsch 2005). Blend pre<strong>para</strong>tion and distribution in the whole country is a routine<br />
procedure, with all the safety requirements (and results) of the conventional fu<strong>el</strong> industry<br />
(Cotrim 2005). In addition, ethanol characteristics (total miscibility in water, non toxic in low<br />
57
<strong>Potenciales</strong> y <strong>Viabilidad</strong> <strong><strong>de</strong>l</strong> <strong>Uso</strong> <strong>de</strong> <strong>Bioetanol</strong> y <strong>Biodies<strong>el</strong></strong> <strong>para</strong> <strong>el</strong> Transporte en México (SENER-BID-GTZ)<br />
Task 6: Potentials in r<strong>el</strong>ation to sustainability criteria<br />
concentrations) <strong>de</strong>termine that, should an acci<strong>de</strong>nt happen, the effects on environment (water<br />
ways, and soil) are small and disappear very rapidly. This is quite different with oil or oil<br />
<strong>de</strong>rived fu<strong>el</strong>s (gasoline, dies<strong>el</strong>).<br />
The standards for the manufacture of storage tanks, storage tank systems for ethanol and the<br />
handling of ethanol in storage and transportation in Brazil are (essentially) <strong>de</strong>rived from the<br />
API standards (for oil, and oil <strong>de</strong>rived fu<strong>el</strong>s) with a<strong>de</strong>quate adaptations. The basic standards<br />
are listed in Annex 3 (the Brazilian specific standards, NBR, and the applicable API – NFPA<br />
standards).<br />
8.3 ETBE – Gasoline blends<br />
The long term use of other (non MTBE) ether- based oxygenates, such as ETBE and TAME,<br />
may be limited by the same water quality concerns that have prompted calls for a phase-out of<br />
MTBE. The ethers are soluble in water and resistant to bio<strong>de</strong>gradation; consequently, ether<br />
contamination of soils and surface/ground water environments is difficult to remediate. There<br />
is little scientific information or fi<strong>el</strong>d data on the behavior of ETBE or TAME, when leaked or<br />
spilled; but they are expected to behave much like MTBE due to their similar chemical<br />
composition. Recent findings show that, although ETBE has some advantages compared to<br />
MTBE due to the physicochemical properties, the risk of groundwater contamination resulting<br />
from leaking un<strong>de</strong>rground storage tanks is not substantially smaller (Koene and Puttmann<br />
2005).<br />
8.4 Summary and Conclusions<br />
The experience with MTBE showed that the risk of groundwater and surface water<br />
contamination may be increased by the use of the some oxygenates. Research has been<br />
conducted in the last ten years; leaking un<strong>de</strong>rground storage tanks (UST) are b<strong>el</strong>ieved to be<br />
the primary source of localized r<strong>el</strong>eases; also gasoline spills, and permeation through plastic<br />
membranes / tubes, have been evaluated in the context. Oxygenates are consi<strong>de</strong>red according<br />
to their solubility in water; the rate of <strong>de</strong>gradation in the environment; anticipated human<br />
exposures; the toxicity to aquatic life, and the effects to human health.<br />
Ethanol – gasoline blends have been found to be r<strong>el</strong>ativ<strong>el</strong>y harmless: ethanol is readily<br />
<strong>de</strong>gra<strong>de</strong>d in the environment, human exposures are very low, and the expected exposures<br />
would have no adverse health impact (Armstrong 1999), (NEIWPCC 2001). However it is<br />
possible that the fast bio-<strong>de</strong>gradation of ethanol in water <strong>de</strong>pletes oxygen at the leading edge<br />
of a groundwater plume, extending the BTEX plume. Also, the large scale use of fu<strong>el</strong> ethanol<br />
in Brazil and in the U.S. led to the <strong>de</strong>v<strong>el</strong>opment of specific standards for equipment, systems<br />
and procedures to assure the safety against spillage and fire hazards.<br />
There is little information on the behavior of ETBE or TAME, when leaked or spilled; they<br />
are expected to behave much like MTBE due to their similar chemical composition. Ether<br />
contamination of soils and surface/ground water is difficult to remediate. ETBE has some<br />
advantages compared to MTBE due to the physicochemical properties, but the risk of<br />
58
<strong>Potenciales</strong> y <strong>Viabilidad</strong> <strong><strong>de</strong>l</strong> <strong>Uso</strong> <strong>de</strong> <strong>Bioetanol</strong> y <strong>Biodies<strong>el</strong></strong> <strong>para</strong> <strong>el</strong> Transporte en México (SENER-BID-GTZ)<br />
Task 6: Potentials in r<strong>el</strong>ation to sustainability criteria<br />
groundwater contamination resulting from leaking un<strong>de</strong>rground storage tanks is not<br />
substantially smaller (Koene and Puttmann 2005).<br />
59
<strong>Potenciales</strong> y <strong>Viabilidad</strong> <strong><strong>de</strong>l</strong> <strong>Uso</strong> <strong>de</strong> <strong>Bioetanol</strong> y <strong>Biodies<strong>el</strong></strong> <strong>para</strong> <strong>el</strong> Transporte en México (SENER-BID-GTZ)<br />
Task 6: Potentials in r<strong>el</strong>ation to sustainability criteria<br />
9. Stillage utilization<br />
9.1 Introduction<br />
Stillage is the residue from the distillation of the fermented sugarcane juice and molasses. It<br />
will be present also in the distillation of fermented sweet sorghum juice, and cassava or grains<br />
sugars from starch. It is generated primarily as the bottom product of the stripping column,<br />
concentrating all the wine components lighter than ethanol; it is produced at 85 - 95 C, with<br />
pH in the range of 3.5 – 4.5. Its characteristics <strong>de</strong>pend on the must composition (juice and<br />
molasses, cassava, etc), and also on the ethanol processing technology, distillery efficiency,<br />
and other. For each liter of alcohol, 10 to 15 liters of stillage are produced, <strong>de</strong>pending on the<br />
raw material characteristics and processing. With sugar cane, it has a high organic matter and<br />
potassium content, and r<strong>el</strong>ativ<strong>el</strong>y poor nitrogen, calcium, phosphor and magnesium contents;<br />
the composition <strong>de</strong>pends on the origin (the must), as shown in (Table 9.1), (Ferreira and<br />
Monteiro 1987).<br />
In Mexico stillage disposition is controlled by SERMANAT . In Brazil stillage used to be<br />
r<strong>el</strong>eased to water streams 30 years ago (at that time the volumes were much lower than today);<br />
recycling to the fi<strong>el</strong>ds started in 1978. The application rates (m 3 /ha) were gradually <strong>de</strong>creased,<br />
and new technologies were introduced with a view to expanding the ferti-irrigation area (for<br />
improved utilization of its potential) and <strong>el</strong>iminating un<strong>de</strong>rground water contamination risks.<br />
The current practice is full recycling, with great benefits.<br />
Stillage became a valuable input, substituting for part of the fertilizer needs, instead of a<br />
polluting waste stream. Since its application as a fertilizer substitute <strong>de</strong>pends in part in local<br />
conditions (topography, soil type and characteristics, <strong>de</strong>pth of the water table, among others)<br />
in some places it may be necessary (or convenient) to process stillage either to reduce volumes<br />
to allow for cheaper distribution, or to allow its organic matter to be burned as fu<strong>el</strong>, or yet to<br />
produce bio-gas for energy production and waste treatment.<br />
60<br />
Table 9.1 Chemical composition of stillage from different kinds of must, from<br />
sugar cane (Ferreira and Monteiro 1987)<br />
Elements<br />
Must<br />
Molasses Mixed Juice<br />
N kg/ m 3 vinasse 0.75 - 0.79 0.33 - 0.48 0.26 - 0.35<br />
P 2 O 5 kg/ m 3 vinasse 0.10 - 0.35 0.09 - 0.61 0.09 - 0.50<br />
K 2 O kg/ m 3 vinasse 3.50 - 7.60 2.10 - 3.40 1.01 - 2.00<br />
CaO kg/ m 3 vinasse 1.80 - 2.40 0.57 - 1.46 0.13 - 0.76<br />
MgO kg/ m 3 vinasse 0.84 - 1.40 0.33 - 0.58 0.21 - 0.41<br />
SO 4 kg/ m 3 vinasse 1.50 1.60 2.03<br />
*OM kg/ m 3 vinasse 37 - 57 19 - 45 15 - 35<br />
Mn mg/dm 3 6 - 11 5 - 6 5 - 10<br />
Fe mg/dm 3 52 - 120 47 - 130 45 - 110<br />
Cu mg/dm 3 3 - 9 2 - 57 1 - 18<br />
Zn mg/dm 3 3 - 4 3 - 50 2 - 3<br />
pH 4.0 - 4.5 3.5 - 4.5 3.5 - 4.0
<strong>Potenciales</strong> y <strong>Viabilidad</strong> <strong><strong>de</strong>l</strong> <strong>Uso</strong> <strong>de</strong> <strong>Bioetanol</strong> y <strong>Biodies<strong>el</strong></strong> <strong>para</strong> <strong>el</strong> Transporte en México (SENER-BID-GTZ)<br />
Task 6: Potentials in r<strong>el</strong>ation to sustainability criteria<br />
The production of ethanol from sugar cane in Mexico may happen with must from exhausted<br />
molasses (distilleries annexed to the existing sugar mills), cane juice (new, autonomous<br />
distilleries) or mixed (juice and some molasses, as in most Brazilian units). It is to be expected<br />
that for similar operating conditions (to the Brazilian) in an eventual large scale ethanol<br />
program in the Mexican sugar cane sector, stillage will have approximat<strong>el</strong>y the same<br />
composition. The Potassium concentrations are particularly important, since they r<strong>el</strong>ate<br />
directly to the fertilizer value of stillage.<br />
For the most general case (mixed) the stillage characteristics in Brazil today are shown in<br />
(Table 9.2).<br />
Table 9.2<br />
Analytical characterization of stillage, sugar cane, Brazil (Elias Neto<br />
and Nakahodo 1995)<br />
Stillage characterization<br />
(1)<br />
Unit Minimum Mean Maximum Standard<br />
<strong>de</strong>viation<br />
pH --- 3.50 4.15 4.90 0.32<br />
Temperature °C 65 89 111 9.78<br />
(BOD 5 ) mg/l 6680 16950 75330 9953.<br />
(COD) mg/l 9200 28450 97400 13943.<br />
Total Solids (TS) mg/l 10780 25155 38680 6792.<br />
Total Suspen<strong>de</strong>d Solids (TSS) mg/l 260 3967 9500 1940.<br />
Total Dissolved Solids (TDS) mg/l 1509 18420 33680 6488.<br />
Nitrogen mg/l 90 357 885 177.<br />
Total Phosphorous mg/l 18 60 188 36.<br />
Total Potassium mg/l 814 2035 3852 804.<br />
Calcium mg/l 71 515 1096 213.<br />
Magnesium mg/l 97 226 456 71.<br />
Sodium mg/l 8 52 220 41.<br />
Chlori<strong>de</strong> mg/l 480 1219 2300 417.<br />
Sulphate mg/l 790 1538 2800 514.<br />
Sulphite mg/l 5 36 153 32.<br />
(1) Straight stillage, (no flegmass mixture); mean stillage flow rate 10.85 l/l ethanol, standard<br />
<strong>de</strong>viation of 2.40. Note the Potassium content.<br />
Values from the cassava based ethanol production in Brazil (in the late 70’s) are shown in<br />
(Table 9.3).<br />
61
<strong>Potenciales</strong> y <strong>Viabilidad</strong> <strong><strong>de</strong>l</strong> <strong>Uso</strong> <strong>de</strong> <strong>Bioetanol</strong> y <strong>Biodies<strong>el</strong></strong> <strong>para</strong> <strong>el</strong> Transporte en México (SENER-BID-GTZ)<br />
Task 6: Potentials in r<strong>el</strong>ation to sustainability criteria<br />
Table 9.3 Stillage from cassava, Brazil (Trinda<strong>de</strong> 1985)<br />
Unit Average<br />
Stillage characterization<br />
values<br />
pH --- 5.0<br />
(BOD 5 ) mg/l 18900.<br />
Total Solids (TS) mg/l 24000.<br />
Nitrogen, as N mg/l 400.<br />
Phosphorous, as P2O5 mg/l 200.<br />
Potassium, as K2O mg/l 1100.<br />
Calcium, as CaO mg/l 100.<br />
Magnesium, as MgO mg/l 100.<br />
9.2 Stillage treatment and disposition<br />
Although ferti-irrigation is the most used process for stillage utilization (the only used in<br />
Brazil, today) for sugar cane based ethanol, its use needs careful evaluation of many local<br />
conditions (type of soil, un<strong>de</strong>rground water <strong>de</strong>pth and stillage characteristics, among other,<br />
<strong>de</strong>termine the permitted rates of application). In the ethanol from corn production the residues<br />
are concentrated to produce DDGS (animal feed; in the dry milling process).<br />
Different processes have been <strong>de</strong>v<strong>el</strong>oped and implemented, either to lower ferti-irrigation<br />
costs or as an alternative to it, when special conditions prevail. Among them, we note:<br />
• Optimizing fermentation/distillation to reduce the volume of stillage (thus reducing<br />
ferti-irrigation costs): it means improving fermentation conditions and control to<br />
achieve a final ethanol concentration in wine in the range of 9.5 to 11.5 o GL; and<br />
substituting re-boilers for the direct contact heaters, in the distillation /rectifying<br />
columns. The re-cycling of stillage in the fermentation process, after some <strong>de</strong>gree of<br />
juice concentration, has been tried in Brazil; it was abandoned (for both, continuous<br />
and fed-batch systems) due mainly to yeast inhibition and difficulties in centrifugation.<br />
The Biostil process was one of the variants tested.<br />
• Stillage concentration with membranes: reverse osmosis has been tested with success,<br />
leading to a concentration of salts and most of the organic matter. The very small flow<br />
rates turn the process economically not acceptable; but it holds some promise for the<br />
future.<br />
• Thermal concentration (multiple effect evaporators, using low pressure steam), as<br />
practiced in the corn to ethanol industry, has been <strong>de</strong>v<strong>el</strong>oped and systems (like<br />
Vog<strong>el</strong>busch and Speichim) are available. Difficulties arise from salt <strong>de</strong>position in the<br />
heat exchangers, mainly for high Ca and Mg ions in the stillage and H 2 SO 4 utilization<br />
in the fermentation process. Stillage from juice, with good fermentation control, can<br />
avoid those problems. Concentration was aimed at reducing ferti-irrigation costs, or<br />
even exten<strong>de</strong>d to produce material to be burned in the boilers.<br />
62
<strong>Potenciales</strong> y <strong>Viabilidad</strong> <strong><strong>de</strong>l</strong> <strong>Uso</strong> <strong>de</strong> <strong>Bioetanol</strong> y <strong>Biodies<strong>el</strong></strong> <strong>para</strong> <strong>el</strong> Transporte en México (SENER-BID-GTZ)<br />
Task 6: Potentials in r<strong>el</strong>ation to sustainability criteria<br />
• Biodigestion was tested (to reduce the organic matter) and implemented in some<br />
annexed distilleries (ethanol from sugar cane, Brazil). It is not used in Brazil today,<br />
although some advantages are, besi<strong>de</strong>s <strong>de</strong>creasing the organic matter, increasing the<br />
pH and <strong>el</strong>iminating the sulphates. Main problems were the inhibition (when using<br />
stillage from molasses, or mixed) and the low reaction rates, leading to expensive<br />
systems.<br />
New technologies are always being proposed to treat stillage; in many cases they are<br />
combinations of the above, aiming at reducing ferti-irrigation costs. The strong advantages of<br />
ferti-irrigation in improving cane productivity lead to advances in this area, extending the use<br />
and avoiding the problems (salinization, un<strong>de</strong>rground water contamination, etc) with proper<br />
application rates and area restrictions.<br />
The main technologies commercially available (ferti-irrigation, thermal concentration,<br />
biodigestion) are presented b<strong>el</strong>ow, in the context of possible applications for ethanol<br />
production in Mexico.<br />
9.2.1 The ferti-irrigation process (Souza 2005)<br />
One important feature of sugar-cane crops in Brazil is the full recycling of wastes to the fi<strong>el</strong>d.<br />
The rise in ethanol production required the vinasse to be taken care of, and the best solution<br />
found was to recycle it for the crop. The benefits provi<strong>de</strong>d by this ferti-irrigation have become<br />
evi<strong>de</strong>nt; an optimization of potassium utilization was sought and yi<strong>el</strong><strong>de</strong>d very good results.<br />
The infrastructure that was created has enabled the <strong>de</strong>v<strong>el</strong>opment into using also the water from<br />
the industrial process and the ashes from boilers.<br />
Stillage recycling reduces the need for external mineral fertilizers, and provi<strong>de</strong>s an a<strong>de</strong>quate<br />
way for water quality protection. The evolution of the legislation has been very important and<br />
appropriate in the leading producing areas, as São Paulo, to prevent adverse effects on soil<br />
salinity or un<strong>de</strong>rground water contamination. Today all distilleries in Brazil use fertiirrigation<br />
with stillage (and no biodigestion or stillage concentration is used in any of them).<br />
However, as indicated by the legislation, each area (within a sugar cane plantation) has to be<br />
evaluated for the stillage application rates and this <strong>de</strong>pends on some other factors. This<br />
apparent complication is by far compensated by the advantages in productivity gains.<br />
The rate at which the areas are covered by ferti-irrigation at the mills is highly variable,<br />
<strong>de</strong>pending on the topography and distribution of the mill’s land. Some mills apply stillage to<br />
more than 70 percent of their crop areas, whereas others do it at much lower fractions. The<br />
mills’ ferti-irrigation areas have increased from crop to crop seeking a greater agricultural<br />
productivity and <strong>de</strong>creased use of chemical fertilizers. This has been leading to smaller<br />
application rates (m 3 /ha); environmental legislation today also leads to this trend.<br />
The systems currently used for ferti-irrigation are standard tanker trucks and application by<br />
sprinkling. For sprinkling, the direct-mounting system (pump and engine set and cannon<br />
sprinkler on a whe<strong>el</strong>base) and the s<strong>el</strong>f-prop<strong>el</strong>led, winding-re<strong>el</strong> system (currently the most<br />
used; fed by chann<strong>el</strong>s or trucks) are used. The later uses less manual labor than direct<br />
63
<strong>Potenciales</strong> y <strong>Viabilidad</strong> <strong><strong>de</strong>l</strong> <strong>Uso</strong> <strong>de</strong> <strong>Bioetanol</strong> y <strong>Biodies<strong>el</strong></strong> <strong>para</strong> <strong>el</strong> Transporte en México (SENER-BID-GTZ)<br />
Task 6: Potentials in r<strong>el</strong>ation to sustainability criteria<br />
mounting, but is fu<strong>el</strong> consumption is higher; the current use in São Paulo is shown in (Table<br />
9.4).<br />
Table 9.4 Stillage application systems in the State of São Paulo (Penatti 1999)<br />
Application Method Share (%)<br />
Standard Tanker Truck 6<br />
Sprinkling (chann<strong>el</strong> + direct mounting) 10<br />
Sprinkling (chann<strong>el</strong> + re<strong>el</strong>) 53<br />
Sprinkling (truck + re<strong>el</strong>) 31<br />
Stillage application procedures have inclu<strong>de</strong>d studies of Center Pivot (whe<strong>el</strong>ed type) and<br />
subsurface dripping systems; the first is still too expensive (in Brazil) and the drip irrigation<br />
would have to be (in<strong>de</strong>pen<strong>de</strong>ntly, not for the fertilizer effect) feasible.<br />
9.2.1.1 Ferti-irrigation advantages and limitations<br />
In the conditions of sugar cane production in Brazil, the use of stillage on soil provi<strong>de</strong>s several<br />
benefits in terms of the physical, chemical and biological properties of the soil: rise in pH,<br />
increased Cation Exchange Capacity, availability of some nutrients, improved soil structure,<br />
increased water retention, and <strong>de</strong>v<strong>el</strong>opment of the soil’s micro flora and micro fauna. In<br />
addition to providing water and nutrients (mainly K and P), it also recovers the soil fertility, to<br />
some <strong>de</strong>pth. Many experiments <strong>de</strong>monstrate the increase in agricultural productivity (sugarcane<br />
t/ha), whether or not associated with the savings attained by buying smaller amounts of<br />
mineral fertilizers. Sulphuric acidity is un<strong>de</strong>sirable.<br />
Several works have shown the effects of stillage on the soil and environment over years of<br />
application; for example, increase in the potassium-content of a sandy dark red Latosol.<br />
Salinization evaluations of three soil types (Alluvial, 51% clay; Red Y<strong>el</strong>low Podzolic, 38%<br />
clay; and Hydromorphic, 5.5% clay) indicate that there was no saline in<strong>de</strong>x for doses lower<br />
than 400 m 3 /ha, and that applications should be ma<strong>de</strong> based on the salt contents and soil<br />
characteristics (Camargo et al. 1987). Heavy <strong>el</strong>ements in stillage are present at a very low<br />
lev<strong>el</strong>. The mineral macro- and micro-<strong>el</strong>ements present at higher concentrations in leached<br />
<strong>el</strong>ements would be K + , Ca 2+ 2-<br />
, SO 4 and Cl - , respectiv<strong>el</strong>y. Risk assessments of the metals<br />
present in the vinasse conducted over a period of five years conclu<strong>de</strong>d that the amounts of NO -<br />
3, NH + 4 and soluble phosphor where not significantly changed, and neither were the contents<br />
of soluble zinc, copper, iron and manganese; only (SO 2- 4) showed leaching of up to 80 cm.<br />
Many studies with variable stillage application rates over periods of up to 15 years led to a<br />
consensus that doses in excess of 400 m 3 /ha are harmful to sugar-cane (<strong>de</strong>crease in quality and<br />
productivity).<br />
In conclusion, we may say that today, respecting the characteristics of the soils to which it is<br />
applied, the location of water springs and the volumes <strong>de</strong>fined as suitable to each situation,<br />
64
<strong>Potenciales</strong> y <strong>Viabilidad</strong> <strong><strong>de</strong>l</strong> <strong>Uso</strong> <strong>de</strong> <strong>Bioetanol</strong> y <strong>Biodies<strong>el</strong></strong> <strong>para</strong> <strong>el</strong> Transporte en México (SENER-BID-GTZ)<br />
Task 6: Potentials in r<strong>el</strong>ation to sustainability criteria<br />
stillage does not have any negative effects. The results obtained from tests so far indicate that<br />
there are no damaging impacts on the soil at rates lower than 300 m 3 /ha, while higher doses<br />
may damage the sugar-cane or, in specific cases (sandy or shallow soils), contaminate<br />
un<strong>de</strong>rground waters.<br />
The experience over the last 30 years in Brazil may be summarized in the present legislation<br />
for the use of stillage in ferti-irrigation in the State of São Paulo. The application of similar<br />
regulation in Mexico would have to be prece<strong>de</strong>d by analyses of the local <strong>para</strong>meters (mainly<br />
soil, un<strong>de</strong>rground water <strong>de</strong>pth and stillage characteristics) but the legislation is inten<strong>de</strong>d for<br />
use in Brazil in areas with large differences. The Technical Standard (Technical Standard<br />
P4.231; Vinasse: Criteria and procedures for application in agricultural soils, 2005; Secretaria<br />
do Meio Ambiente, S Paulo, 2005) establish the procedures for a safe way to apply stillage by<br />
specifying permitted places, application rates, protection of master chann<strong>el</strong>s and storage, etc.,<br />
and consi<strong>de</strong>red the results of years of studies seeking safe processes in respect of the various<br />
aspects of environmental protection. For its application, all the areas of a sugar cane<br />
production unit are mapped according to the type of soil, <strong>de</strong>pth of the water table, proximity to<br />
urban areas, rivers and springs, environmental protection areas, w<strong>el</strong>ls, roads; the <strong>de</strong>clivity, if<br />
higher than 15% (protection required). The tanks and chann<strong>el</strong>s must be impermeable and in<br />
some cases systems for monitoring the un<strong>de</strong>rground water quality must be inclu<strong>de</strong>d. A Plan<br />
for Stillage Application must be submitted yearly (for approval and control by the Secretaria<br />
do Meio Ambiente). Stillage allowed application rates (for each area) is <strong>de</strong>termined by soil<br />
<strong>de</strong>pth and fertility, the Potassium content in stillage and its average extraction by the culture,<br />
according to an established equation. Maximum K concentration in soil must never exceed 5%<br />
of the Cationic Exchange Capacity.<br />
Cane producers are very interested in improving the efficiency of stillage utilization, given the<br />
economic return. The technologies are expected to keep on evolving in this respect, involving<br />
the interaction between stillage and the waste trash left in the fi<strong>el</strong>d.<br />
Although r<strong>el</strong>ativ<strong>el</strong>y w<strong>el</strong>l established for sugar cane, the <strong>para</strong>meters for efficient stillage use in<br />
ferti-irrigation with sweet sorghum and cassava, for instance, are not known to the same<br />
extent.<br />
9.2.2 Stillage Concentration<br />
Stillage concentration has been consi<strong>de</strong>red in some different concepts. Two of them<br />
(evaporation and reverse osmosis) went through many studies. Evaporation became<br />
commercial and some installations in the early 1970’s (small distilleries) went to high<br />
concentrations to allow for burning the stillage as fu<strong>el</strong>. The advances in ferti-irrigation, as w<strong>el</strong>l<br />
as the process modifications to provi<strong>de</strong> some concentration and reduce ferti-irrigation costs,<br />
led to consi<strong>de</strong>r specific concentration systems (using low pressure steam, multiple effect<br />
evaporators) to further reduce transportation costs, but not reaching a “solid” residue. Reverse<br />
osmosis did not actually become commercial, for its high cost. None of those schemes is used<br />
in Brazil, today.<br />
65
<strong>Potenciales</strong> y <strong>Viabilidad</strong> <strong><strong>de</strong>l</strong> <strong>Uso</strong> <strong>de</strong> <strong>Bioetanol</strong> y <strong>Biodies<strong>el</strong></strong> <strong>para</strong> <strong>el</strong> Transporte en México (SENER-BID-GTZ)<br />
Task 6: Potentials in r<strong>el</strong>ation to sustainability criteria<br />
A mo<strong>de</strong>rn concentration system, as an example, aiming at concentrating stillage from<br />
exhausted molasses (to 35% dry mass) is <strong>de</strong>scribed in Annex 4 with the capacities,<br />
performance and costs.<br />
Systems for concentration at 60 Brix were commercial for distilleries in Thailand since the<br />
1980’s (example, Bangykhan II distillery, sugarcane molasses). Concentrated stillage was<br />
consi<strong>de</strong>red to be used as a fertilizer or fu<strong>el</strong> (with potassium recovery). As a fertilizer, it was<br />
difficult to compete with the advances in direct ferti-irrigation (it may find uses in specific<br />
situations due to topography, land distribution, severe local environmental restrictions). The<br />
use as fu<strong>el</strong> (at 60 Brix, with 2000 kcal/kg) requires boilers specifically <strong>de</strong>signed to avoid<br />
<strong>de</strong>position of material on the internal surfaces; potassium must be recovered. The energy<br />
requirements for concentrating the stillage could be partially supplied by the steam generated.<br />
The analyses of concentration / incinerator systems for stillage in the mid 1980’s indicated<br />
very high capital costs, and today they are not used in large scale ethanol production.<br />
A different situation is found in the corn to ethanol dry milling process; the effluent (actually,<br />
not a stillage but a valuable high protein feed component, the dried distillers grain, DDGS) is<br />
concentrated to be transported. The cost of drying DDGS using external (fossil) fu<strong>el</strong> is<br />
becoming too high; and also is the cost of fu<strong>el</strong> used to produce ethanol from corn. As the<br />
ethanol from corn production increases in the U.S., the value of DDGS as a feed component<br />
has been <strong>de</strong>pressed rapidly (DDGS price differential, US$/t over the corn price, has fallen<br />
from ~30. in 1994-95 to nearly zero in 2005-06) (LMC 2006). The option of burning the<br />
DDGS as fu<strong>el</strong> for the distillery is starting to look attractive.<br />
9.2.3 Anaerobic Digestion of Stillage<br />
9.2.3.1 Anaerobic digestion processes today<br />
Anaerobic digestion (AD) is used to treat the organic fraction of MSW and other organic<br />
wastes; the methane produced is sufficient to supply the process energy needs, and (as with<br />
MSW combustion) the surplus energy is a by product.<br />
The processes are w<strong>el</strong>l known: enzymes and microbes ferment the organic material yi<strong>el</strong>ding<br />
mostly methane and CO2 (also small amounts of H 2 S, NH 3 , and other). Natural bacteria<br />
operate from 10C to 100C, in moistures from 50% to 99%. In practical systems, the<br />
mesophilic range is 25 - 35C, while the termophilic range is 45 – 60C; rates of conversion<br />
with the higher temperatures are many times larger than in the lower temperature range. Gas<br />
composition <strong>de</strong>pends on the substrate; methane is 50-80% for aqueous streams, and 45-55%<br />
for landfills (Overend 2001). Effluent is recycled as compost / nutrients for agriculture.<br />
A key <strong>para</strong>meter to evaluate the system is the load that the digestor can handle for a given<br />
performance (% reduction of COD content), expressed as kg COD / (m 3 reactor volume).<br />
Feedstocks for AD are sewage sludge (large utilization), MSW (with source se<strong>para</strong>tion<br />
fractions) and landfill, industrial waste waters (including distilleries and breweries),<br />
agricultural wastes and animal by-products (categories 2 and 3) (IEA 2005).<br />
66
<strong>Potenciales</strong> y <strong>Viabilidad</strong> <strong><strong>de</strong>l</strong> <strong>Uso</strong> <strong>de</strong> <strong>Bioetanol</strong> y <strong>Biodies<strong>el</strong></strong> <strong>para</strong> <strong>el</strong> Transporte en México (SENER-BID-GTZ)<br />
Task 6: Potentials in r<strong>el</strong>ation to sustainability criteria<br />
The simplest processes are at farm scale production: millions have been used worldwi<strong>de</strong>,<br />
mostly in Asia, using animal wastes and some crop residues to supply energy for cooking and<br />
lighting, in the family scale. They evolved to larger units, in stirred tanks with retention times<br />
of 15-50 days. They use a rubber membrane top (with gas storage) or concrete fixed covers;<br />
more than 2000 operate in Europe, to supply CHP systems. Capacities have increased (330<br />
kW, Germany, 2002) (IEA 2005).<br />
A process for Dry Continuous Digestion of source se<strong>para</strong>ted waste with 20-40% dry matter,<br />
plug or mixed flow, using thermophilic bacteria (55-57C) shows retention times of 15-21<br />
days, and only 22% of the biogas energy is nee<strong>de</strong>d for plant operation.<br />
In the last years large scale centralized co-digestion plants were built in Denmark, for groups<br />
of farmers and industry. They use different feedstock (animal and agricultural wastes,<br />
industrial wastes, MSW). Their use improved the economics for waste water treatment (with<br />
over capacity) and increased the yi<strong>el</strong>ds for manure digesters. Solids concentration is 8 – 15%,<br />
and digester volumes are 4000 – 6000 m 3 .<br />
Biogas has “low productivity” (1 – 5 m 3 CH 4 / (m 3 reactor.day), leading to r<strong>el</strong>ativ<strong>el</strong>y large<br />
investment. Direct benefits are the energy and the sales of co-products; but the real value lies<br />
in the environmental benefits in waste treatment (less odor; protection of water resources;<br />
pathogen control, and lower GHG emissions).<br />
The existing installations of biodigestors worldwi<strong>de</strong>, with large concentration in applications<br />
for treatment of fermentation residues (starch, sucrose) show that after 1998 there is a strong<br />
shift from the UASB (Up flow Anaerobic Sludge Bed) technologies to the IC (Internal<br />
Circulation) systems (Paques 2005). The UASB reactors (5-15 kg COD / m3 reactor / day)<br />
were already an improvement over the “conventional” digestors (2-4 kg COD / m3 reactor /<br />
day).<br />
9.2.3.2 Anaerobic Digestion systems: experience with stillage<br />
Concerning stillage from ethanol production, bio-digestion has been employed in some places;<br />
in most cases it was done in r<strong>el</strong>ativ<strong>el</strong>y small ethanol plants, or in pilot plant experiments,<br />
<strong>de</strong>aling with the stillage from cane molasses <strong>de</strong>rived ethanol, or cassava (Trinda<strong>de</strong> 1985).<br />
Most of the information available, very useful for the process <strong>de</strong>v<strong>el</strong>opment, is difficult to use<br />
for estimating costs today. The <strong>de</strong>v<strong>el</strong>opment of larger plants, <strong>de</strong>aling with cane juice or juice<br />
and B molasses, led to mo<strong>de</strong>rn concepts (like the Dutch Paques VB, licensed to other<br />
manufacturers). Typically, they are IC (Internal Circulation) anaerobic reactors (vertical<br />
cylin<strong>de</strong>rs, up to 24 m high); capacity is a function of stillage characteristics and distillation<br />
process for each distillery. More than 200 reactors of this type have been installed worldwi<strong>de</strong><br />
(not only for stillage), and close to 60 are operating in Latin America (from one manufacturer)<br />
for different fermentations and other residues.<br />
In conditions where the effluent has to be discar<strong>de</strong>d to rivers, with strong environmental<br />
restrictions, a combined treatment (anaerobic and aerobic) may be recommen<strong>de</strong>d.<br />
67
<strong>Potenciales</strong> y <strong>Viabilidad</strong> <strong><strong>de</strong>l</strong> <strong>Uso</strong> <strong>de</strong> <strong>Bioetanol</strong> y <strong>Biodies<strong>el</strong></strong> <strong>para</strong> <strong>el</strong> Transporte en México (SENER-BID-GTZ)<br />
Task 6: Potentials in r<strong>el</strong>ation to sustainability criteria<br />
Note that the hypotheses used in this study consi<strong>de</strong>r that new plants in Mexico could use for<br />
fermentation either exhausted molasses, or cane juice or many combinations of B molasses<br />
and juice. In Brazil today exhausted molasses are very difficult to find. Manufacturers today<br />
indicate as a<strong>de</strong>quate values close to 30 000. mg/l (COD) and 16 500. mg/l (BOD), as w<strong>el</strong>l as<br />
low K, Ca and Sulphates concentrations, to allow for higher efficiencies and process stability.<br />
Consi<strong>de</strong>ring the most general situation, a distillery working with cane juice and some<br />
complementation with B molasses (that is to say, an extension of the existing sugar mills in<br />
Mexico) would reach those values (with ~15 l stillage / l ethanol); no indirect heating (reboilers)<br />
should be used in the distillation column.<br />
Plants with exhausted molasses and re-boilers are the most common type for the small<br />
distilleries in Mexico; stillage would probably present values of 70 000. to 100000 mg/l<br />
(COD) and 30 000 to 40 000. mg/l (BOD); also concentrations of 3 000. mg/l (K); 1 500. mg/l<br />
(Ca); and 2 000. mg/l (SO 4 ). The use of biodigestion with the current technology would<br />
require diluting the stillage to reach COD from 25 000. to 30 000. mg/l. It is important to note<br />
the difference in plant capacity and, consequently, cost: a bio-digestor to treat stillage for a<br />
distillery with capacity for 200 000. l/day ethanol, based on the fermentation of cane juice and<br />
some complementation with B molasses, would be suited for a much lower plant (only 80 000.<br />
l ethanol / day) based on exhausted molasses fermentation.<br />
A typical example of a mo<strong>de</strong>rn installation for stillage treatment (for discharge in rivers, with<br />
a<strong>de</strong>quate environmental restrictions) is shown in Annex 5.<br />
9.2.4 Aerobic fermentation of stillage<br />
Aerobic fermentation of the organic matter in stillage has been studied in many situations, to<br />
produce single c<strong>el</strong>l protein; as with many other substrates, this option was found to be<br />
economically unfeasible. For cassava, for instance, the problem was the need for costly<br />
nutrients (Silva. and Magalhães 1984). In general, the economics of large scale soybean<br />
production has been a strong obstacle to the implementation of this technology.<br />
9.3 Summary and Conclusions<br />
Stillage treatment is required to avoid the discharge of high organic matter loads in rivers.<br />
Although this initial concept is still true, the possibility of using stillage to profit with fertiirrigation<br />
has been <strong>de</strong>monstrated with the evolution in the last 25 years: the nutrients (mainly<br />
the Potassium) and water in stillage can pay for all application costs with increased<br />
productivity.<br />
Ferti-irrigation must be the first priority in stillage use, whenever possible; limitations may be<br />
imposed on the application rates due to soil characteristics, water lev<strong>el</strong> <strong>de</strong>pth, topography,<br />
variety and local environmental restrictions. However, for a large diversity of <strong>para</strong>meters (as<br />
found in Brazil) it remains the best option. It requires a better <strong>de</strong>sign and operation planning /<br />
control, but this will be nee<strong>de</strong>d for all the agricultural procedures in the near future,<br />
approaching a “precision agriculture” for the energy crops.<br />
68
<strong>Potenciales</strong> y <strong>Viabilidad</strong> <strong><strong>de</strong>l</strong> <strong>Uso</strong> <strong>de</strong> <strong>Bioetanol</strong> y <strong>Biodies<strong>el</strong></strong> <strong>para</strong> <strong>el</strong> Transporte en México (SENER-BID-GTZ)<br />
Task 6: Potentials in r<strong>el</strong>ation to sustainability criteria<br />
In Mexico, the proposed scenarios (from partial MTBE substitution to implementation of 10%<br />
of pure ethanol blending in all gasoline) may be achieved with two different solutions, in the<br />
case of using sugar cane. In the low ethanol use scenario (partial MTBE substitution) a large<br />
portion of the ethanol can be produced at the existing sugar mills, using a mix of cane juice<br />
and molasses (in fact, working without exhausting molasses). In the high ethanol use scenario,<br />
autonomous distilleries would be built; in this case it is possible that the organization of the<br />
agricultural production would be different than today (land ownership, larger production areas<br />
per supplier, new institutional r<strong>el</strong>ations between cane suppliers and mill owners). The<br />
implications for the possibility of ferti-irrigation with stillage are clear: even though in both<br />
cases the distillery suppliers would be close to the distillery (and technically the system could<br />
benefit from the ferti-irrigation) in the second case it could be much simpler to implement the<br />
system.<br />
Some lev<strong>el</strong> of concentration may be economically feasible, to improve the distribution in fertiirrigation<br />
in some areas. This is also <strong>de</strong>pen<strong>de</strong>nt on the substrate; concentration requires<br />
energy; sugar cane still has excess of cheap energy in bagasse, but cassava or grains have to<br />
use external energy, with increasing costs and increasing GHG emissions. In the near future,<br />
bagasse <strong>de</strong>mand for power (or fu<strong>el</strong>s) will turn its opportunity cost higher. This will have to be<br />
consi<strong>de</strong>red in every specific situation. The process <strong>de</strong>v<strong>el</strong>opments to reduce stillage volumes<br />
(without further concentration) must be implemented, when possible.<br />
Concentration to high values (~60 Brix) to allow for burning has to face the same problems<br />
mentioned above. It is a process intensive in capital and energy, being difficult to justify,<br />
except in very special situations.<br />
Anaerobic Digestion (with or without full treatment, including an aerobic complementation) is<br />
an option to be reserved for situations where full ferti-irrigation is not possible (it will be more<br />
expensive, with today’s technologies). However, it may be consi<strong>de</strong>red if situations as in<br />
Scenario 1 lead to significant production annexed to the sugar mill, and the ferti-irrigation<br />
involving too many landowners becomes (legally) difficult. It must be remembered that<br />
usually the anaerobic digestion alone is not sufficient to comply with the local requirements<br />
set by the environmental legislation; and an aerobic complementation may be mandatory.<br />
69
<strong>Potenciales</strong> y <strong>Viabilidad</strong> <strong><strong>de</strong>l</strong> <strong>Uso</strong> <strong>de</strong> <strong>Bioetanol</strong> y <strong>Biodies<strong>el</strong></strong> <strong>para</strong> <strong>el</strong> Transporte en México (SENER-BID-GTZ)<br />
Task 6: Potentials in r<strong>el</strong>ation to sustainability criteria<br />
10. Production sustainability: the supply of a<strong>de</strong>quate biomass<br />
(genetic) material and production technology<br />
10.1 The agricultural production base: varieties<br />
The internal sustainability of an agricultural production system requires the ability to respond<br />
to pests and diseases of the plant and to periodical climate changes, among other things; these<br />
interferences must not harm the production system so seriously as to make it unfeasible. The<br />
problems due to periodical climate changes (other than those occurring because of global<br />
warming, for which we have no control today) in Mexico may happen usually with variations<br />
in rain fall (and extremes may be, apparently, very much <strong>de</strong>pen<strong>de</strong>nt in the global warming in<br />
the near future).<br />
However, the ability to respond to diseases and pests must be strengthened, especially if the<br />
<strong>de</strong>cision is taken to increase substantially production areas. Today it is very difficult (yet<br />
<strong>de</strong>sirable) to maintain a strict, efficient phytosanitary barrier system in most countries; the<br />
solution is (in addition to quarantines and barriers) an efficient disease and pest-resistant<br />
variety s<strong>el</strong>ection and <strong>de</strong>v<strong>el</strong>opment system and a proper use of a large number of varieties<br />
(Burnquist and Lan<strong><strong>de</strong>l</strong>l 2005). For sugar cane, for example, in Brazil the recommendation<br />
today is that no variety should be used in more than 15% of each mill area ((see Annex 6).<br />
Beyond the protection against diseases and pests, a continuous supply of new varieties may be<br />
essential to keep productivity (and increase it) as new areas and cultivation practices are<br />
introduced.<br />
The needs are very different among the biomass feedstocks s<strong>el</strong>ected in this study; the most<br />
important grain production is based on large scale multi-national genetic improvement<br />
facilities (corn, wheat) with agronomic testing stations worldwi<strong>de</strong>. Some crops will need more<br />
local testing and s<strong>el</strong>ection (sugar beets, sorghum). Other, like sugar cane and cassava,<br />
although they could use exogenous varieties, would no doubt benefit much more from local<br />
s<strong>el</strong>ection programs. Today the sugar cane s<strong>el</strong>ection programs in many countries are very w<strong>el</strong>l<br />
connected with the use of information (spread of diseases, quarantines, exchange of cane<br />
varieties for the breeding programs; and even information on local <strong>de</strong>v<strong>el</strong>opments in transgenic<br />
sugar cane varieties, still not commercial). Cassava and possibly sorghum will need stronger<br />
local <strong>de</strong>v<strong>el</strong>opment; but no doubt the situation for sugar cane (since it is such an important<br />
culture already, in Mexico) <strong>de</strong>serves attention.<br />
10.1.1 Sugar cane varieties <strong>de</strong>v<strong>el</strong>opment in Mexico<br />
Mexico had an important sugar cane variety <strong>de</strong>v<strong>el</strong>opment program, and it allowed the<br />
production today to use Mexican varieties in ~ 50% of its area (mostly Mex 69-290 and Mex<br />
68-P23). One foreign variety (CP 72-2086) is used in 17% of the area (Lazcano 2006b). Sugar<br />
cane productivity has increased even recently (11.23%, from 1996 to 2005) as w<strong>el</strong>l as sucrose<br />
in cane (0.21%, same period). However there has been a strong reduction in the activities<br />
r<strong>el</strong>ated to cane variety <strong>de</strong>v<strong>el</strong>opment; the Centro Hibridacion Capachula was substantially<br />
reduced, and the IMPA was closed in 1992 (information by I. Lazcano Martinez, 2006). The<br />
effects could be f<strong>el</strong>t in the next years, especially if the production expands to new areas.<br />
70
<strong>Potenciales</strong> y <strong>Viabilidad</strong> <strong><strong>de</strong>l</strong> <strong>Uso</strong> <strong>de</strong> <strong>Bioetanol</strong> y <strong>Biodies<strong>el</strong></strong> <strong>para</strong> <strong>el</strong> Transporte en México (SENER-BID-GTZ)<br />
Task 6: Potentials in r<strong>el</strong>ation to sustainability criteria<br />
Although the Ley <strong>de</strong> Desarrollo Sustentable <strong>de</strong> la Caña <strong>de</strong> Azúcar (22 August 2005)<br />
establishes in Título V, Capítulo II that the Centro <strong>de</strong> Investigación Científica y Tecnológica<br />
<strong>de</strong> la Caña <strong>de</strong> Azúcar (CICTCAÑA) shall promote leading technologies for the agro-energy<br />
use, no specific mention is ma<strong>de</strong> to the strengthening of variety s<strong>el</strong>ection programs. Actually,<br />
the third Chapter (De la Investigación y Capacitación; Article 23) is <strong>de</strong>tailed in production and<br />
conversion systems, but not in variety supply.<br />
An a<strong>de</strong>quate supply of sugar cane varieties is essential to provi<strong>de</strong> material for the needs of any<br />
program involving sugar cane expansion areas; future cost reduction (nee<strong>de</strong>d to bring the<br />
ethanol to a competitive, sustainable situation) will come from better agro-industrial<br />
management, using better cane production and conversion technologies; and the last will<br />
always r<strong>el</strong>y on potentially better cane varieties.<br />
10.2 Technology availability for agronomic production and<br />
industrial conversion<br />
The technology infrastructure nee<strong>de</strong>d to support agro-industrial implementation / expansion of<br />
any of the analyzed biomass to energy production systems inclu<strong>de</strong>s technology <strong>de</strong>v<strong>el</strong>opment<br />
(both in agronomic production and in industrial conversion, whenever possible in joint<br />
programs) and technology transfer (government extension services, consultants, and<br />
engineering companies). It is important to remember that this is fundamental for the program<br />
sustainability.<br />
Figure 10.1<br />
Evolution of ethanol price paid to producers compared to gasoline prices<br />
(taxes exclu<strong>de</strong>d) at the same time (Gol<strong>de</strong>mberg et al. 2004)<br />
71
<strong>Potenciales</strong> y <strong>Viabilidad</strong> <strong><strong>de</strong>l</strong> <strong>Uso</strong> <strong>de</strong> <strong>Bioetanol</strong> y <strong>Biodies<strong>el</strong></strong> <strong>para</strong> <strong>el</strong> Transporte en México (SENER-BID-GTZ)<br />
Task 6: Potentials in r<strong>el</strong>ation to sustainability criteria<br />
A good illustration is the cost reduction obtained in the Brazilian ethanol program, as seen in<br />
(Figure 10.1) (ethanol price paid to producers against cumulative production, compared to<br />
gasoline prices at the same time); these gains in competitiveness resulted from better<br />
management practices, but mainly from technology improvements (Macedo 2004). They were<br />
essential to achieve the competitiveness of ethanol production today, against gasoline at<br />
international costs, even without consi<strong>de</strong>ration for externalities (environmental, social, and<br />
economic).<br />
Mexico had a tradition in agronomic research for sugar cane, coffee, and for the arid regions<br />
(Lazcano 2006-a); and also the aca<strong>de</strong>mic programs to support agricultural education. However<br />
most of these programs are much smaller today, and the agricultural extension services are<br />
almost inexistent. The extension services, which were led by Government offices, were<br />
abandoned, leaving the technology transfer to external groups (equipment manufacturers,<br />
s<strong>el</strong>lers of agro-chemicals and irrigation systems, other). There are still isolated efforts (without<br />
sufficient coordination) supported mostly by some producers and sugar mill owners (in the<br />
case of sugar cane). Again, it is important to note that the Ley <strong>de</strong> Desarrollo Sustentable <strong>de</strong> la<br />
Caña <strong>de</strong> Azúcar (August 2005) inclu<strong>de</strong>s the “establishment of research and extension, to<br />
support the people and organizations <strong>de</strong>dicated to the activities…”<br />
The same concepts apply to the industrial research, aiming at the conversion processes in the<br />
industrial units. Some areas in universities (UNAM, Universidad Veracruzana, other) have<br />
been involved in <strong>de</strong>v<strong>el</strong>opments in this area for many years. As seen on the Report on Task 5,<br />
biomass to energy programs usually need at least a good perspective for improvement, given<br />
in part by the technology <strong>de</strong>v<strong>el</strong>opment and implementation, to be consi<strong>de</strong>red “viable” in a<br />
context sometimes hostile, where their positive externalities are not taken into account.<br />
10.3 Summary and Conclusions<br />
The internal sustainability of an agricultural production system requires the ability to respond<br />
to pests and diseases of the plant and to periodical climate changes; this can only be<br />
accomplished with the use of an efficient disease and pest-resistant variety supply. Important<br />
grain crops use large scale multi-national genetic improvement facilities (corn, wheat); sugar<br />
beets and sorghum will need more local testing and s<strong>el</strong>ection; sugar cane and cassava would<br />
benefit much more from local s<strong>el</strong>ection programs. Mexico has reduced its important sugar<br />
cane variety <strong>de</strong>v<strong>el</strong>opment program in the last years; since it is essential to provi<strong>de</strong> material<br />
also for the needs of any program involving sugar cane expansion areas, this position should<br />
be re-consi<strong>de</strong>red.<br />
It is also important to provi<strong>de</strong> a<strong>de</strong>quat<strong>el</strong>y the agricultural extension services, not r<strong>el</strong>ying<br />
entir<strong>el</strong>y in equipment manufacturers and s<strong>el</strong>lers of agro-chemicals and irrigation systems, with<br />
some coordination and strengthening the efforts of some producers and industrials. This has<br />
been contemplated in the Ley <strong>de</strong> Desarrollo Sustentable <strong>de</strong> la Caña <strong>de</strong> Azúcar (August 2005).<br />
As seen on the Report on Task 5, biomass to energy programs usually need at least a good<br />
perspective for cost reduction, given in part by the technology <strong>de</strong>v<strong>el</strong>opment and<br />
implementation, to be consi<strong>de</strong>red “viable” in a context sometimes hostile, where their positive<br />
externalities are not taken into account.<br />
72
<strong>Potenciales</strong> y <strong>Viabilidad</strong> <strong><strong>de</strong>l</strong> <strong>Uso</strong> <strong>de</strong> <strong>Bioetanol</strong> y <strong>Biodies<strong>el</strong></strong> <strong>para</strong> <strong>el</strong> Transporte en México (SENER-BID-GTZ)<br />
Task 6: Potentials in r<strong>el</strong>ation to sustainability criteria<br />
11. Environment: Impacts of Fertilizers and Agro-chemicals;<br />
soil erosion<br />
11.1 Introduction: the main problems<br />
Looking at the environmental impacts of ethanol production from biomass materials, the<br />
r<strong>el</strong>evant issues at the agricultural lev<strong>el</strong> are w<strong>el</strong>l known for most of the raw materials<br />
consi<strong>de</strong>red. Corn, sugar cane, wheat, sorghum, cassava and sugar beets are cultivated in many<br />
regions of the world, in millions of hectares, in different conditions (though generally, except<br />
in cases where large subsidies lead to distortions, in the a<strong>de</strong>quate range of edafo-climatic<br />
conditions).<br />
One of the most significant <strong>para</strong>meters for evaluating many of the environmental impacts is<br />
the use (or not) of irrigation; besi<strong>de</strong>s the impact in the water supply, in its<strong>el</strong>f, irrigation in<br />
some cases may lead to soil erosion, salinization; and to un<strong>de</strong>rground and surface water<br />
contamination. Nutrient rich runoff from sugar cane fi<strong>el</strong>ds in Florida is larg<strong>el</strong>y responsible for<br />
the <strong>de</strong>cline of the Evergla<strong>de</strong>s (WWF 2004). In some regions of the world the use of fresh<br />
water for irrigation (world average: 70% of the fresh water) may reach 90%; even at lower<br />
values it may present local problems for water supply.<br />
As with all other land clearance for agricultural expansion, efforts to increase biofu<strong>el</strong>s<br />
production will either imply in using anthropized, to some extent <strong>de</strong>gra<strong>de</strong>d lands (in some<br />
countries, land used for long times for cattle raising, extensive pastur<strong>el</strong>ands) or in habitat loss.<br />
All agriculture has been <strong>de</strong>v<strong>el</strong>oped in this way. Today, half of the world’s wetlands have been<br />
drained and converted for agriculture (70 – 90 % in the U.S.A. and Europe) (WWF 2004).<br />
When producing ethanol, the a<strong>de</strong>quate use of stillage in ferti-irrigation can be of great value<br />
not only to reduce the use of fertilizers (mostly potassium) but also to supply a small amount<br />
of water in s<strong>el</strong>ected areas and periods of crop growth. It is important for this study to consi<strong>de</strong>r<br />
the range of variation of the impacts of these crops in the environment, worldwi<strong>de</strong> (here, soil<br />
erosion and contamination; water contamination; effects of the use of herbici<strong>de</strong>s, pestici<strong>de</strong>s<br />
and fertilizers). This might h<strong>el</strong>p establishing suitable objectives to control the environmental<br />
impacts, consi<strong>de</strong>ring the local conditions. Stillage use has been analyzed in Chapter 9.<br />
11.2 Characteristics of the crops consi<strong>de</strong>red for bio-ethanol in<br />
Mexico<br />
Some of the r<strong>el</strong>evant characteristics (r<strong>el</strong>ated to environmental impacts) of the crops un<strong>de</strong>r<br />
consi<strong>de</strong>ration are presented b<strong>el</strong>ow, in the world context; their presence in Mexico is analyzed<br />
in the report of Task 4, in this Project (Lazcano 2006b).<br />
Sugar cane is planted in 104 countries, 20 M ha (20002) worldwi<strong>de</strong>; production was 1260. M<br />
t in that year (FAO 2002). Pest and disease problems have been much reduced with breeding<br />
programs (leading to lower agrochemicals utilization); also biological controls are increasingly<br />
important (Clay 2004).<br />
73
<strong>Potenciales</strong> y <strong>Viabilidad</strong> <strong><strong>de</strong>l</strong> <strong>Uso</strong> <strong>de</strong> <strong>Bioetanol</strong> y <strong>Biodies<strong>el</strong></strong> <strong>para</strong> <strong>el</strong> Transporte en México (SENER-BID-GTZ)<br />
Task 6: Potentials in r<strong>el</strong>ation to sustainability criteria<br />
Soil losses due to water erosion present a wi<strong>de</strong> range of values <strong>de</strong>pending (as expected) not<br />
only on the use of irrigation, but also in the agricultural practices. Values from 15 to 500 t soil<br />
/ ha.year have been reported (WWF 2004), although it is known that in some very large areas<br />
(as in Brazil, with more than 6 M ha; no irrigation) erosion has been kept at average 12.4 t /<br />
ha.year. One problem aggravating water produced soil erosion in sugarcane plantations is the<br />
use of areas with high slopes (higher than 15 o <strong>de</strong>clivity). Recommen<strong>de</strong>d practices are the use<br />
of a<strong>de</strong>quate terracing (with re-vegetation of rain water overflow chann<strong>el</strong>s) and minimum<br />
tillage (avoiding <strong>de</strong>ep ploughing). Also, the maintenance of the riparian vegetation, to act as a<br />
buffer between the agricultural activity and the waterways, is an important practice. Soil loss<br />
at harvest can be kept r<strong>el</strong>ativ<strong>el</strong>y small even with mechanical harvesting (~3%).<br />
Water use for industrial processing is due to the cane washing pre-processing (3 - 5% of the<br />
cane weight, in water) and the many uses at the industry. Cane washing is being rapidly<br />
abandoned (even when mechanical harvesting is not used) in most regions; it is possible that<br />
“dry cleaning” processes will be introduced in the next years (see Chapter 7.2).<br />
The use of agro-chemicals (fertilizers; herbici<strong>de</strong>s; pestici<strong>de</strong>s) in the sugar cane industry is w<strong>el</strong>l<br />
known, as w<strong>el</strong>l as their variation in different regions. Some interesting issues have been un<strong>de</strong>r<br />
discussion (like the possibilities for new technologies, based on genetically modified plants, to<br />
reduce pestici<strong>de</strong> utilization). I<strong>de</strong>ally, biological controls and, to the extent possible, “organic”<br />
agriculture techniques would be used. The recent analyses presented for Brazil (Macedo I.C.<br />
2005) indicate that pestici<strong>de</strong> consumption in sugar-cane crops is lower than in critic, corn,<br />
coffee and soybean crops; the use of insectici<strong>de</strong>s is r<strong>el</strong>ativ<strong>el</strong>y low (0.12 kg active ingredient<br />
/ha, 2003; against 0.18 for corn). Biological controls are used for the sugar-cane beetle (the<br />
most important pest) and the cigarrinha.<br />
Sugar-cane diseases are fought against through the s<strong>el</strong>ection of disease-resistant varieties in<br />
major genetic improvement programs (Arrigoni 2005).<br />
In Brazil, sugar-cane crops still use more herbici<strong>de</strong>s than coffee and corn crops (2.29 kg active<br />
ingredient / ha, against 1.41 for corn), less herbici<strong>de</strong>s than citric crops, and the same amounts<br />
as soybean crops (Ricci Jr 2005). They also use less fertilizers than cotton, coffee and orange,<br />
and is equivalent to soybean crops (0.46 t / ha); Australia uses 48% more. The full recycling of<br />
wastes to the fi<strong>el</strong>d (especially stillage) was essential to obtain good results, mainly with<br />
Potassium (Donz<strong>el</strong>li 2005a). Sugar-cane culture in Brazil presents a r<strong>el</strong>ativ<strong>el</strong>y small soil<br />
erosion loss (12.4 t / ha.year). This is improving as harvesting without burning expands,<br />
reducing losses to very low rates that are com<strong>para</strong>ble to those for direct planting in annual<br />
cultures (Donz<strong>el</strong>li 2005b).<br />
Sugar cane production in Mexico is w<strong>el</strong>l known, and the main characteristics (areas,<br />
productivities, use of irrigation) have been reported in (Lazcano 2006b). Nearly 40% of the<br />
production is in the Veracruz state (COAAZUCAR 2005), where also are reported the main<br />
expansion areas. Most of the environmental issues for sugar cane in Mexico are the same as in<br />
Brazil, where the legislation, including rules and controls from production to use and disposal<br />
of materials, covers all important aspects.<br />
There is no need to obtain an environmental license for planting sugar cane in expansion areas<br />
(new areas, pastur<strong>el</strong>and) in Mexico; there is need to obtain license to use water for irrigation.<br />
74
<strong>Potenciales</strong> y <strong>Viabilidad</strong> <strong><strong>de</strong>l</strong> <strong>Uso</strong> <strong>de</strong> <strong>Bioetanol</strong> y <strong>Biodies<strong>el</strong></strong> <strong>para</strong> <strong>el</strong> Transporte en México (SENER-BID-GTZ)<br />
Task 6: Potentials in r<strong>el</strong>ation to sustainability criteria<br />
The industrial processing plants have a set of environmental rules to obey, including on the<br />
disposal of stillage.<br />
Wheat is planted in 213. M ha, yi<strong>el</strong>ding 585. M t / year (2000); average (world) productivity<br />
was 2.74 t / ha, with 5.4 t/ha in the EU (FAO 2005). Wheat needs high quality, disease free<br />
seeds; and it has led agricultural mechanization (with the very large areas of monoculture in<br />
use). The r<strong>el</strong>ativ<strong>el</strong>y low productivity in many places leads to high energy use / t of product.<br />
The use of pestici<strong>de</strong>s has been 1 – 3 kg/ha; Nitrogen fertilizer is used in 85% of the winter<br />
crop and Potassium in 10%, in the U.S. (Clay 2004).<br />
Wheat is the second most irrigated crop in the world (perhaps because the concerns with “food<br />
safety” lead to the use of ina<strong>de</strong>quate areas); the intensive production leads to the known<br />
problems in some countries (soil erosion, salinization). Winter crops can have smaller soil<br />
losses (good soil cover) and use less fertilizer / ha.<br />
Mexico <strong>de</strong>v<strong>el</strong>oped dozens of wheat varieties.<br />
Corn (maize) was cultivated (2000) in 138.7 M ha, yi<strong>el</strong>ding 593 M t / year, (average<br />
productivity: 4.27 t / ha) (FAO 2002). It is produced in very different settings, worldwi<strong>de</strong>;<br />
with correspondingly different environmental impacts.<br />
Although most corn in the world is produced without irrigation, in the U.S. it is the second<br />
largest consumer of irrigation water. Corn also uses 50% of all the fertilizer in the U.S. The<br />
production of corn in the U.S. (42% of world’s production, in 2000) used fertilizers as follows:<br />
Nitrogen (98% of the crop); P (85%); and K (73%). It also used herbici<strong>de</strong>s (97% of the crop;<br />
200 kg active ingredient / ha); and insectici<strong>de</strong>s (30% of the crop; 3. kg / ha) (Clay 2004). In<br />
2000 the highly mechanized and subsidized corn production in the U.S. reached 8.6 t / ha.<br />
There have been efforts to reduce the use of inputs, with success. Also, the use of good<br />
practices to reduce erosion (conservation measures: terraces, crop rotation, reduced or no-till<br />
cultivation) has resulted in losses of 14 t / ha.year in 1992, compared to 19.5 (1982) and 37.<br />
(1930). The <strong>de</strong>v<strong>el</strong>opment of ethanol production from corn in the U.S. has brought to attention<br />
the issues r<strong>el</strong>ative to the need to reduce inputs to the corn production, both to achieve a<br />
“sustainable” energy ratio and to reduce greenhouse gas emissions due, for instance, to the<br />
Nitrogen fertilizers.<br />
Mexico has traditionally cultivated corn, in large or small areas. It is cultivated all over the<br />
country, in all climates (Lazcano 2006b). Production is ~20 M t / year, and importation is 6 –<br />
7 M t. Large irrigated areas can yi<strong>el</strong>d 10 – 12 t / ha (with r<strong>el</strong>ativ<strong>el</strong>y low profit); some<br />
subsistence cultures reach only 0.5 – 1 t / ha. The NAFTA implications for the Mexican corn<br />
production were clear: the small scale producers in Mexico (90% with areas smaller than 2 ha)<br />
could not compete with the conditions in the U.S. (including subsidies); in 2002 they had lost<br />
¼ of their market, and serious problems are foreseen when the limits to American exports are<br />
<strong>el</strong>iminated in 2008.<br />
Sorghum bicolor is cultivated in 42. M ha, with a global production of 58. M t (averaging<br />
1.38 t / ha); it is produced both for food or animal feed. India is the lea<strong>de</strong>r producer in area<br />
(25%, in 2000); but productivities vary consi<strong>de</strong>rably, and the U.S. has the largest production<br />
75
<strong>Potenciales</strong> y <strong>Viabilidad</strong> <strong><strong>de</strong>l</strong> <strong>Uso</strong> <strong>de</strong> <strong>Bioetanol</strong> y <strong>Biodies<strong>el</strong></strong> <strong>para</strong> <strong>el</strong> Transporte en México (SENER-BID-GTZ)<br />
Task 6: Potentials in r<strong>el</strong>ation to sustainability criteria<br />
(11.9 M t, with 3.6 t/ ha) (FAO 2002). The production in Mexico was 5.8 M t with 3.05 t / ha,<br />
in 2000 (Clay J. 2004); Mexico was one of the main importers of sorghum (grain) in 2000.<br />
When consi<strong>de</strong>ring ethanol production, most experiments worldwi<strong>de</strong> have been conducted with<br />
sweet sorghum. Usually the sorghum crop consists of the grain sorghum varieties, not the<br />
“sweet” sorghum; today, sorghum is bred in four distinct groups: grain (flour, beer); fiber<br />
(fiber board, paper, etc); multi-purpose (all uses); and sweet (sugars).<br />
The experimental <strong>de</strong>v<strong>el</strong>opments worldwi<strong>de</strong> show that sorghum can yi<strong>el</strong>d 10 t / ha, in “i<strong>de</strong>al”<br />
conditions (including plenty of water). However, the most important characteristic of the<br />
sorghum crop is its ability to resist drought, and low fertility lands; and this has been the cause<br />
of sorghum importance in many arid regions. Sweet sorghum uses one third less water to<br />
produce the same amount of above ground biomass as sugar cane (Woods 2001). However,<br />
production in Zimbabwe (sweet sorghum) led to half the volume of ethanol as compared to<br />
sugar cane in the same conditions, for the same area.<br />
Two types of grain sorghum production are found:<br />
• The intensive, commercialized production, with hybrid seeds, fertilizers,<br />
mechanization and water management; it corresponds to 15% of the area, and 40% of<br />
the world sorghum production; yi<strong>el</strong>ds are 3 – 5 t/ ha<br />
• The production for subsistence: rain fed, low fertilizer inputs, low mechanization;<br />
yi<strong>el</strong>ds are 0.5 – 1.0 t / ha.<br />
The environmental impacts of sorghum production <strong>de</strong>pend on the cultivation techniques. Its<br />
resistance to drought and poor soils led to expansion in “marginal” areas, with habitat<br />
conversion in fragile lands. Sorghum is very much chemically <strong>de</strong>pen<strong>de</strong>nt (herbici<strong>de</strong>s,<br />
pestici<strong>de</strong>s); and its high biomass production leads to fire hazards.<br />
Sorghum (for silage) may lead to very high erosion rates (even at 4 o <strong>de</strong>clivity); the problem is<br />
smaller with grain sorghum. Its <strong>de</strong>ep root system leads to soil <strong>de</strong>pletion after long utilization<br />
(Clay 2004). Consi<strong>de</strong>ring the use of combined production (sweet sorghum) with sugar cane:<br />
the long term effects on soil nutrients, water and soil biology are not known (Woods 2001).<br />
The production in Mexico (grain sorghum) grew fast after the introduction of the hybrids, in<br />
1950; in 1982 sorghum provi<strong>de</strong>d 74 % of the animal feed in Mexico, with a much higher net<br />
profit per hectare than corn (Clay 2004). Here also the implications of NAFTA influenced<br />
prices in Mexico, lowering the profits and leading farmers to other higher value, labor<br />
intensive agricultural products. For sweet sorghum the tests with varieties still have to be<br />
performed.<br />
Cassava was planted (2000) in 16.8 M ha, yi<strong>el</strong>ding 178.6 M t / year (average 10.6 t / ha) (FAO<br />
2002). It has been a crop for small farmers, r<strong>el</strong>ated to food security, with many uses. In 1993,<br />
58% were used for food; but in Brazil already 48% were used for animal feed.<br />
It is more tolerant than grains to low soil fertility, drought, pests and diseases. With good soils<br />
and water, productivities of 30 t / ha are reached. Cultivation usually inclu<strong>de</strong>s intercropping.<br />
Small farmers use low fertilizer or pestici<strong>de</strong>s lev<strong>el</strong>s. Only Thailand and Brazil had cassava<br />
76
<strong>Potenciales</strong> y <strong>Viabilidad</strong> <strong><strong>de</strong>l</strong> <strong>Uso</strong> <strong>de</strong> <strong>Bioetanol</strong> y <strong>Biodies<strong>el</strong></strong> <strong>para</strong> <strong>el</strong> Transporte en México (SENER-BID-GTZ)<br />
Task 6: Potentials in r<strong>el</strong>ation to sustainability criteria<br />
cultivated in extensive areas, as a single crop (for ethanol and animal feed), although Nigéria<br />
is the world’s largest producer. Cassava is a very labor intensive culture, and presents high<br />
transportation costs.<br />
Environmental problems (besi<strong>de</strong>s eventual habitat conversion) are found with soil erosion,<br />
because the plant does not cover the soil a<strong>de</strong>quat<strong>el</strong>y; the problem may be aggravated by the<br />
fact that the soils used for cassava are poor.<br />
Cassava was planted experimentally in Mexico (1300. ha; 2004) mostly in Tabasco (Lazcano<br />
2006b).<br />
Sugar beets are cultivated in many temperate areas in the world. The cultivated area in 2000<br />
was 6.0 M ha (FAO 2002); it had been <strong>de</strong>clining, having reached 8.6 M ha in 1990. The main<br />
reason is the gradual <strong>el</strong>imination of subsidies to the European farmers. Global sugar yi<strong>el</strong>ds<br />
(agronomic) in 2003 were 7.5 t sugar / ha for sugar cane and 6.2 t sugar / ha for sugar beets<br />
(LMC 2004). The five year average yi<strong>el</strong>ds (2000-2004) for the leading producers in Europe<br />
were 61.8 t beets (roots) / ha (France); 65.2 (B<strong>el</strong>gium); 57.3 (Germany) (F O Lichts 2005).<br />
Commercial production in some places (Russia, Finland) yi<strong>el</strong><strong>de</strong>d less than 37 t / ha. European<br />
averages are 57.4 t / ha (FAO 2005).<br />
Sugar beets are vulnerable to wind erosion, besi<strong>de</strong>s water erosion (in places where the fi<strong>el</strong>ds<br />
are left bare in winter months). Estimates of wind erosion in the U.S. are 13 – 49 t soil /<br />
acre.year. Today 20% of the beets production is irrigated; in regions like the Spanish<br />
Andalusia the beets production contributes heavily to the lower water lev<strong>el</strong>s of the rivers<br />
(WWF 2004).<br />
The sugar beets harvesting procedures lead to 10 - 30% loss of soil; this very high value adds<br />
to the problems at the beets pre-processing washing, at the industry, where 10 – 30% of the<br />
beets weight (in water) is used.<br />
Herbici<strong>de</strong> utilization in sugar beets production is among the highest for all crops (Clay 2004).<br />
Some data from the U.K. indicates 1.15 kg / ha of herbici<strong>de</strong>s/insectici<strong>de</strong>s; 141 kg of K 2 O; 56<br />
kg Phosphate; and 147. kg N (Thompson and Campb<strong>el</strong>l 2005).<br />
In Mexico sugar beets have been cultivated in the Región <strong>de</strong> Mar <strong>de</strong> Cortés, only for<br />
<strong>de</strong>monstration. Experiments were successful (Lazcano 2006b) but they have not been<br />
continued. The tropical beets (for feed) are cultivated (small areas) in dairy producing areas.<br />
11.3 Summary and Conclusions<br />
The r<strong>el</strong>evant issues r<strong>el</strong>ating environment protection to the feedstock production are w<strong>el</strong>l<br />
known for of the raw materials consi<strong>de</strong>red. An important <strong>para</strong>meter is the use (or not) of<br />
irrigation; it impacts the water supply, and may lead to soil erosion, salinization, and to<br />
un<strong>de</strong>rground and surface water contamination. Agricultural expansion will imply in using<br />
anthropized, to some extent <strong>de</strong>gra<strong>de</strong>d lands; or in culture substitution or in habitat loss.<br />
77
<strong>Potenciales</strong> y <strong>Viabilidad</strong> <strong><strong>de</strong>l</strong> <strong>Uso</strong> <strong>de</strong> <strong>Bioetanol</strong> y <strong>Biodies<strong>el</strong></strong> <strong>para</strong> <strong>el</strong> Transporte en México (SENER-BID-GTZ)<br />
Task 6: Potentials in r<strong>el</strong>ation to sustainability criteria<br />
For ethanol production the a<strong>de</strong>quate use of stillage in ferti-irrigation can reduce fertilizers<br />
(mostly potassium) and supply a small amount of water in s<strong>el</strong>ected areas and periods of crop<br />
growth, turning it into a valuable by product.<br />
The knowledge of the environmental impacts of these crops worldwi<strong>de</strong> (soil erosion with<br />
water and wind; use of agro-chemicals: fertilizers, pestici<strong>de</strong>s, herbici<strong>de</strong>s; water utilization and<br />
contamination) and the large experience in Mexico with some of them h<strong>el</strong>p establishing limits,<br />
consi<strong>de</strong>ring the local conditions. A summary for each crop is presented, emphasizing soil loss,<br />
agrochemicals use and trends in mitigation. Stillage disposition and use is reviewed in Chapter<br />
9.<br />
78
<strong>Potenciales</strong> y <strong>Viabilidad</strong> <strong><strong>de</strong>l</strong> <strong>Uso</strong> <strong>de</strong> <strong>Bioetanol</strong> y <strong>Biodies<strong>el</strong></strong> <strong>para</strong> <strong>el</strong> Transporte en México (SENER-BID-GTZ)<br />
Task 6: Potentials in r<strong>el</strong>ation to sustainability criteria<br />
12. Economic and social impacts<br />
12.1 Introduction<br />
The search for external sustainability <strong>de</strong>termines that agricultural production should not<br />
impose any adverse economic impacts on the external environment; the externalization of<br />
costs to be paid by other sectors of society is an evi<strong>de</strong>nce of unsustainable production.<br />
However, since very high subsidies (in many different ways) are currently in use all over the<br />
world for energy and agricultural products, one must be careful when evaluating the situation<br />
of bio-ethanol; it is necessary to compute all the externalities associated with the fossil energy<br />
in use. This subject has been treated extensiv<strong>el</strong>y in the last years, and it will not be <strong>de</strong>tailed<br />
here. Some of the (not inclu<strong>de</strong>d in cost calculations) externalities consi<strong>de</strong>red by the countries<br />
already implementing ethanol blends in gasoline (irrespectiv<strong>el</strong>y of having or not ethanol cost<br />
lower than gasoline production cost) are:<br />
Energy security today (with a growing cost associated to it); the <strong>de</strong>pletion of oil reserves<br />
Environmental protection (local and global)<br />
Improving the balance of payments<br />
Job creation in agriculture (and industry)<br />
Rural <strong>de</strong>v<strong>el</strong>opment; reversion of unsustainable urbanization<br />
In the next <strong>para</strong>graphs we will summarize the investments and costs nee<strong>de</strong>d today for bioethanol<br />
(as <strong>de</strong>tailed in the report on Task 5), commenting on some future perspectives; outline<br />
the impacts on the balance of payments, and on job creation.<br />
12.2 BioEthanol costs and nee<strong>de</strong>d investments (from Task 5)<br />
The report on Activity 5, in this Project (Nogueira 2006) shows that the cost of gasoline in<br />
Mexico went from US$ 0.33/l in 2004 to US$ 0.52 / l in the first months of 2006; and the 2005<br />
lev<strong>el</strong> (~US$ 0.45 / l) is a good reference for this cost, looking at the expected future (2030)<br />
cost of oil. The cost of imported MTBE, in 2005-2006, is US$ 0.55 – 0.47 / l. With the<br />
equivalence of 1 liter ethanol to 1 liter gasoline (in blends up to 10%, as consi<strong>de</strong>red here), a<br />
reference “value” (parity cost) for ethanol when substituting for gasoline and MTBE was<br />
taken at ~US$ 0.45 / l.<br />
The economic analysis of production / utilization of ethanol in Mexico, within the three<br />
Scenarios proposed and consi<strong>de</strong>ring as feedstock corn and sugar cane (conventional processes)<br />
or sugar cane (with hydrolysis), cassava and sugar beets (r<strong>el</strong>ativ<strong>el</strong>y new, and in one case non<br />
commercial technologies), were presented in the previous Report on Activity 5 (Nogueira<br />
2006). Consi<strong>de</strong>ring the context, a<strong>de</strong>quate production scale was adopted, and the number of<br />
producer units was established as w<strong>el</strong>l as the investment needs. Feedstock (corn, sugar cane)<br />
cost was estimated with information available (not taken as the practiced current prices).<br />
Conventional processes lead to the lowest investment needs (with corn leading, mainly<br />
for its operation during all the year);<br />
79
<strong>Potenciales</strong> y <strong>Viabilidad</strong> <strong><strong>de</strong>l</strong> <strong>Uso</strong> <strong>de</strong> <strong>Bioetanol</strong> y <strong>Biodies<strong>el</strong></strong> <strong>para</strong> <strong>el</strong> Transporte en México (SENER-BID-GTZ)<br />
Task 6: Potentials in r<strong>el</strong>ation to sustainability criteria<br />
Sugar cane leads to the lowest area requirements (sugar cane using cane juice,<br />
improving with some hydrolysis) although sugar beets and corn are r<strong>el</strong>ativ<strong>el</strong>y close<br />
(~10 – 20% higher).<br />
The net economic result (US$ / l), including 28% taxes, is negative for all cases, with<br />
ethanol prices at US$ 0.45 / l; it is positive for the “conventional” combinations of<br />
biomass / technologies (sugar cane and corn) for ethanol prices between US$0.45 and<br />
US$ 0.55 / l. It remains negative for all new technologies, even at US$ 0.65 / l ethanol.<br />
The sensitivity analysis shows that for all the conventional technologies (based on<br />
sugar cane and corn) the feedstock cost is the most important; 10% lower cane cost<br />
leads to 6% reduction in ethanol cost (4% in corn).<br />
The ethanol costs were based on estimated biomass cost for Mexico; if the average<br />
current corn prices in Mexico were used (US$ 173. / t) ethanol cost would be 32%<br />
higher, at 0.58 US$0.58 / l. The same applies to sugar cane; the KARBE price last<br />
year (US$ 33. / t cane) ) would lead to ethanol price of US$ 0.59. / l , or 37% higher.<br />
This result is particularly interesting for the sugar cane; looking at the production in Mexico<br />
today it is common sense (as we discussed in many interviews) that cane cost can be reduced<br />
significantly. The same can be said about processing cost, with higher conversion efficiencies<br />
and eventually power production with mo<strong>de</strong>rn co-generation. It is interesting, in this context,<br />
to see that all the bio-ethanol programs in Europe and the U.S. (as w<strong>el</strong>l as the bio-dies<strong>el</strong><br />
programs) started with large differences between ethanol and gasoline costs; but a much closer<br />
and meaningful association must be found in the Brazilian ethanol program (based on sugar<br />
cane). Looking at Figure 10.1 the impressive reduction in cost since the beginning of the<br />
program ma<strong>de</strong> the ethanol cost actually lower than the gasoline (international) cost, due to<br />
technology and management. This is expected to happen in a similar program in Mexico, with<br />
the benefit of also h<strong>el</strong>ping to <strong>de</strong>v<strong>el</strong>op a much stronger sugar industry.<br />
It must be remembered that the better use of co-generation might have an important effect in<br />
overall cost reduction. As an example, for the situation of Case 2 (Table 2.6), co-generation in<br />
high pressure (using only bagasse) would lead (in Brazilian conditions) to 10% increase in<br />
sales value (with <strong>el</strong>ectricity), no change in feedstock cost, and a much smaller (%) increase in<br />
total investment.<br />
12.3 Other impacts: balance of payments, local industry<br />
With the importation costs consi<strong>de</strong>red, the reduction in the imports of gasoline and MTBE<br />
(base: 2005) in Scenario 3 (10% ethanol blend) would lead to savings of US$ 1.75 10 9 in<br />
foreign exchange (~2.0 10 9 in 2010).<br />
The industry’s <strong>de</strong>v<strong>el</strong>opment will require advances from manufacturers of equipment for both<br />
the agricultural and industrial sectors, with improvement in their technological lev<strong>el</strong>; this will<br />
translate to job and income creation. Equipment for sugar and ethanol production and<br />
combined heat and power generation may have a nationalization in<strong>de</strong>x of nearly 100 percent<br />
in Mexico.<br />
80
<strong>Potenciales</strong> y <strong>Viabilidad</strong> <strong><strong>de</strong>l</strong> <strong>Uso</strong> <strong>de</strong> <strong>Bioetanol</strong> y <strong>Biodies<strong>el</strong></strong> <strong>para</strong> <strong>el</strong> Transporte en México (SENER-BID-GTZ)<br />
Task 6: Potentials in r<strong>el</strong>ation to sustainability criteria<br />
12.4 Impacts on job creation<br />
The transition in the Mexican agriculture, <strong>de</strong>scribed in Chapter 6.4, makes it difficult to<br />
estimate with precision the number of farmers involved in agricultural activities today<br />
(Lazcano 2006a). The expected buying of land in large scale by the sugar mill owners, after<br />
1992, did not happen; sugar cane land owners today can receive (with 5 ha) the value<br />
equivalent to three minimum wages (against one, for 40% of all the other workers). In other<br />
cultures the situation is different (sugar cane has specific laws).<br />
The XII Censo General <strong>de</strong> Población y Vivienda 2000 (INEGI 2000) indicates (projections for<br />
2005) ~25 M people living in rural areas. There are 3.77 M production units, with<br />
approximat<strong>el</strong>y 10.8 M workers.<br />
For corn, approximat<strong>el</strong>y 3.1 M producers are involved (from a total of 5.4 M in agriculture<br />
and cattle rising, as mentioned in (Bioenergéticos 2006).<br />
For sugar cane the number of 150000. cane growers is taken as a reference although more<br />
people are involved, in each property, in the production. The estimate of 400000. direct<br />
employees (fi<strong>el</strong>d and industry) is presented in (Bioenergéticos 2006). Another estimate<br />
mentioned in (Lazcano 2006a) indicates that 150000. (direct plus indirect) jobs would be<br />
created for 60000. ha, in energy crops.<br />
In Brazil the sugar cane agro-industry has shown a great flexibility in the number of jobs<br />
created / unit production: in areas with large manpower available and com<strong>para</strong>tiv<strong>el</strong>y lower<br />
incomes (like the North-Northeast, as compared to the Center-South) the agricultural<br />
mechanization and industrial automation are smaller, and jobs / unit production may be up to 3<br />
times larger than in regions where manpower is more difficult to find, and wages are higher. In<br />
all cases, the average wages in agriculture were higher in sugar cane than in all other cultures<br />
(except for soybeans, a highly mechanized culture). The direct (formal and informal) jobs in<br />
the agro-industry reached ~930000. in 2002 (Moraes 2005), for a sugar cane production /<br />
processing of 318 M t cane / year. The estimated indirect jobs (late 1990’s) were nearly the<br />
same, yi<strong>el</strong>ding ~5800. jobs (direct and indirect) / M t cane.<br />
These are averages, and as said the difference in jobs / cane produced can be very large among<br />
regions. Besi<strong>de</strong>s, it is difficult to foresee the structure of production in Mexico for the next<br />
years; possibly two systems will coexist, one close to the situation today (large number of land<br />
owners, small areas; with some <strong>de</strong>gree of cooperative action) and other with much larger<br />
areas. Suitable structures (for both systems) will lead to differences in job creation. In the<br />
situation as today, reaching 10% ethanol in all gasoline would require to double the jobs in<br />
sugar cane agro-industry.<br />
Similarly, for the needs of Scenario 3 (10% ethanol in gasoline; 3.9 M m 3 ethanol) the corn<br />
production would have to increase in 46% (plus 9.7 M t, over the production today of 21M t),<br />
with a corresponding increase in jobs. Again, new production structures would impact in this<br />
figure.<br />
81
<strong>Potenciales</strong> y <strong>Viabilidad</strong> <strong><strong>de</strong>l</strong> <strong>Uso</strong> <strong>de</strong> <strong>Bioetanol</strong> y <strong>Biodies<strong>el</strong></strong> <strong>para</strong> <strong>el</strong> Transporte en México (SENER-BID-GTZ)<br />
Task 6: Potentials in r<strong>el</strong>ation to sustainability criteria<br />
12.5 Summary and Conclusions<br />
Conclusions on the economic evaluation are presented in the report on Task 5.<br />
A reference “value” (parity cost) for ethanol when substituting for gasoline and MTBE was<br />
taken at ~US$ 0.45 / l. The estimates, using feedstock cost based in the production actual cost<br />
(not feedstock price) indicate:<br />
Conventional processes have the lowest investment needs (with corn leading, mainly<br />
for its operation during all the year);<br />
Sugar cane presents the lowest area requirements although sugar beets and corn are<br />
r<strong>el</strong>ativ<strong>el</strong>y close (~10 – 20% higher).<br />
The net economic result (US$ / l) is negative for all cases, with ethanol prices at US$<br />
0.45 / l; it is positive for the “conventional” combinations of biomass / technologies<br />
(sugar cane and corn) for ethanol prices between US$0.45 and US$ 0.55 / l. It remains<br />
negative for all new technologies, even at US$ 0.65 / l ethanol. The sensitivity analysis<br />
shows that for all the conventional technologies (based on sugar cane and corn) the<br />
feedstock cost is the most important; 10% lower cane cost leads to 6% reduction in<br />
ethanol cost (4% in corn).<br />
The results are very interesting for sugar cane, since it is known that cane cost (and processing<br />
cost) can still be reduced significantly with higher conversion efficiencies and eventually<br />
power production with mo<strong>de</strong>rn co-generation. Lower biomass production cost is essential for a<br />
faster implementation of any energy crop program; and it is <strong>de</strong>pen<strong>de</strong>nt in other (institutional)<br />
factors, as discussed in Chapter 6.<br />
Although sugar cane is best placed, corn leads to very close economic results. Other points<br />
will of course be consi<strong>de</strong>red, like land utilization. Other crops may be interesting in specific<br />
areas and conditions.<br />
Reducing gasoline and MTBE importation as in Scenario 3 (10% ethanol blend) would lead to<br />
savings of US$ 1.75 10 9 (2005) in foreign exchange (~2.0 10 9 in 2010). Equipment for ethanol<br />
production and combined heat and power generation may have a nationalization in<strong>de</strong>x of<br />
nearly 100 percent in Mexico, creating jobs and strengthening the industry.<br />
It is difficult to estimate with precision the number of farmers involved in agricultural<br />
activities today (and the expected farmer productivity in the next years). In today’s conditions,<br />
reaching 10% ethanol in all gasoline (Scenario 3) would require to double the jobs in sugar<br />
cane agro-industry; or, alternativ<strong>el</strong>y, increase in 45% the jobs in corn production. New<br />
production structures (larger areas, mechanization and automation) would lead to lower<br />
figures; however job creation (at r<strong>el</strong>ativ<strong>el</strong>y low investment) would be one of the most<br />
important contributions of the program (as it is in other places).<br />
82
<strong>Potenciales</strong> y <strong>Viabilidad</strong> <strong><strong>de</strong>l</strong> <strong>Uso</strong> <strong>de</strong> <strong>Bioetanol</strong> y <strong>Biodies<strong>el</strong></strong> <strong>para</strong> <strong>el</strong> Transporte en México (SENER-BID-GTZ)<br />
Task 6: Potentials in r<strong>el</strong>ation to sustainability criteria<br />
Annex 1 Ethanol from sugar cane: energy ratios and greenhouse<br />
gas emissions for s<strong>el</strong>ected production schemes in<br />
Mexico<br />
The production of ethanol from sugar cane in Mexico may inclu<strong>de</strong> many options (processes<br />
and agricultural / industrial efficiencies); they have important consequences for the Fossil<br />
Energy Ratio (and consequently for the impacts in the energy sector) and for the emissions of<br />
greenhouse gases.<br />
The average values for the production of ethanol in Brazil are shown in Chapter 2 (energy)<br />
and Chapter 3 (GHG avoi<strong>de</strong>d emissions), as a reference. The same methodology is used here<br />
to estimate results for three “limiting” cases consi<strong>de</strong>red suitable to analyze the possibilities in<br />
Mexico. They consi<strong>de</strong>r the small annexed distilleries to the existing sugar mills; the<br />
in<strong>de</strong>pen<strong>de</strong>nt, mo<strong>de</strong>rn distilleries operating with cane juice, with agricultural production in<br />
different conditions, including co-generation for s<strong>el</strong>ling <strong>el</strong>ectricity; “improved” in<strong>de</strong>pen<strong>de</strong>nt<br />
distilleries, with low energy use in internal processes; and a hypothetical case where some<br />
trash is recovered from the unburned cane harvesting, ad<strong>de</strong>d to “saved” bagasse and this<br />
biomass is used for hydrolysis / fermentation to ethanol. These options are suitable to obtain<br />
indicators for the “commercial technology” possibilities and for an initial stage of “future<br />
technologies” (which could evolve into the use of larger amounts of trash, when possible, and<br />
“integral cane”). They also show the differences in the energy ratio when looking for either<br />
more <strong>el</strong>ectricity surplus or more ethanol, with the available technologies.<br />
• Case 1: small annexed distillery, operating with exhausted molasses. The sugar mill<br />
operating <strong>para</strong>meters and efficiencies are the average for today’s sugar mills in<br />
Mexico; only the distillery is “new”, with mo<strong>de</strong>rn fermentation / distillation systems,<br />
and conversion efficiencies equivalent to the “state of the art”.<br />
Main <strong>para</strong>meters:<br />
Cane productivity: 77 t cane / ha<br />
10% harvesting mechanization; 100% burned cane;<br />
1 l dies<strong>el</strong> / t cane (transportation)<br />
Electric energy bought (industry): 1.25 kWh/t cane<br />
Total <strong>el</strong>ectricity used (industry): 17 kWh/t cane<br />
Fu<strong>el</strong> oil bought (industry): 8.5 l/ t cane<br />
• Case 2: Autonomous (in<strong>de</strong>pen<strong>de</strong>nt) distillery; operating with cane juice. The operating<br />
<strong>para</strong>meters correspond to a new, mo<strong>de</strong>rn factory, with efficiencies equivalent to the<br />
best (commercial) systems; a co-generation system in inclu<strong>de</strong>d, at 62 bar (abs) -<br />
450°C; CEST. The steam consumption in processes corresponds to the “average”<br />
Brazilian mills (high: ~500 kg steam at 2.5 bar (abs)). This is the trend for new<br />
Brazilian ethanol distilleries (except for the CEST, existing but not used yet) aiming at<br />
increasing power surpluses.<br />
83
<strong>Potenciales</strong> y <strong>Viabilidad</strong> <strong><strong>de</strong>l</strong> <strong>Uso</strong> <strong>de</strong> <strong>Bioetanol</strong> y <strong>Biodies<strong>el</strong></strong> <strong>para</strong> <strong>el</strong> Transporte en México (SENER-BID-GTZ)<br />
Task 6: Potentials in r<strong>el</strong>ation to sustainability criteria<br />
The agricultural <strong>para</strong>meters are:<br />
Cane productivity: 70 t / ha (“future” rain fed production)<br />
20% harvesting mechanization, 80% cane burning, no trash recovery<br />
Fiber % cane = 13.21; Pol % cane = 13.68<br />
• Case 3: Autonomous distillery; the only differences to Case 2 are the introduction of<br />
energy efficient systems to reduce the thermal energy requirements of the processes at<br />
the industry. They are all commercial systems; the steam consumption lowers to 350<br />
kg steam at 2.5 bar (abs) / t cane. This improves power exports (using the CEST cogeneration<br />
scheme); many mills are consi<strong>de</strong>ring this option for the next years, in<br />
Brazil, because it will be necessary if the hydrolysis of bagasse / trash becomes<br />
commercial.<br />
• Case 4: This is an option including non-commercial technology; it would be a first step<br />
towards future (possible) systems to use hydrolysis of the cane wastes to increase<br />
ethanol production. Consi<strong>de</strong>ring Case 3, the difference is the recovery of some of the<br />
trash (40% over the 20% of the area harvested without burning; so, only 8% of the<br />
total trash). This biomass, together with the “saved” bagasse from the low steam<br />
consumption processes, is used for producing ethanol. No <strong>el</strong>ectricity exports are ma<strong>de</strong>:<br />
all biomass goes to ethanol.<br />
In all cases, the use of fertilizers is assumed to be equivalent to the Brazilian average<br />
consumption. Small differences would not impact significantly either the Energy Ratio or the<br />
emissions.<br />
Table A1.1 Parameters for the autonomous distilleries, Mexico (Cases 2, 3, 4)<br />
Cane milled<br />
2 M t / year<br />
Operation Only during harvesting season; 200 days, 90%<br />
Efficiencies<br />
Fermentation/distillation 91%<br />
Extraction 96,1 %<br />
Juice treatment 99,3 %<br />
Power generation (1), (2) Boiler: 62 bar (abs) - 450°C; CEST(3)<br />
80% efficiency; Con<strong>de</strong>nsing: 0.11 bar<br />
(1) Power Generation internal energy consumption: 10%<br />
(2) Mechanical drive turbines at 22 bar (abs)<br />
(3) CEST: extraction-con<strong>de</strong>nsing turbines, 62 – 22 – 0.11 bar casca<strong>de</strong><br />
84
<strong>Potenciales</strong> y <strong>Viabilidad</strong> <strong><strong>de</strong>l</strong> <strong>Uso</strong> <strong>de</strong> <strong>Bioetanol</strong> y <strong>Biodies<strong>el</strong></strong> <strong>para</strong> <strong>el</strong> Transporte en México (SENER-BID-GTZ)<br />
Task 6: Potentials in r<strong>el</strong>ation to sustainability criteria<br />
The production results for the cases un<strong>de</strong>r study are shown in (Table A1.2).<br />
Table A1.2<br />
Ethanol and Electricity production, Distilleries in Mexico<br />
Unity Case 1 Case 2 Case 3 Case 4 (1)<br />
Distillery type Annexed In<strong>de</strong>pen<strong>de</strong>nt In<strong>de</strong>pen<strong>de</strong>nt In<strong>de</strong>pen<strong>de</strong>nt<br />
Operation Days 200 200 200 200<br />
Burned cane % 100 80 80 80<br />
Mechanical Harvesting % 10 20 20 20<br />
Trash recovery % 0 0 0 40 (2)<br />
Productivity<br />
Cane t / ha 77 70 70 70<br />
Anhydrous ethanol l/ t cane n.a. (3) 84 84 102 (4)<br />
Energy Use<br />
Electricity kWh/t cane 17 12 12 42 (5)<br />
Mechanical Drives kWh/t cane (3) 16 16 16<br />
Steam kg/t cane (3) 500 (6) 350 (6) 465 (7)<br />
Energy Production<br />
Ethanol m³/year (3) 166940. 166940. 204430.<br />
Surplus biomass t/year 0 0 0 0<br />
Electricity<br />
Total kWh/t cane n.a. 73 84 45<br />
Surplus (sold) MW 0 25 30 0<br />
kWh/t cane 0 54 65 0<br />
1) Ethanol production from sucrose and from c<strong>el</strong>lulose<br />
(2) 40% over the unburned cane<br />
(3) Ethanol from molasses, only; a value of 10.8 l / t cane was used. Energy ratio and GHG<br />
were calculated for the “equivalent” cane (sucrose utilization); the operational <strong>para</strong>meters<br />
(specific energy use, efficiencies) are the same as for Case 2 unless specified.<br />
(4) From sucrose (84 l/t cane) plus hydrolysis / fermentation (268 l/t (Dry Matter).<br />
(5) Conventional process (from sucrose): 12 kWh/t cane; plus hydrolysis (92 kW/MW PCS ).<br />
(6) Saturated steam, at 2.5 bar (abs).<br />
(7) Conventional process (from sucrose): 350 kg/t cane; plus hydrolysis (1620 kg/t (Dry<br />
Matter)).<br />
85
<strong>Potenciales</strong> y <strong>Viabilidad</strong> <strong><strong>de</strong>l</strong> <strong>Uso</strong> <strong>de</strong> <strong>Bioetanol</strong> y <strong>Biodies<strong>el</strong></strong> <strong>para</strong> <strong>el</strong> Transporte en México (SENER-BID-GTZ)<br />
Task 6: Potentials in r<strong>el</strong>ation to sustainability criteria<br />
Table (A1.3) shows the main results for the energy flows.<br />
Table A1.3 Energy inputs / outputs for cane production and conversion to ethanol,<br />
(kcal/t cane) (1)<br />
Case 1 Case 2 Case 3 Case 4<br />
Total cane production (inputs) 49231. 51529. 51529. 51563.<br />
Agricultural operations (2) 8688 8625 8625 8609<br />
Transportation (cane and inputs)) (3) 10624 10357 10357 10406<br />
Fertilizers (4) 16343 17978 17978 17978<br />
Lime, herbici<strong>de</strong>s and insectici<strong>de</strong>s 4672 4851 4851 4851<br />
Agricultural equipment 7470 8217 8217 8217<br />
Seeds 1434 1501 1.501 1.502<br />
Ethanol production (inputs) 115652 10201 10201 12061<br />
Industrial buildings (5) 8681 8681 8681 10541<br />
Industrial inputs 1520 1520 1520 1520<br />
Electricity (6) 3498 0 0 0<br />
Fu<strong>el</strong> oil (7) 101954 0 0 0<br />
INPUT (total) 164883 61730 61730 63624<br />
Ethanol 448576 448576 448576 544700<br />
Bagasse 0 0 0 0<br />
Electricity (6) 0 151.095 181.874 0<br />
OUTPUT (total) 448576 599672 630451 544700<br />
Ratio Output/Input 2.7 9.7 10.2 8.6<br />
(1) The methodology used (and process conditions, except when stated otherwise) may be<br />
found in (Macedo I. C.; Leal M. R. and Silva J.R. 2003). Values are all r<strong>el</strong>ated to the primary<br />
energy.<br />
For Case 1, the calculation is performed as if for an in<strong>de</strong>pen<strong>de</strong>nt distillery, with the equivalent<br />
cane processing (so the sugar production is isolated).<br />
(2) For Case 1: specific fu<strong>el</strong> utilization was assumed to be 20% higher than for the other cases.<br />
(3) Case 1: 1 liter /t cane. All the other cases: use of simple trucks (8%), two-load trucks<br />
(25%) e three-load trucks (67%).<br />
(4) Consi<strong>de</strong>ring stillage ferti-irrigation and filter cake distribution in 30% of the area.<br />
(5) Values based in a distillery for 180000. l/day.<br />
(6) Energy equivalent in Natural Gas for a power station with 38% efficiency. In Case 1 the<br />
distillery buys 1.25 kWh/t cane; in Cases 2 and 3 the distillery exports energy.<br />
(7) Case 1: direct use of 8.5 l/t cane.<br />
Note that the much smaller energy ratio for the annexed distillery (Case 1) results essentially<br />
from the high (external) energy inputs nee<strong>de</strong>d at the industry: the Mexican mills (on the<br />
average) buy both <strong>el</strong>ectricity and fu<strong>el</strong> oil. This is not the situation for the (mo<strong>de</strong>rn)<br />
in<strong>de</strong>pen<strong>de</strong>nt distilleries, Cases 2 to 4. It will not be the (expected) situation for annexed<br />
distilleries to the sugar mills, in the future.<br />
86
<strong>Potenciales</strong> y <strong>Viabilidad</strong> <strong><strong>de</strong>l</strong> <strong>Uso</strong> <strong>de</strong> <strong>Bioetanol</strong> y <strong>Biodies<strong>el</strong></strong> <strong>para</strong> <strong>el</strong> Transporte en México (SENER-BID-GTZ)<br />
Task 6: Potentials in r<strong>el</strong>ation to sustainability criteria<br />
Cases 2 and 3 show energy ratios better than the today’s Brazilian distilleries (where the<br />
average is 8.2). Case 2 has a much higher amount of exported <strong>el</strong>ectricity (being operated at<br />
high pressure steam; most Brazilian distilleries are not yet at this condition); Case 3 is still<br />
better due to the use energy saving equipment at the factory.<br />
In Case 4 we note the effect of lowering <strong>el</strong>ectricity exports and increasing ethanol production<br />
with the use of some trash (still a small fraction, 8%): the energy ratio is smaller, although the<br />
ethanol output is higher. This is due to the different conversion efficiencies found today for the<br />
two energetic, in the conditions established. Of course the use of higher trash volumes (when<br />
possible, with advancing harvesting mechanization) will change those values.<br />
Following the same methodology as in (Macedo I. C.; Leal M. R. and Silva J.R. 2003) the<br />
greenhouse gas emissions in the life cycle for the ethanol production in the four Cases were<br />
estimated. The main results are presented in the (Table A1.4). The same consi<strong>de</strong>rations about<br />
the r<strong>el</strong>ative importance of producing more ethanol or more <strong>el</strong>ectricity from the available<br />
biomass (Cases 3 and 4) from the energy ratio perspective, apply here, for the GHG emissions<br />
avoi<strong>de</strong>d.<br />
Table A1.4<br />
Greenhouse Gas Emissions and Avoi<strong>de</strong>d Emissions, Sugar cane to ethanol<br />
distilleries (t CO 2 eq / m³ anhydrous ethanol) (1)<br />
Case 1 Case 2 Case 3 Case 4<br />
Emissions from processes 0.84 0.43 0.43 0.36<br />
Dies<strong>el</strong> oil(2) 0.07 0.07 0.07 0.06<br />
Fu<strong>el</strong> oil (3) 0.55 0.16 0.16 0.14<br />
Natural Gas (4) 0.01 0.00 0.00 0.00<br />
Cane burning (5) 0.13 0.11 0.11 0.09<br />
N 2 O (6) 0.08 0.09 0.09 0.07<br />
Avoi<strong>de</strong>d emissions -2.80 -3.15 -3.22 -2.80<br />
Surplus <strong>el</strong>ectricity (7) 0.00 -0.35 -0.42 0.00<br />
Anhydrous ethanol (8) -2.80 -2.80 -2.80 -2.80<br />
Net Value -1.92 -2.72 -2.79 -2.44<br />
(1) Consi<strong>de</strong>ring all direct and indirect components.<br />
(2) Agricultural operations and transportation (cane, inputs)<br />
(3) Energy in equipment or inputs (fabrication); in Case 1, also for direct use in the industry<br />
(4) For the (equivalent) power generation.<br />
(5) Emissions from burning sugar cane before harvesting<br />
(6) Soil emissions of N 2 O (from fertilizer utilization)<br />
(7) Value computed at the equivalent use of Natural Gas for generation.<br />
(8) 1 L anhydrous ethanol ≅ 1 L gasoline; use in blends up to 10% vol.<br />
87
<strong>Potenciales</strong> y <strong>Viabilidad</strong> <strong><strong>de</strong>l</strong> <strong>Uso</strong> <strong>de</strong> <strong>Bioetanol</strong> y <strong>Biodies<strong>el</strong></strong> <strong>para</strong> <strong>el</strong> Transporte en México (SENER-BID-GTZ)<br />
Task 6: Potentials in r<strong>el</strong>ation to sustainability criteria<br />
Annex 2 Standards for ethanol storage tanks and systems, and<br />
ethanol transportation in Brazil<br />
The standards for the manufacture of storage tanks, storage tank systems for ethanol and the<br />
handling of ethanol in storage and transportation in Brazil are (essentially) <strong>de</strong>rived from the<br />
API standards (for oil, and oil <strong>de</strong>rived fu<strong>el</strong>s) with a<strong>de</strong>quate adaptations (Koizumi 2006). The<br />
basic standards are listed b<strong>el</strong>ow, both the Brazilian specific standards (NBR) and the<br />
applicable API – NFPA standards.<br />
- NBR-7505/2000 Armazenagem <strong>de</strong> petróleo, seus <strong>de</strong>rivados líquidos e alcool carburante.<br />
- NBR- 7820/1983 Segurança nas instalações <strong>de</strong> produção, armazenamento, manuseio e<br />
transporte <strong>de</strong> etanol.<br />
- NBR- 7821/1983 Tanques soldados <strong>para</strong> armazenamento <strong>de</strong> petróleo e <strong>de</strong>rivados.<br />
- NBR- 5419/2005 Proteção <strong>de</strong> estruturas contra <strong>de</strong>scargas atmosféricas.<br />
- NBR- 5418/1995 Instalações <strong>el</strong>étricas em ambientes com líquidos , gases ou vapores<br />
inflamáveis - procedimento.<br />
- NBR- 5363/ Invólucros à prova <strong>de</strong> explosão <strong>para</strong> equipamentos <strong>el</strong>étricos -<br />
especificação.<br />
- NBR- 98/66 Armazenamento e manuseio <strong>de</strong> líquidos inflamáveis e combustíveis.<br />
- NBR- 13860/97 Glossário <strong>de</strong> termos r<strong>el</strong>acionados à segurança contra incêndios.<br />
- API – 620 Design and construction of Large, W<strong>el</strong><strong>de</strong>d, Low-Pressure Storage<br />
Tanks, Tenth Edition- American Petroleum Institute.<br />
- API – 650 W<strong>el</strong><strong>de</strong>d Ste<strong>el</strong> Tanks for Oil Storage, 10th Edition - American Petroleum<br />
Institute.<br />
- NFPA -30/1955 Flammable and Combustible liquids co<strong>de</strong>.<br />
- NFPA -497/1997 Recommen<strong>de</strong>d Practice for the Classification of Flammable Liquids,<br />
Gases, or Vapors and of Hazardous (Classified) Locations for Electrical<br />
Installation in Chemical Process Areas.<br />
For the transportation systems the legislation is not specific to ethanol; the complete text can<br />
be found at www.antt.gov.br/legislacao/PPerigosos/Nacional/;in<strong>de</strong>x.asp:<br />
- Decreto Fe<strong>de</strong>ral 96.044, 18/05/1988<br />
- Resolução Nº 420/04, Agência Nacional <strong>de</strong> Transportes Terrestres – ANTT<br />
88
<strong>Potenciales</strong> y <strong>Viabilidad</strong> <strong><strong>de</strong>l</strong> <strong>Uso</strong> <strong>de</strong> <strong>Bioetanol</strong> y <strong>Biodies<strong>el</strong></strong> <strong>para</strong> <strong>el</strong> Transporte en México (SENER-BID-GTZ)<br />
Task 6: Potentials in r<strong>el</strong>ation to sustainability criteria<br />
Annex 3 Water utilization in a sugar mill with annexed<br />
distillery<br />
The uses of water in a sugar mill with annexed distillery are shown in Table A3.1, for the<br />
average conditions in Brazil (Elia Neto 2005).<br />
Table A3.1<br />
Water uses (mean values) in mills having an annexed distillery<br />
Sector Process Mean Use Distribution (%)<br />
(total m 3 / t<br />
cane )<br />
Feeding Sugar-cane Washing 5.33 25.4<br />
Extraction Imbibition 0.25 1.2<br />
(grinding) Bearing Cooling 0.15 0.7<br />
Juice treatment Pre<strong>para</strong>tion of Lime Mixture 0.01 0.1<br />
Cooling at Sulphitation (A) 0.05 0.2<br />
Filter Imbibition 0.04 0.2<br />
Filter Con<strong>de</strong>nsers 0.30 1.4<br />
Juice Con<strong>de</strong>nsers/Multi-jets<br />
2.00 9.5<br />
Concentration Evaporation (A)<br />
Con<strong>de</strong>nsers/Multi-jets<br />
4.00 19.0<br />
Heaters (A)<br />
Molasses Dilution 0.03 0.1<br />
Crystallizer Cooling (A) 0.05 0.2<br />
Sugar Washing (A) 0.01 0.0<br />
Electric Power Steam Production 0.50 2.4<br />
Generation Turbo-generator Cooling 0.20 1.0<br />
Fermentation Juice Cooling (B) 1.00 4.8<br />
Fermentation Cooling (B) 3.00 14.3<br />
Distillery Con<strong>de</strong>nser Cooling (B) 4.00 19.0<br />
Other Floor & Equipment Cleaning 0.05 0.2<br />
Drinking 0.03 0.1<br />
Total 21.00 100.0<br />
(A): in sugar production only<br />
(B): in ethanol production only<br />
The value of 21. m 3 / t cane would be reduced to ~ 15m 3 / t cane, for an in<strong>de</strong>pen<strong>de</strong>nt distillery<br />
(only producing ethanol). In any case, it <strong>de</strong>mands a large number of water re-utilization in the<br />
processes; the average water withdrawal from the sources (rivers, lakes, un<strong>de</strong>rground water)<br />
was 5.6 m 3 / t cane in 1990 (with consumption of 1.8, and r<strong>el</strong>easing 3.8 m 3 / t cane of treated<br />
water). After a successful program to reduce the water withdrawal (increasing recycle) the<br />
value in 2005 was only 1.8 m 3 / t cane (Elia Neto 2005).<br />
89
<strong>Potenciales</strong> y <strong>Viabilidad</strong> <strong><strong>de</strong>l</strong> <strong>Uso</strong> <strong>de</strong> <strong>Bioetanol</strong> y <strong>Biodies<strong>el</strong></strong> <strong>para</strong> <strong>el</strong> Transporte en México (SENER-BID-GTZ)<br />
Task 6: Potentials in r<strong>el</strong>ation to sustainability criteria<br />
Annex 4 Stillage Concentration System<br />
The information on this commercial stillage concentration system, <strong>de</strong>signed for concentrating<br />
stillage from exhausted molasses to 35% dry mass, was supplied by Dedini – Vog<strong>el</strong>busch,<br />
Brazil (T. Orosz, March 2006).<br />
Initial stillage: 240 m3 / h; 5% dry mass (Brix); T= 85 o C<br />
Final Products:<br />
Concentrated stillage: 34 m3 / h; 35% dry mass (Brix); T= 35 o C<br />
Mud (residue): 0.8 t / day; 40% DM; may be mixed to the stillage<br />
Con<strong>de</strong>nsate: 196 m3 / h; BOD = 1500 mg/l; T= 72 o C<br />
Utilities:<br />
Cooling water (1650 m3 / h; 30 o C;<br />
Process water: T= 28 o C; Chlorine < 30 mg/l; Residues < 1000 mg/l<br />
Electric power: 500 kW<br />
Nitric Acid (cleaning) :
<strong>Potenciales</strong> y <strong>Viabilidad</strong> <strong><strong>de</strong>l</strong> <strong>Uso</strong> <strong>de</strong> <strong>Bioetanol</strong> y <strong>Biodies<strong>el</strong></strong> <strong>para</strong> <strong>el</strong> Transporte en México (SENER-BID-GTZ)<br />
Task 6: Potentials in r<strong>el</strong>ation to sustainability criteria<br />
Annex 5 System for Anaerobic Digestion of Stillage<br />
A typical example of installation for stillage treatment (for discharge in rivers, with a<strong>de</strong>quate<br />
environmental restrictions) today may have as main characteristics:<br />
Process: Methax/Biopaq IC, Anaerobic + Aerobic<br />
Distillery: Cane Juice + B molasses; 15 l stillage / l ethanol; 200 000. l ethanol/day<br />
Stillage<br />
3000 m³/day<br />
Stillage and dilution water<br />
4000 m³/day<br />
COD<br />
30000 mg/l<br />
BOD<br />
16500 mg/l<br />
Suspen<strong>de</strong>d solids<br />
300 mg/l<br />
N: 45; P: 2500; Ca: 1000; Mg: 300; SO 4 : 750 mg/l<br />
Temperature 88 ºC; pH 4.5<br />
Total Organic Contents: 90000 Kg DQO/day<br />
49500 Kg DBO/day<br />
Treated stillage<br />
Flow rate<br />
4000 m³/day<br />
BOD<br />
≤ 200 mg/l<br />
Solids<br />
≤ 1.0 ml/l.h<br />
Temperature ≤ 35ºC<br />
pH 6.5 – 8.5<br />
Anaerobic process: DBO removal ≥ 90%; stillage dilution, cooling, pH control (with<br />
NaOH) and treatment. Two IC reactors, each with ~1700 m 3 (cylin<strong>de</strong>r, 9.4 m diameter, 24<br />
m height); ste<strong>el</strong>.<br />
Aerobic pos-treatment: aeration tanks; activated slurry with large aeration times.<br />
Two aeration tanks with 5400. m 3 (each), concrete with anti-corrosion protection. The effluent<br />
+ biological slurry go to a secondary <strong>de</strong>canter; the slurry is recycled. Excess slurry is<br />
concentrated to 20% solids for disposition.<br />
Total construction area: ~6500. m 2<br />
Gas generation: 28 000. m3/ day, 60 – 70% methane<br />
Power utilization: ~520 kW<br />
91
<strong>Potenciales</strong> y <strong>Viabilidad</strong> <strong><strong>de</strong>l</strong> <strong>Uso</strong> <strong>de</strong> <strong>Bioetanol</strong> y <strong>Biodies<strong>el</strong></strong> <strong>para</strong> <strong>el</strong> Transporte en México (SENER-BID-GTZ)<br />
Task 6: Potentials in r<strong>el</strong>ation to sustainability criteria<br />
Annex 6.<br />
Aspects of the sugar cane breeding program in Brazil<br />
The material in this section was s<strong>el</strong>ected from (Burnquist and Lan<strong><strong>de</strong>l</strong>l 2005).<br />
More than 500 varieties of sugar-cane are grown in Brazil, <strong>de</strong>v<strong>el</strong>oped mainly in two genetic<br />
improvement programs: CTC (SP varieties; privat<strong>el</strong>y owned), and RIDESA (with RB<br />
varieties; state owned). Actually Brazil uses two private and two public companies in the<br />
genetic improvement of sugar-cane varieties. They keep many experimental stations, a private<br />
quarantine facility (processing ~40 new varieties from other countries, every year), three<br />
hybridization facilities and germplasm banks.<br />
The census 2003-2004 (260 sugar-cane growing units) indicates that 51 out of the 500 sugarcane<br />
varieties in use have been r<strong>el</strong>eased over the past ten years, and the 20 most important of<br />
them occupy 80 percent of the crop area, while RB 72454, the most wi<strong><strong>de</strong>l</strong>y used, occupies<br />
only 12.6 percent. Not only the permanence “cycles” for the best varieties get shorter and<br />
shorter, but also these varieties coexist in larger number (Figure A6.1). This great<br />
diversification is part of the pest and disease protection strategy.<br />
90,0<br />
80,0<br />
70,0<br />
CB41-76<br />
IAC52-150<br />
CB45-3<br />
RB785148<br />
60,0<br />
50,0<br />
40,0<br />
SP71-6163<br />
SP71-1406<br />
SP80-1816<br />
SP80-1842<br />
RB855536<br />
RB835486<br />
30,0<br />
RB72454<br />
SP79-1011<br />
20,0<br />
SP81-3250<br />
10,0<br />
NA56-79<br />
SP70-1143<br />
0,0<br />
`84 `85 `86 `87 `88 `89 `90 `91 `92 `93 `94 `95 `96 `97 `98 `99 `00 `01 `02 `03<br />
Figure A6.1 Percentage area occupation by the main sugar-cane varieties in Brazil<br />
from 1984 to 2003 ((Burnquist and Lan<strong><strong>de</strong>l</strong>l 2005)<br />
92
<strong>Potenciales</strong> y <strong>Viabilidad</strong> <strong><strong>de</strong>l</strong> <strong>Uso</strong> <strong>de</strong> <strong>Bioetanol</strong> y <strong>Biodies<strong>el</strong></strong> <strong>para</strong> <strong>el</strong> Transporte en México (SENER-BID-GTZ)<br />
Task 6: Potentials in r<strong>el</strong>ation to sustainability criteria<br />
Annex 7 Emissions of NOx from ethanol – gasoline blends<br />
Limits established for NOx emissions from gasoline automotive engines have changed, as w<strong>el</strong>l<br />
as for other pollutants. The experience with gasoline ethanol blends (besi<strong>de</strong>s the cases<br />
mentioned for Califonia and Brazil, Chapter 4.2.3) can be w<strong>el</strong>l illustrated by the Japanese<br />
studies in 2003 – 2004 (AIST 2005). In 2003, following the NEDO Ethanol Evaluation<br />
Program, tests were performed to evaluate blends of 3 and 10% ethanol in gasoline; emissions,<br />
materials and drivability were consi<strong>de</strong>red. For NOx emissions, tests were performed with:<br />
E3 blends, light vehicles (970 kg, 0.656 l displacement)<br />
E10 blends, small vehicles (1235 kg, 4 cylin<strong>de</strong>r, 1.386 L displacement)<br />
In both cases, the standard emission control system was a 3-way catalytic converter, with O 2<br />
sensor. Two test procedures were used: the 10.15 mo<strong>de</strong> and the 11. mo<strong>de</strong>.<br />
Results are shown in Table A7.1.<br />
Table A7.1 NOx emissions for gasoline – ethanol blends, (AIST 2005).<br />
Light Vehicle<br />
Small Vehicle<br />
10.15 mo<strong>de</strong><br />
NOx, g/km<br />
11. mo<strong>de</strong><br />
NOx, g/test<br />
10.15 mo<strong>de</strong><br />
NOx, g/km<br />
11. mo<strong>de</strong><br />
NOx, g/test<br />
Limits 0.030 0.550 0.020 0.350<br />
Gasoline (base) 0.004 0.050 0.002 0.011<br />
Blend, E-3 0.005 0.059<br />
Blend, E-10 0.003 0.010<br />
The main conclusion was that ethanol has a very small influence on the emissions, regarding<br />
the established limits. It is seen that the emissions from pure gasoline are ten times smaller<br />
than the Japanese specifications; and the increases in NOx (even if 20 or 50 % higher than for<br />
gasoline) also remain very low as compared to the specifications. This has led to some<br />
misun<strong>de</strong>rstang; it is always important to look at the absolute value of the emissions. It is seen<br />
that current (2003) technology allows reaching very low NOx emissions from ethanol blends<br />
(0.003 – 0.005 g/km, in the 10.15 mo<strong>de</strong>).<br />
The Brazilian emission limits for 2004 – 2012 are specified in (CONAMA 2005); the NOx<br />
limit values for light passenger cars are 0.25 g/km (2005) and 0.12 g/km (2009). However, the<br />
average values for light, new vehicles (Otto cycle) in 2001 were already 0.14 (gasoline C:<br />
22% ethanol) and 0.08 g/km (ethanol cars).<br />
Looking at the Mexican specifications, the Norma Oficial Mexicana NOM-042-SEMARNAT-<br />
2003 (7-9-2005) establishes the limits to emissions from automotive engines. It <strong>de</strong>termines<br />
the evolution of the limits for NOx consi<strong>de</strong>ring three standards (A, B, C) according to the<br />
vehicle fabrication year, its characteristics (passenger cars, light vans, utility/small trucks)<br />
durability standards (80000. and 100 000. km keeping the emission limit). Each manufacturer<br />
has to follow the “mix” of standards, changing the vehicle control lev<strong>el</strong>s gradually to a more<br />
strict specification, as <strong>de</strong>termined in the norm.<br />
93
<strong>Potenciales</strong> y <strong>Viabilidad</strong> <strong><strong>de</strong>l</strong> <strong>Uso</strong> <strong>de</strong> <strong>Bioetanol</strong> y <strong>Biodies<strong>el</strong></strong> <strong>para</strong> <strong>el</strong> Transporte en México (SENER-BID-GTZ)<br />
Task 6: Potentials in r<strong>el</strong>ation to sustainability criteria<br />
The limits for NOx evolve, for passenger cars, from 0.25 g/km (2004) to a long term value of<br />
0.068 g/km; and from 0.68 (2004) to 0.124 g/km, in the long term, for light trucks – class 4.<br />
94
<strong>Potenciales</strong> y <strong>Viabilidad</strong> <strong><strong>de</strong>l</strong> <strong>Uso</strong> <strong>de</strong> <strong>Bioetanol</strong> y <strong>Biodies<strong>el</strong></strong> <strong>para</strong> <strong>el</strong> Transporte en México (SENER-BID-GTZ)<br />
Task 6: Potentials in r<strong>el</strong>ation to sustainability criteria<br />
Bibliography<br />
AIST 2005. S. Goto, H. Shotani, K. Kinoshita, M. Oguma. Evaluation of Biomass Ethanol<br />
Application to Automotive Fu<strong>el</strong>; AIST (National Institute of Advanced Industrial Sciences<br />
and Technology), Clean Power System Group; Energy Technology Research Institute,<br />
Tsukuba, Japan. Presented to the Brazilian Ethanol Mission, January 2005.<br />
An<strong>de</strong>rson L. G. 1997. Effects of Using Oxygenated Fu<strong>el</strong>s on CO, Formal<strong>de</strong>hy<strong>de</strong> and<br />
Acetal<strong>de</strong>hy<strong>de</strong> Concentrations in Denver. Air and Wastes Management Association’s 90th<br />
Annual Meeting and Exhibition, Toronto, Canada<br />
An<strong>de</strong>rsson P. and Victorin K. 1996. Inhalation of Ethanol: Literature Survey and Risk<br />
Assessment. IMM- rapport 3/96. Institutet for Miljomedicin (Institute of Environmental<br />
Medicine), Karolinska Institute. Stockholm, Swe<strong>de</strong>n.<br />
Apace Research 1998. Intensive Fi<strong>el</strong>d Trial of Ethanol / Petrol Blends in Vehicles. Apace<br />
Research Ltd, EDRC Project 211, Australia.<br />
Armstrong S.R. 1999. Ethanol: brief report on its use in gasoline. Cambridge Environmental<br />
Inc. U.S.A.<br />
ANP 2001. Especificações <strong>para</strong> gasolinas. Portaria ANP 309/2001. Agencia Nacional do<br />
Petróleo, Rio <strong>de</strong> Janeiro.<br />
APPAMEX 2004. Producción y mercados nacionales <strong>de</strong> granos y oleaginosas. APPAMEX,<br />
IV Foro SIAP-Sagarpa 2004.<br />
Arrigoni E.B. 2005. Agrochemicals (pestici<strong>de</strong>s and others). In: Macedo I.C. Ed. Sugar Cane’s<br />
Energy: Tw<strong>el</strong>ve studies on Brazilian Sugar cane agribusiness and its sustainability. UNICA,<br />
São Paulo, Brazil.<br />
BBI 2005. Feasibilities Study for Ethanol from Maize and Sugarcane. BBI International<br />
Consulting, Gol<strong>de</strong>n, Colorado. Report to Fundación Emisión, Mexico.<br />
Bioenergéticos 2006. Dictámenes, Comisiones Unidas: Ley <strong>de</strong> Promicción y Desarrollo <strong>de</strong><br />
los Bioenergéticos. Senado <strong>de</strong> la República, abril 2006. Mexico DF<br />
Burnquist W. and Lan<strong><strong>de</strong>l</strong> M.G. 2005. Varieties and protection from diseases and pests. In<br />
Macedo I.C. Ed. Sugar Cane’s Energy: Tw<strong>el</strong>ve studies on Brazilian Sugar cane agribusiness<br />
and its sustainability. UNICA, São Paulo, Brazil.<br />
Camargo O.A.; et alii. 1987. Aplicação <strong>de</strong> vinhaça no solo e efeito no teor <strong>de</strong> nitrogênio,<br />
fósforo e enxofre inorgânicos e no <strong>de</strong> alguns metais pesados. Boletim Técnico IAC 8;<br />
Campinas, São Paulo.<br />
CARB 1999. Air Quality Impacts of the Use of Ethanol in California Reformulated Gasoline.<br />
Califórnia Air Resources Board, Sacramento, California.<br />
CARB 2004. California Air Resources Board Data Base. California, U.S.A.<br />
CETESB 1989. R<strong>el</strong>atório da Qualida<strong>de</strong> do Ar no Estado <strong>de</strong> São Paulo. Secretaria do Meio<br />
Ambiente do Estado <strong>de</strong> São Paulo, São Paulo, Brasil.<br />
95
<strong>Potenciales</strong> y <strong>Viabilidad</strong> <strong><strong>de</strong>l</strong> <strong>Uso</strong> <strong>de</strong> <strong>Bioetanol</strong> y <strong>Biodies<strong>el</strong></strong> <strong>para</strong> <strong>el</strong> Transporte en México (SENER-BID-GTZ)<br />
Task 6: Potentials in r<strong>el</strong>ation to sustainability criteria<br />
CETESB 2003. R<strong>el</strong>atório da Qualida<strong>de</strong> do Ar no Estado <strong>de</strong> São Paulo. Secretaria do Meio<br />
Ambiente do Estado <strong>de</strong> São Paulo, São Paulo, Brasil.<br />
CETESB 2004. R<strong>el</strong>atório da Qualida<strong>de</strong> do Ar no Estado <strong>de</strong> São Paulo. Secretaria do Meio<br />
Ambiente do Estado <strong>de</strong> São Paulo, São Paulo, Brasil.<br />
CFDC 1998. Ethyl Tertiary Butyl Ether. in Clean Fu<strong>el</strong>s: paving the way for America´s<br />
Future. Clean Fu<strong>el</strong>s Dev<strong>el</strong>opment Coalition, third edition, available in http://www.ethanolgec.org/clean/cf04.htm<br />
Clay J. 2004. World Agriculture and the Environment. WWF; Island Press, Washington,<br />
U.S.A.<br />
CNI 1990. Veículos Automotores, o Proálcool e a Qualida<strong>de</strong> do Ar. Confe<strong>de</strong>ração Nacional<br />
da Industria, Rio <strong>de</strong> Janeiro,Brasil.<br />
CONAMA 2002. RESOLUÇÃO Nº 315; Cons<strong>el</strong>ho Nacional do Meio Ambiente-CONAMA;<br />
Programa <strong>de</strong> Controle <strong>de</strong> Emissões Veiculares-PROCONVE, 29-10 2002; Brasilia.<br />
COAAZUCAR 2005. Desarrollo Operativo Histórico <strong>de</strong> Campo Fabrica 1988/2004. Comité<br />
<strong>de</strong> la Agroindustria Azucarera. www.coaazucar.org.mx, consult in May 2006<br />
Cotrim A.M. 2005. The pre<strong>para</strong>tion and distribution of ethanol-gasoline blends in Brazil. In<br />
Brazilian Technical Mission to Japan, UNICA-COIMEX, São Paulo, Brazil.<br />
DoE 1999. Ethanol for Sustainable Transportation. U.S. Dept. of Energy, U.S.A<br />
Donz<strong>el</strong>li J.L. 2005a. The use of fertilizers in Brazil’s sugar-cane production. In Macedo I.C.<br />
Ed. Sugar Cane’s Energy: Tw<strong>el</strong>ve studies on Brazilian Sugar cane agribusiness and its<br />
sustainability. UNICA, São Paulo, Brazil.<br />
Donz<strong>el</strong>li J.L. 2005b. Erosion in sugar-cane crops: situation and prospects. In Macedo I.C. Ed.<br />
Sugar Cane’s Energy: Tw<strong>el</strong>ve studies on Brazilian Sugar cane agribusiness and its<br />
sustainability. UNICA, São Paulo, Brazil.<br />
Drogos D. L. 2000. Santa Clara Valley Water District: Mealey’s MTBE Conference. Marina<br />
D<strong>el</strong> Rey, CA, U.S.A.<br />
Eggeman T. and Verser D. 2005. The importance of Utility Systems in Today’s and<br />
Tomorrow”s Biorefineries. National Renewable Energy Laboratory, Biomass Conference.<br />
Gol<strong>de</strong>n, CO.<br />
Elia Neto A. 2005. Water withdraw and use in sugar-cane processing. In: Macedo I.C. Ed.<br />
Sugar Cane’s Energy: Tw<strong>el</strong>ve studies on Brazilian Sugar cane agribusiness and its<br />
sustainability. UNICA, São Paulo, Brazil.<br />
Elia Neto A. and Nakahodo T. 1995. Caracterização físico-química da vinhaça. Project<br />
9500278, RT da Seção <strong>de</strong> Tecnologia <strong>de</strong> Tratamento <strong>de</strong> Águas, Centro <strong>de</strong> Tecnologia<br />
Copersucar, Piracicaba.<br />
El Sayed M.A., Matthews R. and Mortimer N.D. 2005. Production of Ethanol from Sugar<br />
Beet (Appendix Q); Carbon and Energy Balance for a range o f Biofu<strong>el</strong>s options, DTI Project<br />
B/B6,/00784, URN 03/083, London<br />
EPA 1998. EPA Oxygenates in water: Critical information and research needs; source,<br />
transport, transformation, occurrence, exposure, aquatic toxicity, health effects, r<strong>el</strong>ease<br />
prevention, contaminant removal. EPA/600/r98-048<br />
96
<strong>Potenciales</strong> y <strong>Viabilidad</strong> <strong><strong>de</strong>l</strong> <strong>Uso</strong> <strong>de</strong> <strong>Bioetanol</strong> y <strong>Biodies<strong>el</strong></strong> <strong>para</strong> <strong>el</strong> Transporte en México (SENER-BID-GTZ)<br />
Task 6: Potentials in r<strong>el</strong>ation to sustainability criteria<br />
Farr<strong>el</strong>l A E. 2006. Ethanol can contribute to Energy and Environmental Goals. Science 311.<br />
FAO 2002. FAOSTAT Statistical Database. Food and Agriculture Organization of the United<br />
Nations. Rome. Available at http://apps.fao.org<br />
FAO 2005. FAOSTAT Statistical Database. Food and Agriculture Organization of the United<br />
Nations. Rome. Available at http://apps.fao.org<br />
Ferreira E.S. and Monteiro A.O. 1987. Efeitos da aplicação da vinhaça nas proprieda<strong>de</strong>s<br />
químicas, físicas e biológicas do solo. Boletim Técnico Copersucar, São Paulo, 36:3-7.<br />
F O Lichts. 2004. World Ethanol and Fu<strong>el</strong>s Report. February 10.<br />
F O Lichts 2005. International Sugar and Sweetener Report. 137:27 September 09.<br />
Fulton L. and Howes T. 2004. Biofu<strong>el</strong>s for Transport: An International Perspective.<br />
International Energy Agency / EET; www.iea.org/books.<br />
Fulton L. 2005. Biofu<strong>el</strong>s Markets Around the World: A Long Term View. F. O. Lichts World<br />
Biofu<strong>el</strong>s, Seville, Spain<br />
Furey R.L. 1985. Volatility Characteristics of Gasoline-Alcohol and Gasoline-Ether Fu<strong>el</strong><br />
Blends. SAE Paper 852116, 1985<br />
Gol<strong>de</strong>mberg J. et al 2004. Ethanol learning curve – the Brazilian experience. Biomass and<br />
Bioenergy, 26, 2004<br />
Gue<strong>de</strong>s M., Gomes F.M. and Lepsch A.J. 2005. Fu<strong>el</strong> ethanol Logistics. In Brazilian<br />
Technical Mission to Japan, UNICA-COIMEX, São Paulo, Brazil.<br />
Ham<strong>el</strong>inck C. N., van Hooijdonk G. and Faaij A.P.C. 2005. Ethanol from lignoc<strong>el</strong>lulosic<br />
biomass: techno-economic performance in short, middle and long term. Biomass and<br />
Bioenergy 28: 384-410<br />
Haq Z.and Easterly J. R. 2005. Agricultural Residue Availability in the United States. Oral<br />
Presentation 1A-01, 7th Symposium on Biotechnology for Fu<strong>el</strong>s and Chemicals , Gol<strong>de</strong>n,<br />
Colorado<br />
IEA 2005. Biogas production and utilization. IEA Bioenergy Task 37- 2005-01.<br />
www.novaenergi/iea-bioenergy-task37/in<strong>de</strong>x.com<br />
INEGI 2001. Estados Unidos Mexicanos: VIII Censo Ejidal. Mexico D.F.<br />
Joseph Jr. H. 2005. The use of ethanol blends as regular fu<strong>el</strong> for existing vehicle fleets. In<br />
Brazilian Technical Ethanol Mission (Japan). UNICA / COIMEX, São Paulo, Brazil<br />
Kankio 2003. www.kankyo.metro.tokyo.jp/kouhou/english2003/in<strong>de</strong>x.html<br />
Koene R. and Puttmann W. 2005. Ersatz von MTBE durch ETBE: Ein Vorteil für <strong>de</strong>n<br />
Grundwasserschutz? J. W. Goethe-Universität Frankfurt am Main, Institut für Atmosphäre<br />
und Umw<strong>el</strong>t; Springer Berlin / Hei<strong><strong>de</strong>l</strong>berg, ISSN: 1430-483X<br />
Koizumi E. 2006. Personal communcatiton by Eduardo Y. Koizumi, São Paulo, 2006<br />
Lazcano-Martinez I. 2006a. Feasibility of Biomass Derived Ethanol as a Fu<strong>el</strong> for<br />
Transportation: Task 3, Overview of agricultural aspects; Project ME-T1007 - ATN/DO-9375-<br />
ME, Inter.-American Dev<strong>el</strong>opment Bank – IBD Technical Cooperation Program. Mexico,<br />
D.F.<br />
97
<strong>Potenciales</strong> y <strong>Viabilidad</strong> <strong><strong>de</strong>l</strong> <strong>Uso</strong> <strong>de</strong> <strong>Bioetanol</strong> y <strong>Biodies<strong>el</strong></strong> <strong>para</strong> <strong>el</strong> Transporte en México (SENER-BID-GTZ)<br />
Task 6: Potentials in r<strong>el</strong>ation to sustainability criteria<br />
Lazcano-Martinez I. 2006b. Feasibility of Biomass Derived Ethanol as a Fu<strong>el</strong> for<br />
Transportation: Task 4, Ethanol Feedstocks; Project ME-T1007 - ATN/DO-9375-ME, Inter.-<br />
American Dev<strong>el</strong>opment Bank – IBD Technical Cooperation Program, México, D.F.<br />
LMC 2004. Global Sugar to 2015. LMC International Report; Oxford, England<br />
LMC 2006. Carbohydrate Raw Materials: Food or Fu<strong>el</strong>?. Starch and Fermentation, LMC<br />
International, February 2006<br />
Macedo I.C 2004. Fatores Para a Competitivida<strong>de</strong> no Mercado Internacional. IV Conferência<br />
Internacional da DATAGRO sobre Açúcar e Álcool. S Paulo, Brasil<br />
Macedo I. C. 2005. Sugar Cane’s Energy: Tw<strong>el</strong>ve studies on Brazilian Sugar cane<br />
agribusiness and its sustainability. (Editor). UNICA, São Paulo, Brazil.<br />
Macedo I. C.; Leal M. R. and Silva J.R. 2003. Grenhouse gas emissions in the production<br />
and use of ethanol in Brazil: present situation (2002). Secretariat of the Environment of the<br />
State of São Paulo. 2003<br />
Macedo I. C. and Nogueira, L. A. H. 2005. Biocombustíveis. Ca<strong>de</strong>rnos NAE 02-2005,<br />
Núcleo <strong>de</strong> Assuntos Estratégicos da Presidência da Republica, NAE-SECOM PR, Brasília.<br />
Martinez N. 2006. Feasibility of Biomass-Derived Ethanol as a Fu<strong>el</strong> for Transportation;<br />
Activity 2, Mexico’s Energy Picture. Project ME-T1007 - ATN/DO-9375-ME. Inter.-<br />
American Dev<strong>el</strong>opment Bank – IBD Technical Cooperation Program, Mexico, D.F.<br />
Masera O. 2006. La Bioenergía em México. Comisión Nacional Forestal (CONAFOR).<br />
Mexico<br />
Masera O. and Prehn M. 2006. Feasibility of Biomass Derived Ethanol as a Fu<strong>el</strong> for<br />
Transportation: Task 1, Panorama económico <strong>de</strong> Mexico; Project ME-T1007 - ATN/DO-<br />
9375-ME, Inter.-American Dev<strong>el</strong>opment Bank – IBD Technical Cooperation Program,<br />
Mexico, D.F.<br />
MathPro 2005. Cost, Supply and Emissions Impacts of Adopting the CARB 3 Gasoline<br />
Standard for Arizona’s CBG. Final Report, MathPro Inc. and Meszler Eng. Services, ADEQ<br />
Contract EV03- 0021AZ, Task UO5-0056, 2005<br />
Miranda E.E. Dorado A.J. and Assunção J. V. 1994. Doenças respiratórias crônicas em<br />
quatro municípios paulistas. Internal Report, ECOFORÇA. Campinas, Brasil.<br />
MME 2005. Brazilian Energy Balance: Executive Summary. Ministério das Minas e Energia<br />
(MME). Brasília.<br />
Moraes M.A.F. 2005. Number and quality of jobs in the sugar cane agribusiness. In Sugar<br />
Cane’s Energy: Tw<strong>el</strong>ve studies on Brazilian Sugar cane agribusiness and its sustainability.<br />
UNICA, São Paulo, Brazil.<br />
NEIWPCC 2001. Health, Environmental and economic impacts of adding ethanol to gasoline<br />
in the Northeast States; New England Interstate Water Pollution Control Comission<br />
(NEIWPCC), and Northeast States for Coordinated Air Use Management. New England,<br />
U.S.A.<br />
98
<strong>Potenciales</strong> y <strong>Viabilidad</strong> <strong><strong>de</strong>l</strong> <strong>Uso</strong> <strong>de</strong> <strong>Bioetanol</strong> y <strong>Biodies<strong>el</strong></strong> <strong>para</strong> <strong>el</strong> Transporte en México (SENER-BID-GTZ)<br />
Task 6: Potentials in r<strong>el</strong>ation to sustainability criteria<br />
Nogueira L. A. H. 2006. Actividad 5: Producción y utilización <strong>de</strong> Etanol e ETBE en México:<br />
situación actual y perspectivas futuras. Feasibility of Biomass-Derived Ethanol as a Fu<strong>el</strong> for<br />
Transportation; Project ME-T1007 - ATN/DO-9375-ME.<br />
Overend R. P. 2001. Biogas from anaerobic digestion of aqueous streams and landfills (LFG).<br />
Workshop Interbio, Petrobrás / CENBIO, Rio <strong>de</strong> Janeiro, Brasil.<br />
Paes L. A. D. 2005. Emissions Control in Sugar Cane burning. In: Macedo I.C. Ed. Sugar<br />
Cane’s Energy: Tw<strong>el</strong>ve studies on Brazilian Sugar cane agribusiness and its sustainability.<br />
UNICA, São Paulo, Brazil.<br />
Paques 2005. Paques Reference System Worldwi<strong>de</strong>; October 2005<br />
Penatti C.P. 1999. Doses <strong>de</strong> vinhaça versus doses <strong>de</strong> nitrogênio em cana-soca durante quatro<br />
safras. Centro <strong>de</strong> Tecnologia Copersucar. R<strong>el</strong>atório Interno Copersucar / Usina São Luiz S.A.,<br />
Piracicaba, São Paulo.<br />
Poy M.E. 2005 a. Retos y perspectivas <strong>de</strong> la agroindústria <strong>de</strong> la caña <strong>de</strong> azúcar nacional bajo<br />
lãs condiciones <strong>de</strong> transición imperantes. Capacitación <strong>para</strong> la competitividad em fábricas <strong>de</strong><br />
azúcar; CIATEC, Querétaro.<br />
Poy M.E. 2005 b. Prospectiva <strong>de</strong> la competitividad <strong><strong>de</strong>l</strong>a producción azucarera em México y<br />
alternativas. Foro: La competencia económica <strong><strong>de</strong>l</strong> sector agropecuário Mexicano em <strong>el</strong> ámbito<br />
<strong><strong>de</strong>l</strong> libre comercio. UNAM, Mexico, D.F.<br />
Ricci Jr A. 2005a. Herbici<strong>de</strong>s and Pestici<strong>de</strong>s. In: Macedo I.C. Ed. Sugar Cane’s Energy:<br />
Tw<strong>el</strong>ve studies on Brazilian Sugar cane agribusiness and its sustainability. UNICA, São Paulo,<br />
Brazil.<br />
Ricci Jr A. 2005b. Protection of water sources and streams. In: Macedo I.C. Ed. Sugar<br />
Cane’s Energy: Tw<strong>el</strong>ve studies on Brazilian Sugar cane agribusiness and its sustainability.<br />
UNICA, São Paulo, Brazil.<br />
Rodríguez N. 2006. Activity 2. Mexico’s Energy Picture. Feasibility of Biomass-Derived<br />
Ethanol as a Fu<strong>el</strong> for Transportation. Project ME-T1007- ATN/DO-9375-ME<br />
SEMARNAT 2006. Especificaciones <strong>de</strong> los combustibles fósiles <strong>para</strong> la protección<br />
ambiental. Norma Oficial Mexicana NOM-086-SEMARNAT-SENER-SCFI. México, D.F.<br />
SENER 2005. Balance Nacional <strong>de</strong> Energia 2004. Mexico D.F.<br />
Sheehan J. 2000. Feedstock availability and the role of Bioethanol in climate change. 13th<br />
International Alcohol Fu<strong>el</strong>sSymposium, Stockholm, Swe<strong>de</strong>n.<br />
Sher E. 1998. Handbook of Air Pollution From Internal Combustion Engines. Aca<strong>de</strong>mic<br />
Press, USA<br />
Silva G. H. and Magalhães F.M. 1984. Anaerobic Digestion of Cassava Stillage. Petrobrás –<br />
CENPES/SINTEP 690-503. Rio <strong>de</strong> Janeiro<br />
Smeets E. Faaij A. and Lewandowski I. 2004. A quickscan of global bio-energy potentials to<br />
2050. RIVM Report NWS-E-2004-109, NOVEM, Copernicus Institute. The Netherlands<br />
Souza S.A . 2005a. Advances in the utilization of vinasse. In: Macedo I.C. Ed., Sugar Cane’s<br />
Energy: Tw<strong>el</strong>ve studies on Brazilian Sugar cane agribusiness and its sustainability. UNICA,<br />
São Paulo, Brazil.<br />
99
<strong>Potenciales</strong> y <strong>Viabilidad</strong> <strong><strong>de</strong>l</strong> <strong>Uso</strong> <strong>de</strong> <strong>Bioetanol</strong> y <strong>Biodies<strong>el</strong></strong> <strong>para</strong> <strong>el</strong> Transporte en México (SENER-BID-GTZ)<br />
Task 6: Potentials in r<strong>el</strong>ation to sustainability criteria<br />
Souza S.A . 2005b. Availability and use of water in Brazil; irrigation. In: Macedo I.C. Ed.,<br />
Sugar Cane’s Energy: Tw<strong>el</strong>ve studies on Brazilian Sugar cane agribusiness and its<br />
sustainability. UNICA, São Paulo, Brazil.<br />
Szwarc A. 2005. Use of Ethanol-Gasoline Blends and NO x Emissions. Internal Report,<br />
UNICA. S Paulo, Brasil.<br />
Thompson, R. and Campb<strong>el</strong>l, S. 2005. Pr<strong>el</strong>iminary feasibility study of ethanol production<br />
from sugar beets in NE Tasmania. RIRDC Publ. 05/12, DPIWE, Tasmania<br />
Trinda<strong>de</strong> S. 1985. Fu<strong>el</strong> ethanol Issues in Thailand. Report to UN/DTCT, Ref INT-120-4-<br />
R30-03-X, July 1985.<br />
UNDP. 2004. World Energy Assessment – WEA. Update.<br />
http//www.undp.org/energy/weaover2004.htm<br />
USDA. 2004. Net Energy Balance of Ethanol Production. Ethanol Across America.<br />
www.ethanolacrossamerica.net<br />
Walsh M. E. 2000. Biomass Feedstock Availability in the United States: 1999 State lev<strong>el</strong><br />
Analysis. ORNL, http//bioenergy.ornl.gov/resorcdata/in<strong>de</strong>x.html.<br />
Woods J. 2000. Integrating Sweet Sorghum and Sugarcane for Bioenergy; Mo<strong><strong>de</strong>l</strong>ling the<br />
Potential for Electricity and Ethanol Production in Zimbabwe. PhD Thesis, King’s College,<br />
London.<br />
Woods J. 2001. The potential for energy production with sweet sorghum in Southern Africa.<br />
Energy for Sustainable Dev<strong>el</strong>opment vol V: 1.<br />
Worldwatch Institute 2006. Biofu<strong>el</strong>s for Transportation: Global Potential and Implications<br />
for Sustainable Agriculture and Energy in the 21st. Century. Worldwatch Institute / BMLEV<br />
– GTZ – FNR, Washington DC<br />
WWW 2004. Sugar and the Environment. WWF - CABI Biosciences Report<br />
100
Task 7: Rationales, drivers and barriers for fu<strong>el</strong> ethanol and<br />
ETBE market introduction<br />
Sergio C. Trinda<strong>de</strong>
<strong>Potenciales</strong> y <strong>Viabilidad</strong> <strong><strong>de</strong>l</strong> <strong>Uso</strong> <strong>de</strong> <strong>Bioetanol</strong> y <strong>Biodies<strong>el</strong></strong> <strong>para</strong> <strong>el</strong> Transporte en México (SENER-BID-GTZ)<br />
Task 7: Rationales, drivers and barriers for fu<strong>el</strong> ethanol and ETBE market introduction<br />
1. Introduction<br />
Contents<br />
2. Synergies, Restrictions and Technical Options for Ethanol Fu<strong>el</strong>s in Mexico<br />
3. Mexico’s S<strong>el</strong>f-Sufficiency: agriculture versus energy<br />
4. Complexity of Issues Impacting the Market Penetration of Fu<strong>el</strong> Ethanol and ETBE in<br />
Mexico<br />
5. Market Penetration Scenarios for Ethanol and ETBE in Mexico<br />
6. Rationales for an Ethanol and ETBE Program in Mexico<br />
7. Matrix of Rationales, Drivers and Barriers
1. Introduction<br />
<strong>Potenciales</strong> y <strong>Viabilidad</strong> <strong><strong>de</strong>l</strong> <strong>Uso</strong> <strong>de</strong> <strong>Bioetanol</strong> y <strong>Biodies<strong>el</strong></strong> <strong>para</strong> <strong>el</strong> Transporte en México (SENER-BID-GTZ)<br />
Task 7: Rationales, drivers and barriers for fu<strong>el</strong> ethanol and ETBE market introduction<br />
This chapter dw<strong>el</strong>ls into the rationales, drivers and barriers for fu<strong>el</strong> ethanol and ETBE market<br />
introduction in Mexico. This is also summarized at the end of this chapter and re-examined in<br />
the report of Task #8. The chapter begins by analyzing the synergies, the restrictions and the<br />
technical options for ethanol fu<strong>el</strong>s in Mexico. It takes a close look at energy and agriculture<br />
s<strong>el</strong>f-sufficiency in the country. It then examines the complexity of issues in Mexico impacting<br />
on the market penetration of fu<strong>el</strong> ethanol and ETBE. It next reviews the market penetration<br />
scenarios for fu<strong>el</strong> ethanol and ETBE in Mexico, which were <strong>de</strong>v<strong>el</strong>oped in Task #2 and<br />
modified in Tasks #5 and #6. The chapter conclu<strong>de</strong>s with a matrix presentation of rationales,<br />
drivers and barriers.<br />
2. Synergies, Restrictions and Technical Options for Ethanol Fu<strong>el</strong>s<br />
in Mexico<br />
The introduction of a new fu<strong>el</strong>, such as fu<strong>el</strong> ethanol, in any market place, and Mexico is no<br />
exception to this rule, is always a complex task. Many interests and constituencies are<br />
involved in energy production, transport, storage, distribution and end-use. These stakehol<strong>de</strong>rs<br />
play a key role in the market penetration process. There are also lead times in any energy<br />
transition. Ethanol would face many barriers penetrating the gasoline pool, its natural market.<br />
In analyzing the Mexican prospects for fu<strong>el</strong> ethanol, the general rationale could be<br />
summarized as follows:<br />
1. Mexico is by and large a dry country, and thus would have limited opportunities to expand<br />
irrigated agriculture for energy purposes.<br />
2. Mexico imports food, thus there are limited prospects to consi<strong>de</strong>r corn, wheat and other<br />
staples for ethanol making, especially if they are based on irrigated agriculture, for water is an<br />
increasingly scarce resource in the country. Although roughly in balance regarding sugar<br />
production and consumption, some 2.5% of the domestic <strong>de</strong>mand for sugar is satisfied through<br />
imports. Applying these criteria, spent molasses from existing sugar mills and rain fed sugar<br />
cane appears to be the best immediate and short term feedstock options, respectiv<strong>el</strong>y, for<br />
ethanol making in Mexico. Furthermore, sugarcane juice based ethanol requires the least area<br />
to meet the future <strong>de</strong>mand scenarios; has the highest net energy ratio, and the highest carbon<br />
emission mitigation potential of all feedstocks consi<strong>de</strong>red.<br />
3. Mexico exports cru<strong>de</strong> oil, but imports some gasoline and MTBE. Thus, if economically<br />
competitive, ethanol could save imports and stretch gasoline resources, and postpone the need<br />
to invest in additional refining capacity to produce gasoline for the domestic market. An<br />
alternative approach would be to produce ethanol for the export market, especially the fast<br />
growing USA, particularly California, where Mexico is favorably placed, geographically and<br />
tra<strong>de</strong> wise, as a member of NAFTA.<br />
4. The sugar cane economy in Mexico is not healthy due in part to the government legislated<br />
and regulated growers/mills social compact. Sugar cane land owners today can receive (with 5<br />
ha) the value equivalent to three minimum wages. In other cultures the situation is different, as<br />
1
<strong>Potenciales</strong> y <strong>Viabilidad</strong> <strong><strong>de</strong>l</strong> <strong>Uso</strong> <strong>de</strong> <strong>Bioetanol</strong> y <strong>Biodies<strong>el</strong></strong> <strong>para</strong> <strong>el</strong> Transporte en México (SENER-BID-GTZ)<br />
Task 7: Rationales, drivers and barriers for fu<strong>el</strong> ethanol and ETBE market introduction<br />
40% of other workers get only one minimum wage. While this compact provi<strong>de</strong>s cane growers<br />
with a number of benefits, which could be part of a broa<strong>de</strong>r social security scheme provi<strong>de</strong>d to<br />
all workers, it raises the cost of converting sugar cane into sugar and into ethanol<br />
5. A possibly easy introduction of fu<strong>el</strong> ethanol could be achieved via ethanol ma<strong>de</strong> in<br />
distilleries to be annexed to sugar mills, provi<strong>de</strong>d the opportunity cost for molasses in the<br />
international market is not too high and the existing social compact is changed for ethanol<br />
making, while it may be kept for sugar making. This would lower the cost of molasses<br />
<strong>de</strong>dicated to ethanol making in Mexico.<br />
6. Expansion of ethanol making in Mexico must <strong>de</strong>pend on rain-fed pasture land or marginal<br />
land, and free from the existing sugarcane social compact. The benefits provi<strong>de</strong>d by the social<br />
compact should be achieved in a way that does not penalize the making of fu<strong>el</strong> ethanol. One of<br />
the major drivers of an ethanol program in Mexico would be the creation of thousands of new<br />
rural jobs, permanent, semi-permanent and occasional.<br />
7. Rain fed sugar cane agriculture may suffer occasional crop failures in Mexico. This could<br />
be compensated by occasional ethanol imports from world markets, ranging from neighboring<br />
countries to remote ones.<br />
8. According to the Mexican Constitution, PEMEX would be the sole buyer of fu<strong>el</strong> ethanol.<br />
Their inconveniences must be minimized, such as changes in refining processes, storage and<br />
handling infrastructure, and margins must not be penalized by an occasional higher price of<br />
fu<strong>el</strong> ethanol.<br />
9. PEMEX must make sure the retail network of gas stations is thoroughly inspected and<br />
maintained to receive ethanol gasoline blends (no water present in un<strong>de</strong>rground tanks prior to<br />
adding ethanol gasoline blends). The margins of the retail network must also not be penalized<br />
by occasional higher prices of ethanol.<br />
10. The Mexican auto industry must plan assistance to ol<strong>de</strong>r vehicle owners, with respect to<br />
changing materials in the vehicle in contact with the ethanol containing blend.<br />
11. Existing legislation, regulation and specifications need to be acknowledged and adjusted,<br />
if required, to the penetration of ethanol gasoline blends. If nee<strong>de</strong>d, new legislation, regulation<br />
and specifications must be <strong>de</strong>v<strong>el</strong>oped and implemented by the appropriate Mexican<br />
institutions.<br />
12. Financing the implementation of fu<strong>el</strong> ethanol in Mexico requires a specific package that is<br />
either contained in existing legislation and regulation or need to be complemented by<br />
additional measures. Fiscal mechanisms <strong>de</strong>rived from existing legislation and policies need to<br />
be acknowledged and adjusted, if required, to allow for the penetration of ethanol blends,<br />
without penalizing ethanol producers, PEMEX, retail stations or consumers.<br />
13. Mexican science and technology resources must be engaged to contribute a range of<br />
support initiatives from improved cane varieties to fermentation/distillation, and end use in<br />
vehicles. There is ample scope for productivity gains along the sugar cane ethanol productive<br />
chain. But, for these gains to be realized, a consi<strong>de</strong>rable effort in research, <strong>de</strong>v<strong>el</strong>opment and<br />
2
<strong>Potenciales</strong> y <strong>Viabilidad</strong> <strong><strong>de</strong>l</strong> <strong>Uso</strong> <strong>de</strong> <strong>Bioetanol</strong> y <strong>Biodies<strong>el</strong></strong> <strong>para</strong> <strong>el</strong> Transporte en México (SENER-BID-GTZ)<br />
Task 7: Rationales, drivers and barriers for fu<strong>el</strong> ethanol and ETBE market introduction<br />
<strong>de</strong>monstration is required. Among them, the reestablishment of a sugar cane variety<br />
improvement program is a must.<br />
14. Environmental groups need to be involved to h<strong>el</strong>p make sure overall environmental<br />
impacts are positive. While it is wi<strong><strong>de</strong>l</strong>y accepted that fermentation ethanol contributes to<br />
abating global warming, there is a need to achieve the same wi<strong>de</strong>spread acceptance of the<br />
benefits of ethanol for the local environment, from sugar cane agriculture to end-use.<br />
3. Mexico’s S<strong>el</strong>f-Sufficiency: agriculture versus energy<br />
The economic overview contained in Task #1 plots Mexico’s petroleum and agricultural<br />
exports (Fig. 5.1) and imports (Fig. 5.2) for the period 1996 through 2006. The figures are<br />
aggregates and may not reveal the whole truth about the r<strong>el</strong>ative s<strong>el</strong>f-sufficiency in those two<br />
rubrics. The graph b<strong>el</strong>ow plots the ratio of exports to imports of petroleum and r<strong>el</strong>ated<br />
products and agricultural goods, respectiv<strong>el</strong>y, expressed in US$. All points lie in the upper<br />
right quadrant, the s<strong>el</strong>f sufficient quadrant, where there is s<strong>el</strong>f sufficiency in both energy and<br />
agriculture.<br />
MEXICO'S SELF SUFFICIENCY<br />
RATIOS, US$ Value Based<br />
2<br />
AGRI SELF<br />
SUFFICIENCY<br />
1.5<br />
1<br />
0.5<br />
0<br />
0 2 4 6<br />
OIL SELF SUFFICIENCY<br />
Series1<br />
However, closer examination of the structure of the agricultural economy, domestic<br />
production, imports and exports, and apparent domestic consumption, shows that with respect<br />
to food commodities, Mexico is a net importer of wheat, corn, rice, grain sorghum, ordinary<br />
beans, soybeans and rapeseed. On the other hand, Mexico is a net exporter of higher value<br />
agricultural goods such as chiles, tomatoes and onions. Data from the report on Task #3 is<br />
plotted b<strong>el</strong>ow. S<strong>el</strong>f-sufficiency is measured as the ratio between domestic production and the<br />
apparent consumption (domestic production plus imports minus exports), both expressed in<br />
US $.<br />
3
<strong>Potenciales</strong> y <strong>Viabilidad</strong> <strong><strong>de</strong>l</strong> <strong>Uso</strong> <strong>de</strong> <strong>Bioetanol</strong> y <strong>Biodies<strong>el</strong></strong> <strong>para</strong> <strong>el</strong> Transporte en México (SENER-BID-GTZ)<br />
Task 7: Rationales, drivers and barriers for fu<strong>el</strong> ethanol and ETBE market introduction<br />
Mexico Agri S<strong>el</strong>f-Sufficiency,<br />
2004 US$ Values<br />
S<strong>el</strong>f-Sufficiency, %<br />
400<br />
350<br />
300<br />
250<br />
200<br />
150<br />
100<br />
50<br />
0<br />
81.5<br />
66.3 93.6<br />
37.8<br />
19.7<br />
2.90.2<br />
364.3<br />
288.6<br />
241.6<br />
Wheat, Corn, Rice, Grain Sorghum,<br />
Common Beans, Soybeans, Rape Seed,<br />
Chiles, Tomatoes, Onions<br />
Series1<br />
4. Complexity of Issues Impacting the Market Penetration of Fu<strong>el</strong><br />
Ethanol and ETBE in Mexico<br />
The complexity of issues impacting the market penetration of fu<strong>el</strong> ethanol and ETBE in<br />
Mexico is illustrated by the uncertainties about fu<strong>el</strong> ethanol cost, price and availability;<br />
legislative and regulatory support; assured market for fu<strong>el</strong> ethanol; flexibility to play the<br />
international market for ethanol; concessionary financing for implementing large scale rainfed<br />
sugar cane agriculture, large scale distilleries, storage, blending and distribution<br />
infrastructure, adaptation of ol<strong>de</strong>r vehicles to using ethanol gasoline blends; environmental<br />
impacts and public acceptance. This complexity is further <strong>de</strong>tailed as the profiles of the key<br />
stakehol<strong>de</strong>rs – further discussed in the report on Task #8 - in the potential Mexican fu<strong>el</strong><br />
ethanol economy are examined b<strong>el</strong>ow.<br />
PEMEX would be the sole buyer of fu<strong>el</strong> ethanol for blending with gasoline in Mexico. Its<br />
infrastructure would have to be ready to handle the new blends. This may entail changes in<br />
refining processes, to prepare gasoline blend stock for blending with ethanol; finding markets<br />
for displaced butanes and pentanes, which are removed to allow ethanol blending, while<br />
keeping the vapor pressure of the blend within specification; building and operating additional<br />
storage and blending capacity. Also, in the case of Scenario #1 b<strong>el</strong>ow, PEMEX ter-butyl ether<br />
plants would have to be ready to process ethanol into ETBE, which ordinarily would require<br />
4
<strong>Potenciales</strong> y <strong>Viabilidad</strong> <strong><strong>de</strong>l</strong> <strong>Uso</strong> <strong>de</strong> <strong>Bioetanol</strong> y <strong>Biodies<strong>el</strong></strong> <strong>para</strong> <strong>el</strong> Transporte en México (SENER-BID-GTZ)<br />
Task 7: Rationales, drivers and barriers for fu<strong>el</strong> ethanol and ETBE market introduction<br />
changing operational <strong>para</strong>meters of the existing MTBE plants. Since methanol would no<br />
longer be consumed in the MTBE plants, markets would have to be found for it.<br />
The Mexican fu<strong>el</strong> retail network would have to be technically equipped to handle the new<br />
blends containing fu<strong>el</strong> ethanol. They would need technical assistance from PEMEX to inspect,<br />
modify, if warranted, and maintain the fu<strong>el</strong> station infrastructure, especially un<strong>de</strong>rground<br />
storage tanks. Financing would be required to implement this revamping program. If the<br />
margins of the retail network are affected by s<strong>el</strong>ling the new blends, they will become a force<br />
of resistance to market penetration of fu<strong>el</strong> ethanol blends.<br />
If ethanol blends penetrate the market in Mexico, the members of the Mexican Automotive<br />
Industry Association - AMIA would need to make sure the vehicles sold would be fit to run on<br />
ethanol gasoline blends. The industry and its <strong>de</strong>alerships would also need to advise the owners<br />
of ol<strong>de</strong>r vehicles on the pre<strong>para</strong>tions and costs involved in having their vehicles ready for<br />
using ethanol gasoline blends.<br />
Presently, there is a limited production of molasses-base ethanol in Mexico for the potable and<br />
industrial market. Mexico is a net importer of ethanol for these same markets. This is possibly<br />
due to the high cost of molasses due in part to the existing sugar cane social compact, and to<br />
the high opportunity costs of molasses in international markets. According to the report of<br />
Task #5, during the period 1988-2004, the ethanol output in Mexico varied between 35 and 70<br />
thousand m 3 /a. The installed capacity of the annexed distilleries, which operated in the<br />
2002/2003 harvest, is of the or<strong>de</strong>r of 90 thousand m 3 /a, while the output was at a lev<strong>el</strong> of 40<br />
thousand m 3 /a in that harvest year. The total distillation capacity in Mexico is of the or<strong>de</strong>r of<br />
170 thousand m 3 /a. The anhydrous ethanol capacity resi<strong>de</strong>s in two mills in Vera Cruz with a<br />
total capacity of 33 thousand m 3 /a, some 20% of the total. If the lev<strong>el</strong> of perceived risk is<br />
lowered, the existing sugar mills could be encouraged to produce anhydrous ethanol, by<br />
adding <strong>de</strong>hydration units and whole distilleries to their mills, as required. This would provi<strong>de</strong><br />
for an early availability of fu<strong>el</strong> ethanol, which could meet at least part of the requirements of<br />
Scenario #1 b<strong>el</strong>ow. But, the longer term, large scale supply to meet Scenarios #2 and #3<br />
b<strong>el</strong>ow, would require larger investments in grass roots in<strong>de</strong>pen<strong>de</strong>nt sugar cane juice base<br />
ethanol making from new rain-fed sugar cane cultivation in pasture and marginal lands. The<br />
uncertainties associated with that approach would have to be mitigated accordingly, lest<br />
ethanol blending in Mexico would increasingly <strong>de</strong>pend on imports.<br />
Given that all potential feed stocks for ethanol making – corn, wheat, sugar beets, sweet<br />
sorghum, grain sorghum and cassava – other than sugar cane, have been discar<strong>de</strong>d on the basis<br />
of being food staples, either net imported and/or requiring irrigation to achieve reasonable<br />
yi<strong>el</strong>ds, and having net energy ratios and carbon emissions worse than sugar cane juice ethanol,<br />
and requiring larger cultivation areas to meet the same ethanol <strong>de</strong>mand, the sugar cane<br />
growers are the key farmers for a significant fu<strong>el</strong> ethanol program in Mexico. Following the<br />
historical land reform in Mexico and the implementation of the “ejido” system, the sugar cane<br />
growers have achieved, over time, a social compact with the mill owners, which provi<strong>de</strong>s the<br />
growers with benefits not generally enjoyed by other farmers in the country. While this is a<br />
positive achievement for the growers, the harvest costs of such a pulverized and uncoordinated<br />
system, ends up racking up the cost of sugar cane. Since the cost of ethanol is dominated by<br />
the cost of the feed stock, this situation makes ethanol unfeasible in Mexico today. However,<br />
Article 27 of the Mexican Cosntitution has been flexibilized to provi<strong>de</strong> for a transition from<br />
5
<strong>Potenciales</strong> y <strong>Viabilidad</strong> <strong><strong>de</strong>l</strong> <strong>Uso</strong> <strong>de</strong> <strong>Bioetanol</strong> y <strong>Biodies<strong>el</strong></strong> <strong>para</strong> <strong>el</strong> Transporte en México (SENER-BID-GTZ)<br />
Task 7: Rationales, drivers and barriers for fu<strong>el</strong> ethanol and ETBE market introduction<br />
social forma of land ownership to private land tenure. Over time, this may provi<strong>de</strong> for more<br />
efficient agriculture in Mexico. In the future, molasses based ethanol from existing mills and<br />
new large scale sugar cane juice based ethanol from pasture and marginal lands, would require<br />
a changes in the social compact applicable to sugar making in or<strong>de</strong>r to make fu<strong>el</strong> ethanol<br />
feasible.<br />
The financing organizations, public and private, including specific funds, existing and to be<br />
created, would play a significant role in materializing a fu<strong>el</strong> ethanol program in Mexico. The<br />
modifications un<strong>de</strong>r discussions in the “Ley Fe<strong>de</strong>ral <strong>de</strong> Derechos” could provi<strong>de</strong> a source of<br />
funding for the power generation associated with bagasse fu<strong>el</strong>ed <strong>el</strong>ectricity production. These<br />
discussions consi<strong>de</strong>r the internalization of externalities associated with energy generation and<br />
use, <strong>de</strong>rived from fossil fu<strong>el</strong>s, via levying specific charges. The revenue so generated could<br />
fund the incremental cost r<strong>el</strong>ative to fossil energy of renewable energies, such as fu<strong>el</strong> ethanol.<br />
The levy would be based on the r<strong>el</strong>ative emission of greenhouse gases such as CO 2 by the<br />
fossil fu<strong>el</strong> concerned compared to the renewable energy consi<strong>de</strong>red. The concept is similar to<br />
the levy on water as the recipient body of waste water discharges. This approach would also<br />
h<strong>el</strong>p Mexico meet its responsibilities as party to the Climate Convention and the Kyoto<br />
Protocol. This initiative could spur the ecological fiscal reform in Mexico, a matter that has<br />
been consi<strong>de</strong>red by both public and private sectors. There is even a proposal by a fe<strong>de</strong>ral<br />
representative to alter the “Ley Fe<strong>de</strong>ral <strong>de</strong> Derechos” to add article 253 B. This proposal<br />
specifies the amount of the levies to be applied to the various fossil fu<strong>el</strong>s used in Mexico and<br />
<strong>de</strong>scribes procedures for paying the levies and <strong>de</strong>stines the revenue to the Department of<br />
Energy – SENER, for funding renewable energies.<br />
Neverth<strong>el</strong>ess, a major legal framework affecting the implementation and the funding of fu<strong>el</strong><br />
ethanol can be found in the “Ley <strong>para</strong> <strong>el</strong> Aprovechamento <strong>de</strong> las Fuentes Renovables <strong>de</strong><br />
Energía”, approved by the Chamber of Deputies and now in the first reading in the Senate.<br />
Despite being overwh<strong>el</strong>mingly focused on power generation, the law makes specific reference<br />
to biofu<strong>el</strong>s, ethanol inclu<strong>de</strong>d, and establishes a Biofu<strong>el</strong>s Fund, to compensate for the cost<br />
differential between, say, ethanol and gasoline, within a larger “Fi<strong>de</strong>icomiso” managed by<br />
SENER. This Biofu<strong>el</strong>s Fund would be fun<strong>de</strong>d from a variety of sources and would share 7%<br />
of the total resources of the said “Fi<strong>de</strong>icomiso”. If there is an issue with this initiative it is that<br />
it dilutes biofu<strong>el</strong>s among a large number of renewable energies. In other words, there is no<br />
focus on biofu<strong>el</strong>s as such. Given that the potential scale of fu<strong>el</strong> ethanol in Mexico would be<br />
probably much larger than the other renewables, the funding sp<strong>el</strong>led out in the law seems<br />
ina<strong>de</strong>quate.<br />
A more central piece of legislation to fu<strong>el</strong> ethanol is the <strong>de</strong>cree of the “Ley <strong>para</strong> la Promoción<br />
y Desarrollo <strong>de</strong> Bioenergéticos”, which has been approved by the Chamber of Deputies and by<br />
the Chamber of Senators, whioch returned it to the Deputies for reconciliation. As is, the<br />
Decree <strong>de</strong>fines a maximum volume content of bio-ethanol for the formulation of gasolines at<br />
national lev<strong>el</strong>, and requests estimates of the investment required to build up a ethanol<br />
production infrastructure, as w<strong>el</strong>l as the support nee<strong>de</strong>d to consolidate and make feasible this<br />
initiative, driven by concerns over the national agricultural <strong>de</strong>v<strong>el</strong>opment of Mexico.<br />
In addition, there are a number of “Fi<strong>de</strong>icomisos” in Mexico, such as FIRA; the “Fi<strong>de</strong>icomiso<br />
<strong>de</strong> Comercialización” of SAGARPA; FIRCO – Fi<strong>de</strong>icomiso <strong>de</strong> Riesgo Compartido, <strong>de</strong>dicated<br />
to rural <strong>de</strong>v<strong>el</strong>opment; FEESA; Promotora Azucarera – PROASA; the FICOs and other<br />
6
<strong>Potenciales</strong> y <strong>Viabilidad</strong> <strong><strong>de</strong>l</strong> <strong>Uso</strong> <strong>de</strong> <strong>Bioetanol</strong> y <strong>Biodies<strong>el</strong></strong> <strong>para</strong> <strong>el</strong> Transporte en México (SENER-BID-GTZ)<br />
Task 7: Rationales, drivers and barriers for fu<strong>el</strong> ethanol and ETBE market introduction<br />
financial institutions, such as Nacional Financiera, Finaciera Rural and others, addressing the<br />
productive chains in the sugar cane r<strong>el</strong>ated industry and rural <strong>de</strong>v<strong>el</strong>opment that could be<br />
mobilized to fund the <strong>de</strong>v<strong>el</strong>opment of a national fu<strong>el</strong> ethanol program in the country.<br />
The support or opposition by environmental groups can make it easier or more difficult to<br />
implement a fu<strong>el</strong> ethanol economy in Mexico. Thus, their early engagement in the processes<br />
that lead to a national ethanol program seems important.<br />
The influence of organized consumer groups is similar to that of environmental groups, but<br />
they are lik<strong>el</strong>y to be more concerned with the total cost of operating vehicles, personal and<br />
commercial.<br />
As it has happened <strong>el</strong>sewhere, such as in Brazil and the USA, the <strong>de</strong>v<strong>el</strong>opment of large scale<br />
fu<strong>el</strong> ethanol generates a learning curve where technological improvements gradually lead to<br />
<strong>de</strong>creasing costs along the productive chain. Thus, the science and technology communities<br />
are lik<strong>el</strong>y to play a crucial role in supporting the penetration of fu<strong>el</strong> ethanol in Mexico’s<br />
economy on a broad range of fronts, from <strong>de</strong>v<strong>el</strong>oping the optimum slate of sugar cane<br />
varieties for the areas and climates where substrates would be grown to<br />
fermentation/distillation/stillage processing to end-use in spark ignition engines (Otto cycle<br />
engines). The “Ley <strong>para</strong> <strong>el</strong> Aprovechamento <strong>de</strong> las Fuentes Renovables <strong>de</strong> Energía”, which<br />
was anchored on a study by UNAM, contemplates a number of funds within its broad<br />
“Fi<strong>de</strong>icomiso” with a strong research, <strong>de</strong>v<strong>el</strong>opment and <strong>de</strong>monstration content.<br />
The governments at various lev<strong>el</strong>s (fe<strong>de</strong>ral, state and municipal), different branches<br />
(executive, legislative, judiciary) and various capacities (policy, institutional, financial,<br />
technological, etc.) have a key role too play to reflect the formal or informal consensus among<br />
the key stakehol<strong>de</strong>rs mentioned previously. The “Ley <strong>para</strong> <strong>el</strong> Aprovechamento <strong>de</strong> las Fuentes<br />
Renovables <strong>de</strong> Energía” could be an important mechanism for action by governments at all<br />
lev<strong>el</strong>s to support and promote fu<strong>el</strong> ethanol. The “Programa <strong>para</strong> <strong>el</strong> Aprovechamiento <strong>de</strong> las<br />
Fuentes Renovables <strong>de</strong> Energía”, which is the Action Plan of the law, will establish, inter alia,<br />
targets for the ethanol content of gasoline marketed in the country. The law says that PEMEX<br />
will purchase the ethanol required to satisfy such targets and will blend it into gasoline for<br />
markets all over Mexico or for specific regions. The “Ley <strong>para</strong> la Promoción y Desarrollo <strong>de</strong><br />
Bioenergéticos” may reinforce the provisions of the former law in promoting fu<strong>el</strong> ethanol.<br />
5. Market Penetration Scenarios for Ethanol and ETBE in Mexico<br />
The market penetration scenarios for ethanol and ETBE in Mexico in the time horizon<br />
consi<strong>de</strong>red for this study was originally <strong>de</strong>v<strong>el</strong>oped in Task #2 and adopted in a modified form<br />
in Tasks #5 and #6 (with special reference to Scenario No.3).<br />
7
<strong>Potenciales</strong> y <strong>Viabilidad</strong> <strong><strong>de</strong>l</strong> <strong>Uso</strong> <strong>de</strong> <strong>Bioetanol</strong> y <strong>Biodies<strong>el</strong></strong> <strong>para</strong> <strong>el</strong> Transporte en México (SENER-BID-GTZ)<br />
Task 7: Rationales, drivers and barriers for fu<strong>el</strong> ethanol and ETBE market introduction<br />
The scenarios from Task #2 are as follows:<br />
Scenario No.1 (Task #2):<br />
The domestic production of MTBE and TAME would be replaced by ETBE and TAEE, by<br />
substituting ethanol for methanol, respectiv<strong>el</strong>y, in the same PEMEX plants. MTBE imports<br />
would continue to satisfy the <strong>de</strong>mand for oxygenated gasolines in the Metropolitan Zones of<br />
Guadalajara, Monterrey and Valle <strong>de</strong> México.<br />
Scenario No. 2 (Task #2):<br />
The use of ethers in formulating gasolines would be discontinued. Ethanol would replace the<br />
ethers to formulate the oxygenated gasolines for the Metropolitan Zones.<br />
Scenario No.3 (Task #2):<br />
Ethanol would replace 10% of the volume of gasoline sold in Mexico, except the gasoline<br />
volume sold un<strong>de</strong>r Scenario No.2, where it would provi<strong>de</strong> a 2.0 % wt/wt oxygen content.<br />
The reports of Tasks #5 and #6 consi<strong>de</strong>red the Scenarios <strong>de</strong>v<strong>el</strong>oped un<strong>de</strong>r Task #2 and <strong>de</strong>fined<br />
the Scenarios as follows:<br />
Scenario No.1 (Tasks #5 and #6):<br />
Substitution of ethanol for methanol in the PEMEX ter-butyl ether plants to replace domestic<br />
MTBE and TAME by ETBE and TAEE, respectiv<strong>el</strong>y, while keeping MTBE imports to meet<br />
the requirements of the oxygenated gasolines in the Metropolitan Zones of Guadalajara,<br />
Monterrey and Valle <strong>de</strong> México.<br />
Scenario No.2 (Tasks #5 and #6):<br />
The use of ethers in formulating gasolines would be discontinued. Ethanol would replace the<br />
ethers to formulate the oxygenated gasolines at a 2% oxygen wt/wt for the Metropolitan<br />
Zones.<br />
Scenario No. 3 (Tasks #5 and #6):<br />
Use of a 10% v/v ethanol gasoline blend across the whole country, which corresponds to an<br />
oxygen content of 3.5% wt/wt, a concentration commonly found in many fu<strong>el</strong> ethanol<br />
consuming countries around the world.<br />
The major difference between the reports of Task #2 and Tasks #5 and #6 is Scenario No. 3,<br />
where the latter reports followed a more ambitious target of achieving 10% ethanol content in<br />
all gasolines consumed in Mexico, while Task #2 ma<strong>de</strong> an exception for the Metropolitan<br />
Zones, where currently there is a legal limit of 2.7% wtwt to the lev<strong>el</strong> of oxygen allowed in<br />
gasolines for alleged environmental reasons.<br />
The ethanol <strong>de</strong>mand for each scenario can be estimated on the basis of the consi<strong>de</strong>rations<br />
contained in report of Task #5, as <strong>de</strong>picted in the graph b<strong>el</strong>ow:<br />
8
<strong>Potenciales</strong> y <strong>Viabilidad</strong> <strong><strong>de</strong>l</strong> <strong>Uso</strong> <strong>de</strong> <strong>Bioetanol</strong> y <strong>Biodies<strong>el</strong></strong> <strong>para</strong> <strong>el</strong> Transporte en México (SENER-BID-GTZ)<br />
Task 7: Rationales, drivers and barriers for fu<strong>el</strong> ethanol and ETBE market introduction<br />
Producción y utilización <strong>de</strong> Etanol y ETBE en México:<br />
situación actual y perspectivas futuras<br />
Potential Fu<strong>el</strong> Ethanol Market in<br />
México<br />
Scenario<br />
Ethanol Demand<br />
(thousand m 3 /a)<br />
Foreign Exchange Savings from<br />
Avoi<strong>de</strong>d Imports of gasoline and<br />
MTBE<br />
(thouisand US$)<br />
1. ETBE replaces domestic MTBE<br />
production<br />
411.9<br />
185,355<br />
2. Complete substitution of ethanol<br />
at 5.7% v/v in 44% of Mexican<br />
gasoline (2% wt/wt oxygen)<br />
911.7<br />
410,265<br />
3. 10% ethanol in all Mexican<br />
gasoline (3.5% wt/wt oxygen)<br />
3,897.0<br />
1,753,650<br />
21<br />
The gradually increasing ethanol <strong>de</strong>mand, according to the three scenarios, suggests a path<br />
over time towards the market penetration of fu<strong>el</strong> ethanol into the Mexican economy.<br />
6. Rationales for an Ethanol and ETBE Program in Mexico<br />
The drivers and barriers to market penetration of fu<strong>el</strong> ethanol in the Mexican economy have<br />
been presented in the preceding discussion. They are further discussed b<strong>el</strong>ow and in the report<br />
of Task #8, in the context of the analysis of the stakehol<strong>de</strong>rs. The following is a review of the<br />
rationales for a possible fu<strong>el</strong> ethanol program in Mexico and borrows from the reports of<br />
Tasks #5 and #6.<br />
Economic<br />
Significant foreign exchange savings could be achieved by reducing gasoline and MTBE<br />
imports for the 10% ethanol blend of Scenario No. 3. This would lead to savings of up to US$<br />
1.75 billion (2005) and circa US$ 2.0 billion in 2010.<br />
The report on Task #5 established a reference “value” (parity or indifference cost) for ethanol<br />
when substituting for gasoline and MTBE as circa US$ 450/m 3 /. The economic analysis<br />
contained in the reports of Tasks #5 and #6 revealed that net economic result for fu<strong>el</strong> ethanol<br />
from Mexican raw materials in US$ /m 3 , including 28% taxes, is negative for all cases, with<br />
ethanol prices at US$ 450 /m 3 ; it is positive for the “conventional” combinations of<br />
biomass/technologies (sugar cane and corn) for ethanol prices between US$ 450/m 3 and US$<br />
550/m 3 . It remains negative for all new technologies, even at US$ 650/m 3 ethanol. The<br />
sensitivity analysis shows that for all the conventional technologies (based on sugar cane and<br />
9
<strong>Potenciales</strong> y <strong>Viabilidad</strong> <strong><strong>de</strong>l</strong> <strong>Uso</strong> <strong>de</strong> <strong>Bioetanol</strong> y <strong>Biodies<strong>el</strong></strong> <strong>para</strong> <strong>el</strong> Transporte en México (SENER-BID-GTZ)<br />
Task 7: Rationales, drivers and barriers for fu<strong>el</strong> ethanol and ETBE market introduction<br />
corn) the feedstock cost is the most important; 10% lower cane cost leads to 6% reduction in<br />
ethanol cost (4% in corn).<br />
The ethanol costs were based on estimated biomass cost, not price, for Mexico; if the average<br />
current corn prices in Mexico were used (US$ 173/t) the cost of ethanol would be 32% higher,<br />
at US$ 580/m 3 . The same applies to sugar cane; the KARBE price in 2005 (US$ 33/t cane)<br />
would lead to an ethanol cost of US$ 590/m 3 , or 37% higher. At this stage in the history of<br />
fu<strong>el</strong> ethanol in Mexico, its economic feasibility is marginal.<br />
This is why a package of concessionary finance and mandates, supported by legislation and<br />
regulation, are necessary to begin market penetration. As ethanol gains competitiveness in<br />
Mexico, these supporting mechanisms can be phased out. This was the case in mature ethanol<br />
markets such as in Brazil.<br />
As the scale of the fu<strong>el</strong> ethanol market expands in Mexico, the learning curve would kick in<br />
and provi<strong>de</strong> substantial reductions in cost with the improvements in technology throughout the<br />
productive chain. This is what happened in Brazil and the USA and this is lik<strong>el</strong>y to happen in<br />
Mexico as w<strong>el</strong>l.<br />
There is renewed interest in the world in the <strong>de</strong>v<strong>el</strong>opment of alcoholchemicals, as naphtha<br />
prices accompany the high prices trend of cru<strong>de</strong> <strong>de</strong>rived products. Should Mexico become a<br />
comeptitive producer of fu<strong>el</strong> ethanol, it would also open prospects for an alternative to its<br />
petrochemical industry, over the years.<br />
Equipment for ethanol production, alcoholchemicals and combined heat and power generation<br />
may have a nationalization in<strong>de</strong>x of nearly 100 percent in Mexico, creating jobs and<br />
strengthening the industry.<br />
Energy<br />
As the cru<strong>de</strong> oil resources of Mexico <strong>de</strong>cline gradually over future years, the country would do<br />
w<strong>el</strong>l to begin diversifying its energy supplies, improve overall efficiency and manage <strong>de</strong>mand.<br />
Recentl legislation - “Ley <strong>para</strong> <strong>el</strong> Aprovechamento <strong>de</strong> las Fuentes Renovables <strong>de</strong> Energía” - is<br />
a step into this direction. And ethanol has a role to play as part of a broad policy to lessen<br />
<strong>de</strong>pen<strong>de</strong>nce on fossil fu<strong>el</strong>s over the long run.<br />
Blending ethanol requires the gasoline blend stock to be stripped of azeotrope forming<br />
hydrocarbons, such as butanes and pentanes that raise the vapor pressure of the blend off<br />
specification. These butanes and pentanes may have difficulties finding markets other than<br />
lower value petrochemical feeds stocks. Neverth<strong>el</strong>ess, this issue has been <strong>de</strong>alt with in the past<br />
by large countries such as Brazil and the USA, which have adopted fu<strong>el</strong> ethanol blends.<br />
A fu<strong>el</strong> ethanol market in Mexico would offer opportunities for promoting regional integration<br />
in the context of NAFTA, where both the USA and Canada are adopting fu<strong>el</strong> ethanol in their<br />
pool of transportation fu<strong>el</strong>s. It would also provi<strong>de</strong> for integration with the Central American<br />
countries pursuing fu<strong>el</strong> ethanol programs.<br />
10
<strong>Potenciales</strong> y <strong>Viabilidad</strong> <strong><strong>de</strong>l</strong> <strong>Uso</strong> <strong>de</strong> <strong>Bioetanol</strong> y <strong>Biodies<strong>el</strong></strong> <strong>para</strong> <strong>el</strong> Transporte en México (SENER-BID-GTZ)<br />
Task 7: Rationales, drivers and barriers for fu<strong>el</strong> ethanol and ETBE market introduction<br />
Institutional<br />
Implementation of a large scale fu<strong>el</strong> ethanol program in Mexico requires substantial<br />
institutional capacity to implement legislation and regulation set up by the Mexican Congress<br />
and the Mexican Government, respectiv<strong>el</strong>y. The implementation of the “Ley <strong>para</strong> <strong>el</strong><br />
Aprovechamento <strong>de</strong> las Fuentes Renovables <strong>de</strong> Energía” will be very <strong>de</strong>manding on Mexican<br />
institutional resources. This could be compoun<strong>de</strong>d by the requirements of the “Ley <strong>para</strong> la<br />
Promoción y Desarrollo <strong>de</strong> Bioenergéticos”. A number of government bodies are lik<strong>el</strong>y to be<br />
involved requiring coordination and implementing capacity. At the same time, Mexican<br />
society has been able over history to respond to new challenges and should be able to mobilize<br />
its<strong>el</strong>f to address the issue of fu<strong>el</strong> ethanol, in the broa<strong>de</strong>r context of renewable energies.<br />
Among the valuable resources of Mexican society are its scientific and technological public<br />
and private institutions. A report by UNAM was the launching platform of the “Ley <strong>para</strong> <strong>el</strong><br />
Aprovechamento <strong>de</strong> las Fuentes Renovables <strong>de</strong> Energía”. These institutions will have their<br />
work cut out for them as the pressure of cost cutting ethanol making will require mobilization<br />
of expertise and innovation ranging from <strong>de</strong>v<strong>el</strong>oping a<strong>de</strong>quate sugar cane varieties for rain fed<br />
pasture and marginal lands all the way to the end-use of fu<strong>el</strong> ethanol. The Renewable Energies<br />
law acknowledges the role of science and technology in the market penetration of such<br />
energies in Mexico and creates specific funds to promote technological innovation, including<br />
for biofu<strong>el</strong>s, ethanol inclu<strong>de</strong>d.<br />
Legal and Regulatory<br />
A national fu<strong>el</strong> ethanol program in Mexico would require a host of policies, translated into<br />
legislation and regulation aimed at reducing the risk of potential investors; ensuring a steady<br />
supply of fu<strong>el</strong> ethanol to markets; creating rural jobs; saving foreign exchange; diminishing<br />
<strong>de</strong>pen<strong>de</strong>nce on fossil fu<strong>el</strong>s; promoting environmental quality; <strong>de</strong>v<strong>el</strong>oping the capital goods<br />
industry; mobilizing scientific and technological resources; and providing financing along the<br />
productive chain.<br />
The Mexican Renewable Energies law is certainly a crucial step in the direction of achieving<br />
the objectives enunciated above. The “Ley <strong>para</strong> la Promoción y Desarrollo <strong>de</strong> Bioenergéticos”<br />
would reinforce this move. Further legislation and regulations may be required to expedite<br />
market penetration of fu<strong>el</strong> ethanol. In this connection, presi<strong>de</strong>ntial lea<strong>de</strong>rship is certainly<br />
w<strong>el</strong>come as it h<strong>el</strong>ps mobilize resources and wills.<br />
But, in the end, no legislation or regulation will work, if it does not enjoy the consensus<br />
support of the key stakehol<strong>de</strong>rs in Mexico’s fu<strong>el</strong> ethanol economy.<br />
Social<br />
It is difficult to foresee the structure of ethanol production in Mexico in the future. Possibly<br />
two systems will coexist. One would be similar to today’s situation, that is, large number of<br />
land owners, small areas, some based on cooperatives. The other system would be based on<br />
much larger holdings. Suitable structures (for both systems) will lead to differences in job<br />
creation. Reaching 10% ethanol in all gasoline (Scenario No. 3) would lead to doubling the<br />
jobs in sugar cane agro-industry. New production structures (larger areas, mechanization and<br />
11
<strong>Potenciales</strong> y <strong>Viabilidad</strong> <strong><strong>de</strong>l</strong> <strong>Uso</strong> <strong>de</strong> <strong>Bioetanol</strong> y <strong>Biodies<strong>el</strong></strong> <strong>para</strong> <strong>el</strong> Transporte en México (SENER-BID-GTZ)<br />
Task 7: Rationales, drivers and barriers for fu<strong>el</strong> ethanol and ETBE market introduction<br />
automation) would lead to lower figures. Neverth<strong>el</strong>ess, job creation (at r<strong>el</strong>ativ<strong>el</strong>y low<br />
investment) could be one of the most important social contributions of the program.<br />
If priority is given to large scale sugar cane expansion in pasture and marginal lands, regional<br />
<strong>de</strong>v<strong>el</strong>opment in new areas would take place, creating jobs and promoting social infrastructures<br />
where few existed before.<br />
Reviewing and revising creativ<strong>el</strong>y the existing social compact between sugar cane growers<br />
and mills may offer an opportunity to maintain for the current beneficiaries and to expand<br />
social benefits for the rural workers not enjoying them presently. It is not a trivial assignment.<br />
It requires ingenuity and creativity, but without progress in this area the social cost of fu<strong>el</strong><br />
ethanol in Mexico may be too large for the key stakehol<strong>de</strong>rs to achieve a consensus in support<br />
of an ethanol program in the country.<br />
Environmental<br />
Sugar cane based ethanol is far superior to other feed stocks in terms of net energy ratio.<br />
Sugarcane, in contrast with corn and other feed stocks, generates its own process fu<strong>el</strong> – the<br />
bagasse. If expertly <strong>de</strong>signed a distillery (and sugar mill) can supply all its energy<br />
requirements and export surplus <strong>el</strong>ectricity. This translates into the highest CO 2 mitigation<br />
values among competing feed stocks. Hence, sugar cane ethanol may give a substantial<br />
contribution for reducing greenhouse gas emissions.<br />
Crop wastes such as leaves and trash can also be ad<strong>de</strong>d to bagasse to generate even more<br />
surplus energy. The main liquid waste from ethanol distilleries – stillage or vinasse – can be a<br />
source of fertilization-irrigation for its potassium content and <strong>de</strong>gree of dilution. Sugar cane<br />
land is usually rotated with nitrogen fixing plants such as peanuts, which enriches and<br />
preserves soil quality.<br />
When used as a fu<strong>el</strong>, ethanol requires the gasoline blend stock to be free of light hydrocarbons,<br />
to keep vapor pressure of the blend within specification and limit evaporative losses of volatile<br />
organic compounds. Burning ethanol in a gasoline blend <strong>de</strong>creases the emissions of CO and<br />
unburned hydrocarbons due to fuller combustion. It may or may not increase NO x emissions.<br />
Neverth<strong>el</strong>ess, the NO x emission lev<strong>el</strong>s in California after the adoption of 5.7% v/v ethanol<br />
blends has not increased. Al<strong>de</strong>hy<strong>de</strong> emissions do increase, especially of the less harmful<br />
acetal<strong>de</strong>hy<strong>de</strong>, but the emission lev<strong>el</strong> is w<strong>el</strong>l un<strong>de</strong>r the limits established by the World Health<br />
Organization.<br />
Food security<br />
The <strong>de</strong>v<strong>el</strong>opment of sugar cane agriculture geared towards ethanol is lik<strong>el</strong>y to improve the<br />
competitiveness of sugar making in Mexico and allow it to penetrate the US market, which<br />
will open to Mexican sugar by 2008. In time, it may also h<strong>el</strong>p Mexico fight off the fructose<br />
invasion from the US. It may also have a positive impact in Mexican agriculture in general,<br />
improving food security.<br />
The adoption of sugar cane juice as the major source of fu<strong>el</strong> ethanol in Mexico leads to the<br />
lowest area requirements of all other alternative feed stocks. Regarding food security, this is a<br />
12
<strong>Potenciales</strong> y <strong>Viabilidad</strong> <strong><strong>de</strong>l</strong> <strong>Uso</strong> <strong>de</strong> <strong>Bioetanol</strong> y <strong>Biodies<strong>el</strong></strong> <strong>para</strong> <strong>el</strong> Transporte en México (SENER-BID-GTZ)<br />
Task 7: Rationales, drivers and barriers for fu<strong>el</strong> ethanol and ETBE market introduction<br />
positive trait of sugar cane for it would limit the land competition between food and fu<strong>el</strong><br />
crops.<br />
The foreign exchange savings <strong>de</strong>rived from the potential Mexican fu<strong>el</strong> ethanol industry ad<strong>de</strong>d<br />
to carbon credit revenue in the future will further strengthen food security in Mexico as it<br />
provi<strong>de</strong>s foreign exchange for occasional food imports, if warranted.<br />
7. Matrix of Rationales, Drivers and Barriers<br />
Rationale Drivers Barriers<br />
Economic Foreign exchange savings Ether making interests<br />
Achieve competitive ethanol High sugar cane costs<br />
Learning curve<br />
Lack of scale<br />
Ethanol chemicals<br />
Petrochemical interests<br />
Capital goods industry opportunities Investment uncertainties<br />
Energy Dwindling oil resources Oil industry interests<br />
Energy diversification<br />
Refining process changes<br />
Regional energy integration Integration resistance<br />
Institutional Implementing Renewables Law Lack of focus on biofu<strong>el</strong>s<br />
Implementing Biofu<strong>el</strong>s Law Inter-secretariat coordination<br />
Presi<strong>de</strong>ntial lea<strong>de</strong>rship<br />
Stakehol<strong>de</strong>r consensus absent<br />
Science/technology opportunities Market disconnect<br />
Legal & Regulatory Renewable Energies Law Lack of focus on biofu<strong>el</strong>s<br />
Biofu<strong>el</strong>s Law<br />
Inter-secretariat coordination<br />
Presi<strong>de</strong>ntial lea<strong>de</strong>rship<br />
Stakehol<strong>de</strong>r consensus absent<br />
Social Job creation Sugar cane social contract<br />
Revision sugar cane social contract Current land tenure pattern<br />
Expanding rural social infrastructure Investment uncertainties<br />
Environmental GHG mitigation Ina<strong>de</strong>quate investment in<br />
Carbon credit revenues<br />
sugar cane energy mgt<br />
Stillage recycle<br />
Ina<strong>de</strong>quate water mgt<br />
Soil quality maintenance<br />
Lack of technology transfer<br />
Air quality improvement<br />
Misleading information<br />
Food Security Increased sugar competitiveness US fructose invasion<br />
Improved agri-practices generally US protectionism<br />
Minimum area required by sugar Sugar cane social contract<br />
cane juice<br />
13
Task 8: Synthesis and recommendations<br />
Sergio C. Trinda<strong>de</strong>
<strong>Potenciales</strong> y <strong>Viabilidad</strong> <strong><strong>de</strong>l</strong> <strong>Uso</strong> <strong>de</strong> <strong>Bioetanol</strong> y <strong>Biodies<strong>el</strong></strong> <strong>para</strong> <strong>el</strong> Transporte en México (SENER-BID-GTZ)<br />
Task 8: Synthesis and recommendations<br />
Summary for Policy Makers<br />
This report contains a comprehensive analysis of the prospects of bioethanol as a fu<strong>el</strong> for<br />
transportation in Mexico. It was sponsored by the Inter-American Dev<strong>el</strong>opment Bank un<strong>de</strong>r<br />
project “Feasibility of Biomass-Derived Ethanol as a Fu<strong>el</strong> for Transportation (Project ME-<br />
T1007 – ATN/DO-9375-ME)” and coordinated by SENER. A <strong>para</strong>ll<strong>el</strong> study on biodies<strong>el</strong>,<br />
sponsored by GTZ and coordinated by SENER, was carried out se<strong>para</strong>t<strong>el</strong>y and is not reported<br />
here. This bioethanol study engaged both Mexican and international consultants in a number<br />
of Tasks. They covered the key issues for fu<strong>el</strong> ethanol in Mexico: the economy; energy<br />
picture, especially the oil industry; agriculture; biomass feed stocks for ethanol production;<br />
economic assessment of the production and use of ethanol; sustainability of ethanol and<br />
rationales, drivers and barriers to the penetration of fu<strong>el</strong> ethanol into Mexico’s economy.<br />
Essentially, the overall conclusion is that there is a limited, but important, opportunity for<br />
Mexico to embark on a gradual fu<strong>el</strong> ethanol program. Thus, fu<strong>el</strong> ethanol, initially based on<br />
sugar cane molasses and from ethanol making projects currently un<strong>de</strong>r consi<strong>de</strong>ration from<br />
other feed stocks, such as maize, would replace methanol in domestically produced ethers<br />
(MTBE and TAME) to make ETBE, before 2012. Ethanol as a component of domestically<br />
produced ETBE, would correspond to a 5.7% volume ethanol penetration in a fraction of the<br />
gasolines that are currently being blen<strong>de</strong>d with domestic MTBE and TAME, that is, those<br />
supplied to the Metropolitan Zones. By 2012, and based on sugar cane juice ethanol from new<br />
rain fed cultivation in pasture and marginal lands, and on ethanol making projects that might<br />
be <strong>de</strong>v<strong>el</strong>oped from other feed stocks, replacement of 5.7 % of all gasolines in Metropolitan<br />
areas would take place. In the long run, and based on sugar cane and possibly other feed<br />
stocks, such as multiple annual crop sweet sorghum, or maize, 10 % of all gasoline in Mexico<br />
could be replaced by ethanol, from 2012 onwards. Throughout these <strong>de</strong>v<strong>el</strong>opments, there<br />
might be opportunities for exports and imports of fu<strong>el</strong> ethanol, directly or as ETBE.<br />
The size that a gradual fu<strong>el</strong> ethanol program could achieve in Mexico and the foreign<br />
exchange savings that could be obtained is suggested b<strong>el</strong>ow, with values based on estimates<br />
for 2010:<br />
Scenario<br />
Fu<strong>el</strong> ethanol<br />
<strong>de</strong>mand thousand<br />
m 3 /a)<br />
Foreign exchange savings from<br />
displacing imports of gasoline and<br />
MTBE(thousand US$)<br />
Prior to 2012: #1. Domestic MTBE<br />
replaced by ETBE<br />
By 2012: #2. Total replacement of<br />
ethers by ethanol at 5.7% v/v<br />
From 2012 onwards: #3b. Ethanol 10%<br />
v/v blend becomes standard gasolines<br />
in Mexico<br />
411.9 185,355<br />
1,110.6 499,500<br />
4,406.3 1,982,835<br />
1
<strong>Potenciales</strong> y <strong>Viabilidad</strong> <strong><strong>de</strong>l</strong> <strong>Uso</strong> <strong>de</strong> <strong>Bioetanol</strong> y <strong>Biodies<strong>el</strong></strong> <strong>para</strong> <strong>el</strong> Transporte en México (SENER-BID-GTZ)<br />
Task 8: Synthesis and recommendations<br />
In launching, the fu<strong>el</strong> ethanol program in Mexico from the existing sugar cane molasses<br />
production capacity to satisfy Scenario # 1 above, that is, 412 thousand m 3 /a, no additional<br />
cultivated area would be required. Ethanol projects currently un<strong>de</strong>r planning and<br />
implementation from other feed stocks, such as maize, could lessen the <strong>de</strong>mand on molasses<br />
as the sole source of ethanol in the short term. There would be a small expansion of jobs in<br />
distilleries. Two to four <strong>de</strong>hydration plants to make anhydrous ethanol from the present<br />
capacity of hydrous ethanol production and some 10 new annexed distilleries would be built to<br />
process the molasses of those mills that currently do not possess fermentation and distillation<br />
capacity. To achieve this target an investment of about US$ 160 million would be nee<strong>de</strong>d over<br />
the next few years.<br />
The specific <strong>de</strong>tails of the next two stages of implementation, corresponding to Scenarios #2<br />
and #3b would <strong>de</strong>pend on the choice of feed stocks. But, assuming the dominant feed stock to<br />
be sugar cane juice, achieving a 10% fu<strong>el</strong> ethanol blend all over Mexico would double the<br />
present number of jobs in the industry, with the addition of some 400 thousand new jobs. The<br />
area nee<strong>de</strong>d would reach some 800 thousand hectares, more than doubling the current area<br />
un<strong>de</strong>r sugar cane in Mexico. It is worth noting that, within the limits of the proposed<br />
Scenarios, the land requirements can be met apparently without compromising food<br />
production. The investment in the 45 sugar cane juice in<strong>de</strong>pen<strong>de</strong>nt distilleries would require<br />
US$ 2.25 billion distributed over a number of years and going beyond 2012.<br />
Mexico would benefit from introducing fu<strong>el</strong> ethanol in many ways: job creation; rural<br />
economy <strong>de</strong>v<strong>el</strong>opment; expansion of social infrastructures in rural areas; improvement in<br />
energy security; petroleum resource conservation; better water management; expanding<br />
agriculture into drier lands by cultivating resilient crops, such as multiple annual crops sweet<br />
sorghum; foreign exchange savings; motivating the science and technology community;<br />
incentives to the capital goods industry; local and global environment enhancement.<br />
Mexican fe<strong>de</strong>ral legislatures have almost conclu<strong>de</strong>d work on two pieces of legislation that are<br />
central to the implementation of fu<strong>el</strong> ethanol in the country. These are the Law on Renewables<br />
and the Law on Bioenergy. Neverth<strong>el</strong>ess, un<strong>de</strong>rstanding the rationales, drivers and barriers as<br />
w<strong>el</strong>l as the motivations of the key fu<strong>el</strong> ethanol stakehol<strong>de</strong>rs will h<strong>el</strong>p build up the consensus<br />
that will make it possible to move fu<strong>el</strong> ethanol into the market place in Mexico, within the<br />
legal framework created by the laws and regulations on the matter. Based on this platform,<br />
political lea<strong>de</strong>rship, presi<strong>de</strong>ntial and congressional, could make a difference in expediting the<br />
transition toward the limited, albeit important, role of fu<strong>el</strong> ethanol in the future of Mexico.<br />
Such political lea<strong>de</strong>rship would be nee<strong>de</strong>d to address, inter alia, a major issue: the existing<br />
social compact between sugar cane growers and mills. This process may offer an opportunity<br />
to maintain for the current beneficiaries and to expand social benefits for the rural workers not<br />
enjoying them presently. It is not a trivial task. It requires ingenuity and creativity, but unless<br />
progress in this area the cost of fu<strong>el</strong> ethanol in Mexico may be too large for the key<br />
stakehol<strong>de</strong>rs to achieve a consensus in support of an ethanol program in the country.<br />
2
<strong>Potenciales</strong> y <strong>Viabilidad</strong> <strong><strong>de</strong>l</strong> <strong>Uso</strong> <strong>de</strong> <strong>Bioetanol</strong> y <strong>Biodies<strong>el</strong></strong> <strong>para</strong> <strong>el</strong> Transporte en México (SENER-BID-GTZ)<br />
Task 8: Synthesis and recommendations<br />
The Mexican Economy<br />
The Mexican economy is strongly <strong>de</strong>pen<strong>de</strong>nt on the oil and gas resources and remittances<br />
from Mexican expatriates (2.3 % of the GDP in 2005). It <strong>de</strong>pends importantly on the state of<br />
the US economy to which 90% of Mexican exports are <strong>de</strong>stined (Masera and Prehn, 2006) and<br />
from which it receives the bulk of the foreign direct investment. The <strong>de</strong>ficits in the current<br />
accounts have been amply covered by the surplus in capital account and remittances. The<br />
economy has become more open and vulnerable, especially since the signing of NAFTA.<br />
There is a consensus that Mexico needs to diversify production and exports, including in<br />
agriculture.<br />
Reducing gasoline and MTBE imports for a scenario where all gasolines in Mexico are 10%<br />
ethanol blends would lead to savings of up to US$ 2.0 billion in foreign exchange in 2010.<br />
Sales of carbon credits via CDM projects could potentially add to this benefit.<br />
Equipment for ethanol production and combined heat and power generation, in the case of<br />
sugar cane bagasse, may have a nationalization in<strong>de</strong>x of nearly 100 percent in Mexico,<br />
creating quality jobs and strengthening the industry.<br />
Mexican Oil Scene and the Ethanol Scenarios<br />
While the country is a net exporter of cru<strong>de</strong>, it imports gasoline and MTBE. Three ethanol<br />
market scenarios were <strong>de</strong>v<strong>el</strong>oped to serve as a basis for economic and sustainability analysis.<br />
Scenario #1 consi<strong>de</strong>red using ethanol to replace methanol in domestic MTBE and TAME<br />
production to make ETBE in existing ether plants. Scenario #2 postulated the total phase out<br />
of the use of ethers as gasoline oxygenates and their replacement with fu<strong>el</strong> ethanol at a 5.7%<br />
v/v to maintain a 2.0 % wt/wt oxygen concentration in oxygenated gasoline in Mexico.<br />
Scenario #3b was simplified from an initial formulation (Rodriguez, 2006) to consi<strong>de</strong>r all<br />
gasoline in Mexico to contain 10% ethanol v/v. This would be equivalent to 3.5% oxygen<br />
wt/wt content in gasolines in the Metropolitan areas, which may require a revision of the<br />
current Norm (NOM-086 NOM-086-SEMARNAT-SENER-SCFI-2005).<br />
The findings in Annex I in the report of Task#7 suggest that the 2.0% oxygen limit (by<br />
weight) needs to be revisited The graph b<strong>el</strong>ow <strong>de</strong>picts the ethanol <strong>de</strong>mand from the three<br />
scenarios un<strong>de</strong>r two gasoline <strong>de</strong>mand growth rates (3% and 3.3% per annum). Mexico is<br />
currently an importer of ethanol for potable and industrial uses. It has produced some 40<br />
thousand m 3 /a, and has an installed capacity four times larger. Consequently, the<br />
implementation of a large scale fu<strong>el</strong> ethanol industry in Mexico, in addition to saving on<br />
petroleum products imports, would permit the country to save on ethanol imports and may<br />
generate opportunities for export.<br />
3
<strong>Potenciales</strong> y <strong>Viabilidad</strong> <strong><strong>de</strong>l</strong> <strong>Uso</strong> <strong>de</strong> <strong>Bioetanol</strong> y <strong>Biodies<strong>el</strong></strong> <strong>para</strong> <strong>el</strong> Transporte en México (SENER-BID-GTZ)<br />
Task 8: Synthesis and recommendations<br />
5,000<br />
mil m 3 crecimiento <strong><strong>de</strong>l</strong> mercado a 3.0%<br />
4,000<br />
3,000<br />
crecimiento <strong><strong>de</strong>l</strong> mercado a 3.3%<br />
2,000<br />
1,000<br />
0<br />
Escenario 1 (2005) Escenario 2 (2010) Escenario 3 (2010)<br />
Agriculture in Mexico<br />
Agricultural productivity has increased in Mexico lat<strong>el</strong>y, but there is room for further<br />
improvement, freeing more area to cultivation. Irrigation, if and when possible, would play an<br />
important role in productivity growth. But, although the agricultural economy has been<br />
progressing steadily, Mexico is a net importer of staple foods. Changes will continue, and their<br />
influence in any agricultural program must be factored in. In recent years, Mexican agriculture<br />
has become more open and more market-oriented.<br />
Agriculture uses some 16% of the area of the country, or 30 million ha. In 2003 the total<br />
cultivated area was 21.8 million ha (16.7 rain fed and 5 irrigated). Pasture land covers a<br />
similar area (27.7 million ha), and in some regions (South-Southeast) it could be partially used<br />
for energy crops (Lazcano, 2006a). The s<strong>el</strong>f-sufficiency in food production, though not an<br />
objective per se, would need an additional 5 million ha to the 21.8 million ha used in 2003, at<br />
today’s productivities. Land tenure, which had been ruled by Article 27 of the Constitution, is<br />
evolving slowly since 1992, from social ownership towards private ownership.<br />
Agriculture in Mexico poses special economic challenges with strong social implications. For<br />
example, today the Mexican sugar industry cannot compete with imported maize-based<br />
fructose. Export prices for sugar are lower than allowed by the KARBE price paid for sugar<br />
cane (Lazcano, 2006b). These issues arise from the small scale cane production and the<br />
KARBE price setting system that does not a<strong>de</strong>quat<strong>el</strong>y integrate the mutual interests of cane<br />
growers and mill owners. Conceptually speaking, sugar cane production and processing offer<br />
opportunities for new markets, higher efficiencies and lower costs, but the social compact<br />
ruling the industry requires review and revision.<br />
In this connection, the Brazilian experience in the State of São Paulo might be of interest. The<br />
agreement reached between growers and producers, in bilateral negotiations without<br />
government intervention, is based on a <strong>para</strong>metric mo<strong><strong>de</strong>l</strong> that integrates the mutual interests of<br />
4
<strong>Potenciales</strong> y <strong>Viabilidad</strong> <strong><strong>de</strong>l</strong> <strong>Uso</strong> <strong>de</strong> <strong>Bioetanol</strong> y <strong>Biodies<strong>el</strong></strong> <strong>para</strong> <strong>el</strong> Transporte en México (SENER-BID-GTZ)<br />
Task 8: Synthesis and recommendations<br />
the two si<strong>de</strong>s. It is <strong>de</strong>scribed in Annex III. Opportunities, such as diversification to ethanol<br />
(and <strong>el</strong>ectricity co-generation) may be h<strong>el</strong>p strengthen the whole sugar cane agro-industry.<br />
Nature in Mexico is such that 61 percent of the land area is consi<strong>de</strong>red dry (45 percent with a<br />
severe humidity <strong>de</strong>ficit), with arid or semi-arid climate. Water, an increasingly scarce resource<br />
in view of the expanding <strong>de</strong>mands from a growing population, needs to be wis<strong>el</strong>y managed<br />
and serve the needs of food crops first. Thus, the <strong>de</strong>v<strong>el</strong>opment of fu<strong>el</strong> ethanol feed stocks that<br />
are resilient and less water <strong>de</strong>manding, such as could be the case of multiple annual crops<br />
sweet sorghum, should be in the forefront of research in support of fu<strong>el</strong> ethanol in Mexico.<br />
Ethanol Feed Stocks in Mexico<br />
Sugar cane, maize, yuca, sorghum and sugar beet were consi<strong>de</strong>red for conversion into fu<strong>el</strong><br />
ethanol, with existing mature technologies and in the case of sugar cane, a speculative<br />
consi<strong>de</strong>ration of the technology of making additional fu<strong>el</strong> ethanol from bagasse was analyzed.<br />
The short listed feed stocks for ethanol making were sugar cane and maize. The s<strong>el</strong>ection<br />
criteria used were: availability of mature technology, costs, investment requirements, area<br />
nee<strong>de</strong>d, energy ratio and GHG emissions and mitigation.<br />
On the one hand, the annual yi<strong>el</strong>ds consi<strong>de</strong>red for maize, at 10 t/ha, would require irrigation<br />
and other inputs to bring productivity way up from the current national average of 2.8 t/ha<br />
(Lazcano, 2006b). On the other hand, annual sugar cane yi<strong>el</strong>ds were taken at 61 t/ha, which is<br />
lower than the national average of 71 t/ha, taking into account that pasture and marginal lands,<br />
and rain fed agriculture were consi<strong>de</strong>red. Furthermore, the energy requirements of sugar cane<br />
based ethanol could be more than entir<strong>el</strong>y met by the bagasse, whereas maize would need<br />
external energy inputs. As a result, also from the point of view of greenhouse gas emissions,<br />
sugar cane ethanol would be also superior to maize <strong>de</strong>rived ethanol.<br />
The energy ratio (energy output/fossil energy inputs) for sugar cane ethanol is of the or<strong>de</strong>r of<br />
10, whereas for maize it is at the lev<strong>el</strong> of 1.3. For ethanol replacing 10% gasoline, if based on<br />
sugar cane, it would also have a surplus of 1.8% of <strong>el</strong>ectricity and require only 1% of external<br />
fossil inputs (dies<strong>el</strong>, natural gas and/or fu<strong>el</strong> oil) with respect to the process energy<br />
requirements. For maize, 10% gasoline would be saved, but external fossil inputs would<br />
amount to 7.8% (Macedo, 2006).<br />
Regarding GHG emissions and mitigation, on a life-cycle basis, for Scenario #3, the<br />
com<strong>para</strong>tive results are (Macedo, 2006): sugar cane ethanol (430 kg CO 2 eq/m 3 emissions and<br />
10.6 million t CO 2 eq /a mitigated) and maize ethanol (1,800 kg CO 2 eq /m 3 emissions and 3.9<br />
million t CO 2 eq /a mitigated).<br />
Thus, sugar cane appears to be the best candidate to kick off the penetration of fu<strong>el</strong> ethanol<br />
into the market in Mexico. Neverth<strong>el</strong>ess, over time maize and other feed stocks are lik<strong>el</strong>y to<br />
have a role to play as the <strong>de</strong>mand for ethanol expands. Of particular interest, but requiring<br />
extensive research, is the prospect of a drought-tolerant, multiple annual crop sweet sorghum.<br />
5
<strong>Potenciales</strong> y <strong>Viabilidad</strong> <strong><strong>de</strong>l</strong> <strong>Uso</strong> <strong>de</strong> <strong>Bioetanol</strong> y <strong>Biodies<strong>el</strong></strong> <strong>para</strong> <strong>el</strong> Transporte en México (SENER-BID-GTZ)<br />
Task 8: Synthesis and recommendations<br />
Technology and Economics of Fu<strong>el</strong> Ethanol in Mexico<br />
Economic analysis revealed that un<strong>de</strong>r the conditions consi<strong>de</strong>red, especially feed stocks<br />
valued at cost, not actual price, sugar cane based ethanol yi<strong>el</strong>ds an economic return similar to<br />
that of maize ethanol, even though the latter benefits from byproducts revenues, such as from<br />
DDGS, and assumes much higher yi<strong>el</strong>ds than the national average. This analysis, expressed as<br />
total net benefit in US$ / l, is presented graphically b<strong>el</strong>ow (Nogueira, 2006). The discount rate<br />
was taken at 12% per annum and the distillery economic life was assumed at 10 years, annual<br />
<strong>de</strong>preciation at 10% and a tax rate of 28% on the gross margin. For maize, and other feed<br />
stocks that need external energy inputs, <strong>el</strong>ectricity and natural gas were estimated at 150<br />
US$/MWH and 5.50 US$/MJ, respectiv<strong>el</strong>y. Three ethanol s<strong>el</strong>ling prices were consi<strong>de</strong>red, all<br />
in US$/m 3 : 450, 550 and 650. The first two prices are the extremes of the range of parity or<br />
indifference values of ethanol in r<strong>el</strong>ation to gasoline/MTBE or sugar, respectiv<strong>el</strong>y. The third<br />
and highest price reflects the US high market prices during April-June 2006. This highest<br />
price could also be seen as a value that would capture some of the externalities generated by<br />
fu<strong>el</strong> ethanol, which could justify a subsidy. Again, these results were obtained for feed stocks<br />
costs, not prices. Only one annual crop was consi<strong>de</strong>red for sorghum.<br />
0.20<br />
0.10<br />
US$/litro<br />
0.45 US$/litro<br />
0.55 US$/litro<br />
0.65 US$/litro<br />
0.00<br />
-0.10<br />
Cana mi<strong>el</strong><br />
pobre<br />
Cana mi<strong>el</strong><br />
rica<br />
Cana jugo<br />
directo<br />
Cana jugo +<br />
hidrólisis<br />
Maíz vía<br />
seca<br />
Sorgo Yuca Remolacha<br />
-0.20<br />
-0.30<br />
-0.40<br />
-0.50<br />
Obviously, at ongoing opportunity prices, the economics of fu<strong>el</strong> ethanol making in Mexico is<br />
marginal. The net economic result (US$ / l) is negative for all cases, with ethanol prices at<br />
US$ 0.45 / l. It is positive for sugar cane and maize for ethanol prices in the range of US$<br />
0.55-0.65 / l. It remains negative for all new technologies and unconventional feed stocks,<br />
even at US$ 0.65 / l ethanol! The sensitivity analysis shows that, for all sugar cane and maize<br />
based ethanol using conventional technology, the cost of feed stock is the most important cost<br />
item. For 10% lower cane cost, ethanol cost is reduced by 6% and, correspondingly, for maize<br />
the cost drop is 4%. If the average current maize prices in Mexico were used (US$ 173/t), the<br />
cost of ethanol would be 32% higher, at US$ 0.58/l. Similarly, for sugar cane, the KARBE<br />
price in 2005 (US$ 33/t cane) would lead to an ethanol price of US$ 0.59/l , or 37% higher<br />
(Nogueira, 2006) .<br />
The total country wi<strong>de</strong> industrial conversion investment requirements for the various feed<br />
stocks and <strong>de</strong>mand scenarios consi<strong>de</strong>red is shown in the graph b<strong>el</strong>ow (Nogueira, 2006). Dry<br />
6
<strong>Potenciales</strong> y <strong>Viabilidad</strong> <strong><strong>de</strong>l</strong> <strong>Uso</strong> <strong>de</strong> <strong>Bioetanol</strong> y <strong>Biodies<strong>el</strong></strong> <strong>para</strong> <strong>el</strong> Transporte en México (SENER-BID-GTZ)<br />
Task 8: Synthesis and recommendations<br />
milled maize processed into ethanol requires the lowest investment, followed by the three<br />
sugar cane based ethanol processes. The estimate for sorghum consi<strong>de</strong>red only one annual<br />
crop. No agricultural investments were estimated for the <strong>de</strong>v<strong>el</strong>opment of the incremental feed<br />
stock production required to satisfy the three scenarios consi<strong>de</strong>red.<br />
7,000<br />
6,000<br />
5,000<br />
4,000<br />
millones US$<br />
Sustitución <strong>de</strong> la producción nacional <strong>de</strong> MTBE por<br />
ETBE<br />
Sustitución total <strong>de</strong> los éteres por etanol a 5,7%<br />
Mezcla <strong>de</strong> 10% <strong>de</strong> etanol en toda gasolina<br />
3,000<br />
2,000<br />
1,000<br />
0<br />
Cana mi<strong>el</strong><br />
pobre<br />
Cana mi<strong>el</strong><br />
rica<br />
Cana jugo<br />
directo<br />
Maíz via<br />
seca<br />
Cana jugo<br />
+ hidrólisis<br />
Sorgo Yuca Remolacha<br />
In practice, over time, the supply of ethanol in Mexico would come from a combination of<br />
feed stocks. Thus, the total country investment to meet the <strong>de</strong>mand of Scenario # 3b would<br />
hover around US $ 2 billion.<br />
The table b<strong>el</strong>ow shows the number of units that would be required to satisfy the <strong>de</strong>mand of the<br />
three scenarios with sugar cane and maize feed stocks. Since maize based ethanol can run all<br />
year long, it requires the least number of units compared to sugarcane. Again, since in practice<br />
there would be a combination of feed stocks and processes to the meet <strong>de</strong>mand, the number of<br />
units required to meet, say Scenario # 3b, would resi<strong>de</strong> in the range of 26-48 units.<br />
Feed stock and technology<br />
Spent sugar cane<br />
molasses<br />
Fat sugar cane<br />
molasses<br />
Direct sugar<br />
cane juice<br />
Dry milled<br />
maize<br />
Unit Capacity (m 3 /d) 150 150 450 500<br />
Industrial conversion investment per unit<br />
(thousand US$)<br />
15,000 15,000 50,000 61,000<br />
Annual production per unit (m 3 /a) 27,090 27,090 81,270 150,500<br />
Scenario<br />
Number of Units<br />
#1. Domestic MTBE replaced by ETBE 16 16 6 3<br />
#2. Total replacement of ethers by ethanol at<br />
5.7% v/v<br />
#3b. Ethanol 10% v/v blend becomes the<br />
standard gasoline in Mexico<br />
34 34 12 7<br />
144 144 48 26<br />
7
<strong>Potenciales</strong> y <strong>Viabilidad</strong> <strong><strong>de</strong>l</strong> <strong>Uso</strong> <strong>de</strong> <strong>Bioetanol</strong> y <strong>Biodies<strong>el</strong></strong> <strong>para</strong> <strong>el</strong> Transporte en México (SENER-BID-GTZ)<br />
Task 8: Synthesis and recommendations<br />
The area requirement to meet the <strong>de</strong>mand stipulated by the three Scenarios is <strong>de</strong>picted<br />
b<strong>el</strong>ow for the various feed stocks (Nogueira, 2006). Obviously, in the case of Scenario # 1, the<br />
molasses based ethanol would not require any additional area, since the feed stock would be a<br />
by product of existing sugar mills supplied by currently planted sugar cane. Direct<br />
fermentation of sugar cane juice would require the least area among all the feed stock<br />
alternatives. The area for dry milled maize ethanol would be 3.6 times larger, if the average<br />
annual yi<strong>el</strong>ds of 2.8 t/ha were used instead of the mo<strong><strong>de</strong>l</strong>ed 10 t/ha. If the entire ethanol<br />
<strong>de</strong>mand un<strong>de</strong>r Scenario # 3b would be satisfied sol<strong>el</strong>y by direct sugar cane juice, the area<br />
un<strong>de</strong>r sugar cane cultivation in Mexico would approximat<strong>el</strong>y double. It is worth noting that,<br />
within the limits of the proposed Scenarios, the land requirements can be met apparently<br />
without compromising food production.<br />
3,000<br />
miles <strong>de</strong> ha<br />
2,500<br />
2,000<br />
Sustitución <strong>de</strong> la producción nacional <strong>de</strong> MTBE<br />
por ETBE<br />
Sustitución total <strong>de</strong> los éteres por etanol a 5,7%<br />
1,500<br />
Mezcla <strong>de</strong> 10% <strong>de</strong> etanol en toda gasolina<br />
1,000<br />
500<br />
0<br />
Cana jugo<br />
directo<br />
Maíz via seca Cana jugo +<br />
hidrólisis<br />
Sorgo Yuca Remolacha<br />
Sustainability of Fu<strong>el</strong> Ethanol in Mexico<br />
Fu<strong>el</strong> ethanol could be sustainable in Mexico, according to the three dimensions of<br />
sustainability: economic, social and environmental. The economic dimension has been<br />
covered in the preceding sections. The environmental dimension has been partially covered,<br />
with respect to energy ratios and GHG emissions and mitigation. Additional analysis on the<br />
environmental and social dimensions follows.<br />
Irrigation is a key issue, especially in Mexico - a humidity <strong>de</strong>prived country. Irrigation impacts<br />
the water supply, and may lead to soil erosion, salinity, and to un<strong>de</strong>rground and surface water<br />
contamination. Rain fed agricultural expansion will imply using anthropized and to some<br />
extent <strong>de</strong>gra<strong>de</strong>d lands, in culture substitution or in habitat loss. Lower water <strong>de</strong>manding sweet<br />
sorghum in dry lands is an alternative that needs to be researched un<strong>de</strong>r Mexican conditions.<br />
For some crops, such as sugar cane, the use of stillage, the liquid residue from ethanol<br />
distillation, for ferti-irrigation can reduce net fertilizer input (mostly potassium) and supply<br />
water in s<strong>el</strong>ected areas. As a reference, in Brazil, in sugar cane processing, the average water<br />
withdrawal from the sources (rivers, lakes, un<strong>de</strong>rground water) 1.8 m 3 /t cane, but much<br />
improvement can still be achieved (Macedo, 2006).<br />
8
<strong>Potenciales</strong> y <strong>Viabilidad</strong> <strong><strong>de</strong>l</strong> <strong>Uso</strong> <strong>de</strong> <strong>Bioetanol</strong> y <strong>Biodies<strong>el</strong></strong> <strong>para</strong> <strong>el</strong> Transporte en México (SENER-BID-GTZ)<br />
Task 8: Synthesis and recommendations<br />
As previously mentioned, the production and use of bioethanol (and co-generated <strong>el</strong>ectricity)<br />
can result in positive environmental impacts. It can save fossil fu<strong>el</strong>s, and the corresponding<br />
GHG emissions. Ethanol use in blends with gasoline (and incorporated into ETBE) reduces<br />
emissions of controlled substances such as carbon monoxi<strong>de</strong> and unburned hydrocarbons. On<br />
the other hand, the possibility of and consequences from leakage and contamination of<br />
groundwater, especially of ETBE, must be consi<strong>de</strong>red.<br />
The job impact of fu<strong>el</strong> ethanol in Mexico for a nationwi<strong>de</strong> 10% ethanol blend would be to<br />
double the number of jobs in the sugar cane agro-industry in areas not now un<strong>de</strong>r sugar cane<br />
cultivation adding approximat<strong>el</strong>y 400 thousand jobs. Alternativ<strong>el</strong>y, if ethanol would be<br />
entir<strong>el</strong>y produced from maize, a 10 % ethanol blend would result in an increase of 45% in the<br />
jobs in the maize economy. New production technologies encompassing larger areas,<br />
mechanization and automation, would lead to lower job creation. Neverth<strong>el</strong>ess, expanding the<br />
job market at r<strong>el</strong>ativ<strong>el</strong>y low investment could be one of the most important social<br />
contributions of an ethanol program in Mexico (Macedo, 2006).<br />
The ongoing transition in the Mexican agriculture makes it difficult to estimate with precision<br />
the number of farmers engaged in agriculture today (Lazcano, 2006a). The expected buying of<br />
land in large scale by the sugar mill owners, after the 1992 reform, did not happen. Sugar cane<br />
land owners today can receive (with 5 ha) the value equivalent to three minimum wages<br />
(against one, for 40% of all the other workers). In other cultures the situation is different, as in<br />
Mexico, sugar cane has a specific social compact based on laws and regulations.<br />
Projections based on the XII Censo General <strong>de</strong> Población y Vivienda 2000, suggests for 2005<br />
that some 25 million people live in rural areas. There are 3.77 million production units, with<br />
approximat<strong>el</strong>y 10.8 million workers. For maize, approximat<strong>el</strong>y 3.1 million producers are<br />
involved, out of a total of 5.4 million in agriculture and cattle husbandry (Macedo, 2006). It is<br />
estimated that about 150 thousand people are sugar cane growers in Mexico. However more<br />
people are engaged in production, making up a total of 400 thousand direct jobs in agriculture<br />
and industrial conversion to sugar.<br />
As a reference, in Brazil the sugar cane industry has shown a great flexibility in the number of<br />
jobs created/unit production. In areas with large manpower available and com<strong>para</strong>tiv<strong>el</strong>y lower<br />
incomes (Northeast Brazil) agricultural mechanization and industrial automation are limited,<br />
and jobs/unit production may be up to 3 times larger than in regions where manpower is more<br />
difficult to find, and wages are higher (Southeast Brazil). In both cases, however, the average<br />
wages were higher in sugar cane agriculture than in all other cultures, except for soybeans, a<br />
highly mechanized culture. The direct -formal and informal - jobs in the sugar cane agroindustry<br />
reached circa 930,000 in 2002, for 318 million t sugar cane production/processing.<br />
The estimated indirect jobs in the late 1990’s were nearly the same, yi<strong>el</strong>ding a total of 5,800<br />
jobs (direct and indirect) per million t of sugar cane (Macedo, 2006). These are averages.<br />
Differences in jobs/sugar cane produced can be very large among regions in the same country.<br />
It is difficult to foresee the structure of ethanol production in Mexico in the future. Possibly<br />
two systems will coexist. One would be similar to today’s situation, that is, large number of<br />
land owners, small areas, some based on cooperatives. The other system would be based on<br />
much larger holdings. Suitable structures (for both systems) will lead to differences in job<br />
creation. If priority is given to large scale sugar cane expansion in pasture and marginal lands,<br />
9
<strong>Potenciales</strong> y <strong>Viabilidad</strong> <strong><strong>de</strong>l</strong> <strong>Uso</strong> <strong>de</strong> <strong>Bioetanol</strong> y <strong>Biodies<strong>el</strong></strong> <strong>para</strong> <strong>el</strong> Transporte en México (SENER-BID-GTZ)<br />
Task 8: Synthesis and recommendations<br />
regional <strong>de</strong>v<strong>el</strong>opment in new areas would take place, creating jobs and promoting social<br />
infrastructures where few existed before.<br />
Reviewing and revising creativ<strong>el</strong>y the existing social compact between sugar cane growers<br />
and mills may offer an opportunity to maintain for the current beneficiaries and to expand<br />
social benefits for the rural workers not enjoying them presently. It is not a trivial task. It<br />
requires ingenuity and creativity, but without progress in this area the cost of fu<strong>el</strong> ethanol in<br />
Mexico may be too large for the key stakehol<strong>de</strong>rs to achieve a consensus in support of an<br />
ethanol program in the country. The Brazilian experience of integrating the interests of<br />
growers and mills in a fre<strong>el</strong>y negotiated agreement gui<strong>de</strong>d by technical and economical<br />
mo<strong><strong>de</strong>l</strong>s and supervised by experts from both si<strong>de</strong>s might be of interest to Mexico (see Annex<br />
III)<br />
Implementing the Fu<strong>el</strong> Ethanol Economy in Mexico<br />
An or<strong>de</strong>rly market penetration of fu<strong>el</strong> ethanol in Mexico requires a systematic process of<br />
<strong>de</strong>cision making supported by the consensus of the r<strong>el</strong>evant stakehol<strong>de</strong>rs. Political lea<strong>de</strong>rship,<br />
from the executive and legislative branches of government would go a long way expediting<br />
this process.<br />
The Biofu<strong>el</strong>s Committee – a veritable biofu<strong>el</strong>s stakehol<strong>de</strong>rs’ group - that SENER gathered a<br />
few times in 2006 as part of the IADB/SENER project, was a good starting point for<br />
un<strong>de</strong>rstanding what drives the five key stakehol<strong>de</strong>rs: sugar cane growers and millers; oil<br />
industry; automotive industry; government; and consumers and environmentalists.<br />
This IADB/SENER project was actually a process to recap existing knowledge and<br />
information; study; research and analyze the prospects of fu<strong>el</strong> ethanol in Mexico. Rationales<br />
for fu<strong>el</strong> ethanol in the broa<strong>de</strong>r Mexican energy scene were <strong>de</strong>v<strong>el</strong>oped. Studies, research and<br />
analyses were conducted aimed at reducing the uncertainties on production, blending,<br />
conversion to ETBE, distribution and end use of fu<strong>el</strong> ethanol. The key stakehol<strong>de</strong>rs were<br />
engaged in this process. In <strong>para</strong>ll<strong>el</strong> two major legislative initiatives were submitted to<br />
Congress, discussed and are on the verge of becoming laws, nam<strong>el</strong>y, the Law on Renewables<br />
and the Law on Biofu<strong>el</strong>s. Besi<strong>de</strong>s domestic resources, consi<strong>de</strong>ration has been given to<br />
international cooperation and international tra<strong>de</strong>, with special reference to carbon credits.<br />
As part of the implementation of these Laws, it would be useful to <strong>de</strong>tail an agenda for further<br />
stakehol<strong>de</strong>rs’ dialogues to build up consensus on targets and approaches for production,<br />
blending, conversion to ETBE, distribution and end use. This process would originate a<br />
<strong>de</strong>tailed implementation agenda. The key stakehol<strong>de</strong>rs would then negotiate and implement<br />
the formal political, legal, regulatory, financial, industrial and agricultural arrangements to<br />
launch the Mexican fu<strong>el</strong> ethanol program. Evi<strong>de</strong>ntly, the stakehol<strong>de</strong>rs’ process is consultative<br />
in nature, but it would strengthen the government implementation initiatives. To begin<br />
implementation, the previously agreed first stage of the program should be launched, which<br />
would begin the learning curve of the process. Problems would appear, inevitably, which<br />
would need to be addressed and solved. As the learning curve evolves, learning, corrections<br />
and adjustments in direction, intensity and pace would take place. Experience would<br />
accumulate and feedback would be received and processed. It would be important to watch for<br />
new social, economic, environmental and political factors, which might affect the program.<br />
10
<strong>Potenciales</strong> y <strong>Viabilidad</strong> <strong><strong>de</strong>l</strong> <strong>Uso</strong> <strong>de</strong> <strong>Bioetanol</strong> y <strong>Biodies<strong>el</strong></strong> <strong>para</strong> <strong>el</strong> Transporte en México (SENER-BID-GTZ)<br />
Task 8: Synthesis and recommendations<br />
From time to time, the consensus once obtained among the key stakehol<strong>de</strong>rs would need to be<br />
checked and modified, if warranted.<br />
SENER and SAGARPA are nominated as the leading government coordinators for the two<br />
core Laws promoting fu<strong>el</strong> ethanol in Mexico. They would have to find an efficient way of<br />
combining the overlapping legislative mandates to efficiently implement the will of the<br />
representatives of the Mexican people, lest the fu<strong>el</strong> ethanol program would take longer to<br />
come to life than is expected. One way of increasing efficiency is to set up a lean joint<br />
Executive Secretariat that integrates the mandates of the two laws with respect to fu<strong>el</strong> ethanol.<br />
Such joint Executive Secretariat would report to SENER and SAGARPA in the terms of the<br />
respective laws, but would have operational flexibility and agility to promote the build up of<br />
the fu<strong>el</strong> ethanol economy in Mexico. The proposed joint Executive Secretariat would do w<strong>el</strong>l<br />
to resort to a Stakehol<strong>de</strong>rs’ Committee, on a consultative basis, to strengthen the<br />
implementation process. Another prospect would be to fully integrate the two pending pieces<br />
of legislation to focus on biofu<strong>el</strong>s.<br />
In practice, the fu<strong>el</strong> ethanol program in Mexico could be launched from the existing sugar<br />
cane molasses production capacity aiming at satisfying Scenario # 1, that is, 412 thousand<br />
m 3 /a. Not all 58 Mexican sugar mills have capacity to produce ethanol. The current capacity is<br />
167 thousand m 3 /a, of which 33 thousand m 3 refers to anhydrous ethanol. Thus, it would be<br />
necessary to add <strong>de</strong>hydration capacity for 134 thousand m 3 /a hydrous ethanol (167-33<br />
thousand m 3 /a), at a cost in the range of $ 6-9 million, <strong>de</strong>pending on the number of units and<br />
their location. This 134 thousand m 3 /a hydrous correspond to 127.9 thousand m 3 /a anhydrous.<br />
Adding the current 33 thousand m 3 /a capacity amounts to 160.9 thousand m 3 /a. Thus, to meet<br />
the <strong>de</strong>mand of Scenario # 1, it would be necessary to annex distillation capacity for 251.1<br />
thousand m 3 /a (412-160.9 thousand m 3 /a). At the unit capacity of 27.09 thousand m 3 /a, 9.3<br />
units, or rather 10 units would be required. At US$ 15 million per unit, the total investment in<br />
the annexed distilleries would be US$ 150 million. Adding the <strong>de</strong>hydration plants, overall,<br />
some US$ 160 million would be nee<strong>de</strong>d to generate a capacity for 412 thousand m 3 /a<br />
anhydrous ethanol in Mexico. This could be achieved before 2012, if there is the will to launch<br />
a fu<strong>el</strong> ethanol economy in Mexico that is sufficient to overcome the many barriers discussed in<br />
the reports of Task #7 and in this one.<br />
During this first stage of the Mexican fu<strong>el</strong> ethanol program, pre<strong>para</strong>tions could take place to<br />
move on to the second stage of penetration, which could coinci<strong>de</strong> with Scenario # 2, that is, a<br />
<strong>de</strong>mand for anhydrous ethanol of some 1,110 thousand m 3 /a (with reference to 2010 <strong>de</strong>mand).<br />
Since 412 thousand m 3 /a capacity would have been installed in the first stage, the net capacity<br />
addition would amount to 600 thousand m 3 /a (1110-412 thousand m 3 /a). For a unit capacity of<br />
80 thousand m 3 /a, 7.5 units would be nee<strong>de</strong>d, say 8 units at US$ 50 million each, making up a<br />
total of US$ 400 million. These would be rain fed pasture or marginal land based sugarcane<br />
juice fu<strong>el</strong> ethanol plants. The experience of the joint Executive Secretariat could h<strong>el</strong>p getting<br />
this second stage implemented by 2012.<br />
Incorporating all the learning and adjustments inherent to stages one and two, the program<br />
could expand toward its ambitious third stage from 2012). In principle, the target could be<br />
Scenario # 3b. Other feed stocks, which might have begun to appear in the previous stage,<br />
could expand their contribution, perhaps multiple annual crops sweet sorghum. Neverth<strong>el</strong>ess,<br />
it is expected that sugar cane juice based ethanol in rain fed pasture or marginal land<br />
11
<strong>Potenciales</strong> y <strong>Viabilidad</strong> <strong><strong>de</strong>l</strong> <strong>Uso</strong> <strong>de</strong> <strong>Bioetanol</strong> y <strong>Biodies<strong>el</strong></strong> <strong>para</strong> <strong>el</strong> Transporte en México (SENER-BID-GTZ)<br />
Task 8: Synthesis and recommendations<br />
agriculture, would dominate the scene, in case the hopes about sweet sorghum do not<br />
materialize. On the basis of sugar cane juice alone, the <strong>de</strong>mand of some 4,406 thousand m 3 /a,<br />
would require an additional 43 distilleries at a cost of US$ 2.15 billion.<br />
Time horizon thousand m 3 /a No. units Investment, US$ million<br />
Up to 2010 412 2-4 <strong>de</strong>hydration units 6-9<br />
10 annexed distilleries 150<br />
By 2012 1,110 8 in<strong>de</strong>pen<strong>de</strong>nt distilleries 400<br />
From 2012 4,406 43 in<strong>de</strong>pen<strong>de</strong>nt distilleries 2,150<br />
Building Blocks of a National Ethanol and ETBE Program<br />
The preceding Summary for Policy Makers con<strong>de</strong>nses the contents of reports on seven tasks<br />
and must of necessity be as brief as possible. What follows are remarks on the building blocks<br />
of national fu<strong>el</strong> ethanol programs <strong>de</strong>rived from the international experience. A fu<strong>el</strong> ethanol<br />
program can be thought of as part of a transition towards sustainable transportation systems.<br />
Fu<strong>el</strong> ethanol is not expected to complete dislodge gasoline from the market in any period of<br />
time. On the contrary, fu<strong>el</strong> ethanol can stretch oil resources by obtaining a mo<strong>de</strong>rate market<br />
share and saving gasoline for the future. History shows that there has always been a coexistence<br />
of multiple fu<strong>el</strong>s, so that the co-existence of gasoline and fu<strong>el</strong> ethanol would not be a<br />
new <strong>de</strong>v<strong>el</strong>opment per se.<br />
Governments are the natural initiators of this transition. The implementation its<strong>el</strong>f is carried<br />
out by a combination of public and private agents. Governments would be wise to consi<strong>de</strong>r<br />
national stakehol<strong>de</strong>rs’ forums to achieve consensus on a prioritized portfolio of integrated<br />
actions, in other words, to <strong>de</strong>v<strong>el</strong>op a vision with a broad based support. This can be translated<br />
into legislation, regulation, financing, technical assistance, technical cooperation all of which<br />
lead to a smoother implementation of a fu<strong>el</strong> ethanol program.<br />
The main drivers of alternate energy programs, such as fu<strong>el</strong> ethanol have over time switched<br />
from security of supply to environment and public health concerns to climate change and back<br />
to security of supply.<br />
Designing and implementing a fu<strong>el</strong> ethanol program requires a flexible approach to lower<br />
risks while promoting the transition to ethanol gasoline blends. This process is <strong>de</strong>finit<strong>el</strong>y<br />
h<strong>el</strong>ped by continued research, <strong>de</strong>v<strong>el</strong>opment and <strong>de</strong>monstration in r<strong>el</strong>evant aspects of the fu<strong>el</strong><br />
ethanol economy engaging national and international resources.<br />
In the same vein, the risks of implementing a sustainable transportation system based on fu<strong>el</strong><br />
ethanol are lowered if there is a national agreement based on the consensus of the key<br />
stakehol<strong>de</strong>rs involved. For sustainability to thrive, international tra<strong>de</strong> must be part of these<br />
agreements. This conclusion comes from the observation that there is no energy commodity in<br />
the world that is not tra<strong>de</strong>d internationally. Thus, at some point in the <strong>de</strong>v<strong>el</strong>opment of a fu<strong>el</strong><br />
12
<strong>Potenciales</strong> y <strong>Viabilidad</strong> <strong><strong>de</strong>l</strong> <strong>Uso</strong> <strong>de</strong> <strong>Bioetanol</strong> y <strong>Biodies<strong>el</strong></strong> <strong>para</strong> <strong>el</strong> Transporte en México (SENER-BID-GTZ)<br />
Task 8: Synthesis and recommendations<br />
ethanol program, fu<strong>el</strong> ethanol must face the possibility of trading internationally, lest ethanol<br />
remains a national, limited curiosity.<br />
Enabling conditions must be established to kick off the transition to a competitive sustainable<br />
fu<strong>el</strong> ethanol market in the long run. Once established, the implementation of national<br />
transition strategy that involves fu<strong>el</strong> ethanol must be checked from time to time via the<br />
stakehol<strong>de</strong>rs’ consultative process.<br />
Fu<strong>el</strong> Ethanol Implementation I<strong>de</strong>as for Mexico<br />
The Summary for Policy Makers has sketched an implementation strategy for fu<strong>el</strong> ethanol in<br />
Mexico, based on the market penetration scenarios <strong>de</strong>v<strong>el</strong>oped in the reports of Tasks #2 and<br />
#5. Basically, the program would kick off with the conversion of the existing molasses<br />
capacity into ethanol via utilizing the existing distillation capacity, adding <strong>de</strong>hydration<br />
capacity and annexed distilleries. Happily, the current molasses capacity is about sufficient to<br />
produce the volume of fu<strong>el</strong> ethanol required by Scenario # 1, to meet the <strong>de</strong>mand of the<br />
existing ether plants in Mexico, before 2012.<br />
However, the cost of making fu<strong>el</strong> ethanol from molasses should be compatible with the<br />
opportunity costs of fu<strong>el</strong> ethanol. The international price of molasses has fluctuated wi<strong><strong>de</strong>l</strong>y<br />
over the past six years with a minimum of US$ 20/t and a maximum over US$ 100/t. The<br />
molasses price assumed in Task #7 was US$ 70/t. Since molasses has export opportunities and<br />
domestic markets, the fu<strong>el</strong> ethanol program in Mexico should <strong>de</strong>v<strong>el</strong>op measures to dampen<br />
molasses price fluctuations. Whatever fu<strong>el</strong> ethanol projects are being planned and/or<br />
implemented currently in Mexico, from other feed stocks such as maize, could play a role in<br />
mo<strong>de</strong>rating the pressure on molasses supply for ethanol making.<br />
In addition, one way of mitigating such risk would be to begin immediate <strong>de</strong>v<strong>el</strong>opment of<br />
sugar cane juice distilleries. The next step would be to produce enough fu<strong>el</strong> ethanol to meet<br />
the <strong>de</strong>mand for a 5.7% v/v blend in the Metropolitan areas. To the annexed distilleries<br />
capacity, new sugar cane juice distilleries capacity would be ad<strong>de</strong>d from sugar cane grown in<br />
rain fed pasture or marginal land. This would begin to happen by 2012. The big leap towards<br />
a 10% blend all over Mexico could begin from 2012 and would consi<strong>de</strong>rably expand sugar<br />
cane cultivation in rain fed pasture and marginal lands. All along, other feed stocks, such as<br />
multiple annual crops sweet sorghum and maize, might begin to play a role, and some<br />
international tra<strong>de</strong> could take place, exports to the US market, or occasional imports in case of<br />
crop failures.<br />
An alternative or complement to the prospects of fu<strong>el</strong> ethanol based on distilleries annexed to<br />
sugar mills is investment in such distilleries for the potable ethanol market, neutral and<br />
otherwise. If the current social compact between growers and mills could not be revised or<br />
waived for molasses based fu<strong>el</strong> ethanol, this would lead to high cost ethanol based on high<br />
cost molasses. In such situation, mill owners may opt for the higher value potable ethanol<br />
market, if not the simpler export of high value molasses instead of the domestic fu<strong>el</strong> ethanol<br />
market. The price support lev<strong>el</strong> covered by subsidies, that would have to be provi<strong>de</strong>d fu<strong>el</strong><br />
ethanol un<strong>de</strong>r these circumstances could make it difficult to obtain support form the<br />
stakehol<strong>de</strong>rs’ consensus.<br />
13
<strong>Potenciales</strong> y <strong>Viabilidad</strong> <strong><strong>de</strong>l</strong> <strong>Uso</strong> <strong>de</strong> <strong>Bioetanol</strong> y <strong>Biodies<strong>el</strong></strong> <strong>para</strong> <strong>el</strong> Transporte en México (SENER-BID-GTZ)<br />
Task 8: Synthesis and recommendations<br />
The proposed implementation strategy consi<strong>de</strong>red new, larger scale in<strong>de</strong>pen<strong>de</strong>nt distilleries<br />
based on sugarcane juice from new sugarcane land obtained from land use change of current<br />
pasture land and other available land, based on a new compact between growers and<br />
distilleries. Such a new compact would integrate the interests of growers and distillery owners<br />
and have growers share in the margins, positive or negative, generated from the total<br />
productive chain. As previously mentioned, an example of a successful voluntary compact<br />
between growers and mills, at work in Brazil is contained in Annex III, the “PARAMETRIC<br />
MODEL TO SET THE VALUE OF THE METRIC TON OF SUGAR CANE IN THE<br />
STATE OF SÃO PAULO, BRAZIL” (Pádua, 2006)<br />
Given the scarcity of water for irrigation in Mexico, it has been proposed that new sugarcane<br />
cultivation take place in pasture and other lands and be rain-fed. Occasional crop failures to be<br />
compensated by a lower content of ethanol in gasoline blends or by occasional ethanol imports<br />
Ethanol sales contract between PEMEX and distilleries must be based on the opportunity cost<br />
of ethanol in gasoline blends. For 10% blends or lower, the opportunity cost would equal the<br />
value of gasoline in the Mexican market, which equals the spot price of gasoline in the US<br />
Gulf Coast. This is the “Precio Ventas Producto (PRef)” used to build up the retail price of<br />
gasoline in Mexico. Should there be a difference between the cost of ethanol and its<br />
opportunity cost, fiscal mechanisms would be triggered in or<strong>de</strong>r to prevent losses to PEMEX<br />
for paying the momentary extra cost of ethanol with reference to the value of gasoline.<br />
Similarly, ethanol <strong>de</strong>stined to ETBE making would be priced at its opportunity cost in that<br />
application. Should the ex-distillery price of ethanol exceed its opportunity cost regarding the<br />
making of ETBE, again, fiscal mechanisms would be triggered to prevent the ETBE maker<br />
from suffering losses from the purchase of ethanol un<strong>de</strong>r those conditions. Yet, an alternative<br />
pricing approach would be the opportunity cost of ethanol in the international market. Again,<br />
whenever necessary, fiscal mechanisms would be triggered to protect the margins of the<br />
ethanol buyer in the domestic market, most lik<strong>el</strong>y PEMEX<br />
.<br />
If annexed distilleries can be free of the current growers/mills compact, market penetration<br />
could start with fu<strong>el</strong> ethanol produced from them together with a smaller amount of high value<br />
potable neutral ethanol. If scenario #1, that is, ethanol supplying domestic ter-butyl ether<br />
plants for ETBE making, can be quantitativ<strong>el</strong>y supplied with ethanol from domestic annexed<br />
distilleries, whose capacity would be of the or<strong>de</strong>r of 400 thousand m 3 /a, then, start with<br />
scenario #1 and gradually build capacity with large scale in<strong>de</strong>pen<strong>de</strong>nt distilleries to satisfy<br />
scenario #2 and later scenario #3b. The plausibility of this scenario <strong>de</strong>pends on too many ifs.<br />
Most important among them is changing the growers/mills compact for the molasses <strong>de</strong>stined<br />
to ethanol making. On the other hand, this would be an interesting challenge to take up as a<br />
first step to changing, over time, the overall growers/mills compact for the sugar cane<br />
economy of Mexico. Key to this approach is to integrate the interests of the two si<strong>de</strong>s, from<br />
sugar cane to molasses to ethanol immediat<strong>el</strong>y and later adding sugar to the compact, as is<br />
done successfully in other countries, such as Brazil, as shown in Annex III. Another difficulty<br />
would be to have mills convinced not to export molasses in lucrative short term <strong>de</strong>als, but<br />
rather to look for the longer term returns of large scale fu<strong>el</strong> ethanol and small scale high value<br />
potable neutral ethanol.<br />
14
<strong>Potenciales</strong> y <strong>Viabilidad</strong> <strong><strong>de</strong>l</strong> <strong>Uso</strong> <strong>de</strong> <strong>Bioetanol</strong> y <strong>Biodies<strong>el</strong></strong> <strong>para</strong> <strong>el</strong> Transporte en México (SENER-BID-GTZ)<br />
Task 8: Synthesis and recommendations<br />
Scenario #2 is essentially a 5.7% blend scenario, which would over time ramp up to 10%, as in<br />
Scenario #3b, as more ethanol becomes available. Success in launching scenarios #2 and later<br />
#3b, will <strong>de</strong>pend a lot on a carefully <strong>de</strong>signed and expertly implemented program of<br />
inspection and maintenance of retail stations, especially un<strong>de</strong>rground storage tanks, and of<br />
vehicles, particularly those built prior to 1986, when supposedly new cars began to be built<br />
with full compatibility to 10% ethanol gasoline blends. PEMEX and the Mexican based auto<br />
industry would have an important role to play here.<br />
I<strong>de</strong>ally, fiscal mechanisms referred to above, would have to be smart and flexible and have<br />
sunset date provisions to stimulate technology <strong>de</strong>v<strong>el</strong>opment from agriculture to ethanol<br />
making and the consequent productivity increases. They would have to be <strong>de</strong>signed by<br />
Mexicans in the Mexican context, resorting to existing institutional financing mechanisms.<br />
The overall objective would be not to penalize PEMEX or the retail network or the consumer<br />
with the initially high cost of ethanol produced in Mexico. Such mechanisms would result in<br />
short term losses in fiscal revenue, but ought to be amply compensated in the long run by the<br />
increased tax revenue from a large scale fu<strong>el</strong> ethanol economy in Mexico and for the<br />
environmental services provi<strong>de</strong>d and other externalities, including CDM projects based on<br />
grid-connected bagasse co-generation, replacing fossil based generation; and gasoline<br />
displacement by fu<strong>el</strong> ethanol. There is no exception to the rule that every fu<strong>el</strong> ethanol program<br />
launched in the world was launched with the support of financial and other incentives of all<br />
sorts, including mandates and the resulting PEMEX purchase contracts; subsidized financing<br />
for agricultural investment in sugar cane plantations and for ethanol distilleries; technological<br />
support from public and private organizations ranging from improved varieties to<br />
fermentation, distillation and stillage disposal; differential taxation of fu<strong>el</strong> ethanol to be<br />
blen<strong>de</strong>d with gasoline to equalize the costs of ethanol and gasoline in the blend <strong><strong>de</strong>l</strong>ivered<br />
through the retail network. This would result in a short term loss to the Treasury, which could<br />
be compensated through funds to be established in the implementation of the Mexican<br />
legislation concerning biofu<strong>el</strong>s and alternative energies.<br />
The key legislation, now pending in Congress, involves the Law on Renewables and the Law<br />
on Biofu<strong>el</strong>s. The corresponding lead Government bodies are SENER and SAGARPA,<br />
respectiv<strong>el</strong>y. Although the legislative zeal on renewables/biofu<strong>el</strong>s is w<strong>el</strong>come, a special effort<br />
is need to coordinate implementation initiatives. Thus, a joint Executive Secretariat reporting<br />
to SENER and SAGARPA and advised by a Stakehol<strong>de</strong>rs’ Committee, is proposed to fulfill<br />
the mandates of the laws in an expeditious, effective and efficient way. Even better would be<br />
if the two laws could be merged in what regards biofu<strong>el</strong>s.<br />
15
<strong>Potenciales</strong> y <strong>Viabilidad</strong> <strong><strong>de</strong>l</strong> <strong>Uso</strong> <strong>de</strong> <strong>Bioetanol</strong> y <strong>Biodies<strong>el</strong></strong> <strong>para</strong> <strong>el</strong> Transporte en México (SENER-BID-GTZ)<br />
Task 8: Synthesis and recommendations<br />
ANNEX I<br />
Stakehol<strong>de</strong>rs’ Analysis<br />
A stakehol<strong>de</strong>rs’ analysis is a useful tool to review the drivers, the barriers and the rationales<br />
for introducing a biofu<strong>el</strong>s economy into Mexico. In the case in point only biomass-<strong>de</strong>rived<br />
ethanol for use as a gasoline blend component and/or as a feedstock to a ter-butyl ether plant<br />
to make ETBE are consi<strong>de</strong>red. <strong>Biodies<strong>el</strong></strong> <strong>de</strong>rived from vegetable oils and inten<strong>de</strong>d for<br />
blending with dies<strong>el</strong> is not treated here.<br />
The key stakehol<strong>de</strong>rs in a potential Mexican fu<strong>el</strong> ethanol economy have already been analyzed<br />
in the report of Task #7 and also in this report of Task #8. The analysis b<strong>el</strong>ow focuses on the<br />
crucial stakehol<strong>de</strong>rs on the <strong>de</strong>mand and end use si<strong>de</strong> of fu<strong>el</strong> ethanol, nam<strong>el</strong>y, PEMEX, the<br />
distribution retail network and the automotive industry:<br />
PEMEX<br />
Most of the material analyzed here was obtained from the report of Task #2 (Rodriguez,<br />
2006). PEMEX would be the sole buyer of fu<strong>el</strong> ethanol for blending with gasoline in Mexico.<br />
Its infrastructure would have to be ready to handle the new blends. Also, in the case of<br />
scenario #1, PEMEX ter-butyl ether plants would have to be ready to process ethanol into<br />
ETBE<br />
Mexican energy is ruled by a set of laws and regulations that inclu<strong>de</strong> the following:<br />
• Ley Reglamentaria <strong><strong>de</strong>l</strong> Artículo 27 Constitucional en <strong>el</strong> Ramo <strong><strong>de</strong>l</strong> Petróleo<br />
• Ley <strong><strong>de</strong>l</strong> Impuesto Especial sobre Producción y Servicios (IEPS)<br />
• Ley <strong><strong>de</strong>l</strong> Impuesto al Valor Agregado (IVA)<br />
• Ley <strong>de</strong> Energía <strong>para</strong> <strong>el</strong> Campo<br />
• Proyecto <strong>de</strong> Decreto <strong>de</strong> la Ley <strong>para</strong> <strong>el</strong> Desarrollo y Promoción <strong>de</strong> Bioenergéticos<br />
• NOM-086-SEMARNAT-SENER-SCFI-2005, Especificaciones <strong>de</strong> los combustibles<br />
fósiles <strong>para</strong> la protección ambiental<br />
The Mexican Constitution makes oil resources a state monopoly. Such monopoly is exercised<br />
by PEMEX on behalf of the Mexican State. This monopoly inclu<strong>de</strong>s the refining in Mexico of<br />
cru<strong>de</strong> oil from any source, as w<strong>el</strong>l as the transportation, distribution and refined products<br />
wholesale. Regardless of the fact that fu<strong>el</strong> ethanol in Mexico would not be fossil in origin, its<br />
proposed commercial use requires blending with gasoline, a prerogative of PEMEX<br />
Refinación, which is also the owner and operator of the PEMEX franchise, resi<strong>de</strong>s supplying<br />
all fu<strong>el</strong>s sold in retail stations.<br />
The IEPS and IVA laws cover the imports and the retail sales of gasoline and dies<strong>el</strong>. Article<br />
2 nd of the IEPS law <strong>de</strong>termines that the reference prices of imported gasoline and dies<strong>el</strong> would<br />
be adjusted to account for their quality to which handling and net freight costs to the retail<br />
stations should be ad<strong>de</strong>d. The latter components would be free from IVA.<br />
16
<strong>Potenciales</strong> y <strong>Viabilidad</strong> <strong><strong>de</strong>l</strong> <strong>Uso</strong> <strong>de</strong> <strong>Bioetanol</strong> y <strong>Biodies<strong>el</strong></strong> <strong>para</strong> <strong>el</strong> Transporte en México (SENER-BID-GTZ)<br />
Task 8: Synthesis and recommendations<br />
Article 2 nd , item B, establishes the tax rate for potable and industrial ethanol, <strong>de</strong>natured and<br />
un-<strong>de</strong>natured, as w<strong>el</strong>l as for spent molasses at 50%. Obviously, the Mexican legislation is yet<br />
to contemplate the tax rate for fu<strong>el</strong> ethanol. When it does, the IEPS and the IVA for fu<strong>el</strong><br />
ethanol would have to be established with a view to facilitate the market penetration of fu<strong>el</strong><br />
ethanol in the Mexican economy.<br />
The “Ley <strong>de</strong> Energía <strong>para</strong> <strong>el</strong> Campo” sets out the regulations and criteria for supporting all<br />
agricultural activities. The “Secretaría <strong>de</strong> Agricultura, Gana<strong>de</strong>ría, Desarrollo Rural, Pesca y<br />
Alimentación” (SAGARPA), <strong>de</strong>termines the energy quotas for each kind of agricultural<br />
activity for each productive cycle.<br />
The <strong>de</strong>cree of the “Ley <strong>para</strong> la Promoción y Desarrollo <strong>de</strong> Bioenergéticos” has been approved<br />
by the Chamber of Deputies and by the Senate and has now been returned to the Deputies for<br />
reconciliation. As is, the Decree <strong>de</strong>fines a maximum volume content of bio-ethanol for the<br />
formulation of gasolines at national lev<strong>el</strong>, and requests estimates of the investment required to<br />
build up a ethanol production infrastructure, as w<strong>el</strong>l as the support nee<strong>de</strong>d to consolidate an<br />
make feasible this initiative, driven by concerns over the national agricultural <strong>de</strong>v<strong>el</strong>opment of<br />
Mexico.<br />
NOM-086, published in the Fe<strong>de</strong>ration Official Gazette (DOF) in 30th. January 2006, <strong>de</strong>fines<br />
the specifications for gasoline (PEMEX Magna y Premium). PEMEX Magna gasoline<br />
marketed in the metropolitan areas of Guadalajara (ZMG), Monterrey (ZMMTY) and the<br />
Valle <strong>de</strong> México (ZMVM), can contain a maximum of 2.7% oxygen by weight. The same<br />
goes at the national lev<strong>el</strong> for PEMEX Premium, but there is no mention of the specific<br />
oxygenated product to use, except the need to report which one is being used. The currently<br />
used oxygenate is the methyl ter-butyl ether and the methyl ter-amyl ether (MTBE and<br />
TAME, respectiv<strong>el</strong>y). Some is ma<strong>de</strong> in Mexico and the balance is imported as MTBE.<br />
As is the case in the oil industry worldwi<strong>de</strong>, there is an innate preference to bring to market<br />
refined products where it can exercise a measure of control in or<strong>de</strong>r to manage margins,<br />
profitability and the tax load. Purchasing a finished fu<strong>el</strong>, such as fu<strong>el</strong> ethanol with posted<br />
prices, from outsi<strong>de</strong> the industry limits the possibilities of internal transfer pricing and margin<br />
management. Given that PEMEX is the sole buyer of fu<strong>el</strong> ethanol in Mexico, PEMEX has<br />
consi<strong>de</strong>rable leverage regarding bringing ethanol gasoline blends to market.<br />
PEMEX would need to make infrastructure arrangements in or<strong>de</strong>r to transport ethanol from<br />
distilleries, store ethanol at blending terminals, blend the ethanol with gasoline in the<br />
prescribed proportion and distribute the blen<strong>de</strong>d fu<strong>el</strong> to retail station in tank trucks. Ethanol, in<br />
contrast with the ter-butyl ethers is not fungible with gasoline and requires segregation until<br />
blending and loading the tank trucks for distribution. Neverth<strong>el</strong>ess, making the necessary<br />
infrastructure arrangements <strong>de</strong>scribed above need not be an expensive proposition and has<br />
been done before in other countries, which use fu<strong>el</strong> ethanol, such as Brazil, the USA,<br />
Thailand, India, Kenya, Malawi, Paraguay and others.<br />
An issue that has to be addressed is the storage of fu<strong>el</strong> ethanol to allow for a smooth supply<br />
even when the distilleries are not running due to the inter harvest period. This has to be<br />
negotiated between the distilleries, which would have to store the bulk of the volume of<br />
ethanol and PEMEX, which would need to maintain some fu<strong>el</strong> ethanol storage thems<strong>el</strong>ves, at<br />
17
<strong>Potenciales</strong> y <strong>Viabilidad</strong> <strong><strong>de</strong>l</strong> <strong>Uso</strong> <strong>de</strong> <strong>Bioetanol</strong> y <strong>Biodies<strong>el</strong></strong> <strong>para</strong> <strong>el</strong> Transporte en México (SENER-BID-GTZ)<br />
Task 8: Synthesis and recommendations<br />
blending terminals and at ocean ports that might be receiving in or shipping out fu<strong>el</strong> ethanol.<br />
Besi<strong>de</strong>s the tankage investment requirements there is the obvious issue of who pays to<br />
maintain the inventory.<br />
Refining operations would have to be adjusted in or<strong>de</strong>r to prepare a gasoline blend stock<br />
suitable for blending with gasoline. This is so due to the rise in vapor pressure when ethanol is<br />
ad<strong>de</strong>d to gasoline. Thus, butanes and pentanes, which are low value common light components<br />
of gasoline, must be removed to lower the vapor pressure of the blend stock so that when<br />
ethanol is ad<strong>de</strong>d, the vapor pressure rise does not go above the specified limit established by<br />
the environmental authorities. This operation results in refineries having to move butanes and<br />
pentanes to low value markets and therefore possibly reducing refining margins. However, in<br />
most countries in the world where ethanol is blen<strong>de</strong>d with gasoline, this is a reality that<br />
refineries have become used to live with. On the other hand, since Mexico is a net importer of<br />
gasoline, the introduction of fu<strong>el</strong> ethanol blends up to 10% would save on investment in new<br />
refining capacity to produce more gasoline and would save on gasoline imports.<br />
Mexico’s Ter-butyl ether (MTBE + TAME) capacity from 6 plants is 15.6 thousand barr<strong>el</strong>s a<br />
day (TBD), which resulted in 2005 in a <strong>de</strong>ficit of 7.4 TBD. Ter-butyl ether plants owned and<br />
operated by PEMEX in Mexico would switch to making ETBE, according to Scenarios #1 and<br />
#2. In phasing out MTBE, if the market regulations allow, ETBE making is a higher value<br />
proposition than the alternative of making alkylates and iso-octane, for the output of the plant<br />
would increase. The ol<strong>de</strong>st MTBE plant in the world, located in Ravenna, Italy, produces<br />
MTBE most of the time, but when ethanol prices are attractive, it mer<strong>el</strong>y changes operational<br />
<strong>para</strong>meters, such as pressure and temperature, and switches to ETBE making. Similarly, in<br />
France, former MTBE plants have switched to ETBE as a result of favorable subsidized<br />
ethanol prices. Thus, it should cause PEMEX no great expense to switch from MTBE to<br />
ETBE making in its domestic plants.<br />
To err on the si<strong>de</strong> of caution, before the introduction of ethanol gasoline blends, PEMEX<br />
would need to institute a rigorous program of inspection and maintenance of retail stations,<br />
especially with respect to un<strong>de</strong>rground storage tanks. This is due to the affinity of ethanol for<br />
water, which is often present in tank bottoms of un<strong>de</strong>rground storage tanks, which may lead to<br />
phase se<strong>para</strong>tion, especially in lower temperatures that may occur in some parts of Mexico on<br />
occasion throughout the year. Furthermore, retail stations operators would need training prior<br />
to the introduction of ethanol gasoline blends to ensure un<strong>de</strong>rstanding on their part of the<br />
nature of the new fu<strong>el</strong> blend and the adoption of pertinent operational and maintenance<br />
routines. Although these initiatives incur costs, the returns from a cleaner, trouble free<br />
operation would more than compensate the investment. The public may be uneasy about the<br />
introduction of a new fu<strong>el</strong> ethanol blend, which suggests caution in the early implementation<br />
to avoid damaging the image of fu<strong>el</strong> ethanol.<br />
The price of gasoline in Mexico is built up from the opportunity cost, <strong>de</strong>termined by the US<br />
Gulf Coast bulk gasoline spot prices. To this a series of taxes and levies are ad<strong>de</strong>d covering<br />
IEPS, IVA on all value ad<strong>de</strong>d along the chain, freight from terminal rack to retail station, and<br />
the commercial margin of the retailer. As the sole buyer of ethanol for blending with gasoline,<br />
PEMEX should not have its margins squeezed, if the price of ethanol is higher than the<br />
gasoline blend stock. Compensatory mechanisms mentioned <strong>el</strong>sewhere in this report should be<br />
activated when such situations occur to remove this potential strong barrier to the market<br />
18
<strong>Potenciales</strong> y <strong>Viabilidad</strong> <strong><strong>de</strong>l</strong> <strong>Uso</strong> <strong>de</strong> <strong>Bioetanol</strong> y <strong>Biodies<strong>el</strong></strong> <strong>para</strong> <strong>el</strong> Transporte en México (SENER-BID-GTZ)<br />
Task 8: Synthesis and recommendations<br />
penetration of fu<strong>el</strong> ethanol in Mexico. Convers<strong>el</strong>y, in situations where the price of ethanol is<br />
lower than the cost of gasoline blend stock, then the price differential should flow to the<br />
compensatory scheme referred to above.<br />
As Mexico shares a long bor<strong>de</strong>r with the USA, that inclu<strong>de</strong>s California, Arizona, New Mexico<br />
and Texas, there may be opportunities in the bor<strong>de</strong>r to introduce fu<strong>el</strong> ethanol blends on the<br />
Mexican si<strong>de</strong> of the bor<strong>de</strong>r. For instance, in California, fu<strong>el</strong> ethanol can be blen<strong>de</strong>d up to 5.7<br />
% in volume of gasoline. Thus, a 5% ethanol blend could be a starting point of fu<strong>el</strong> ethanol<br />
blend use in Mexico, especially as ethanol production is being built up and there is no<br />
sufficient capacity for a 10% blend.<br />
Obviously, prior to introducing ethanol blends in Mexico, it would be necessary for the proper<br />
authorities to <strong>de</strong>fine the specifications of ethanol gasoline blends via appropriate legislation<br />
and regulations. NOM-086-SEMARNAT-SENER-SCFI-2005 would have to be revised to<br />
account for fu<strong>el</strong> ethanol blends. There are plenty of examples of such specifications in the<br />
countries that are already using ethanol as a fu<strong>el</strong>. Since these specifications vary form country<br />
to country, Mexico should consi<strong>de</strong>r as a source for its own specifications those that fit its<br />
interests and peculiarities. Just to exemplify, in the USA, the product that leaves a ethanol<br />
distillery gate is actually E95, that is a blend of anhydrous ethanol containing 5% of gasoline,<br />
which is used as a <strong>de</strong>naturant agent and to characterize the change in the fiscal status of<br />
ethanol, from potable to fu<strong>el</strong>. On the other hand, in Brazil, there is no <strong>de</strong>naturant mentioned in<br />
the fu<strong>el</strong> ethanol specification.<br />
The technical compatibility of gasoline blends containing MTBE, ETBE and ethanol should<br />
not be an issue. For instance, gasoline fu<strong>el</strong>ed vehicles in New York State consume E10, a 10%<br />
ethanol gasoline blend, and when they trav<strong>el</strong> to the adjoining state of New Jersey they refill<br />
with gasoline containing MTBE. Thus, the fu<strong>el</strong> tanks of these vehicles might contain MTBE<br />
and ethanol at the same time. This is not an issue with vehicles newer than1986 mo<strong><strong>de</strong>l</strong>, but the<br />
Mexican fleet age distribution is different than that in the USA and this matter may need to be<br />
examined from a Mexican perspective.<br />
The Fu<strong>el</strong> Retail Network<br />
The fu<strong>el</strong> retail network would have to be technically equipped to handle the new fu<strong>el</strong> blends<br />
containing fu<strong>el</strong> ethanol. Their margins should not be affected by s<strong>el</strong>ling the new blends, lest<br />
they become a force of resistance to market penetration of fu<strong>el</strong> ethanol blends.<br />
PEMEX would have to provi<strong>de</strong> them with assistance, technical and otherwise, to prepare the<br />
retail stations to handle ethanol gasoline blends. This pre<strong>para</strong>tion would involve training of<br />
retail stations operators; verification of compatibility of materials, which would be in contact<br />
with the blends; thorough inspection of un<strong>de</strong>rground storage tanks and maintenance to<br />
minimize the amount of water. It would also inclu<strong>de</strong> possible repairs required to make the<br />
retail stations fit to handle fu<strong>el</strong> ethanol.<br />
There is no point in lab<strong>el</strong>ing the blends at the retail stations, for it might raise concerns among<br />
vehicle owners as to the suitability of the new fu<strong>el</strong> to their equipment. Obviously, as part of<br />
the overall pre<strong>para</strong>tions for a possible fu<strong>el</strong> ethanol program in Mexico, the automakers would<br />
be involved in assisting the operators of ol<strong>de</strong>r vehicles about specific measures they should<br />
19
<strong>Potenciales</strong> y <strong>Viabilidad</strong> <strong><strong>de</strong>l</strong> <strong>Uso</strong> <strong>de</strong> <strong>Bioetanol</strong> y <strong>Biodies<strong>el</strong></strong> <strong>para</strong> <strong>el</strong> Transporte en México (SENER-BID-GTZ)<br />
Task 8: Synthesis and recommendations<br />
un<strong>de</strong>rtake to be able to use the new blend. As the program gets established, then fu<strong>el</strong> ethanol<br />
could be promoted as a “green” fu<strong>el</strong>.<br />
Since gasoline prices should not be affected by the presence of ethanol and since the<br />
performance of vehicles, given pre<strong>para</strong>tory initiatives, would remain the same, no purpose<br />
would be achieved lab<strong>el</strong>ing the pumps at retail stations.<br />
The Mexican Automotive Industry<br />
The automotive industry, whose vehicles would have to be fit to run on ethanol gasoline<br />
blends and to advise the owners of vehicles ol<strong>de</strong>r than 1986 mo<strong><strong>de</strong>l</strong> year on the pre<strong>para</strong>tions<br />
and costs involved in having their vehicles ready for using ethanol gasoline blends. Mexican’s<br />
automotive industry makes cars for exports to a number of markets that require compatibility<br />
with ethanol gasoline blends of various compositions.<br />
A 2006 study presented by the Mexican Automotive Industry Association – AMIA to the<br />
stakehol<strong>de</strong>rs’ group that met several times at SENER, in Mexico City, referred to the US fu<strong>el</strong><br />
ethanol specification (ASTM-D-4806-98), in the absence of a Mexican specification. That<br />
specification was <strong>de</strong>v<strong>el</strong>oped for the conditions and interests prevalent in the US, where, for<br />
instance, ethanol as it leaves the distillery gate is actually E95, a blend of anhydrous ethanol<br />
and 5% gasoline used as a <strong>de</strong>naturant and as a way of changing the fiscal classification of<br />
ethanol from potable alcohol to fu<strong>el</strong> ethanol.<br />
The AMIA study is generally over cautious and not entir<strong>el</strong>y correct on a few technical points.<br />
The truth is that ethanol blends at 5% content are compatible with any vehicle in Mexico, or<br />
anywhere <strong>el</strong>se. In fact, a presentation by a representative of the Brazilian Automotive Industry<br />
Association at a meeting of the International Energy Agency in Paris, in June 2005, indicated<br />
that for a 5% ethanol blend, no change in engine components whatsoever is necessary. For a<br />
10% blend, only carbureted engines would require modification, probably on material of<br />
construction of the carburetor. This fits w<strong>el</strong>l with the 5.7% ethanol content in gasoline during<br />
the first two stages of implementation, as it would allow time for the vehicular fleet that<br />
requires adjustments to have them ma<strong>de</strong> prior to using the 10% blend in the latter stages of the<br />
program.<br />
20
ANNEX II<br />
<strong>Potenciales</strong> y <strong>Viabilidad</strong> <strong><strong>de</strong>l</strong> <strong>Uso</strong> <strong>de</strong> <strong>Bioetanol</strong> y <strong>Biodies<strong>el</strong></strong> <strong>para</strong> <strong>el</strong> Transporte en México (SENER-BID-GTZ)<br />
Task 8: Synthesis and recommendations<br />
Stakehol<strong>de</strong>rs’ Strategic Objectives, Risks and Mitigation<br />
Measures<br />
The key stakehol<strong>de</strong>rs in Mexico’s fu<strong>el</strong> ethanol economy have different strategic objectives,<br />
which may entail risks/barriers that may be overcome by certain mitigation measures. This is a<br />
dynamic process that changes with time as the political, social, economic and environmental<br />
situation changes. A snapshot of the present Mexican stakehol<strong>de</strong>rs’ framework of strategic<br />
objectives, risks/barriers and mitigation measures is <strong>de</strong>picted as follows:<br />
Strategic Objective Risks/Barriers Mitigation Measures<br />
Stakehol<strong>de</strong>r: PEMEX<br />
- Ether imports (MTBE) - Sunk costs of Mexican ether - Switch ether plants<br />
plants (MTBE, TAME)<br />
to iso-octane at low<br />
- Cost to convert ether plants investment cost<br />
to ETBE<br />
- Use existing ether<br />
assets<br />
- Gasoline imports - Availability of fu<strong>el</strong> ethanol - Save refinery invest-<br />
Supplies<br />
-ment to expand<br />
gasoline output<br />
- High gasoline margins - Risk of lower margins due to - Price ethanol at the<br />
occasional high ethanol costs opportunity cost of<br />
gasoline<br />
- Manage price<br />
differentials via fiscal<br />
mechanisms<br />
- Current fu<strong>el</strong> storage, - Investment in fu<strong>el</strong> ethanol - Not so expensive at<br />
Handling infrastructure storage, blending at terminals US?$ 6 million total?<br />
- Other large nations<br />
had no trouble doing it<br />
(USA, Brazil)<br />
Stakehol<strong>de</strong>r: The Fu<strong>el</strong> Retail Network<br />
- Keeping margins - Occasional high prices of - Manage price<br />
fu<strong>el</strong> ethanol<br />
differentials via fiscal<br />
mechanisms<br />
- New blend customers - Cost of inspection, maintenance - PEMEX to provi<strong>de</strong><br />
and repairs<br />
technical assistance<br />
- Ethanol r<strong>el</strong>ated special<br />
financing to fund<br />
inspection, maintenance<br />
and repairs<br />
21
<strong>Potenciales</strong> y <strong>Viabilidad</strong> <strong><strong>de</strong>l</strong> <strong>Uso</strong> <strong>de</strong> <strong>Bioetanol</strong> y <strong>Biodies<strong>el</strong></strong> <strong>para</strong> <strong>el</strong> Transporte en México (SENER-BID-GTZ)<br />
Task 8: Synthesis and recommendations<br />
Stakehol<strong>de</strong>r: Automotive Industry<br />
- Maintain/expand car sales - Pre-1986 mo<strong><strong>de</strong>l</strong> modifications - Auto-industry to<br />
Provi<strong>de</strong> technical<br />
Assistance<br />
- Carburetor change for blends - Ethanol r<strong>el</strong>ated<br />
over 5% ethanol content<br />
special financing to<br />
fund vehicle modifications<br />
- Expand exports to fu<strong>el</strong> - Competition in foreign markets - Export promotion<br />
ethanol consuming<br />
mechanisms<br />
countries<br />
Stakehol<strong>de</strong>r: Sugar Cane Growers<br />
- Increased no. of jobs - High cost of social compact - Devise alternatives<br />
<strong><strong>de</strong>l</strong>ivering same benefits of<br />
existing social compact<br />
- Ejido regime - New rules for new land<br />
un<strong>de</strong>r sugar cane for<br />
ethanol<br />
- Maintenance of social<br />
compact benefits<br />
Stakehol<strong>de</strong>r: Ethanol Distilleries<br />
- Alternative molasses - High cost of social compact - Revise social compact<br />
markets<br />
for molasses based fu<strong>el</strong><br />
ethanol<br />
- Export value of molasses - Ethanol may provi<strong>de</strong><br />
steadier markets and<br />
prices for molasses<br />
- Alternative use for pasture - Value of pasture land - New social compact<br />
for new land un<strong>de</strong>r sugar<br />
cane<br />
- Alternative uses of pasture - Steadier cash flow from<br />
land<br />
sugar cane for ethanol<br />
- Ethanol r<strong>el</strong>ated special<br />
financing to fund distillery<br />
construction<br />
22
<strong>Potenciales</strong> y <strong>Viabilidad</strong> <strong><strong>de</strong>l</strong> <strong>Uso</strong> <strong>de</strong> <strong>Bioetanol</strong> y <strong>Biodies<strong>el</strong></strong> <strong>para</strong> <strong>el</strong> Transporte en México (SENER-BID-GTZ)<br />
Task 8: Synthesis and recommendations<br />
Stakehol<strong>de</strong>r: Environmentalists<br />
Improved local air quality - Lack of <strong>de</strong>finitive information - Critical survey of<br />
on local environmental benefits literature<br />
of ethanol blends<br />
- Analysis of actual data<br />
Decreased GHG emissions - Lack of easier access to with Mexican blends<br />
carbon credits<br />
- Pilot CDM project<br />
before Bonn Board<br />
Improved water quality - Lack of knowledge of impact - Run water, soil<br />
of blend leakage on soil, water contamination studies<br />
un<strong>de</strong>r Mexican conditions in Mexico<br />
Stakehol<strong>de</strong>r: Consumers<br />
Total cost of operating - Ethanol blends may be costlier - Run trials in Mexico<br />
vehicle same or lower than pure gasoline with blends to confirm<br />
than gasoline - Maintenance costs may be ethanol blends total<br />
higher than with gasoline cost is same or lower<br />
than with gasoline<br />
Stakehol<strong>de</strong>r: Governments<br />
More, better rural jobs - High cost of ethanol production - Review/revise social<br />
compact<br />
Holding internal, external - Current sugar cane social compact<br />
migration - Lack of technical support - Broad technical<br />
support: agriculture to<br />
Improved local air quality<br />
ethanol to end use<br />
Mitigate GHG emissions<br />
- Dev<strong>el</strong>op fu<strong>el</strong> ethanol<br />
Stretch oil resources - Lack of articulated financing specifications<br />
for fu<strong>el</strong> ethanol program<br />
- Revive sugar cane<br />
variety program<br />
Create Mexican Fu<strong>el</strong> - lack of fu<strong>el</strong> ethanol mandate - Fully implement<br />
Ethanol Program<br />
pending legislation<br />
- PEMEX as the single buyer - Create joint<br />
Executive Secretariat<br />
SENER/SAGARPA<br />
to comprehensiv<strong>el</strong>y<br />
<strong>de</strong>v<strong>el</strong>op full package<br />
based on pending<br />
legislation on biofu<strong>el</strong>s<br />
and renewables,<br />
including mandates<br />
Create potential for new - Competition in foreign markets - Export promotion<br />
exports<br />
mechanisms<br />
23
<strong>Potenciales</strong> y <strong>Viabilidad</strong> <strong><strong>de</strong>l</strong> <strong>Uso</strong> <strong>de</strong> <strong>Bioetanol</strong> y <strong>Biodies<strong>el</strong></strong> <strong>para</strong> <strong>el</strong> Transporte en México (SENER-BID-GTZ)<br />
Task 8: Synthesis and recommendations<br />
ANNEX III<br />
Parametric mo<strong><strong>de</strong>l</strong> to set the value of the metric ton of sugar cane<br />
in the state of São Paulo, Brazil<br />
ORGANIZATION RESPONSIBLE FOR THE SYSTEM:<br />
CONSECANA – Council of Producers of Sugar Cane, Sugar and Ethanol of the State of São<br />
Paulo. CONSECANA is a not for profit organization composed of 5 representatives of<br />
in<strong>de</strong>pen<strong>de</strong>nt sugar cane growers and 5 representatives of the sugar cane processors.<br />
CONSECANA began its activities in 1998, the year when government policy changed from<br />
administering the sugar cane industry prices and let the market <strong>de</strong>termine the prices of sugar<br />
and ethanol.<br />
TECHNICAL SUPPORT:<br />
Experts from the two si<strong>de</strong>s.<br />
OVERALL REVIEW AND REVISION:<br />
Every 5 years. Punctual adjustments, from harvest to harvest<br />
MODEL:<br />
Voluntary, not coercitive. It provi<strong>de</strong>s a reference value for setting the value of sugar cane prior<br />
to the harvest. It has been adopted by practically all cane growers and suppliers and mill and<br />
distilleries.<br />
The mo<strong><strong>de</strong>l</strong> assumes:<br />
Financial-economic <strong>para</strong>meters:<br />
Share of sugar cane of the net sales prices (without taxes) at mill/distillery gate earned by the<br />
mills/distilleries s<strong>el</strong>ling sugar and ethanol in domestic and foreign markets.<br />
White sugar and Very High Polarization – VHP: 59.5%<br />
All types of ethanol: 61.5%<br />
These <strong>para</strong>meters were <strong>de</strong>v<strong>el</strong>oped from the sugar cane production costs and the costs of<br />
processing sugar cane; the capital return and <strong>de</strong>preciation of investment in agriculture and<br />
processing, within market conditions and equipment useful life; and working capital<br />
requirements for both agricuture and for the mills/distilleries.<br />
The lev<strong>el</strong> of losses and efficiency adopted for the <strong>para</strong>meters for the amount of Total<br />
Reducing Sugars (ATR) in sugar cane and and the price of the Kg of the ATR were as<br />
follows:<br />
- Overall losses of the production process: 9.5%<br />
- Fermentation efficiency: 88%<br />
- Distillation efficiency: 99%<br />
24
<strong>Potenciales</strong> y <strong>Viabilidad</strong> <strong><strong>de</strong>l</strong> <strong>Uso</strong> <strong>de</strong> <strong>Bioetanol</strong> y <strong>Biodies<strong>el</strong></strong> <strong>para</strong> <strong>el</strong> Transporte en México (SENER-BID-GTZ)<br />
Task 8: Synthesis and recommendations<br />
Quantifying ATR in sugar cane:<br />
From sugar cane analysis the amount of ATR is given by the formula b<strong>el</strong>ow:<br />
ATR = 9.5263 x PC + 9.05 x ARC, where:<br />
PC = Pol (Polarization) of sugar cane<br />
ARC = Sugar cane reducing sugars<br />
Example:<br />
Average sugar cane in the State of São Paulo:<br />
PC = 15.0% pol<br />
ARC = 0.5<br />
Thus, ATR is 147.42 Kgs.<br />
This same sugar cane can yi<strong>el</strong>d:<br />
83.52 liters anhydrous ethanol<br />
or,<br />
87.,16 liters hydrous ethanol (neat ethanol)<br />
or<br />
121.97 Kg Crystal Standard Sugar ( 150 color)<br />
and<br />
11 liters of anhydrous ethanol, or any production mix accrding to the configuration and<br />
capacity of the mills/distilleries<br />
CONVERSION FACTORS FOR THE PRODUCTS AND FOR PRICES AS A FUNCTION<br />
OF THE VALUE OF THE Kg OF ATR:<br />
.<br />
White Sugar:<br />
1 Kg of white sugar equals 1.0495 Kg ATR<br />
VHP Sugar:<br />
1 Kg VHP sugar equals 1.0453 Kg ATR<br />
Anhydrous Ethanol:<br />
1 liter anhydrous ethanol equals 1.7651 Kg ATR<br />
Hydrous Ethanol:<br />
1 liter hydrous ethanol equals 1.6913 Kg ATR<br />
Example:<br />
Anhydrous ethanoll s<strong>el</strong>ling price: R$ 1.00/ liter<br />
Invoicing per metric ton of milled sugar cane: 83.52<br />
ATR content of sugar cane: 147.42<br />
Value of one Kg of ATR: 0.34843 = ( 83.52/1.7651*.615)<br />
Value of one metric ton of sugar cane: R$ 51,36<br />
25
<strong>Potenciales</strong> y <strong>Viabilidad</strong> <strong><strong>de</strong>l</strong> <strong>Uso</strong> <strong>de</strong> <strong>Bioetanol</strong> y <strong>Biodies<strong>el</strong></strong> <strong>para</strong> <strong>el</strong> Transporte en México (SENER-BID-GTZ)<br />
Task 8: Synthesis and recommendations<br />
Examples can be <strong>de</strong>v<strong>el</strong>oped for any of the products and prices consi<strong>de</strong>red employing the<br />
<strong>para</strong>meters mentioned above<br />
PRICES:<br />
Consecana contracted the University of São Paulo Centro <strong>de</strong> Estudos Avançados em<br />
Economia Aplicada (Cepea)/Esalq to survey the prices enjoyed by São Paulo State producers<br />
in s<strong>el</strong>ling sugar and ethanol to the domestic and external markets, which are w<strong>el</strong>l accepted by<br />
the market and by the r<strong>el</strong>evant stakehol<strong>de</strong>rs.<br />
26
List of References<br />
<strong>Potenciales</strong> y <strong>Viabilidad</strong> <strong><strong>de</strong>l</strong> <strong>Uso</strong> <strong>de</strong> <strong>Bioetanol</strong> y <strong>Biodies<strong>el</strong></strong> <strong>para</strong> <strong>el</strong> Transporte en México (SENER-BID-GTZ)<br />
Task 8: Synthesis and recommendations<br />
Lazcano, I., 2006a, Activity 3: Overview of Agricultural Aspects, Documento final <strong>de</strong> trabajo<br />
<strong><strong>de</strong>l</strong> Proyecto Feasibility of Biomasa-Derived Etanol as a Fu<strong>el</strong> for Transportation, SENER/BID<br />
(Project ME-T1007 – ATN/DO-9375-ME).<br />
Lazcano, I., 2006b, Activity 4: Ethanol Feed Stocks, Documento final <strong>de</strong> trabajo <strong><strong>de</strong>l</strong> Proyecto<br />
Feasibility of Biomasa-Derived Etanol as a Fu<strong>el</strong> for Transportation, SENER/BID (Project ME-<br />
T1007 – ATN/DO-9375-ME).<br />
Macedo, I.C., 2006, Activity 6: Potentials in R<strong>el</strong>ation to Sustainability Criteria, Final working<br />
documento of the project Feasibility of Biomass-Derived Ethanol as a Fu<strong>el</strong> for Transportation,<br />
SENER/BID (Project ME-T1007 – ATN/DO-9375-ME).<br />
Masera, O and Manu<strong>el</strong>a Prehn, 2006, Activity 1: Economic Overview, Documento final <strong>de</strong><br />
trabajo <strong><strong>de</strong>l</strong> Proyecto Feasibility of Biomass-Derived Ethanol as a Fu<strong>el</strong> for Transportation, SENER/BID<br />
(Project ME-T1007 – ATN/DO-9375-ME), 28 April.<br />
Nogueira, L. A. H., 2006, Activity 5: Production and Utilization of Ethanol and ETBE in<br />
Mexico: Current Status and Future Prospects, Documento final <strong>de</strong> trabajo <strong><strong>de</strong>l</strong> Proyecto Feasibility<br />
of Biomass-Derived Ethanol as a Fu<strong>el</strong> for Transportation, SENER/BID (Project ME-T1007 –<br />
ATN/DO-9375-ME).<br />
Pádua Rodrigues, Antônio <strong>de</strong>, 2006. Personal Communication on the Brazilian Sugar Cane Social<br />
Compact, 6 September.<br />
Rodríguez, N., 2006, Activity 2: México´s Energy Picture, Documento final <strong>de</strong> trabajo <strong><strong>de</strong>l</strong> Proyecto<br />
Feasibility of Biomass-Derived Ethanol as a Fu<strong>el</strong> for Transportation, SENER/BID (Project ME-T1007<br />
– ATN/DO-9375-ME).<br />
27
4 <strong>Biodies<strong>el</strong></strong> in Mexico
Task B: Agricultural aspects and sources for biodies<strong>el</strong> production<br />
Ignacio Lazcano Martínez
<strong>Potenciales</strong> y <strong>Viabilidad</strong> <strong><strong>de</strong>l</strong> <strong>Uso</strong> <strong>de</strong> <strong>Bioetanol</strong> y <strong>Biodies<strong>el</strong></strong> <strong>para</strong> <strong>el</strong> Transporte en México (SENER-BID-GTZ)<br />
Task B: Agricultural aspects and sources for biodies<strong>el</strong> production<br />
Índice<br />
1. Consi<strong>de</strong>raciones Generales<br />
1.1 S<strong>el</strong>ección <strong>de</strong> cultivos <strong>para</strong> materia prima<br />
1.2 Las Regiones s<strong>el</strong>eccionadas<br />
2. Palma Africana o <strong>de</strong> aceite<br />
2.1 Condiciones ambientales<br />
2.2 Tipología <strong>de</strong> productores<br />
2.3 Generación <strong>de</strong> empleo<br />
2.4 Eslabón <strong>de</strong> industrialización<br />
2.5 Análisis económico sustantivo<br />
2.6 Participación <strong>de</strong> la materia prima (costo primo) en la fabricación por litro <strong>de</strong> <strong>Biodies<strong>el</strong></strong><br />
3. Jatropha Curcas<br />
3.1 Composición <strong>de</strong> la semilla <strong>de</strong> Jatropha Curcas<br />
3.2 Análisis económico sustantivo<br />
3.3 Costo <strong>de</strong> la plantación y mantenimiento <strong><strong>de</strong>l</strong> cultivo por hectárea en la vida útil <strong><strong>de</strong>l</strong><br />
proyecto<br />
3.4 Participación <strong>de</strong> la materia prima (costo primo) en la fabricación por litro <strong>de</strong> <strong>Biodies<strong>el</strong></strong><br />
4. Frijol Soya<br />
4.1 Composición <strong><strong>de</strong>l</strong> grano <strong>de</strong> Soya<br />
4.2 Costo <strong>de</strong> cultivo y cosecha <strong>de</strong> la Soya, tecnología temporal en <strong>el</strong> sur <strong>de</strong> Tamaulipas.<br />
Ciclo PV 2005<br />
4.3 Análisis económico sustantivo<br />
4.4 El Costo primo <strong>de</strong> la Soya en la producción <strong>de</strong> un litro <strong>de</strong> <strong>Biodies<strong>el</strong></strong><br />
5. Colza 62<br />
5.1 Análisis económico en la Zona <strong>de</strong> Cortazar, Gto ciclo OI 2005-06<br />
5.2 Análisis <strong><strong>de</strong>l</strong> cultivo en <strong>el</strong> Valle <strong><strong>de</strong>l</strong> Yaqui, Sonora<br />
5.3 Composición <strong>de</strong> la semilla <strong>de</strong> Colza<br />
5.4 Costo Primo <strong>de</strong> la semilla <strong>de</strong> Colza en la producción <strong>de</strong> un litro <strong>de</strong> <strong>Biodies<strong>el</strong></strong>
<strong>Potenciales</strong> y <strong>Viabilidad</strong> <strong><strong>de</strong>l</strong> <strong>Uso</strong> <strong>de</strong> <strong>Bioetanol</strong> y <strong>Biodies<strong>el</strong></strong> <strong>para</strong> <strong>el</strong> Transporte en México (SENER-BID-GTZ)<br />
Task B: Agricultural aspects and sources for biodies<strong>el</strong> production<br />
6. Cártamo<br />
6.1 Análisis económico <strong><strong>de</strong>l</strong> Cártamo en <strong>el</strong> Valle <strong><strong>de</strong>l</strong> Yaqui, Sonora<br />
6.2 Composición <strong>de</strong> la semilla <strong>de</strong> Cártamo<br />
6.3 Costo primo <strong><strong>de</strong>l</strong> Cártamo en la producción <strong>de</strong> un litro <strong>de</strong> <strong>Biodies<strong>el</strong></strong><br />
7. Girasol<br />
7.1 Análisis económico sustantivo<br />
7.2 Composición <strong>de</strong> la semilla <strong>de</strong> girasol<br />
7.3 El costo primo <strong>de</strong> la semilla <strong>de</strong> girasol en la producción <strong>de</strong> un litro <strong>de</strong> <strong>Biodies<strong>el</strong></strong><br />
8. Resumen <strong>de</strong> los costos primos <strong>de</strong> cultivos potenciales <strong>para</strong> la producción por litro, <strong>de</strong><br />
<strong>Biodies<strong>el</strong></strong> en México<br />
9. Bibliografía
<strong>Potenciales</strong> y <strong>Viabilidad</strong> <strong><strong>de</strong>l</strong> <strong>Uso</strong> <strong>de</strong> <strong>Bioetanol</strong> y <strong>Biodies<strong>el</strong></strong> <strong>para</strong> <strong>el</strong> Transporte en México (SENER-BID-GTZ)<br />
Task B: Agricultural aspects and sources for biodies<strong>el</strong> production<br />
1. Consi<strong>de</strong>raciones generales<br />
Se <strong>de</strong>nomina <strong>Biodies<strong>el</strong></strong> (metil-ester <strong>de</strong> ácidos grasos), al producto resultante <strong>de</strong> la reacción<br />
química entre los ácidos grasos, principalmente <strong>de</strong> los aceites vegetales con alcoholes como <strong>el</strong><br />
metanol o <strong>el</strong> etanol. El proceso se llama químicamente: transesterificación.<br />
El <strong>Biodies<strong>el</strong></strong> sustituye como combustible limpio y renovable a los <strong>de</strong>rivados <strong><strong>de</strong>l</strong> petróleo,<br />
concretamente al Dies<strong>el</strong> y lo hace con ventaja ecológica ya que reduce las emisiones <strong>de</strong> gases<br />
que provocan <strong>el</strong> efecto <strong>de</strong> inverna<strong>de</strong>ro. Así, por ejemplo, <strong>el</strong> uso <strong>de</strong> una ton<strong>el</strong>ada <strong>de</strong><br />
<strong>Biodies<strong>el</strong></strong>, evita la producción <strong>de</strong> 2.5 ton<strong>el</strong>adas <strong>de</strong> dióxido <strong>de</strong> carbono (CO2) y sobre todo<br />
<strong>el</strong>imina, si se usa <strong>el</strong> <strong>Biodies<strong>el</strong></strong> solo en los motores, las emisiones <strong>de</strong> azufre (SO2) <strong><strong>de</strong>l</strong> Dies<strong>el</strong>,<br />
evitando las lluvias ácidas; a<strong>de</strong>más, lo que es fundamental: es un combustible renovable y no<br />
finito como los hidrocarburos.<br />
La producción mundial <strong>de</strong> <strong>Biodies<strong>el</strong></strong> en <strong>el</strong> lapso <strong>de</strong> 1993-2003 creció a una impresionante tasa<br />
<strong><strong>de</strong>l</strong> 28.5% anual, <strong>de</strong> 38 a 467 millones <strong>de</strong> galones, mientras la producción <strong>de</strong> <strong>Bioetanol</strong> creció<br />
a una tasa <strong><strong>de</strong>l</strong> 6.7% anual en <strong>el</strong> mismo periodo <strong>de</strong> tiempo, alcanzando en <strong>el</strong> año <strong>de</strong> 2003, los 5<br />
mil 770 millones <strong>de</strong> galones.<br />
Fuente: World Watch Energy Agency 2004.<br />
1.1 S<strong>el</strong>ección <strong>de</strong> cultivos <strong>para</strong> materia prima<br />
La primera especie s<strong>el</strong>eccionada por su gran eficiencia y productividad en <strong>el</strong> trópico húmedo y<br />
sub-húmedo, así como la gran superficie que la pue<strong>de</strong> alojar en nuestro país y que hoy no<br />
necesariamente es tierra <strong>de</strong> cultivo, lo es La Palma Africana. (Elaeis guineensis jacq)<br />
La segunda, la Jatropha curcas L. ó piñoncillo, s<strong>el</strong>eccionada por su adaptación a condiciones<br />
difíciles <strong>de</strong> su<strong>el</strong>o y clima, su rusticidad y capacidad <strong>de</strong> mejorar los su<strong>el</strong>os.<br />
Como tercer cultivo, se analizará <strong>el</strong> Frijol Soya (Glicina max) porque en su producción <strong>de</strong><br />
temporal, se podrían en <strong>el</strong> futuro próximo cultivar amplias superficies hoy prácticamente<br />
marginales.<br />
A solicitud <strong>de</strong> GTZ hemos incluido también, <strong>el</strong> análisis técnico-económico <strong>de</strong> los cultivos <strong>de</strong><br />
Colza, Cártamo y Girasol.<br />
1.2 Las regiones s<strong>el</strong>eccionadas<br />
Para <strong>el</strong> <strong>de</strong>sarrollo <strong>de</strong> la palma africana con propósitos <strong>de</strong> <strong>Biodies<strong>el</strong></strong>, la región s<strong>el</strong>eccionada fue:<br />
Pacífico sur, específicamente áreas como <strong>el</strong> Soconusco en los municipios <strong>de</strong> Acapetahua,<br />
Acocoyahua y Mapastepec.<br />
Para <strong>el</strong> caso <strong>de</strong> la Jatropha, se consi<strong>de</strong>ra la region Peninsular, específicamente en lo que fue la<br />
Zona Henequenera <strong>de</strong> Yucatán.<br />
1
<strong>Potenciales</strong> y <strong>Viabilidad</strong> <strong><strong>de</strong>l</strong> <strong>Uso</strong> <strong>de</strong> <strong>Bioetanol</strong> y <strong>Biodies<strong>el</strong></strong> <strong>para</strong> <strong>el</strong> Transporte en México (SENER-BID-GTZ)<br />
Task B: Agricultural aspects and sources for biodies<strong>el</strong> production<br />
En lo que se refiere a la Soya, se analiza su cultivo en la región Huasteca, <strong>de</strong> los estados <strong>de</strong><br />
Tamaulipas, Veracruz y San Luis Potosí.<br />
Para <strong>el</strong> caso <strong>de</strong> la Colza <strong>el</strong> estudio se hizo <strong>para</strong> las zonas <strong>de</strong> Cortazar, Gto y <strong>el</strong> Valle <strong><strong>de</strong>l</strong> Yaqui,<br />
Sonora; regiones <strong>de</strong> El Bajío y <strong>el</strong> Mar <strong>de</strong> Cortés respectivamente.<br />
El Cártamo se analiza en la zona <strong>de</strong> mayor superficie y producción <strong>de</strong> la República, que es la<br />
<strong><strong>de</strong>l</strong> Valle <strong><strong>de</strong>l</strong> Yaqui, Sonora en la region <strong><strong>de</strong>l</strong> Mar <strong>de</strong> Cortés.<br />
El cultivo <strong><strong>de</strong>l</strong> Girasol, que prácticamente no se cultiva en México, ha tenido un buen esfuerzo<br />
en <strong>el</strong> pasado, en <strong>el</strong> estado <strong>de</strong> Tamaulipas, región <strong><strong>de</strong>l</strong> Golfo Norte y es por <strong>el</strong>lo que con la<br />
tecnología <strong>de</strong> temporal, se analiza en la zona centro <strong><strong>de</strong>l</strong> estado mencionado.<br />
2. Palma africana o <strong>de</strong> aceite (Elaeis guineensis jacq)<br />
Es una planta <strong><strong>de</strong>l</strong> trópico húmedo, que es la mejor opción <strong>para</strong> las tierras bajas <strong>de</strong> las regiones<br />
tropicales y ayuda a prevenir la erosión.<br />
En Instituto Nacional <strong>de</strong> Investigaciones Forestales, Agrícolas y Pecuarias, (INIFAP) nos<br />
informa que existen <strong>el</strong> país, “alre<strong>de</strong>dor” <strong>de</strong> 2.5 millones <strong>de</strong> hectáreas con buen potencial <strong>para</strong><br />
su cultivo, localizadas en los estados <strong>de</strong> Chiapas, Campeche, Guerrero, Michoacán, Oaxaca,<br />
Quintana Roo, Tabasco y Veracruz.<br />
En <strong>el</strong> año 2004, se encontraban bajo cultivo en nuestro país, 36,374 has, en Chiapas,<br />
Veracruz, Campeche y Tabasco, <strong>de</strong> las cuales 30,603 son <strong>de</strong> temporal, <strong>de</strong>stacando los<br />
rendimientos <strong>de</strong> Chiapas con un poco más <strong>de</strong> 18 ton<strong>el</strong>adas <strong>de</strong> racimos frescos por hectárea y<br />
un precio medio rural <strong>de</strong> $ 628 por ton<strong>el</strong>ada <strong>de</strong> fruta fresca.<br />
Es oportuno mencionar que en otros países <strong>de</strong> América como en Costa Rica, con nuevas<br />
varieda<strong>de</strong>s y <strong>de</strong>s<strong>de</strong> luego mejor tecnología <strong>de</strong> producción que la nuestra, se cosechan <strong>de</strong> 38 a<br />
40 ton<strong>el</strong>adas por hectárea por año, <strong>de</strong> racimos <strong>de</strong> fruta fresca, que se traducen en 9.8 ton<strong>el</strong>adas<br />
<strong>de</strong> aceite con los que se pue<strong>de</strong>n producir 12,302 litros <strong>de</strong> <strong>Biodies<strong>el</strong></strong> por hectárea.<br />
La producción mundial <strong>de</strong> aceite <strong>de</strong> Palma en <strong>el</strong> ciclo 2003-04, se pronosticó en 28.77<br />
millones <strong>de</strong> ton<strong>el</strong>adas métricas. Este pronóstico <strong>para</strong> 2004-05 fue <strong>de</strong> 30.4 millones <strong>de</strong><br />
ton<strong>el</strong>adas, siendo los principales productores Malasia e Indonesia.<br />
En América <strong>de</strong>stacan por su producción <strong>de</strong> 2004-05 (Tons <strong>de</strong> aceite)<br />
Ecuador 262,000<br />
Costa Rica 189,000<br />
Brasil 149,000<br />
Honduras 144,000<br />
Guatemala 92,000<br />
Venezu<strong>el</strong>a 85,000<br />
Fuente: Oil World Statistics.2004.<br />
2
<strong>Potenciales</strong> y <strong>Viabilidad</strong> <strong><strong>de</strong>l</strong> <strong>Uso</strong> <strong>de</strong> <strong>Bioetanol</strong> y <strong>Biodies<strong>el</strong></strong> <strong>para</strong> <strong>el</strong> Transporte en México (SENER-BID-GTZ)<br />
Task B: Agricultural aspects and sources for biodies<strong>el</strong> production<br />
Se proyecto un precio <strong>para</strong> <strong>el</strong> aceite crudo en <strong>el</strong> ciclo 2004-05 <strong>de</strong> US472 dólares ($5,428<br />
pesos) por ton<strong>el</strong>ada métrica, referenciado a Rótterdam.<br />
En México en <strong>el</strong> año <strong>de</strong> 2003, la superficie sembrada era <strong>de</strong> 29,167 hectáreas y la superficie<br />
cosechada produjo 217 mil ton<strong>el</strong>adas <strong>de</strong> racimos frescos. El precio medio rural por ton<strong>el</strong>ada<br />
fue <strong>de</strong> 731 pesos, es <strong>de</strong>cir 103 pesos más que <strong>el</strong> pagado a los agricultores <strong><strong>de</strong>l</strong> Soconusco en <strong>el</strong><br />
año <strong>de</strong> 2004.<br />
2.1 Condiciones ambientales<br />
Su<strong>el</strong>o: Este cultivo requiere que existan su<strong>el</strong>os profundos y bien drenados, con pH <strong>de</strong> 4 a 7,<br />
como son los cambisoles, vertisoles y acrisoles.<br />
En cuanto a los su<strong>el</strong>os, estos también presentan una variación muy fuerte, así tenemos que en<br />
<strong>el</strong> estado <strong>de</strong> Campeche, po<strong>de</strong>mos encontrar <strong>de</strong>s<strong>de</strong> rendzinas <strong>de</strong> texturas arcillosas con<br />
topografía plana y escarpada en la zona Sabancuy-Escárcega hasta su<strong>el</strong>os planos y profundos<br />
<strong>de</strong> textura arcillosa y franca como son los luvisoles y gleysoles <strong>de</strong> la región Aguacatal y<br />
Palizada.<br />
En cuanto al estado <strong>de</strong> Chiapas, po<strong>de</strong>mos encontrar su<strong>el</strong>os <strong>de</strong> las series luvisoles y regosoloes<br />
con texturas francas y franca arenosa, <strong>de</strong> topografía plana y ligeramente inclinada; finalmente<br />
en los estados <strong>de</strong> Tabasco y Veracruz, tenemos su<strong>el</strong>os tanto luvisoles como acrisoles <strong>de</strong><br />
texturas francas y topografía plana.<br />
Clima: Debido a la temperatura y humedad que requiere este cultivo <strong>el</strong> clima propicio<br />
<strong>para</strong> su <strong>de</strong>sarrollo es <strong>el</strong> Cálido – Húmedo y Cálido – Subhumedo.<br />
Precipitación: Este es un cultivo que requiere <strong>de</strong> gran<strong>de</strong>s cantida<strong>de</strong>s <strong>de</strong> agua por lo que la<br />
precipitación pluvial idónea es <strong>de</strong> 1800 mm bien distribuidos durante todo <strong>el</strong> año.<br />
Como se mencionó anteriormente, <strong>el</strong> cultivo <strong>de</strong> palma <strong>de</strong> aceite se encuentra establecido en la<br />
región climática <strong><strong>de</strong>l</strong> trópico húmedo, en don<strong>de</strong> los volúmenes <strong>de</strong> precipitación son muy<br />
importantes y varían ampliamente <strong>de</strong> una zona a otra, así tenemos que en <strong>el</strong> estado <strong>de</strong><br />
Campeche, esta va <strong>de</strong>s<strong>de</strong> los 1200 mm en la parte centro-sur, mientras que en <strong>el</strong> sursureste<br />
esta es <strong>de</strong> 1800 mm anuales, por otro lado en <strong>el</strong> estado <strong>de</strong> Chiapas, esta varia <strong>de</strong> 2000 mm en<br />
la parte <strong><strong>de</strong>l</strong> Soconusco en la zona costera hasta más <strong>de</strong> 2400 en la zona<br />
S<strong>el</strong>va en la región <strong>de</strong> Palenque.<br />
Una <strong>de</strong> las regiones <strong>de</strong> mayor precipitación, es la zona <strong><strong>de</strong>l</strong> golfo, que compren<strong>de</strong> a<br />
los estados <strong>de</strong> Tabasco y Veracruz, en don<strong>de</strong> pue<strong>de</strong>n llegar a ser mayores a los 2400<br />
mm anuales.<br />
Temperatura: Lo i<strong>de</strong>al <strong>para</strong> este cultivo es una temperatura media <strong>de</strong> 22° C a 28° C.<br />
Altitud: La altitud requerida por <strong>el</strong> cultivo es <strong>de</strong> hasta los 400 metros sobre <strong>el</strong> niv<strong>el</strong> <strong><strong>de</strong>l</strong> mar.<br />
3
<strong>Potenciales</strong> y <strong>Viabilidad</strong> <strong><strong>de</strong>l</strong> <strong>Uso</strong> <strong>de</strong> <strong>Bioetanol</strong> y <strong>Biodies<strong>el</strong></strong> <strong>para</strong> <strong>el</strong> Transporte en México (SENER-BID-GTZ)<br />
Task B: Agricultural aspects and sources for biodies<strong>el</strong> production<br />
2.2 Tipología <strong>de</strong> productores<br />
A principios <strong><strong>de</strong>l</strong> año 2003, <strong>de</strong> acuerdo al padrón nacional <strong>de</strong> productores, existen un total <strong>de</strong><br />
7,325, <strong>de</strong> los que <strong>el</strong> 96 % correspon<strong>de</strong>n al sector social y <strong>el</strong> resto 4 % al sector privado. D<strong>el</strong><br />
total <strong>de</strong> productores, <strong>el</strong> estado <strong>de</strong> Chiapas tiene <strong>el</strong> mayor número, con 3,246 que correspon<strong>de</strong><br />
al 44 %; <strong>el</strong> estado <strong>de</strong> Veracruz con 2,469 con <strong>el</strong> 34 %; Campeche con 900 que correspon<strong>de</strong>n al<br />
12 % y finalmente se encuentra Tabasco con 710 productores que equivale al 10 %.<br />
Fuente: Estudio Ca<strong>de</strong>na <strong>de</strong> la palma <strong>de</strong> aceite Campeche. Inifap, Produce, Cofupro<br />
La mayoría <strong>de</strong> los productores están organizados en diferentes formas jurídicas entre las que<br />
se pue<strong>de</strong>n mencionar, Socieda<strong>de</strong>s <strong>de</strong> producción Rural (SPR), Socieda<strong>de</strong>s <strong>de</strong> Solidaridad<br />
Social,<br />
Asociación Agrícola <strong>de</strong> productores <strong>de</strong> Palma y Sectores <strong>de</strong> Producción Rural, finalmente,<br />
existe una pequeña proporción <strong>de</strong> productores libres, los cuales están en proceso <strong>de</strong><br />
incorporación a alguna <strong>de</strong> estas organizaciones. En Campeche existe una organización llamada<br />
Unión <strong>de</strong> Palmicultores <strong><strong>de</strong>l</strong> Milenio, formada por 15 SPR. En Tabasco, se encuentran las<br />
Asociaciones Agrícolas Locales <strong>de</strong> Productores <strong>de</strong> Palma <strong>de</strong> Aceite <strong>de</strong> Tenosique, Balancán y<br />
Jalapa. En Veracruz, están las Uniones Estatal <strong>de</strong> Palma <strong>de</strong> Aceite <strong>de</strong> Veracruz y Regional <strong>de</strong><br />
Productores <strong>de</strong> Palma <strong>de</strong> Aceite, SSS.<br />
2.3 Generación <strong>de</strong> empleo<br />
De acuerdo a las estimaciones hechas en las zonas <strong>de</strong> producción, se consi<strong>de</strong>ra que se pue<strong>de</strong>n<br />
generar hasta 50 jornales por hectárea por año, por lo que si se consi<strong>de</strong>ra que la superficie<br />
establecida al 2003 <strong>de</strong> 29,167 hectáreas, se estarían generando un total 1´458,335 jornales,<br />
esto sin consi<strong>de</strong>rar las maniobras <strong>de</strong> acarreo, labor que corre por cuenta <strong>de</strong> la empresa<br />
extractora, en la mayoría <strong>de</strong> los casos.<br />
2.4 Eslabón <strong>de</strong> Industrialización<br />
Las oleaginosas anuales en México han mostrado reducido crecimiento como <strong>para</strong> ser<br />
importante en la sustitución <strong>de</strong> importaciones <strong>de</strong> semillas; por lo que éstos continuarán siendo<br />
base <strong>para</strong> <strong>el</strong> uso <strong>de</strong> la capacidad instalada <strong>de</strong> la industria.<br />
La industria aceitera <strong>de</strong> palma esta compuesta tanto por extractoras como refinadoras. En <strong>el</strong><br />
caso <strong>de</strong> las plantas extractoras <strong>de</strong> aceite crudo <strong>de</strong> palma, estas se localizan en los cuatro<br />
estados productores, <strong>de</strong>bido a que por sus características físico-químicas <strong>de</strong>be procesarse en<br />
un lapso <strong>de</strong> tiempo muy corto.<br />
La capacidad instalada conjunta <strong>de</strong> las plantas extractoras, alcanza 68 ton<strong>el</strong>adas <strong>de</strong> racimos <strong>de</strong><br />
fruta fresca por hora, encontrándose estas instalaciones industriales principalmente en <strong>el</strong><br />
estado <strong>de</strong> Chiapas, pero se cuenta con <strong>el</strong>las en Veracruz, Campeche y Tabasco. Solo una <strong>de</strong><br />
estas agroindustrias pertenece al sector social y también es oportuno <strong>de</strong>stacar que siete <strong>de</strong> las<br />
nueve instalaciones iniciaron activida<strong>de</strong>s en los años 2001 al 2004, como se muestra en <strong>el</strong><br />
siguiente cuadro.<br />
4
<strong>Potenciales</strong> y <strong>Viabilidad</strong> <strong><strong>de</strong>l</strong> <strong>Uso</strong> <strong>de</strong> <strong>Bioetanol</strong> y <strong>Biodies<strong>el</strong></strong> <strong>para</strong> <strong>el</strong> Transporte en México (SENER-BID-GTZ)<br />
Task B: Agricultural aspects and sources for biodies<strong>el</strong> production<br />
PLANTAS EXTRACTORAS DE ACEITE DE PALMA EN EL SURESTE MEXICANO<br />
Extractora Municipio Estado Capacidad Inicio <strong>de</strong> Sector<br />
(Tmrff/hora) activida<strong>de</strong>s<br />
LA LIMA Villa Comaltitlan Chiapas 2 1970 Privado<br />
BEPASSA Acapetahua Chiapas 6 1995 Social<br />
AGROIMSA Mapastepec Chiapas 10 2001 Privado<br />
PROPALMA SA Acapetahua Chiapas 10 2002 Privado<br />
PALMA TICA<br />
DE MEXICO Palenque Chiapas 10 2004 Privado<br />
AGROIPSA SA Palenque Chiapas 8 2004 Privado<br />
CIA ACEITERA<br />
CAMPECHANA Escárcega Campeche 8 2003 Privado/social<br />
ACEITES DE<br />
PALMA Acayucan Veracruz 10 2003 Privado<br />
Soc <strong>de</strong> Prod <strong>de</strong><br />
PALMA Jalapa Tabasco 6 2003 Privado<br />
Fuente: ANIAME<br />
2.5 Análisis económico sustantivo<br />
La vida útil económica <strong>de</strong> la palma africana que se tomó <strong>para</strong> este trabajo fue <strong>de</strong> 23 años, con<br />
21 años <strong>de</strong> producción que se inicia a los 3 años <strong>de</strong> plantada.<br />
La producción acumulada en su vida útil alcanzó 433 ton<strong>el</strong>adas por hectárea, con un promedio<br />
<strong>de</strong> 20.64 ton<strong>el</strong>adas <strong>de</strong> cosecha por año.<br />
Fuente: Union <strong>de</strong> Palmicultores.2004<br />
Edad (Años)<br />
Producción anual (t/RFF/ha)<br />
3 6.5<br />
4 13.0<br />
5 18.0<br />
6 19.5<br />
7 21.0<br />
8 22.5<br />
9 24.0<br />
10 24.0<br />
11 24.0<br />
12 24.0<br />
13 24.0<br />
14 24.0<br />
15 24.0<br />
16 24.0<br />
17 24.0<br />
18 22.0<br />
19 21.0<br />
20 20.0<br />
21 19.0<br />
22 18.0<br />
23 17.0<br />
Total 433.5<br />
5
<strong>Potenciales</strong> y <strong>Viabilidad</strong> <strong><strong>de</strong>l</strong> <strong>Uso</strong> <strong>de</strong> <strong>Bioetanol</strong> y <strong>Biodies<strong>el</strong></strong> <strong>para</strong> <strong>el</strong> Transporte en México (SENER-BID-GTZ)<br />
Task B: Agricultural aspects and sources for biodies<strong>el</strong> production<br />
El valor actual <strong>de</strong> este volumen <strong>de</strong> cosecha se <strong>el</strong>eva a $271,924 por hectárea con una media <strong>de</strong><br />
valor anual <strong>de</strong> ingreso bruto <strong>de</strong> $11,823/ha.<br />
Los apoyos <strong><strong>de</strong>l</strong> Gobierno <strong>de</strong> Chiapas al cultivo <strong>de</strong> la palma, consisten en la entrega gratuita <strong>de</strong><br />
la planta lista <strong>para</strong> ponerse en <strong>el</strong> lugar <strong>de</strong>finitivo, más $2,000 por hectárea <strong>para</strong> la plantación.<br />
La inversión actual con cargo al agricultor <strong>para</strong> establecer una hectárea <strong>de</strong> palma es <strong>de</strong><br />
$13,543. Los gastos <strong>de</strong> mantenimiento/ha promedian aproximadamente $5,000/año. Los <strong>de</strong><br />
cosecha $150/ton y <strong>el</strong> acarreo <strong>de</strong> los racimos $40/ton.<br />
Así, <strong>el</strong> análisis económico referido a una ton<strong>el</strong>ada y una hectárea, en la vida <strong>de</strong> la plantación<br />
se presenta <strong>de</strong> la siguiente manera:<br />
Costo <strong>de</strong> producción cosecha y acarreo por ton<strong>el</strong>ada:<br />
Plantación $ 13,543/433 ton<strong>el</strong>adas = $31.28<br />
Mantenimiento 23 años $115,000/433 ton 265.59<br />
Cosecha 150.00<br />
Acarreo 40.00<br />
Costo total por ton<strong>el</strong>ada RFF, LAB planta 486.87<br />
Precio al agricultor por ton <strong>de</strong> racimo 628.00<br />
R<strong>el</strong>ación Beneficio-costo 1.29<br />
Rendimiento por peso invertido 2.12<br />
Fuente: Palmas Oleaginosas <strong>de</strong> Acapetahua SPR <strong>de</strong> RI<br />
El análisis por hectárea se presentaría así:<br />
Racimos cosechados (ton<strong>el</strong>adas) 433<br />
Valor acumulado <strong>de</strong> la cosecha $ 271, 924<br />
Costo <strong>de</strong> la plantación (13,543)<br />
Costo <strong><strong>de</strong>l</strong> mantenimiento acumulado (115,000)<br />
Costo <strong>de</strong> la cosecha acumulada ( 64,950)<br />
Costo <strong><strong>de</strong>l</strong> acarreo acumulado ( 17,320)<br />
Margen: 61,111<br />
R<strong>el</strong>ación Beneficio-costo 1.29<br />
Rendimiento por peso invertido 2.12<br />
Margen promedio por ha, por año $ 2,657.00<br />
2.6 Participación <strong>de</strong> la materia prima (costo primo) en la fabricación por litro <strong>de</strong><br />
<strong>Biodies<strong>el</strong></strong><br />
Una ton<strong>el</strong>ada <strong>de</strong> aceite más 150 kilos <strong>de</strong> etanol, producen 1,050 kilos <strong>de</strong> <strong>Biodies<strong>el</strong></strong> mas 100<br />
kilos <strong>de</strong> glicerina. Consi<strong>de</strong>rando solo los productos principales, tenemos que, en virtud <strong><strong>de</strong>l</strong><br />
peso volumétrico <strong><strong>de</strong>l</strong> ester (0.9) con una ton<strong>el</strong>ada <strong>de</strong> aceite se producen 1,167 litros <strong>de</strong><br />
<strong>Biodies<strong>el</strong></strong>. En tal razón:<br />
6
<strong>Potenciales</strong> y <strong>Viabilidad</strong> <strong><strong>de</strong>l</strong> <strong>Uso</strong> <strong>de</strong> <strong>Bioetanol</strong> y <strong>Biodies<strong>el</strong></strong> <strong>para</strong> <strong>el</strong> Transporte en México (SENER-BID-GTZ)<br />
Task B: Agricultural aspects and sources for biodies<strong>el</strong> production<br />
Costo primo <strong><strong>de</strong>l</strong> racimo <strong>de</strong> palma por litro <strong>de</strong> <strong>Biodies<strong>el</strong></strong>:<br />
5 (487) – 5(31) 6.80 = 1,381<br />
1,381/ 1167 = 1.18<br />
Consi<strong>de</strong>rando <strong>el</strong> costo <strong>de</strong> extracción por ton<strong>el</strong>ada <strong>de</strong> aceite crudo y abonando <strong>el</strong> valor <strong><strong>de</strong>l</strong><br />
Palmiste:<br />
[5 (487) + 839] – [5(31) 6.80 ] / 1167 = 1.90<br />
En don<strong>de</strong>:<br />
Rendimiento <strong><strong>de</strong>l</strong> mesocarpio <strong>de</strong> RFF en aceite = 200 kilos/ton RFF<br />
Rendimiento <strong><strong>de</strong>l</strong> Palmiste en aceite = 31 kilos /ton RFF<br />
Para producir una ton<strong>el</strong>ada <strong>de</strong> aceite <strong>de</strong> mesocarpio se utilizan 5 ton<strong>el</strong>adas <strong>de</strong> RFF y se obtiene<br />
también 155 kilos <strong>de</strong> aceite <strong>de</strong> Palmiste.<br />
$ 487 es <strong>el</strong> costo total por ton <strong>de</strong> RFF, LAB planta<br />
$ 839 es <strong>el</strong> costo <strong>de</strong> extracción <strong><strong>de</strong>l</strong> aceite <strong>de</strong> 5 ton<strong>el</strong>adas <strong>de</strong> RFF <strong><strong>de</strong>l</strong> mesocarpio<br />
$ 6.80 precio por kilogramo <strong>de</strong> aceite <strong>de</strong> Palmiste ya <strong>de</strong>scontado su costo <strong>de</strong> extracción.<br />
1,167 litros <strong>de</strong> <strong>Biodies<strong>el</strong></strong> obtenidos con una ton<strong>el</strong>ada <strong>de</strong> aceite <strong><strong>de</strong>l</strong> mesocarpio.<br />
Al com<strong>para</strong>r <strong>el</strong> precio <strong><strong>de</strong>l</strong> aceite crudo, referenciado en Rótterdam, con <strong>el</strong> costo primo <strong>de</strong> los<br />
frutos <strong>de</strong> la Palma y con <strong>el</strong> costo primo incluida la extracción <strong><strong>de</strong>l</strong> aceite, queda claro que <strong>el</strong><br />
gran margen <strong>de</strong> utilidad se obtiene en <strong>el</strong> proceso <strong>de</strong> comercialización <strong><strong>de</strong>l</strong> producto. Es por<br />
<strong>el</strong>lo, que la integración <strong>de</strong> los agricultores en toda la ca<strong>de</strong>na <strong>de</strong> valor agregado es lo que haría<br />
posible en condiciones competitivas la ubicación <strong>de</strong> este producto en <strong>el</strong> mercado.<br />
3. La Jatropha Curcas L. (Familia <strong>de</strong> las Euforbeaceas)<br />
México, en su biodiversidad, también alberga a esta noble planta nativa <strong><strong>de</strong>l</strong> país, conocida<br />
como Piñón o Piñoncillo.<br />
Se le localiza en climas tropicales y semi-tropicales, es un arbusto-árbol que llega a medir <strong>de</strong> 1<br />
a 8 metros y se <strong>de</strong>sarrolla en altitu<strong>de</strong>s que van <strong>de</strong> 5 a 1,500 msnm. Crece en su<strong>el</strong>os pobres y<br />
arenosos, es resistente a la sequía y la semilla posee un importante contenido <strong>de</strong> proteína y <strong>de</strong><br />
grasa. Se cultiva en India, África y Centroamérica <strong>para</strong> obtener <strong>Biodies<strong>el</strong></strong>. No se cultiva en<br />
México.<br />
La Jatropha se conoce en la Península <strong>de</strong> Yucatán como “Sikil-Te” y se distribuye en Chiapas,<br />
Oaxaca, Quintana Roo, Guerrero, Hidalgo, Puebla, Veracruz, Tamaulipas, Sinaloa y Sonora.<br />
En México no hay conocimientos ni experiencia sobre la Jatropha cultivada, en tal virtud,<br />
tomaremos <strong>para</strong> <strong>el</strong> presente análisis las experiencias <strong>de</strong> otros países principalmente Nicaragua,<br />
en don<strong>de</strong> ya existen las plantaciones y la Agroindustria.<br />
La planta empieza a producir <strong>de</strong>s<strong>de</strong> <strong>el</strong> primer año, aunque con rendimientos mo<strong>de</strong>rados y éstos<br />
se incrementan durante los primeros cinco años y luego se estabilizan, con vida útil que pue<strong>de</strong><br />
7
<strong>Potenciales</strong> y <strong>Viabilidad</strong> <strong><strong>de</strong>l</strong> <strong>Uso</strong> <strong>de</strong> <strong>Bioetanol</strong> y <strong>Biodies<strong>el</strong></strong> <strong>para</strong> <strong>el</strong> Transporte en México (SENER-BID-GTZ)<br />
Task B: Agricultural aspects and sources for biodies<strong>el</strong> production<br />
alcanzar hasta 50 años. Nosotros hemos consi<strong>de</strong>rado un mo<strong><strong>de</strong>l</strong>o cuya vida útil llega a 23 años<br />
con 21 <strong>de</strong> producción comercial.<br />
El rendimiento por hectárea, ya estabilizado en este mo<strong><strong>de</strong>l</strong>o es <strong>de</strong> 5 ton<strong>el</strong>adas <strong>de</strong> semilla seca<br />
por hectárea, <strong>de</strong> los cuales <strong>de</strong> 1.8 a 2 ton<strong>el</strong>adas son <strong>de</strong> aceite y 3.255 ton<strong>el</strong>adas <strong>de</strong> Torta rica en<br />
proteína (57%).<br />
La Región Peninsular, <strong>el</strong>egida <strong>para</strong> <strong>el</strong> presente análisis, concretamente en <strong>el</strong> noreste <strong>de</strong><br />
Yucatán, en las áreas conocidas como “Henequeneras” en <strong>el</strong> pasado, presenta las siguientes<br />
características:<br />
Medio físico.- Zona Centro-Oriente.<br />
Su<strong>el</strong>os arcillos, poco profundos, pero ricos en materia orgánica en don<strong>de</strong> <strong>el</strong> tipo <strong>de</strong> su<strong>el</strong>os<br />
Rendzina domina sobre <strong>el</strong> Litosol. La producción <strong>de</strong> henequén ha sido <strong>de</strong> las más altas <strong>de</strong><br />
toda <strong>el</strong> área.<br />
Las lluvias son principalmente en verano (800 mm) pero llueve en la época seca <strong>de</strong> invierno<br />
(120 mm).<br />
La Geohidrología <strong>de</strong> la zona nos muestra una profundidad <strong><strong>de</strong>l</strong> manto acuífero <strong>de</strong> 6 a 20 metros<br />
y agua con altos contenidos <strong>de</strong> calcio (Bicarbonatos) provenientes <strong>de</strong> la disolución <strong>de</strong> las rocas<br />
calcáreas, con valores <strong>de</strong> salinidad que van <strong>de</strong> 400 a 1,200 ppm.<br />
La clasificación <strong><strong>de</strong>l</strong> clima se expresaría así: Ax’ (wo) (i’) g. Cálido, sub-húmedo con lluvias<br />
intermedias, también en invierno. (Fuente: Instituto <strong>de</strong> Geografía UNAM 1993)<br />
Los terrenos son planos, con baja altura sobre <strong>el</strong> niv<strong>el</strong> <strong><strong>de</strong>l</strong> mar y sería posible si se planifica <strong>el</strong><br />
mo<strong><strong>de</strong>l</strong>o con altos rendimientos <strong>de</strong> semilla y calidad <strong>de</strong> ésta, introducir <strong>el</strong> riego “con<br />
manguera” a la usanza tradicional <strong>de</strong> los agricultores <strong>de</strong> la zona, <strong>para</strong> <strong>el</strong> cultivo <strong>de</strong> sus<br />
hortalizas y frutales.<br />
3.1 Composición <strong>de</strong> la semilla <strong>de</strong> Jatropha Curcas<br />
% en peso<br />
Agua 6.6<br />
Grasa 38.0<br />
Carbohidratos totales 32.5<br />
Proteína 18.2<br />
Cenizas 4.0<br />
Fuente: Purdue University 1983<br />
8
<strong>Potenciales</strong> y <strong>Viabilidad</strong> <strong><strong>de</strong>l</strong> <strong>Uso</strong> <strong>de</strong> <strong>Bioetanol</strong> y <strong>Biodies<strong>el</strong></strong> <strong>para</strong> <strong>el</strong> Transporte en México (SENER-BID-GTZ)<br />
Task B: Agricultural aspects and sources for biodies<strong>el</strong> production<br />
3.2 Análisis económico sustantivo<br />
En los 24 años <strong>de</strong> vida útil <strong><strong>de</strong>l</strong> proyecto, se cosecharán 102.34 ton<strong>el</strong>adas <strong>de</strong> semilla seca por<br />
hectárea, con una población <strong>de</strong> 1,111 plantas por hectárea (3m x 3m), obtenida a través <strong>de</strong><br />
semilla o <strong>de</strong> esqueje. Según se expresa a continuación.<br />
Producción <strong>de</strong> semilla seca, torta gana<strong>de</strong>ra proteica, aceite y <strong>Biodies<strong>el</strong></strong>, por año, por hectárea.<br />
Durante 21 años.<br />
Año Semilla kg/ha Torta kg/ha Aceite kg/ha <strong>Biodies<strong>el</strong></strong> lts/ha<br />
3 3,340 2,174 1,166 1,449<br />
4 4,000 2,604 1,396 1,735<br />
5 5,000 3,255 1,745 2,168<br />
6-24 90,000 58,590 31,410 39,030<br />
Totales 102,340 66.623 35,717 44,382<br />
3.3 Costo <strong>de</strong> la plantación y mantenimiento <strong><strong>de</strong>l</strong> cultivo por hectárea, en la vida útil <strong><strong>de</strong>l</strong><br />
proyecto<br />
Semilla 992<br />
Planta vivero 992<br />
Pre<strong>para</strong>ción <strong><strong>de</strong>l</strong> terreno <strong>de</strong>finitivo (m.obra) 2,060<br />
Siembra 257<br />
Subtotal 4,201<br />
Costo <strong>de</strong> cultivo<br />
Chapeos (2 al año) dos años 2,000<br />
Chapeos (1 al año) 21 años 21,000<br />
Cultivos y podas 21 años 13,650<br />
Combate <strong>de</strong> plagas 23 años 6,900<br />
Subtotal 43,550<br />
Cosecha <strong>de</strong> fruta fresca ($150/ton)<br />
21 años (corte y acarreo) 101,316<br />
Flete a la Agroindustria ($30/ton) 20,263<br />
Costo total por hectárea (23 años) 169,430<br />
Costo total por kilo <strong>de</strong> nuez seca $ 1.66<br />
3.4 Participación <strong>de</strong> la materia prima (Costo Primo) en la fabricación por litro <strong>de</strong><br />
<strong>Biodies<strong>el</strong></strong><br />
En la práctica, una ton<strong>el</strong>ada <strong>de</strong> nuez seca, produce 349 kilos <strong>de</strong> aceite más 651 kilos <strong>de</strong> torta.<br />
Los 349 kilos <strong>de</strong> aceite producirán 436 litros <strong>de</strong> <strong>Biodies<strong>el</strong></strong>:<br />
Costo <strong>de</strong> la semilla 1,660<br />
Valor <strong>de</strong> la torta a la gana<strong>de</strong>ría ( 508)<br />
Costo <strong>de</strong> la materia prima a <strong>Biodies<strong>el</strong></strong> 1,152<br />
Costo Primo por litro <strong>de</strong> <strong>Biodies<strong>el</strong></strong> $ 2.64<br />
9
<strong>Potenciales</strong> y <strong>Viabilidad</strong> <strong><strong>de</strong>l</strong> <strong>Uso</strong> <strong>de</strong> <strong>Bioetanol</strong> y <strong>Biodies<strong>el</strong></strong> <strong>para</strong> <strong>el</strong> Transporte en México (SENER-BID-GTZ)<br />
Task B: Agricultural aspects and sources for biodies<strong>el</strong> production<br />
4. Frijol Soya (Glycine max L., Merril. Familia Leguminosas)<br />
Planta anual <strong>de</strong> origen oriental, que prefiere <strong>para</strong> su buen <strong>de</strong>sarrollo, veranos cálidos y<br />
húmedos. En México, se emplea como aceite <strong>para</strong> cocinar y la pasta, co-producto <strong><strong>de</strong>l</strong> proceso<br />
<strong>de</strong> extracción, como fuente <strong>de</strong> proteína en los alimentos balanceados <strong>para</strong> <strong>el</strong> ganado. Producto<br />
muy apreciado.<br />
Su cultivo ha disminuido significativamente en nuestro país, casi ha <strong>de</strong>saparecido en la<br />
tecnología <strong>de</strong> riego y se produce <strong>de</strong> temporal, principalmente en <strong>el</strong> sur <strong>de</strong> Tamaulipas zona en<br />
la que en <strong>el</strong> año <strong>de</strong> 2004 se cultivaron 54,000 hectáreas.<br />
La producción nacional alcanzó en ese año, 133 mil ton<strong>el</strong>adas en 89 mil hectáreas cosechadas,<br />
80 mil <strong>de</strong> temporal y sólo 9 mil 600 <strong>de</strong> riego, éstas también en Tamaulipas.<br />
En Chiapas (Soconusco) y en San Luis Potosí hubo siembras <strong>de</strong> temporal en 12 mil y 11 mil<br />
hectáreas respectivamente en <strong>el</strong> año <strong><strong>de</strong>l</strong> 2004.<br />
El rendimiento medio nacional, fue <strong>de</strong> 1,500 kilos por hectárea. Así, resulta obligado <strong>para</strong><br />
nuestro país comprar en <strong>el</strong> exterior, gran<strong>de</strong>s cantida<strong>de</strong>s <strong>de</strong> frijol soya y <strong>de</strong> pasta: <strong><strong>de</strong>l</strong> grano<br />
importamos en <strong>el</strong> ciclo 2004-05 tres y medio millones <strong>de</strong> ton<strong>el</strong>adas y se proyecta importar seis<br />
millones <strong>para</strong> <strong>el</strong> ciclo 2015-2016.<br />
Cabe mencionar que en los Estados Unidos <strong>de</strong> América la producción <strong>de</strong> Soya <strong><strong>de</strong>l</strong> ciclo 2004-<br />
05, fue <strong>de</strong> 85 millones <strong>de</strong> ton<strong>el</strong>adas con un rendimiento <strong>de</strong> 2.84 ton<strong>el</strong>adas por hectárea. En<br />
Brasil, la superficie <strong>de</strong>stinada al cultivo <strong>de</strong> la soya en <strong>el</strong> 2004, fue <strong>de</strong> aproximadamente 21<br />
millones <strong>de</strong> hectáreas.<br />
Fuente: Sagarpa anuario estadístico <strong>de</strong> la producción agrícola 2004<br />
USDA Bas<strong>el</strong>ine Agricultural Outlook forum. Marzo 2006.<br />
Para <strong>el</strong> propósito <strong><strong>de</strong>l</strong> presente análisis, conviene mencionar nuevamente que México importa<br />
gran<strong>de</strong>s volúmenes <strong>de</strong> oleaginosas y po<strong>de</strong>mos afirmar, que nuestra producción <strong>de</strong>be<br />
consi<strong>de</strong>rarse ya como marginal.<br />
En tal virtud, <strong>el</strong> cultivo <strong>de</strong> la soya <strong>para</strong> propósitos <strong>de</strong> producción <strong>de</strong> <strong>Biodies<strong>el</strong></strong>, <strong>de</strong>bería<br />
dirigirse a la promoción y <strong>de</strong>sarrollo <strong>de</strong> este cultivo en áreas <strong>de</strong> temporal <strong>de</strong> la Región<br />
Huasteca, estados <strong>de</strong> Tamaulipas, San Luis Potosí y norte <strong>de</strong> Veracruz, en don<strong>de</strong> se pue<strong>de</strong>n<br />
encontrar amplias superficies (más <strong>de</strong> un millón <strong>de</strong> hectáreas) muy probablemente propias en<br />
su<strong>el</strong>o y lluvia <strong>para</strong> los cultivos bioenergéticos, aún combinando soya <strong>de</strong> verano con cártamo<br />
<strong>de</strong> invierno <strong>de</strong> humedad.<br />
El campo experimental INIFAP <strong>de</strong> Cd. Cuauhtémoc, municipio <strong>de</strong> Altamira, Tamaulipas, ha<br />
encontrado muy buenas varieda<strong>de</strong>s, prometedoras <strong>de</strong> altos rendimientos potenciales<br />
(varieda<strong>de</strong>s Huastecas 200, 300 y 400) bajo condiciones <strong>de</strong> buen temporal entendido como<br />
cantidad y distribución <strong>de</strong> la lluvia.<br />
10
<strong>Potenciales</strong> y <strong>Viabilidad</strong> <strong><strong>de</strong>l</strong> <strong>Uso</strong> <strong>de</strong> <strong>Bioetanol</strong> y <strong>Biodies<strong>el</strong></strong> <strong>para</strong> <strong>el</strong> Transporte en México (SENER-BID-GTZ)<br />
Task B: Agricultural aspects and sources for biodies<strong>el</strong> production<br />
Actualmente en la zona <strong>de</strong> Altamira y parte <strong>de</strong> González, sur <strong>de</strong> Tamaulipas, con varieda<strong>de</strong>s<br />
<strong>de</strong> origen Brasileño, la productividad <strong>de</strong> la soya <strong>de</strong> temporal (siembras <strong>de</strong> junio) alcanza las<br />
dos ton<strong>el</strong>adas por hectárea.<br />
4.1 Composición <strong><strong>de</strong>l</strong> grano <strong>de</strong> Soya<br />
% en peso<br />
Agua 6.0<br />
Aceite 18.0<br />
Proteína 38.0<br />
Fibra 8.0<br />
Carbohidratos solubles 14.0<br />
Carbohidratos insolubles 14.0<br />
Cenizas 2.0<br />
Una ton<strong>el</strong>ada <strong>de</strong> granos <strong>de</strong> soya con 6 – 8 % <strong>de</strong> humedad, al procesarse, produce<br />
aproximadamente 200 litros <strong>de</strong> aceite y 800 kilos <strong>de</strong> torta o pasta, la cual contiene <strong><strong>de</strong>l</strong> 44 al<br />
47% <strong>de</strong> proteína, o sea alre<strong>de</strong>dor <strong>de</strong> 360 kilos.<br />
Los 200 litros <strong>de</strong> aceite al esterificarse con <strong>Bioetanol</strong> y sosa potásica como catalizador,<br />
producirán 220 litros <strong>de</strong> <strong>Biodies<strong>el</strong></strong>.<br />
En cuanto a la pasta <strong>de</strong> soya con 45% <strong>de</strong> proteína, alcanza un precio <strong>de</strong> aproximadamente<br />
2,155 pesos por ton<strong>el</strong>ada o sea $4.79 por kilo <strong>de</strong> proteína y por <strong>el</strong>lo los 800 kilos <strong>de</strong> pasta que<br />
se <strong>de</strong>rivan <strong>de</strong> una ton<strong>el</strong>ada <strong>de</strong> frijoles, aportarán un valor <strong>de</strong> 1,724 pesos, que se abonaran al<br />
costo <strong>de</strong> producción <strong>de</strong> los granos <strong>de</strong> soya, que se calcula enseguida.<br />
4.2 Costo <strong>de</strong> cultivo y cosecha <strong>de</strong> la Soya (Tecnología <strong>de</strong> temporal en <strong>el</strong> sur <strong>de</strong><br />
Tamaulipas)<br />
Ciclo PV 2005-05. ( sin renta <strong>de</strong> tierra) Por hectárea.<br />
Pre<strong>para</strong>ción <strong><strong>de</strong>l</strong> terreno $ 1,140<br />
Siembra 845<br />
Fertilización 471<br />
Labores culturales 460<br />
Control <strong>de</strong> plagas 450<br />
Cosecha 410<br />
Total costos directos 3,776<br />
Costos indirectos 936<br />
Costo total 4,712<br />
Fuente: INIFAP<br />
11
<strong>Potenciales</strong> y <strong>Viabilidad</strong> <strong><strong>de</strong>l</strong> <strong>Uso</strong> <strong>de</strong> <strong>Bioetanol</strong> y <strong>Biodies<strong>el</strong></strong> <strong>para</strong> <strong>el</strong> Transporte en México (SENER-BID-GTZ)<br />
Task B: Agricultural aspects and sources for biodies<strong>el</strong> production<br />
4.3 Análisis económico sustantivo<br />
Costo <strong>de</strong> producción por hectárea $ 4,712<br />
Rendimiento 2 ton<strong>el</strong>adas por hectárea<br />
Costo <strong>de</strong> producción por ton<strong>el</strong>ada 2,356<br />
Precio <strong>de</strong> venta por ton<strong>el</strong>ada 3,000<br />
Margen por ton<strong>el</strong>ada 644<br />
R<strong>el</strong>ación Beneficio-costo 1.24<br />
Rendimiento por peso invertido 1.39<br />
4.4 El costo primo <strong>de</strong> la Soya en la producción <strong>de</strong> un litro <strong>de</strong> <strong>Biodies<strong>el</strong></strong>.<br />
Costo <strong><strong>de</strong>l</strong> frijol Soya 1,000 kilos $2,356<br />
Valor <strong>de</strong> la pasta <strong>de</strong> Soya (1,724)<br />
Costo <strong>de</strong> la materia prima a <strong>Biodies<strong>el</strong></strong> 632<br />
<strong>Biodies<strong>el</strong></strong> producido (litros) 220<br />
Costo Primo por litro <strong>de</strong> <strong>Biodies<strong>el</strong></strong> $ 2.87<br />
5. Colza (Brassica napus L)<br />
En los dos ciclos <strong><strong>de</strong>l</strong> año 2004, se cosecharon en México 1,228 hectáreas, <strong>de</strong> las cuales 837<br />
fueron <strong>de</strong> temporal (secano) y 371 <strong>de</strong> riego.<br />
Su rendimiento medio fue <strong>de</strong> : en riego 2,126 kilos por hectárea; en temporal 1,537 kilos por<br />
hectárea. El precio medio rural fue <strong>de</strong> $3,489.00 por ton<strong>el</strong>ada.<br />
Los estados productores fueron: Tamaulipas, Jalisco, Tlaxcala y México.<br />
En <strong>el</strong> año <strong><strong>de</strong>l</strong> 2005 se incorporó Guanajuato a la producción bajo riego, en <strong>el</strong> ciclo otoño<br />
invierno 2005-06.<br />
5.1 Análisis económico sustantivo en la zona <strong>de</strong> Cortazar, Gto, ciclo otoño-invierno<br />
2005-2006<br />
El costo <strong>de</strong> producción fue <strong>de</strong> $5,700 por hectárea con financiamiento y maquinaria propios.<br />
La semilla provino <strong>de</strong> Canadá, varieda<strong>de</strong>s Exc<strong>el</strong>l y Jayola (precoz). El precio <strong>de</strong> la semilla fue<br />
<strong>de</strong> $100.00 por kilo y se sembraron 6 kilos por hectárea (por <strong>el</strong> tamaño tan pequeño <strong>de</strong> la<br />
semilla, los agricultores no pudieron sembrar la cantidad recomendada <strong>de</strong> 3 kilos por hectárea,<br />
ni con sembradora <strong>de</strong> precisión).<br />
El problema principal <strong><strong>de</strong>l</strong> cultivo fue la <strong>de</strong>hiscencia <strong>de</strong> la semilla, ya que al meter la máquina<br />
trilladora se tira mucha, hasta más <strong>de</strong> una tercera parte <strong>de</strong> lo producido, según estimación <strong>de</strong><br />
los agricultores.<br />
12
<strong>Potenciales</strong> y <strong>Viabilidad</strong> <strong><strong>de</strong>l</strong> <strong>Uso</strong> <strong>de</strong> <strong>Bioetanol</strong> y <strong>Biodies<strong>el</strong></strong> <strong>para</strong> <strong>el</strong> Transporte en México (SENER-BID-GTZ)<br />
Task B: Agricultural aspects and sources for biodies<strong>el</strong> production<br />
El rendimiento recuperado fue <strong>de</strong> 1,600 kilos por hectárea y <strong>el</strong> precio <strong><strong>de</strong>l</strong> producto <strong>de</strong> $<br />
3,200.00 por ton<strong>el</strong>ada LAB <strong>el</strong> rancho y a gran<strong>el</strong>.<br />
Lo más importante <strong>de</strong> las experiencias recogidas <strong>para</strong> este trabajo es que la Colza necesita<br />
poco agua <strong>para</strong> lograrse; por ejemplo, en la región <strong>de</strong> El Bajío, las varieda<strong>de</strong>s precoces en<br />
otoño-invierno se cultivan con dos riegos, uno <strong>de</strong> presiembra y uno <strong>de</strong> auxilio en su<strong>el</strong>os<br />
arcillosos (vertisoles, típicos <strong>de</strong> la región) en <strong>el</strong> lapso diciembre abril y <strong>de</strong>s<strong>de</strong> luego en nuestro<br />
país, la adaptación <strong>de</strong> cultivos con poca <strong>de</strong>manda <strong>de</strong> agua, son siempre <strong>de</strong> gran interés.<br />
El trigo en la región, en las mismas condiciones <strong>de</strong> ciclo, su<strong>el</strong>o y lugar <strong>de</strong>manda <strong>de</strong> cinco<br />
riegos, más pesados y rin<strong>de</strong> 5 ton<strong>el</strong>adas <strong>de</strong> grano por hectárea, pero su costo <strong>de</strong> producción es<br />
mucho mayor.<br />
5.2 Análisis <strong><strong>de</strong>l</strong> cultivo en <strong>el</strong> Valle <strong>de</strong> Yaqui, Sonora<br />
También se analizó <strong>para</strong> este trabajo, la experiencia <strong><strong>de</strong>l</strong> Valle <strong><strong>de</strong>l</strong> Yaqui, Sonora, en <strong>el</strong> ciclo<br />
otoño-invierno 2005-06, obviamente con riego.<br />
Este trabajo se hizo en virtud <strong>de</strong> que no se presentó tan agudo <strong>el</strong> problema <strong>de</strong> la <strong>de</strong>hiscencia.<br />
Los resultados fueron los siguientes:<br />
- Rendimiento 2,300 kilos por hectárea<br />
- Precio <strong><strong>de</strong>l</strong> producto al agricultor $ 2,890.00 por ton<strong>el</strong>ada<br />
Concepto $ por hectárea $ por ton<strong>el</strong>ada<br />
Ingreso por venta 6,647 2,890<br />
Subsidio PROCAMPO 963 418<br />
Subsidio Comercialización 1,390 604<br />
Costo <strong>de</strong> producción y cosecha 6,529 2,839<br />
Margen 2,471 1,073<br />
- R<strong>el</strong>ación Beneficio-costo 1.38<br />
- Rendimiento por peso invertido 1.61<br />
5.3 Composición <strong>de</strong> la Semilla <strong>de</strong> Colza.<br />
La semilla <strong>de</strong> Colza contiene entre 380 y 400 kilos <strong>de</strong> aceite y entre 180 y 200 kilos <strong>de</strong><br />
proteína por ton<strong>el</strong>ada y al procesarla por <strong>el</strong> método <strong>de</strong> Presión, no <strong>de</strong> Solventes, se obtienen<br />
369 kilos <strong>de</strong> aceite crudo y aproximadamente 500 kilos <strong>de</strong> Torta o Pasta con 200 kilos <strong>de</strong><br />
proteína.<br />
13
<strong>Potenciales</strong> y <strong>Viabilidad</strong> <strong><strong>de</strong>l</strong> <strong>Uso</strong> <strong>de</strong> <strong>Bioetanol</strong> y <strong>Biodies<strong>el</strong></strong> <strong>para</strong> <strong>el</strong> Transporte en México (SENER-BID-GTZ)<br />
Task B: Agricultural aspects and sources for biodies<strong>el</strong> production<br />
Los 369 kilos <strong>de</strong> aceite al esterificarse con <strong>Bioetanol</strong>, producirán 387 kilos <strong>de</strong> <strong>Biodies<strong>el</strong></strong>, es<br />
<strong>de</strong>cir aproximadamente 460 litros. Así, los productos principales <strong>de</strong> la transformación <strong>de</strong> una<br />
ton<strong>el</strong>ada <strong>de</strong> semilla, serían:<br />
460 litros <strong>de</strong> <strong>Biodies<strong>el</strong></strong><br />
500 kilos <strong>de</strong> torta o pasta con 40% <strong>de</strong> proteína.<br />
5.4 El Costo primo <strong>de</strong> la semilla <strong>de</strong> Colza en la producción <strong>de</strong> un litro <strong>de</strong> <strong>Biodies<strong>el</strong></strong><br />
Costo <strong>de</strong> la semilla 1,000 kilos $ 2,839<br />
Valor <strong>de</strong> la pasta (200 kilos x $2.50) ( 500)<br />
Costo <strong>de</strong> la materia prima a <strong>Biodies<strong>el</strong></strong> 2,339<br />
Costo primo por litro <strong>de</strong> <strong>Biodies<strong>el</strong></strong> (2,339 / 460) $ 5.08<br />
6. Cártamo (Carthamus tinctorius L)<br />
En <strong>el</strong> año <strong>de</strong> 2004, se cosecharon en México 212,000 hectáreas, <strong>de</strong> las cuales 122,686 fueron<br />
<strong>de</strong> riego, <strong>de</strong> alcance r<strong>el</strong>evante en Sonora (105,000 has) con un rendimiento <strong>de</strong> 1,400 kilos por<br />
ha.<br />
En la tecnología <strong>de</strong> temporal, Tamaulipas cosechó 56,000 has con un rendimiento <strong>de</strong> 420 kilos<br />
por ha. El precio medio rural fue <strong>de</strong> $ 2,354 por ton<strong>el</strong>ada.<br />
6.1 Análisis económico <strong><strong>de</strong>l</strong> Cártamo en <strong>el</strong> Valle <strong><strong>de</strong>l</strong> Yaqui, Sonora<br />
En <strong>el</strong> año <strong>de</strong> 2005, <strong>el</strong> resultado económico <strong>para</strong> los productores <strong>de</strong> Sonora con tecnología <strong>de</strong><br />
riego, fue como sigue:<br />
- Rendimiento <strong><strong>de</strong>l</strong> cultivo 2.5 ton<strong>el</strong>adas por hectárea<br />
- Precio <strong>de</strong> venta <strong>de</strong> $ 3,360 por ton<strong>el</strong>ada.<br />
Concepto $ por hectárea $ por ton<strong>el</strong>ada<br />
Ingreso por venta 8,400 3,360<br />
Subsidio PROCAMPO 963 385<br />
Subsidio a la comercialización 1,200 480<br />
Total <strong>de</strong> ingresos 10,563 4,225<br />
Costo total <strong>de</strong> producción y cosecha 7,188 2,875<br />
Margen 3,375 1,350<br />
- R<strong>el</strong>ación Beneficio-costo 1.47<br />
- Rendimiento por peso invertido 1.69<br />
14
<strong>Potenciales</strong> y <strong>Viabilidad</strong> <strong><strong>de</strong>l</strong> <strong>Uso</strong> <strong>de</strong> <strong>Bioetanol</strong> y <strong>Biodies<strong>el</strong></strong> <strong>para</strong> <strong>el</strong> Transporte en México (SENER-BID-GTZ)<br />
Task B: Agricultural aspects and sources for biodies<strong>el</strong> production<br />
6.2 Composición <strong>de</strong> la semilla <strong>de</strong> Cártamo<br />
La semilla contiene por kilo, 280 gramos <strong>de</strong> aceite y 126 gramos <strong>de</strong> proteína (a<strong>de</strong>más 500<br />
gramos <strong>de</strong> carbohidratos totales, 43 gramos <strong>de</strong> cenizas y 48 gramos <strong>de</strong> agua). Así, <strong>de</strong> una<br />
ton<strong>el</strong>ada <strong>de</strong> semilla <strong>de</strong> cártamo se producen aproximadamente:<br />
272 kilos <strong>de</strong> aceite<br />
728 kilos <strong>de</strong> pasta que contienen 126 kilos <strong>de</strong> proteína, es <strong>de</strong>cir <strong>el</strong> 17.3%<br />
Los 272 kilos <strong>de</strong> aceite al esterificarse con <strong>Bioetanol</strong> producirán aproximadamente 285 kilos<br />
<strong>de</strong> <strong>Biodies<strong>el</strong></strong>, es <strong>de</strong>cir 339 litros.<br />
6.3 El costo primo <strong>de</strong> la semilla <strong>de</strong> cártamo en la producción <strong>de</strong> un litro <strong>de</strong> <strong>Biodies<strong>el</strong></strong><br />
Costo <strong>de</strong> la semilla por 1,000 kilos $ 2,875<br />
Valor <strong>de</strong> la pasta (126 kilos x $2.50) ( 315)<br />
Costo <strong>de</strong> la materia prima a <strong>Biodies<strong>el</strong></strong> 2,560<br />
Costo primo por litro <strong>de</strong> <strong>Biodies<strong>el</strong></strong> (2,560 / 339) $7.55<br />
7. Girasol (H<strong>el</strong>ianthus annuus L)<br />
En México, en <strong>el</strong> año <strong>de</strong> 2004 se cosecharon 90 hectáreas <strong>de</strong> Girasol, con un rendimiento en<br />
semilla, <strong>de</strong> 2.58 ton<strong>el</strong>adas por hectárea. De esta superficie, 70 hectáreas se cultivaron <strong>de</strong><br />
riego, principalmente en Chihuahua. El precio medio rural fue <strong>de</strong> $ 3,129.00 por ton<strong>el</strong>ada.<br />
7.1 Análisis económico sustantivo<br />
El costo <strong>de</strong> producción por hectárea <strong>de</strong> temporal, <strong>para</strong> <strong>el</strong> ciclo primavera-verano 2005 en la<br />
zona centro <strong><strong>de</strong>l</strong> estado <strong>de</strong> Tamaulipas, fue <strong>de</strong> $3,550. El rendimiento <strong>de</strong> 1,500 kilos por<br />
hectárea y <strong>el</strong> precio al agricultor <strong>de</strong> $ 3,200 por ton<strong>el</strong>ada.<br />
Concepto $ por hectárea $ por ton<strong>el</strong>ada<br />
Ingresos por venta 4,800 3,200<br />
Subsidio Procampo 963 642<br />
Total <strong>de</strong> ingresos 5,763 3,842<br />
Costo total <strong>de</strong> producción y cosecha<br />
3,550 2,367<br />
Margen 2,213 1,475<br />
- R<strong>el</strong>ación Beneficio-costo 1.62<br />
- Rendimiento por peso invertido 2.02<br />
15
<strong>Potenciales</strong> y <strong>Viabilidad</strong> <strong><strong>de</strong>l</strong> <strong>Uso</strong> <strong>de</strong> <strong>Bioetanol</strong> y <strong>Biodies<strong>el</strong></strong> <strong>para</strong> <strong>el</strong> Transporte en México (SENER-BID-GTZ)<br />
Task B: Agricultural aspects and sources for biodies<strong>el</strong> production<br />
7.2 Composición <strong>de</strong> la semilla<br />
La semilla <strong>de</strong> girasol, en base seca, en peso, se compone <strong>de</strong> 42% <strong>de</strong> aceite; 16% <strong>de</strong> proteína y<br />
40% <strong>de</strong> fibra. Así, <strong>de</strong> una ton<strong>el</strong>ada <strong>de</strong> semilla se obtienen extrayendo por Presión:<br />
387 kilos <strong>de</strong> aceite y 613 kilos <strong>de</strong> pasta, ésta con 160 kilos <strong>de</strong> proteína, es <strong>de</strong>cir, <strong>el</strong> 26%.<br />
Los 387 kilos <strong>de</strong> aceite al esterificarse con <strong>Bioetanol</strong>, producirán aproximadamente 405 kilos<br />
<strong>de</strong> <strong>Biodies<strong>el</strong></strong>, es <strong>de</strong>cir, 482 litros.<br />
7.3 El costo primo <strong>de</strong> la semilla <strong>de</strong> girasol en la producción <strong>de</strong> un litro <strong>de</strong> <strong>Biodies<strong>el</strong></strong><br />
Costo <strong>de</strong> la semilla <strong>de</strong> girasol 1,000 kilos $ 2,367<br />
Valor <strong>de</strong> la pasta (160 x $2.50) ( 400)<br />
Costo <strong>de</strong> la materia prima a <strong>Biodies<strong>el</strong></strong> 1,967<br />
Costo primo por litro <strong>de</strong> <strong>Biodies<strong>el</strong></strong> (1,967 / 482) $ 4.08<br />
8. Resumen <strong>de</strong> los Costos Primos <strong>de</strong> cultivos potenciales <strong>para</strong> la<br />
producción por litro, <strong>de</strong> <strong>Biodies<strong>el</strong></strong> en México<br />
Palma Africana o <strong>de</strong> aceite $ 1.18<br />
Jatropha o Piñoncillo 2.64<br />
Frijol Soya 2.87<br />
Colza 5.08<br />
Cártamo 7.55<br />
Girasol 4.08<br />
16
9. Bibliografía<br />
<strong>Potenciales</strong> y <strong>Viabilidad</strong> <strong><strong>de</strong>l</strong> <strong>Uso</strong> <strong>de</strong> <strong>Bioetanol</strong> y <strong>Biodies<strong>el</strong></strong> <strong>para</strong> <strong>el</strong> Transporte en México (SENER-BID-GTZ)<br />
Task B: Agricultural aspects and sources for biodies<strong>el</strong> production<br />
Austrian National-Engineering University and Ministerio <strong>de</strong> Energia <strong>de</strong> Nicaragua. “Agro-<br />
Industrial Exploitation of Physic Nut.1997.<br />
CATEDES. “Aceites vegetales; <strong>Biodies<strong>el</strong></strong>-Jatropha curcas.<br />
Comision Nacional Forestal. “La Bioenergía en México.<br />
FAO. “Oil seed processing technologies adoption survey – Southern Province of<br />
Zambia”.2002<br />
Gobierno <strong>de</strong> Finlandia, Centroamerica y AEA. “Generación <strong>de</strong> combustibles renovables<br />
proveniente <strong><strong>de</strong>l</strong> aceite producido en plantas <strong>de</strong> Jatropha curcas L”. 2005<br />
Gobierno <strong>de</strong> Yucatán;CONACYT; UAY;INIFAP. “Meniruas <strong>de</strong> ka conferencia Nacional<br />
sobre <strong>el</strong> Henequén y la zona henequenera <strong>de</strong> Yucatán. 1993.<br />
Instituto <strong>de</strong> Investigaciones Agricolas y Pecuarias. INIFAP. “Tecnología <strong>para</strong> la producción<br />
<strong>de</strong> la Palma <strong>de</strong> Aceite. Elaeis guineensis Jacq, en Mexico.” 1999.<br />
InfoAserca.”Coberturas: Soya, aceite, pasta 2006”<br />
International Energy Agency. IEA. “Biofu<strong>el</strong>s for transport an international perspective” Paris,<br />
France. 2004<br />
L<strong>el</strong>e, Satish. “India’s <strong>Biodies<strong>el</strong></strong> Scene. 2005<br />
Oliver Probst. “El <strong>Biodies<strong>el</strong></strong> como alternativa limpia y renovable <strong>para</strong> <strong>el</strong> transporte” ITESM.<br />
2001.<br />
Purdue University. “Jatropha curcas L. Handbook of energy crops” 1983<br />
SAGARPA-Gobierno <strong><strong>de</strong>l</strong> Estado <strong>de</strong> Campeche. “Manual <strong><strong>de</strong>l</strong> cultivo <strong>de</strong> la Palma <strong>de</strong> Aceite en<br />
<strong>el</strong> Estado <strong>de</strong> Campeche” 2004.<br />
Secretaria <strong>de</strong> Agricultura, Gana<strong>de</strong>ría, Pesca y Alimentación. SAGARPA.”Anuaria estadístico<br />
<strong>de</strong> la producción agrícola <strong>de</strong> los Estados Unidos Mexicanos” 2004<br />
Sesee y Muciño. “Plantae novae hispaniae”.Mexico 1893.<br />
UNIVAS. “Proyecto <strong>Biodies<strong>el</strong></strong>”.Oaxaca, Mexico. 2004.<br />
17
Task C: <strong>Biodies<strong>el</strong></strong> production and end-use in Mexico:<br />
current and future (Scenario Building)<br />
Task D: Potentials in r<strong>el</strong>ation to sustainability criteria<br />
Task E: Rationales, drivers and barriers for biodies<strong>el</strong><br />
market introduction<br />
Task F: Synthesis and recommendations<br />
Dani<strong>el</strong>a Thrän, Oliver Probst, Micha<strong>el</strong> Weber, Franziska Müller-Langer
<strong>Potenciales</strong> y <strong>Viabilidad</strong> <strong><strong>de</strong>l</strong> <strong>Uso</strong> <strong>de</strong> <strong>Bioetanol</strong> y <strong>Biodies<strong>el</strong></strong> <strong>para</strong> <strong>el</strong> Transporte en México (SENER-BID-GTZ)<br />
Task C: <strong>Biodies<strong>el</strong></strong> production and end-use in Mexico; Task D: Potentials in r<strong>el</strong>ation to sustainability criteria<br />
Task E: Rationales, drivers and barriers for biodies<strong>el</strong> market introduction; Task F: Synthesis and recommendations<br />
Contents<br />
LIST OF TABLES ................................................................................................................... III<br />
LIST OF FIGURES..................................................................................................................IV<br />
LIST OF ABBREVIATIONS .................................................................................................... 6<br />
1 INTRODUCTION ............................................................................................................ 1<br />
2 MEXICAN FRAMEWORK FOR BIODIESEL............................................................... 5<br />
2.1 Legal framework ............................................................................................................... 5<br />
2.1.1 Biofu<strong>el</strong>s national targets .................................................................................................5<br />
2.1.2 Fu<strong>el</strong> production, specifications and commercialization policies.................................... 6<br />
2.2 Current biodies<strong>el</strong> capacities and research capabilities...................................................... 7<br />
2.2.1 <strong>Biodies<strong>el</strong></strong> production at Grupo Energéticos.................................................................... 8<br />
2.2.2 <strong>Biodies<strong>el</strong></strong> activities at Tecnológico <strong>de</strong> Monterrey (ITESM)........................................... 9<br />
2.2.3 <strong>Biodies<strong>el</strong></strong> project at Universidad Vasconc<strong>el</strong>os <strong>de</strong> Oaxaca............................................ 10<br />
2.2.4 <strong>Biodies<strong>el</strong></strong> project of the State Government of Michoacán............................................ 11<br />
2.2.5 Other activities.............................................................................................................. 12<br />
3 TECHNICAL FEASIBILITY ANALYSIS .................................................................... 13<br />
3.1 Feedstock requirements................................................................................................... 14<br />
3.1.1 Characteristic properties ............................................................................................... 15<br />
3.1.2 Vegetables oils.............................................................................................................. 18<br />
3.1.3 Animal fats and fish oils............................................................................................... 19<br />
3.1.4 Recycled or waste oils .................................................................................................. 19<br />
3.2 <strong>Biodies<strong>el</strong></strong> production process .......................................................................................... 20<br />
3.2.1 Auxiliary substances..................................................................................................... 22<br />
3.2.2 Feedstock pre<strong>para</strong>tion................................................................................................... 24<br />
3.2.3 <strong>Biodies<strong>el</strong></strong> production..................................................................................................... 25<br />
3.2.4 Reference concepts ....................................................................................................... 27<br />
3.3 Product quality of biodies<strong>el</strong> ............................................................................................ 33<br />
3.3.1 International biodies<strong>el</strong> standards .................................................................................. 33<br />
3.3.2 Factors of influence on the biodies<strong>el</strong> quality................................................................ 34
<strong>Potenciales</strong> y <strong>Viabilidad</strong> <strong><strong>de</strong>l</strong> <strong>Uso</strong> <strong>de</strong> <strong>Bioetanol</strong> y <strong>Biodies<strong>el</strong></strong> <strong>para</strong> <strong>el</strong> Transporte en México (SENER-BID-GTZ)<br />
Task C: <strong>Biodies<strong>el</strong></strong> production and end-use in Mexico; Task D: Potentials in r<strong>el</strong>ation to sustainability criteria<br />
Task E: Rationales, drivers and barriers for biodies<strong>el</strong> market introduction; Task F: Synthesis and recommendations<br />
3.4 <strong>Biodies<strong>el</strong></strong> distribution and use......................................................................................... 37<br />
3.4.1 Generalities................................................................................................................... 38<br />
3.4.2 Experiences and recommendations .............................................................................. 38<br />
4 ECONOMIC FEASIBILITY ANALYSIS ..................................................................... 41<br />
4.1 Methodical approach....................................................................................................... 41<br />
4.1.1 Calculation mo<strong><strong>de</strong>l</strong>......................................................................................................... 41<br />
4.1.2 Frame conditions .......................................................................................................... 42<br />
4.2 <strong>Biodies<strong>el</strong></strong> production costs and economic efficiency...................................................... 50<br />
5 POTENTIALS IN RELATION TO SUSTAINIBILITY CRITERIA............................ 56<br />
5.1 Economic aspects of biodies<strong>el</strong> production...................................................................... 56<br />
5.1.1 Global and national mineral oil market........................................................................ 56<br />
5.1.2 Global and national vegetable oil market..................................................................... 57<br />
5.1.3 Institutional and Legal.................................................................................................. 60<br />
5.2 Environmental aspects of biodies<strong>el</strong> production.............................................................. 61<br />
5.2.1 Life cycle assessment ................................................................................................... 61<br />
5.2.2 <strong>Biodies<strong>el</strong></strong> emission........................................................................................................ 66<br />
5.2.3 Loss of biodiversity ...................................................................................................... 67<br />
5.2.4 Soil erosion and other soil <strong>de</strong>gradation ........................................................................ 68<br />
5.2.5 Water use and water contamination ............................................................................. 68<br />
5.3 Social aspects of biodies<strong>el</strong> production............................................................................ 69<br />
5.3.1 Employment aspects..................................................................................................... 69<br />
5.3.2 Food security ................................................................................................................ 69<br />
5.3.3 Land ownership ............................................................................................................ 70<br />
5.3.4 Labor conditions and rights of children........................................................................ 70<br />
6 SCENARIO BUILDING AND ANALYSIS.................................................................. 71<br />
7 RATIONALES, DRIVERS AND BARRIERS FOR BIODIESEL MARKET<br />
INDRODUCTION.......................................................................................................... 77<br />
8 CONCLUSIONS AND RECOMMENDATIONS ......................................................... 81<br />
REFERENCES......................................................................................................................... 85<br />
APPENDIX .............................................................................................................................. 90
<strong>Potenciales</strong> y <strong>Viabilidad</strong> <strong><strong>de</strong>l</strong> <strong>Uso</strong> <strong>de</strong> <strong>Bioetanol</strong> y <strong>Biodies<strong>el</strong></strong> <strong>para</strong> <strong>el</strong> Transporte en México (SENER-BID-GTZ)<br />
Task C: <strong>Biodies<strong>el</strong></strong> production and end-use in Mexico; Task D: Potentials in r<strong>el</strong>ation to sustainability criteria<br />
Task E: Rationales, drivers and barriers for biodies<strong>el</strong> market introduction; Task F: Synthesis and recommendations<br />
LIST OF TABLES<br />
Tab. 3-1 Feedstock <strong>para</strong>meters and their r<strong>el</strong>evance for biodies<strong>el</strong> production and<br />
use (IE, 2006) ............................................................................................... 17<br />
Tab. 3-2 Average crops and oil yi<strong>el</strong>d for mechanical and solvent extraction ............ 25<br />
Tab. 3-3 Production technology manufacturer ........................................................... 28<br />
Tab. 3-4: Process data of the reference concepts......................................................... 32<br />
Tab. 3-5: International quality standards for biodies<strong>el</strong> (FBDS, 2005,<br />
EnAu, 2003) ................................................................................................. 34<br />
Tab. 4-1 Total capital investment (average) reference concepts (IE, 2006)............... 44<br />
Tab. 4-2 Feedstock prices or costs respectiv<strong>el</strong>y (Lazcano, 2006; ITSEM, 2006;<br />
IE, 2006)....................................................................................................... 46<br />
Tab. 4-3 Wholesale prices auxiliary substances (Methanex, 2006; IE, 2006) ........... 47<br />
Tab. 4-4 Receipts for press cake (SNIIM, 2006; Lazcano, 2006) .............................. 48<br />
Tab. 6-1 Scenarios on potential biodies<strong>el</strong> <strong>de</strong>mand ..................................................... 71<br />
Tab. 6-2 Required, current and potential agricultural area for different oil crops...... 72<br />
Tab. 6-3 Economic and ecological effects.................................................................. 74
<strong>Potenciales</strong> y <strong>Viabilidad</strong> <strong><strong>de</strong>l</strong> <strong>Uso</strong> <strong>de</strong> <strong>Bioetanol</strong> y <strong>Biodies<strong>el</strong></strong> <strong>para</strong> <strong>el</strong> Transporte en México (SENER-BID-GTZ)<br />
Task C: <strong>Biodies<strong>el</strong></strong> production and end-use in Mexico; Task D: Potentials in r<strong>el</strong>ation to sustainability criteria<br />
Task E: Rationales, drivers and barriers for biodies<strong>el</strong> market introduction; Task F: Synthesis and recommendations<br />
LIST OF FIGURES<br />
Fig. 1-1 Structure of the project................................................................................... 1<br />
Fig. 1-2 Sustainability criteria ..................................................................................... 2<br />
Fig. 1-3 Dynamics of the biodies<strong>el</strong> market.................................................................. 4<br />
Fig. 2-1 General view of the biodies<strong>el</strong> plant in Ca<strong>de</strong>reyta (ITSEM, 2006) ................ 8<br />
Fig. 2-2 <strong>Biodies<strong>el</strong></strong> plant <strong>de</strong>vices (top: tallow storage, conversion reactor,<br />
centrifuge; buttom: biodies<strong>el</strong>/glycerin phase se<strong>para</strong>tion, methanol<br />
recovery, Grupo Energéticos’ service fleet) (ITSEM, 2006)......................... 9<br />
Fig. 2-3 General view of the biodies<strong>el</strong> pilot plant ITSEM .......................................... 9<br />
Fig. 2-4 <strong>Biodies<strong>el</strong></strong> use (top: emergency generator, VW Jetta, Dies<strong>el</strong> engine,<br />
buttom: stu<strong>de</strong>nt transport bus) (ITSEM, 2006)............................................ 10<br />
Fig. 2-5 <strong>Biodies<strong>el</strong></strong> facility (left) and B-20-bus (right) of the Universidad<br />
Vasconc<strong>el</strong>os <strong>de</strong> Oaxaca (ITSEM, 2006)...................................................... 11<br />
Fig. 2-6 Castor plants (ITSEM, 2006)....................................................................... 11<br />
Fig. 3-1 Feedstock supply and biodies<strong>el</strong> production (IE, 2006)................................ 14<br />
Fig. 3-2 Exemplary composition of a triglyceri<strong>de</strong> (UFOP, 2004)............................. 15<br />
Fig. 3-3 Fatty acid profile of different feedstocks (Tyson & McCormick, 2006;<br />
IE, 2006) ...................................................................................................... 16<br />
Fig. 3-4 Chemical reaction of biodies<strong>el</strong> production (Markolwitz, 2004).................. 20<br />
Fig. 3-5 General scheme of the biodies<strong>el</strong> production (IE, 2006) .............................. 21<br />
Fig. 3-6 Closed loop recycling management of agricultural oil mill-biodies<strong>el</strong><br />
plant.............................................................................................................. 29<br />
Fig. 3-7 Reference concept I: agricultural oil mill-biodies<strong>el</strong> plant (annex plant) ..... 29<br />
Fig. 3-8 Reference concept II: Industrial oil mill-biodies<strong>el</strong> plant (annex plant) ....... 30<br />
Fig. 3-9 Reference concept III: Industrial biodies<strong>el</strong> plant......................................... 31<br />
Fig. 3-10 Reference concept IV: Industrial multi-feedstock biodies<strong>el</strong> plant............... 32<br />
Fig. 3-11 R<strong>el</strong>ation between content of saturated fatty acids in biodies<strong>el</strong> (without<br />
additives) and its CFPP value (Hilber, 2005) .............................................. 35<br />
Fig. 3-12 Iodine values of biodies<strong>el</strong> <strong>de</strong>rived from different types of oils/fats<br />
(Hilber, 2005; EnAu, 2003) ......................................................................... 36<br />
Fig. 3-13 <strong>Biodies<strong>el</strong></strong> distribution and end-use............................................................... 37<br />
Fig. 3-14 Long-term effects of oxidation stability (left) or soap <strong>de</strong>position (right)<br />
on injection pumps (AGQM, 2006)............................................................. 40<br />
Fig. 4-1 Calculation mo<strong><strong>de</strong>l</strong> for biodies<strong>el</strong> production cost ......................................... 42
<strong>Potenciales</strong> y <strong>Viabilidad</strong> <strong><strong>de</strong>l</strong> <strong>Uso</strong> <strong>de</strong> <strong>Bioetanol</strong> y <strong>Biodies<strong>el</strong></strong> <strong>para</strong> <strong>el</strong> Transporte en México (SENER-BID-GTZ)<br />
Task C: <strong>Biodies<strong>el</strong></strong> production and end-use in Mexico; Task D: Potentials in r<strong>el</strong>ation to sustainability criteria<br />
Task E: Rationales, drivers and barriers for biodies<strong>el</strong> market introduction; Task F: Synthesis and recommendations<br />
Fig. 4-2 Price evolution of cru<strong>de</strong> and pharmaceutical gra<strong>de</strong> glycerin on the<br />
world market ................................................................................................ 49<br />
Fig. 4-3 <strong>Biodies<strong>el</strong></strong> production costs (PEMEX dies<strong>el</strong> for comparison, * exclusive<br />
taxes and duties)........................................................................................... 51<br />
Fig. 4-4 Sensitivity analysis – biodies<strong>el</strong> from jatropha in agricultural scale............. 52<br />
Fig. 4-5 Sensitivity analysis – biodies<strong>el</strong> from soy beans in industrial scale.............. 53<br />
Fig. 4-6 Sensitivity analysis – biodies<strong>el</strong> from palm in industrial scale ..................... 53<br />
Fig. 4-7 Required biodies<strong>el</strong> sales prices for economic efficient biodies<strong>el</strong><br />
production plants (IRR of 20%; PEMEX dies<strong>el</strong> including tax and<br />
duties)........................................................................................................... 55<br />
Fig. 5-1 Dev<strong>el</strong>opment of the dies<strong>el</strong> production and <strong>de</strong>mand for the years 1994<br />
to 2014 in Mexico (SENER, 2006) .............................................................. 57<br />
Fig. 5-2 Global market for oilseeds in 2005 .............................................................. 58<br />
Fig. 5-3 Worlds projected consumption on vegetable oils ........................................ 59<br />
Fig. 5-4 Mexican market for oilseeds and products - import and exports<br />
(USDA, 2006; IE, 2006) .............................................................................. 60<br />
Fig. 5-5 Structure of LCA (DIN EN ISO 14044) ...................................................... 62<br />
Fig. 5-6 Process chain of biodies<strong>el</strong> provision............................................................ 63<br />
Fig. 5-7 Primary energy <strong>de</strong>mand of biodies<strong>el</strong> production an arable land – W<strong>el</strong>l<br />
to tank (estimated figures)............................................................................ 64<br />
Fig. 5-8 Greenhouse gas emissions of biodies<strong>el</strong> production an arable land –<br />
W<strong>el</strong>l to tank (estimated figures)................................................................... 65<br />
Fig. 5-9 Greenhouse gas emissions of biodies<strong>el</strong> production an arable land –<br />
W<strong>el</strong>l to whe<strong>el</strong> (estimated figures) ................................................................ 66<br />
Fig. 5-10 European emissions limits for regulated exhaust components of dies<strong>el</strong><br />
powered passenger cars (Dies<strong>el</strong>net, 2006) ................................................... 67<br />
Fig. 6-1 Schematic illustration of the potential location for industrial and<br />
agricultural transesterfication plants ............................................................ 72<br />
Fig. 6-2 <strong>Biodies<strong>el</strong></strong> implementation strategy for Mexico............................................ 76
<strong>Potenciales</strong> y <strong>Viabilidad</strong> <strong><strong>de</strong>l</strong> <strong>Uso</strong> <strong>de</strong> <strong>Bioetanol</strong> y <strong>Biodies<strong>el</strong></strong> <strong>para</strong> <strong>el</strong> Transporte en México (SENER-BID-GTZ)<br />
Task C: <strong>Biodies<strong>el</strong></strong> production and end-use in Mexico; Task D: Potentials in r<strong>el</strong>ation to sustainability criteria<br />
Task E: Rationales, drivers and barriers for biodies<strong>el</strong> market introduction; Task F: Synthesis and recommendations<br />
LIST OF ABBREVIATIONS<br />
% vol Percent per volume<br />
°C Degrees C<strong>el</strong>sius<br />
AN<br />
National Petroleum Agency<br />
ANP 255<br />
Brazilian biodies<strong>el</strong> standard<br />
ASTM 6751<br />
U.S. biodies<strong>el</strong> standard<br />
AVU<br />
Campaña Permanente <strong>de</strong> Recolección <strong>de</strong> Aceite Usado<br />
bbl<br />
barr<strong>el</strong><br />
Bd<br />
<strong>Biodies<strong>el</strong></strong><br />
B-x<br />
Mix ration of biodies<strong>el</strong> in mineral dies<strong>el</strong><br />
CETES<br />
Certificados <strong>de</strong> la Tesorería <strong>de</strong> la Fe<strong>de</strong>ración<br />
CFE<br />
Fe<strong>de</strong>ral Commission of Electricidad<br />
CFPP<br />
Cold filter Plugging point<br />
CFR<br />
cost and freight<br />
CH 2<br />
Carbon dioxi<strong>de</strong><br />
CH 3 OH<br />
Methanol<br />
CP<br />
Cloud point<br />
d<br />
day<br />
DE<br />
Dies<strong>el</strong> equivalent<br />
EN 14214<br />
European biodies<strong>el</strong> standard<br />
EU<br />
European Union<br />
FAME<br />
Fatty acid methyl ester<br />
FFA<br />
Free fatty acids<br />
Fig.<br />
Figure<br />
h/a<br />
Hours per year<br />
H 2 SO 4<br />
Sulfuric acid<br />
H 2 SO 4<br />
Hydrogen sulfi<strong>de</strong><br />
ha<br />
hectare<br />
IE<br />
Institute for Energy and Environment gGmbH<br />
IPN<br />
Instituto Politécnico Nacional<br />
IRR<br />
Internal rate of return
<strong>Potenciales</strong> y <strong>Viabilidad</strong> <strong><strong>de</strong>l</strong> <strong>Uso</strong> <strong>de</strong> <strong>Bioetanol</strong> y <strong>Biodies<strong>el</strong></strong> <strong>para</strong> <strong>el</strong> Transporte en México (SENER-BID-GTZ)<br />
Task C: <strong>Biodies<strong>el</strong></strong> production and end-use in Mexico; Task D: Potentials in r<strong>el</strong>ation to sustainability criteria<br />
Task E: Rationales, drivers and barriers for biodies<strong>el</strong> market introduction; Task F: Synthesis and recommendations<br />
ITESM<br />
KOCH3<br />
KOH<br />
kW<br />
kWh<br />
m³/month<br />
MW<br />
MWfu<strong>el</strong><br />
MX$<br />
MX$/m²<br />
NaOCH 3<br />
NaOH<br />
NOX<br />
PEMEX<br />
PM<br />
PME<br />
PP<br />
ppm<br />
R&D<br />
RME<br />
SEMARNAT<br />
SENER<br />
SME<br />
t<br />
t/a<br />
Tab.<br />
U.S.<br />
VW<br />
Instituto Tecnologico y <strong>de</strong> Estudios Superiores <strong>de</strong><br />
Monterrey<br />
Potassium methylate<br />
Potassium hydroxi<strong>de</strong><br />
Kilowatt<br />
Kilowatt hour<br />
Cubic meter per month<br />
Megawatt<br />
Megawatts of fu<strong>el</strong><br />
Mexican peso<br />
Mexican pesos per cubic meter<br />
Sodium methylate<br />
Sodium hydroxi<strong>de</strong><br />
Nitrogen oxi<strong>de</strong>s<br />
Petroleos Mexicanos<br />
Particulate matter<br />
Palm oil methyl ester<br />
Pour point<br />
Parts per million<br />
Research and <strong>de</strong>v<strong>el</strong>opment<br />
Rape seed methyl ester<br />
Secretary of Environment and Natural Resources<br />
Secretary of Energy<br />
Soy bean methyl ester<br />
metric tons<br />
Tons per year<br />
Table<br />
United states of America<br />
Volkswagen
<strong>Potenciales</strong> y <strong>Viabilidad</strong> <strong><strong>de</strong>l</strong> <strong>Uso</strong> <strong>de</strong> <strong>Bioetanol</strong> y <strong>Biodies<strong>el</strong></strong> <strong>para</strong> <strong>el</strong> Transporte en México (SENER-BID-GTZ)<br />
Task C: <strong>Biodies<strong>el</strong></strong> production and end-use in Mexico; Task D: Potentials in r<strong>el</strong>ation to sustainability criteria<br />
Task E: Rationales, drivers and barriers for biodies<strong>el</strong> market introduction; Task F: Synthesis and recommendations<br />
1 INTRODUCTION<br />
The comprehensive objective of this study is to assess the feasibility of biodies<strong>el</strong> as<br />
transportation fu<strong>el</strong> within the Mexican economy. Recommendations in terms of market<br />
strategies for the implementation of biodies<strong>el</strong> will be <strong>de</strong>duced from the results of the inten<strong>de</strong>d<br />
tasks. A general overview of these tasks (or work packages) is given in the following scheme<br />
(Fig. 1-1).<br />
Mexico´s energy picture &<br />
dies<strong>el</strong> market<br />
Mexico´s agriculture situation &<br />
feedstocks for biodies<strong>el</strong><br />
<strong>Biodies<strong>el</strong></strong> production and end-use<br />
in Mexico: current and future<br />
(scenarios)<br />
Potentials in r<strong>el</strong>ation to<br />
sustainability criteria<br />
(scenario analysis)<br />
2005 2020<br />
Supply and <strong>de</strong>mand si<strong>de</strong>s<br />
Instit. & Legal<br />
Economic<br />
Energy<br />
Technical feasibility analysis<br />
Social<br />
Food security<br />
Environmental<br />
Economic feasibility analysis<br />
Environmental analysis<br />
Rationales, drivers and barriers for biodies<strong>el</strong><br />
market introduction<br />
Opportunities<br />
Barriers/Weakness<br />
<strong>Biodies<strong>el</strong></strong><br />
market<br />
Drivers/Strength<br />
Threats<br />
Synthesis of results and recommendations<br />
(policy, market implementation strategies, constraints to be overcome)<br />
Fig. 1-1<br />
Structure of the project<br />
An overall context for biodies<strong>el</strong> use in Mexico is given within Task A and Task B that involve<br />
issues of Mexico’s energy mix with an emphasis on (bio)dies<strong>el</strong> as w<strong>el</strong>l as of the national<br />
agricultural situation r<strong>el</strong>ated to feedstock sources for biodies<strong>el</strong> production (IMP, 2006;<br />
1
<strong>Potenciales</strong> y <strong>Viabilidad</strong> <strong><strong>de</strong>l</strong> <strong>Uso</strong> <strong>de</strong> <strong>Bioetanol</strong> y <strong>Biodies<strong>el</strong></strong> <strong>para</strong> <strong>el</strong> Transporte en México (SENER-BID-GTZ)<br />
Task C: <strong>Biodies<strong>el</strong></strong> production and end-use in Mexico; Task D: Potentials in r<strong>el</strong>ation to sustainability criteria<br />
Task E: Rationales, drivers and barriers for biodies<strong>el</strong> market introduction; Task F: Synthesis and recommendations<br />
Lazcano, 2006). These results and <strong>el</strong>aborated data are the bas<strong>el</strong>ine for the Task C to Task F,<br />
whose objectives are <strong>de</strong>scribed in more <strong>de</strong>tail b<strong>el</strong>ow.<br />
The aim of Task C is the <strong>el</strong>aboration of scenarios with regard to the potential <strong>de</strong>mand of<br />
biodies<strong>el</strong> for end-use. The <strong>de</strong>v<strong>el</strong>opment of the different scenarios will be carried out for<br />
different production plant scales, feedstocks and the use of different biodies<strong>el</strong> blends. The<br />
required capacities of biodies<strong>el</strong> plants, the corresponding distribution infrastructure are<br />
foreseen as results.<br />
• Mexican framework for biodies<strong>el</strong>, i.e. legal framework and supply si<strong>de</strong> analyses -<br />
available capacity of biodies<strong>el</strong> plants and research capabilities in Mexico (chapter 0).<br />
• Technical feasibility analysis, i.e. <strong>de</strong>tailed <strong>de</strong>scription of overall concepts and their<br />
process specific system <strong>el</strong>ements for the production of biodies<strong>el</strong> based on different<br />
feedstocks and plant capacities (e.g. small and large scale) (chapter 3).<br />
• Economical feasibility analysis, i.e. based on the reference concepts <strong>de</strong>fined in the<br />
technical feasibility analysis the overall costs for biodies<strong>el</strong> production (i.e. all<br />
expenditures and revenues) will be analyzed un<strong>de</strong>r Mexican frame conditions<br />
(chapter 4)<br />
For the holistic analysis of the <strong>de</strong>v<strong>el</strong>oped scenarios of Task C the whole supply chain is<br />
investigated in Task D (chapter 5) with respect to sustainability criteria (Fig. 1-2) in or<strong>de</strong>r to<br />
make qualitative estimation regarding their inter<strong>de</strong>pen<strong>de</strong>nce, potential impacts and<br />
opportunities of mitigation.<br />
Fig. 1-2<br />
Sustainability criteria<br />
In addition to the technical and economic feasibility analysis (Task C), the environmental<br />
analysis will be further focused on air, water and soil quality r<strong>el</strong>ated to the use of biodies<strong>el</strong>.<br />
These aspects are investigated qualitativ<strong>el</strong>y, based on existing studies of air quality (e.g. with<br />
2
<strong>Potenciales</strong> y <strong>Viabilidad</strong> <strong><strong>de</strong>l</strong> <strong>Uso</strong> <strong>de</strong> <strong>Bioetanol</strong> y <strong>Biodies<strong>el</strong></strong> <strong>para</strong> <strong>el</strong> Transporte en México (SENER-BID-GTZ)<br />
Task C: <strong>Biodies<strong>el</strong></strong> production and end-use in Mexico; Task D: Potentials in r<strong>el</strong>ation to sustainability criteria<br />
Task E: Rationales, drivers and barriers for biodies<strong>el</strong> market introduction; Task F: Synthesis and recommendations<br />
regard to exhaust emission lev<strong>el</strong>s). Possible conflicts between the estimated effects of a wi<strong>de</strong>r<br />
use of biodies<strong>el</strong> and current Mexican legislation and regulations will be i<strong>de</strong>ntified.<br />
The environmental effects of biodies<strong>el</strong> are not limited to its end-use or the production process.<br />
Substantial environmental effects may also occur within other stages of the supply chain (i.e.<br />
pre-chains). To evaluate such effects, a “life cycle assessment” (LCA) will be conducted. The<br />
instrument of LCA comprises the consi<strong>de</strong>ration of several impact categories. In this study only<br />
greenhouse gas (GHG) emissions of biodies<strong>el</strong> production, distribution and use will be<br />
balanced for the reference concepts. The required basic assumptions for the LCA, such as<br />
energy mix (e. g. <strong>el</strong>ectricity and transport), cultivation methods (e. g. nutrients, crop rotation<br />
etc.) for oil seeds, production chains for animal fats will be taken from the results of<br />
Task A and B.<br />
Based on the results of the prior tasks, chapter 0 is focused on the <strong>de</strong>v<strong>el</strong>opment of r<strong>el</strong>iable<br />
scenarios for the implementation of biodies<strong>el</strong> as transportation fu<strong>el</strong> on the Mexican market. As<br />
core results <strong>de</strong>tailed information on supply and <strong>de</strong>mand scenarios of biodies<strong>el</strong> as w<strong>el</strong>l as on<br />
the technical and economic feasibility of biodies<strong>el</strong> production and use in Mexico are provi<strong>de</strong>d.<br />
With emphasis to e.g. economic, energy, environmental, social, legal aspects (Task E) and<br />
their inter<strong>de</strong>pen<strong>de</strong>ncies for the market implementation of biodies<strong>el</strong> specific barriers (that have<br />
to be overcome) and drivers (that have to be further encouraged) will be i<strong>de</strong>ntified and<br />
discussed in chapter 0. Furthermore, opportunities and threats have been analyzed. These parts<br />
of a so called SWOT analysis (i.e. strength, weakness, opportunities and threats) will also be<br />
used to sharpen the view on required instruments for the successful implementation of<br />
biodies<strong>el</strong> in the forthcoming years (Fig. 1-3).<br />
3
<strong>Potenciales</strong> y <strong>Viabilidad</strong> <strong><strong>de</strong>l</strong> <strong>Uso</strong> <strong>de</strong> <strong>Bioetanol</strong> y <strong>Biodies<strong>el</strong></strong> <strong>para</strong> <strong>el</strong> Transporte en México (SENER-BID-GTZ)<br />
Task C: <strong>Biodies<strong>el</strong></strong> production and end-use in Mexico; Task D: Potentials in r<strong>el</strong>ation to sustainability criteria<br />
Task E: Rationales, drivers and barriers for biodies<strong>el</strong> market introduction; Task F: Synthesis and recommendations<br />
Fig. 1-3<br />
Dynamics of the biodies<strong>el</strong> market<br />
4
<strong>Potenciales</strong> y <strong>Viabilidad</strong> <strong><strong>de</strong>l</strong> <strong>Uso</strong> <strong>de</strong> <strong>Bioetanol</strong> y <strong>Biodies<strong>el</strong></strong> <strong>para</strong> <strong>el</strong> Transporte en México (SENER-BID-GTZ)<br />
Task C: <strong>Biodies<strong>el</strong></strong> production and end-use in Mexico; Task D: Potentials in r<strong>el</strong>ation to sustainability criteria<br />
Task E: Rationales, drivers and barriers for biodies<strong>el</strong> market introduction; Task F: Synthesis and recommendations<br />
2 MEXICAN FRAMEWORK FOR BIODIESEL<br />
Previous to the fundamental technical and economic analysis the Mexican framework is<br />
consi<strong>de</strong>red with regard to the legal framework for biodies<strong>el</strong> production and use as w<strong>el</strong>l as the<br />
existing biodies<strong>el</strong> capacities and research activities. The legal framework is discussed in<br />
addition to the comprehensive overview ma<strong>de</strong> in Task A or Task 2 (IMP, 2006).<br />
2.1 Legal framework<br />
2.1.1 Biofu<strong>el</strong>s national targets<br />
In spite of the large interest of biofu<strong>el</strong>s promotion in the country, there is no a<strong>de</strong>quate legal<br />
framework, which <strong>el</strong>aboration has at this time the attention of Mexican politicians. The<br />
Chamber of Deputies of México approved on February 2006 a project of law called “Ley <strong>de</strong><br />
Promoción y Desarrollo <strong>de</strong> los Bioenergéticos” (i.e. law of promotion and <strong>de</strong>v<strong>el</strong>opment of<br />
bioenergetics), which will establish general <strong>de</strong>finitions and policies for bioenergetics in<br />
México. The law will <strong>de</strong>fine special policies to promote biofu<strong>el</strong>s in México. The objectives of<br />
this law will be addressed to (Senado, 2006b):<br />
• the diversification of fu<strong>el</strong>s in the country,<br />
• the support of the sustainable rural <strong>de</strong>v<strong>el</strong>opment and production chains,<br />
• the cooperation with the Kyoto Protocol,<br />
• the improvement of the air quality of the country,<br />
• the legalization renewable energy sources,<br />
• the fight against poverty and marginalization in rural areas.<br />
The law will be applicative to all biofu<strong>el</strong>s or biocombustibles obtained from biomass and non<br />
toxic residues. A presently available draft of this law (TrabsEnergética, 2006) already inclu<strong>de</strong>s<br />
basic fundamentals for bioenergy and with special regard to biodies<strong>el</strong>, e.g.<br />
• in article 2. the <strong>de</strong>finition of biofu<strong>el</strong>s or biocombustibles respectiv<strong>el</strong>y with regard to<br />
production technologies and used feedstocks; i.e. for biodies<strong>el</strong> production via<br />
transesterification of fatty acids (e.g. vegetable oil and fatty products)<br />
• in article 10. the promotion of cultivation of feedstocks for biofu<strong>el</strong> production within<br />
the agricultural sector; i.e. for biodies<strong>el</strong> oil crops<br />
• in article 13. the establishing of programs of regional, state and municipal character for<br />
the suitable handling of plantations for the production of oil crops for the generation of<br />
biodies<strong>el</strong> by the intersecretarial commission for the rural <strong>de</strong>v<strong>el</strong>opment<br />
• in article 15. the <strong>el</strong>aboration of the schedule and percentage of the application and use<br />
of biodies<strong>el</strong> in the petrodies<strong>el</strong> fu<strong>el</strong><br />
• in article 31. the R&D of agricultural cultivation, the mechanized harvesting and the<br />
transport of vegetable oil from oil crops for biodies<strong>el</strong><br />
5
<strong>Potenciales</strong> y <strong>Viabilidad</strong> <strong><strong>de</strong>l</strong> <strong>Uso</strong> <strong>de</strong> <strong>Bioetanol</strong> y <strong>Biodies<strong>el</strong></strong> <strong>para</strong> <strong>el</strong> Transporte en México (SENER-BID-GTZ)<br />
Task C: <strong>Biodies<strong>el</strong></strong> production and end-use in Mexico; Task D: Potentials in r<strong>el</strong>ation to sustainability criteria<br />
Task E: Rationales, drivers and barriers for biodies<strong>el</strong> market introduction; Task F: Synthesis and recommendations<br />
However, regarding biodies<strong>el</strong> feedstocks, the use of animal fats (i.e. tallow) and waste<br />
vegetable oils (i.e. grease) is currently not foreseen within this law and probably need to be<br />
addressed with regard to the existing biodies<strong>el</strong> capacities (cf. section 2.2).<br />
The new law is <strong>el</strong>aborated by the Intersecretarial Commission consisting of the Secretary of<br />
Energy, PEMEX and the Fe<strong>de</strong>ral Commission of Electricidad (CFE) that <strong>de</strong>v<strong>el</strong>op a national<br />
strategy for the <strong>de</strong>v<strong>el</strong>opment of “bioenergéticos” and to promote the <strong>de</strong>centralization of<br />
programs, resources and functions, in accordance with the applicable Law of Dev<strong>el</strong>opment<br />
and other legal dispositions. This agreement and coordination agency also will have to its<br />
position to propose the policies, programs and instruments for the support, promotion,<br />
productivity, regulation and control of bioenergy.<br />
As mechanisms to achieve those goals the new amendment will establish the necessary<br />
policies to strengthen (i) the investigations and technology transfer r<strong>el</strong>ated to biofu<strong>el</strong>s,<br />
(ii) bonus, taxes exemptions and subsidizes to the companies or institutes working in the fi<strong>el</strong>d<br />
of biodu<strong>el</strong>s, (iii) bonus, taxes exemptions and subsidizes for the production chains r<strong>el</strong>ated to<br />
biofu<strong>el</strong>s, (iv) the <strong>el</strong>aboration of biofu<strong>el</strong>s targets for the country in coordination with the<br />
different sectors (Cámara <strong>de</strong> Diputados, 2005). The initiative is at this time in the phase of<br />
final corrections and approval in the Deputies chamber (Senado, 2006a).<br />
2.1.2 Fu<strong>el</strong> production, specifications and commercialization policies<br />
2.1.2.1 <strong>Biodies<strong>el</strong></strong><br />
There is no especial regulation for bioenergetics or biodies<strong>el</strong> in México. Those who want to<br />
produce it for captive have to regulate their projects and/or installations to the Mexican law of<br />
environmental protection (Po<strong>de</strong>r Ejecutivo Fe<strong>de</strong>ral, 1998). With regard to the current biodies<strong>el</strong><br />
capacities in México (cf. section 2.2) in terms of specified biodies<strong>el</strong> standards there are no<br />
regulations. Thus, international standards (e.g. U.S. standard ASTM D6751, the European<br />
standard CEN EN 14214 and the Brazilian biodies<strong>el</strong> fu<strong>el</strong> standards ANP 255) can be applied<br />
to ensure good quality biodies<strong>el</strong> fu<strong>el</strong> used as blen<strong>de</strong>d fu<strong>el</strong>. However, national specifications<br />
should be established and inclu<strong>de</strong>d in the future un<strong>de</strong>r the national fu<strong>el</strong> regulations (NOM-<br />
086-ECO-1994) (section 3.3).<br />
Moreover, at present there are no special regulations for the commercialization of biodies<strong>el</strong> as<br />
B-100 or blend. According to the “Ley Reglamentaria <strong><strong>de</strong>l</strong> Artículo 27 Constitucional en <strong>el</strong><br />
Ramo <strong><strong>de</strong>l</strong> Petróleo” the state (represented by “Petroleos Mexicanos”, PEMEX) has the<br />
authority with regard to cru<strong>de</strong> oil production and handling (cf. section 2.1.2.2) which will be<br />
also r<strong>el</strong>evant for the implementation of biodies<strong>el</strong> blends. Currently, blending<br />
commercialization could only occur through the Pemex Refinacion. However, similar to<br />
bioethanol, biodies<strong>el</strong> will mainly be produced from agricultural products (i.e. oil crops and<br />
fruits) and thus not a <strong>de</strong>rivate from cru<strong>de</strong> oil. In this context the B-100 is not a restricted to<br />
PEMEX (IMP, 2006). Hence this article need to be adapted with regard to control mechanisms<br />
(e.g. for biodies<strong>el</strong> quality and its <strong>de</strong>stination) in or<strong>de</strong>r to avoid fraudulent practices or biofu<strong>el</strong><br />
market segments out of control.<br />
6
2.1.2.2 Dies<strong>el</strong><br />
<strong>Potenciales</strong> y <strong>Viabilidad</strong> <strong><strong>de</strong>l</strong> <strong>Uso</strong> <strong>de</strong> <strong>Bioetanol</strong> y <strong>Biodies<strong>el</strong></strong> <strong>para</strong> <strong>el</strong> Transporte en México (SENER-BID-GTZ)<br />
Task C: <strong>Biodies<strong>el</strong></strong> production and end-use in Mexico; Task D: Potentials in r<strong>el</strong>ation to sustainability criteria<br />
Task E: Rationales, drivers and barriers for biodies<strong>el</strong> market introduction; Task F: Synthesis and recommendations<br />
As mentioned, according to the 27 th article of the Mexican constitution, only the state has the<br />
faculty of extracting and processing the cru<strong>de</strong> oil of the country as w<strong>el</strong>l as the transport,<br />
distribution and primary s<strong>el</strong>l of the refining products. However, there is an interest of<br />
liberalisation the sector to the private investment. The state control is ma<strong>de</strong> through “Petroleos<br />
Mexicanos” (Pemex), a <strong>de</strong>centralize organism composed by four different corporative:<br />
“Pemex-Exploración y Produccion” (oil cru<strong>de</strong>), “Pemex-Refinación” (refinery), “Pemex-Gas<br />
y Petroquímica Básica” (gas and basic petrochemical) and “Pemex-Petroquímica” (secondary<br />
petrochemical). The exploration, extraction, transportation and commercialization of primary<br />
hydrocarbons are done by the first sub organism whereas the cru<strong>de</strong> oil refinement and the<br />
distribution and commercialization of processing products are ma<strong>de</strong> by “Pemex-Refinacion”<br />
(SPEDT, 2005). The transportation (e.g. via pip<strong>el</strong>ines, railway, highways and marine<br />
transport) in the country of cru<strong>de</strong> oil and cru<strong>de</strong> oil process products can – with few exceptions<br />
– only be carried out by Pemex. The sales to the final consumer of automotive fu<strong>el</strong>s, like<br />
dies<strong>el</strong> and gasoline, is ma<strong>de</strong> trough a franchise policy all over the country. Prices are fixed by<br />
the Mexican Treasury (SHCP) all over the country (Po<strong>de</strong>r Ejecutivo Fe<strong>de</strong>ral, 1994).<br />
As mentioned, the specifications of dies<strong>el</strong> are established in the Mexican regulation NOM-<br />
086-ECO-1994. This is the official norm for production, importation and distribution of liquid<br />
and gaseous fossil fu<strong>el</strong>s. Un<strong>de</strong>r that standard three different kinds of dies<strong>el</strong> are <strong>de</strong>scribed,<br />
called (i) “Sin”, (ii) “Desulfurado” and (iii) “Industrial”. The differences between the first two<br />
are mainly in the sulphur concentration (i.e. max. 0.05 mass-% for Sin and max. 0.50 mass-%<br />
for “Desulfurado”) the inflammation temperature and the carbon. The Industrial has for norm<br />
the same sulphur permissive concentration as the “Desulfurado”, but a higher inflammation<br />
temperature and is only used in open burners for stationary industrial purposes. An important<br />
aspect in Mexican fu<strong>el</strong>s specifications is the ten<strong>de</strong>ncy to reduce the sulphur lev<strong>el</strong> in the next<br />
years due to technical, healthy and economical reasons. Secretary of Energy (SENER), Pemex<br />
and the Secretary of Environment and Natural Resources (SEMARNAT) have <strong>de</strong>fined targets<br />
on the NOM-086 regarding sulphur reductions in dies<strong>el</strong> to 15 ppm until 2008<br />
(SMARN, 2004).<br />
2.2 Current biodies<strong>el</strong> capacities and research capabilities<br />
At present the known installed biodies<strong>el</strong> capacities are limited to few small-scale plants with a<br />
total amount of approx. 3,300 t/a. Moreover, there are some research activities. Information on<br />
the different projects is given as follows.<br />
7
<strong>Potenciales</strong> y <strong>Viabilidad</strong> <strong><strong>de</strong>l</strong> <strong>Uso</strong> <strong>de</strong> <strong>Bioetanol</strong> y <strong>Biodies<strong>el</strong></strong> <strong>para</strong> <strong>el</strong> Transporte en México (SENER-BID-GTZ)<br />
Task C: <strong>Biodies<strong>el</strong></strong> production and end-use in Mexico; Task D: Potentials in r<strong>el</strong>ation to sustainability criteria<br />
Task E: Rationales, drivers and barriers for biodies<strong>el</strong> market introduction; Task F: Synthesis and recommendations<br />
2.2.1 <strong>Biodies<strong>el</strong></strong> production at Grupo Energéticos<br />
Fig. 2-1 General view of the biodies<strong>el</strong> plant in Ca<strong>de</strong>reyta (ITSEM, 2006)<br />
Based on a feasibility studies conducted at ITESM, Grupo Energéticos built México’s first<br />
commercial biodies<strong>el</strong> plant in Ca<strong>de</strong>reyta Nuevo Leon (Monterrey) (Fig. 2-1). The capital<br />
investment of the small-scale <strong>de</strong>monstration plant was about 16 million MX$. The plant was<br />
inaugurated in July 2005 and uses beef tallow with an average content of free fatty acids<br />
(FFA) < 3 % as feedstock. The plant is run by two graduates from ITESM’s biodies<strong>el</strong> program<br />
with a current production lev<strong>el</strong> of 300 m³/month (approx. 3,200 t/a). The facility potential<br />
rounds about 600 m³/month. Currently the plant counts of 60 m³ storage capacity for biodies<strong>el</strong><br />
and is transported in pipes of 20 m³. Grupo Energeticos apparently <strong>de</strong>v<strong>el</strong>ops another facility in<br />
the State of Oxaca.<br />
8
<strong>Potenciales</strong> y <strong>Viabilidad</strong> <strong><strong>de</strong>l</strong> <strong>Uso</strong> <strong>de</strong> <strong>Bioetanol</strong> y <strong>Biodies<strong>el</strong></strong> <strong>para</strong> <strong>el</strong> Transporte en México (SENER-BID-GTZ)<br />
Task C: <strong>Biodies<strong>el</strong></strong> production and end-use in Mexico; Task D: Potentials in r<strong>el</strong>ation to sustainability criteria<br />
Task E: Rationales, drivers and barriers for biodies<strong>el</strong> market introduction; Task F: Synthesis and recommendations<br />
Fig. 2-2<br />
<strong>Biodies<strong>el</strong></strong> plant <strong>de</strong>vices (top: tallow storage, conversion reactor, centrifuge; buttom: biodies<strong>el</strong>/glycerin<br />
phase se<strong>para</strong>tion, methanol recovery, Grupo Energéticos’ service fleet) (ITSEM, 2006)<br />
2.2.2 <strong>Biodies<strong>el</strong></strong> activities at Tecnológico <strong>de</strong> Monterrey (ITESM)<br />
Fig. 2-3<br />
General view of the biodies<strong>el</strong> pilot plant ITSEM<br />
Tecnológico <strong>de</strong> Monterrey (ITESM) has been active in biodies<strong>el</strong> research and <strong>de</strong>monstration<br />
projects since 1999. A batch pilot plant with a capacity of 200 liters was finished in late 2003<br />
at a capital investment of approx. 200,000 MX$ (Fig. 2-3). ITESM’s pilot plant exclu<strong>de</strong>s<br />
9
<strong>Potenciales</strong> y <strong>Viabilidad</strong> <strong><strong>de</strong>l</strong> <strong>Uso</strong> <strong>de</strong> <strong>Bioetanol</strong> y <strong>Biodies<strong>el</strong></strong> <strong>para</strong> <strong>el</strong> Transporte en México (SENER-BID-GTZ)<br />
Task C: <strong>Biodies<strong>el</strong></strong> production and end-use in Mexico; Task D: Potentials in r<strong>el</strong>ation to sustainability criteria<br />
Task E: Rationales, drivers and barriers for biodies<strong>el</strong> market introduction; Task F: Synthesis and recommendations<br />
methanol and wash water recovery, whereas Grupo Energéticos’ commercial inclu<strong>de</strong>s the<br />
corresponding facilities, which explains the differences in the specific investment costs.<br />
ITESM’s plant was actually significantly more costly that the quoted value; the latter has been<br />
calculated based on operating experiences and actual quotations for fiberglass tanks and<br />
reactors (instead of recipients ma<strong>de</strong> of stainless ste<strong>el</strong>). Moreover, the presently used centrifuge<br />
has been replaced by a heating stage for removal of wash water residues. The plant has been<br />
operating routin<strong>el</strong>y since 2004 by using waste vegetable oil as feedstock and currently run at a<br />
capacity of about 8 m³/month (i.e. 84 t/a). The production currently fu<strong>el</strong>s a stu<strong>de</strong>nt transport<br />
bus (in form of biodies<strong>el</strong> blend B-20) and two (private) VW Jetta dies<strong>el</strong> cars owned by ITSEM<br />
staff. In addition – more r<strong>el</strong>evant for power production – a peak-hour generation using a<br />
220 kW Caterpillar emergency generator has been <strong>de</strong>monstrated using B-20 (Fig. 2-4).<br />
Current interests focus on the investigation of new feedstocks, process integration as w<strong>el</strong>l as<br />
up scaling of processes.<br />
Fig. 2-4 <strong>Biodies<strong>el</strong></strong> use (top: emergency generator, VW Jetta, Dies<strong>el</strong> engine, buttom: stu<strong>de</strong>nt transport bus)<br />
(ITSEM, 2006)<br />
2.2.3 <strong>Biodies<strong>el</strong></strong> project at Universidad Vasconc<strong>el</strong>os <strong>de</strong> Oaxaca<br />
Since August 2004 the University Jose Vasconc<strong>el</strong>os in Oxaca has conducted experiments to<br />
produce biodies<strong>el</strong> from waste vegetable oil. Promoted and supervised by its rector, Lic.<br />
Oswaldo García, biodies<strong>el</strong> batch plant, <strong>de</strong>signed by US of 150 liters was installed and runs on<br />
a capacity of 3.6 m³/month (approx. 38 t/a) capacity. According to their reports, they are also<br />
conducted B-20 probes in the urban bus of the University (Fig. 2-5).<br />
10
<strong>Potenciales</strong> y <strong>Viabilidad</strong> <strong><strong>de</strong>l</strong> <strong>Uso</strong> <strong>de</strong> <strong>Bioetanol</strong> y <strong>Biodies<strong>el</strong></strong> <strong>para</strong> <strong>el</strong> Transporte en México (SENER-BID-GTZ)<br />
Task C: <strong>Biodies<strong>el</strong></strong> production and end-use in Mexico; Task D: Potentials in r<strong>el</strong>ation to sustainability criteria<br />
Task E: Rationales, drivers and barriers for biodies<strong>el</strong> market introduction; Task F: Synthesis and recommendations<br />
Fig. 2-5 <strong>Biodies<strong>el</strong></strong> facility (left) and B-20-bus (right) of the Universidad Vasconc<strong>el</strong>os <strong>de</strong> Oaxaca (ITSEM, 2006)<br />
2.2.4 <strong>Biodies<strong>el</strong></strong> project of the State Government of Michoacán<br />
In cooperation with the Universidad Nacional Autónoma <strong>de</strong> México the state government of<br />
Michoacán has been promoting a biodies<strong>el</strong> project originally based on castor oil (i.e. ricinus<br />
comunis). At present, other feedstocks (e.g. Jatropha) are also being evaluated. The following<br />
two phases have been contemplated: (i) the generation of employment opportunities in rural<br />
Michoacán and (ii) the promotion of local markets for alternative fu<strong>el</strong>s and reduction of air<br />
pollution. The state government has i<strong>de</strong>ntified about 36,744 ha in Michoacán with a potential<br />
for non-irrigated castor oil production. The first step was the plantation of 2,000 ha to reach<br />
2.600 t/a harvest in 2005 year and in 2006 the objective is the in plantation of 10,000 ha with<br />
an estimated harvest of 13,000 t/a. An interinstitutional working group has been established in<br />
or<strong>de</strong>r to promote the project. Another future phase of the project consists in the installation of<br />
a biodies<strong>el</strong> plant with a production capacity of approx. 10 m³/month. Un<strong>de</strong>r their estimations,<br />
the investment cost will round 500,000 MX$, but there is no more information about how and<br />
when that phase will start.<br />
Fig. 2-6 Castor plants (ITSEM, 2006)<br />
11
<strong>Potenciales</strong> y <strong>Viabilidad</strong> <strong><strong>de</strong>l</strong> <strong>Uso</strong> <strong>de</strong> <strong>Bioetanol</strong> y <strong>Biodies<strong>el</strong></strong> <strong>para</strong> <strong>el</strong> Transporte en México (SENER-BID-GTZ)<br />
Task C: <strong>Biodies<strong>el</strong></strong> production and end-use in Mexico; Task D: Potentials in r<strong>el</strong>ation to sustainability criteria<br />
Task E: Rationales, drivers and barriers for biodies<strong>el</strong> market introduction; Task F: Synthesis and recommendations<br />
2.2.5 Other activities<br />
Another effort on biodies<strong>el</strong> fi<strong>el</strong>d is make within the biodies<strong>el</strong> campaign “Campaña Permanente<br />
<strong>de</strong> Recolección <strong>de</strong> Aceite Usado (AVU)” <strong>de</strong>aling with the collection of waste vegetable oils<br />
(also called grease) from about 230 hot<strong>el</strong>s and restaurants in the metropolitan area of México<br />
DF. Un<strong>de</strong>r their estimations the collection potential for the city and the metropolitan area from<br />
restaurants and hot<strong>el</strong>s is 100 m³/month and if a program to collect grease in homes were<br />
implanted, it could enlarge the prospective in 100 m³/month more. The production of biodies<strong>el</strong><br />
based on the collected grease laboratory has been successfully <strong>de</strong>monstrated for the Cambio<br />
Climatico S.A.<br />
Also Sabritas ® , which is one of the market players for potato chips production in Mexico,<br />
contemplate to use its grease for biodies<strong>el</strong> production and its use in the company’s vehicle<br />
fleet.<br />
Other University biodies<strong>el</strong> project is presented from a partner shaft program between the<br />
Universities of Nogales and Arizona. The second one has ma<strong>de</strong> a study of potential to<br />
<strong>el</strong>aborate biodies<strong>el</strong> from grease collected in both si<strong>de</strong>s of the bor<strong>de</strong>r.<br />
The Instituto Politécnico Nacional (IPN) in México City conducts also a research of jatropha<br />
curcas in its biotechnology centre (Departamento <strong>de</strong> Biotecnología <strong><strong>de</strong>l</strong> Centro <strong>de</strong> Desarrollo<br />
<strong>de</strong> Productos Bióticos). This <strong>de</strong>partment has encourage the characterization of the crop,<br />
located in the states of Chiapas, Guerrero, Hidalgo, Mor<strong>el</strong>os, Oaxaca, Puebla, Quintana Roo,<br />
Sonora, Sinaloa, Tamaulipas, Veracruz and Yucatán.<br />
There are some other private efforts to <strong>de</strong>tonate biodies<strong>el</strong> in México, but they are scarc<strong>el</strong>y<br />
documented and it is difficult to inclu<strong>de</strong> them in a national perspective <strong>de</strong>v<strong>el</strong>opment of the<br />
fu<strong>el</strong>.<br />
12
<strong>Potenciales</strong> y <strong>Viabilidad</strong> <strong><strong>de</strong>l</strong> <strong>Uso</strong> <strong>de</strong> <strong>Bioetanol</strong> y <strong>Biodies<strong>el</strong></strong> <strong>para</strong> <strong>el</strong> Transporte en México (SENER-BID-GTZ)<br />
Task C: <strong>Biodies<strong>el</strong></strong> production and end-use in Mexico; Task D: Potentials in r<strong>el</strong>ation to sustainability criteria<br />
Task E: Rationales, drivers and barriers for biodies<strong>el</strong> market introduction; Task F: Synthesis and recommendations<br />
3 TECHNICAL FEASIBILITY ANALYSIS<br />
Basically, dies<strong>el</strong> based on biomass (i.e. biodies<strong>el</strong>) can be produced by means of various<br />
production routes, e.g.<br />
• via the physical-chemical conversion by means transesterification which is the most<br />
established pathway for biodies<strong>el</strong> world wi<strong>de</strong>,<br />
• via the thermo-chemical conversion by means of biomass gasification and following<br />
fu<strong>el</strong> synthesis (e.g. to Fischer-Tropsch-Dies<strong>el</strong>) which is more complex and currently in<br />
R&D stage or as a mix of them<br />
• via physical-thermo-chemical conversion by means of hydrogenation of biocru<strong>de</strong> oils<br />
(e.g. palm oils) within refinery processes of petroleum cru<strong>de</strong> dies<strong>el</strong> which is world<br />
wi<strong>de</strong> more an niche option un<strong>de</strong>r certain conditions 1 focused for instance by<br />
PETROBRÁS in Brazil.<br />
However, with regard to the articles 2 of the draft of Ley <strong>de</strong> Promoción y Desarrollo <strong>de</strong> los<br />
Bioenergéticos (cf. section 2.1.1) and the term of references for this study, only biodies<strong>el</strong><br />
produced via the most established way of physical-chemical conversion will be addressed with<br />
the following analyses.<br />
The technical feasibility analysis involves a <strong>de</strong>tailed <strong>de</strong>scription of overall concepts and their<br />
process specific system <strong>el</strong>ements for the production of biodies<strong>el</strong> based on different feedstock<br />
and plant capacities (e.g. small and large scale). This inclu<strong>de</strong>s also the production of vegetable<br />
oils and the provision of other feedstocks such as animal fats (e.g. tallow) free plant gate<br />
(Fig. 3-1). Therefore, the most r<strong>el</strong>evant feedstocks for biodies<strong>el</strong> production in México will be<br />
i<strong>de</strong>ntified based on the results of Task B (Lazcano, 2006). Moreover, biodies<strong>el</strong> distribution<br />
and use will be consi<strong>de</strong>red.<br />
1 These conditions for the implementation of biocru<strong>de</strong> oils into conventional refinery processes <strong>de</strong>pends on<br />
factors such as working load of the hydrogenation (i.e. the addition of hydrogen to unsaturated organic<br />
compounds) reactors, availability of surplus hydrogen and – as crucial – competitive costs of e.g. palm oil versus<br />
cru<strong>de</strong> petroleum oil.<br />
13
<strong>Potenciales</strong> y <strong>Viabilidad</strong> <strong><strong>de</strong>l</strong> <strong>Uso</strong> <strong>de</strong> <strong>Bioetanol</strong> y <strong>Biodies<strong>el</strong></strong> <strong>para</strong> <strong>el</strong> Transporte en México (SENER-BID-GTZ)<br />
Task C: <strong>Biodies<strong>el</strong></strong> production and end-use in Mexico; Task D: Potentials in r<strong>el</strong>ation to sustainability criteria<br />
Task E: Rationales, drivers and barriers for biodies<strong>el</strong> market introduction; Task F: Synthesis and recommendations<br />
Fig. 3-1 Feedstock supply and biodies<strong>el</strong> production (IE, 2006)<br />
Within this analysis emphasis will be given to the<br />
• feedstock requirements, i.e. important properties such as content of free fatty acids<br />
(FFA), water, phosphor and sulfur (section 3.1),<br />
• analysis of the biodies<strong>el</strong> production process, i.e. i<strong>de</strong>ntification of promising technical<br />
concepts and specific process sheets including r<strong>el</strong>evant mass and energy flows, i.e. all<br />
in- and out put flows such as feedstock, utilities (e.g. for transesterification, catalytic<br />
and cleaning agents), auxiliary energy, biodies<strong>el</strong> product and by-products (e.g. press<br />
cake from vegetable oil production, glycerin and distillation residues) (section 3.2),<br />
• product quality of biodies<strong>el</strong> (e.g. with regard to r<strong>el</strong>evant fu<strong>el</strong> and emission standards,<br />
suitability for end use in passenger and truck vehicles) and by-products (e.g. in terms<br />
of their use as animal food, fertilizer or for other technical purposes) (section 3.3).<br />
3.1 Feedstock requirements<br />
The kind and quality of feedstock is the <strong>de</strong>cisive factor according the technical <strong>de</strong>sign of a<br />
transesterification plant respectiv<strong>el</strong>y on the corresponding material and energy flows, which<br />
are not only indicators of technical efficiency, but also affect the economic efficiency of<br />
biodies<strong>el</strong> production. In the following section the <strong>de</strong>tailed evaluation of the feedstocks on the<br />
basis of a specification of the significant characteristics of oils and fats are analyzed.<br />
14
<strong>Potenciales</strong> y <strong>Viabilidad</strong> <strong><strong>de</strong>l</strong> <strong>Uso</strong> <strong>de</strong> <strong>Bioetanol</strong> y <strong>Biodies<strong>el</strong></strong> <strong>para</strong> <strong>el</strong> Transporte en México (SENER-BID-GTZ)<br />
Task C: <strong>Biodies<strong>el</strong></strong> production and end-use in Mexico; Task D: Potentials in r<strong>el</strong>ation to sustainability criteria<br />
Task E: Rationales, drivers and barriers for biodies<strong>el</strong> market introduction; Task F: Synthesis and recommendations<br />
3.1.1 Characteristic properties<br />
This section reviews the categories of available feedstock for the production of biodies<strong>el</strong> and a<br />
number of key feedstock <strong>de</strong>cisions that affect technology options and operations of a biodies<strong>el</strong><br />
plant.<br />
The main feedstocks used in the production of biodies<strong>el</strong> are vegetable oils/fats, animal fats and<br />
fish oils as w<strong>el</strong>l as recycled oils. Oils and fats are composed of a specific category of organic<br />
compounds called triglyceri<strong>de</strong>s. A triglyceri<strong>de</strong> molecule is ma<strong>de</strong> up of three fatty acid units<br />
attached to a three-carbon backbone. If all carbon atoms of the free acid are connected in<br />
single bonds they are called saturated; if more then one is double boun<strong>de</strong>d they are called<br />
monosaturated respectiv<strong>el</strong>y polysaturated fatty acids (Fig. 3-2).<br />
Fig. 3-2 Exemplary composition of a triglyceri<strong>de</strong> (UFOP, 2004)<br />
The amount of the different fatty acids is mainly genetically given and is referred to as fatty<br />
acid profile (Fig. 3-3). The fatty acid profile can be used to predict both physical and<br />
performance properties of the biodies<strong>el</strong> product. For example, biodies<strong>el</strong> produced from tallow,<br />
a highly saturated fat, will tend to have a higher freezing point that can inhibit cold flow<br />
properties.<br />
15
<strong>Potenciales</strong> y <strong>Viabilidad</strong> <strong><strong>de</strong>l</strong> <strong>Uso</strong> <strong>de</strong> <strong>Bioetanol</strong> y <strong>Biodies<strong>el</strong></strong> <strong>para</strong> <strong>el</strong> Transporte en México (SENER-BID-GTZ)<br />
Task C: <strong>Biodies<strong>el</strong></strong> production and end-use in Mexico; Task D: Potentials in r<strong>el</strong>ation to sustainability criteria<br />
Task E: Rationales, drivers and barriers for biodies<strong>el</strong> market introduction; Task F: Synthesis and recommendations<br />
100<br />
Fatty acid profile of oils and fats [%]<br />
80<br />
60<br />
40<br />
20<br />
0<br />
polysaturated<br />
monosaturated<br />
saturated<br />
Rape seed<br />
Safflower<br />
Sunflower<br />
Soy bean<br />
Jatropha<br />
Y<strong>el</strong>low<br />
grease<br />
Beef Tallow<br />
Palm<br />
Coconut<br />
Fig. 3-3 Fatty acid profile of different feedstocks (Tyson & McCormick, 2006; IE, 2006)<br />
The presence of water splits the fatty acid away from the triglyceri<strong>de</strong> (i.e. by means of the so<br />
called process hydrolysis). Eventually, glycerin and free fatty acid (FFA) will be obtained, but<br />
intermediate stages, where only one or two of the fatty acids have been split away from the<br />
triglyceri<strong>de</strong>, will also be present in the fat. Hydrolysis can occur both in oilseeds and in<br />
extracted oil. The FFA content is used as a gui<strong>de</strong> to the extent of <strong>de</strong>terioration in the quality of<br />
oils and fats. Additionally, some substances such as water, phosphorus connections (i.e.<br />
phospholipids) as w<strong>el</strong>l as traces of sulfur are contained within oils and fats, which also can<br />
have effects on the technical usefulness (TFZ, 2002).<br />
For a classification of the different feedstocks on vegetable and animal basis the following<br />
<strong>para</strong>meters are essential (Tab. 3-1).<br />
16
<strong>Potenciales</strong> y <strong>Viabilidad</strong> <strong><strong>de</strong>l</strong> <strong>Uso</strong> <strong>de</strong> <strong>Bioetanol</strong> y <strong>Biodies<strong>el</strong></strong> <strong>para</strong> <strong>el</strong> Transporte en México (SENER-BID-GTZ)<br />
Task C: <strong>Biodies<strong>el</strong></strong> production and end-use in Mexico; Task D: Potentials in r<strong>el</strong>ation to sustainability criteria<br />
Task E: Rationales, drivers and barriers for biodies<strong>el</strong> market introduction; Task F: Synthesis and recommendations<br />
Tab. 3-1 Feedstock <strong>para</strong>meters and their r<strong>el</strong>evance for biodies<strong>el</strong> production and use (IE, 2006)<br />
Parameter Characterization R<strong>el</strong>evance for the biodies<strong>el</strong> production<br />
and use<br />
Free fatty acids<br />
(FFA)<br />
Total contamination<br />
Water content<br />
Cinematic viscosity<br />
Cold flow properties<br />
Iodine number<br />
Phosphorus content<br />
Oxidation stability<br />
significant measure of feedstock quality,<br />
indicator for the lev<strong>el</strong> of hydrolysis; FFA<br />
of native unrefined oils and fats can be<br />
above 20.0, refined oils/fats have FFA<br />
up to 1.0<br />
proportion of unresolved impurities<br />
(particles) in the oils/fats; mainly<br />
affected by the oil production procedure<br />
mainly affected by the moisture of the<br />
seeds and refined oils/fats; with all<br />
oils/fats the water content can rise<br />
through storage and transport<br />
physical-mechanical characteristic,<br />
<strong>de</strong>pending of specific m<strong>el</strong>ting point<br />
strongly affected by temperature;<br />
saturated fatty compounds with a<br />
significantly higher m<strong>el</strong>ting points than<br />
unsaturated fatty compounds<br />
indicator for double bindings in the<br />
molecular structure of oils/fats. the<br />
higher the iodine value, the more<br />
unsaturation acids are present in the<br />
oils/fats<br />
present in vegetable oils in the form of<br />
phospholipids; <strong>de</strong>pends on refining grad<br />
of oils/fats (influenced by oil production<br />
process)<br />
value, which <strong>de</strong>scribes the aging<br />
condition and the sh<strong>el</strong>f-life of oils/fats<br />
influence <strong>de</strong>gree of required processing<br />
(e.g. catalyst <strong>de</strong>mand) and biodies<strong>el</strong><br />
quality (primarily cold flow properties)<br />
r<strong>el</strong>evant to glycerin quality and<br />
unwanted glycerin caking within the<br />
process; High total contaminations lead<br />
to clogging the fu<strong>el</strong> filters and increase<br />
the danger of damage to the injection<br />
pump and to injection nozzles as w<strong>el</strong>l as<br />
of <strong>de</strong>posits in the combustion chamber.<br />
at high temperatures water can hydrolyze<br />
the triglyceri<strong>de</strong>s to diglyceri<strong>de</strong>s and form<br />
free fatty acids; r<strong>el</strong>evant for disturbing<br />
the transesterification by catalysts loss<br />
and unwanted soap production<br />
influenced by the temperature, fatty acid<br />
profile and oil-aging <strong>de</strong>grees, whereas<br />
the kind of the oil production procedure<br />
does not affect viscosity<br />
cloud point (CP) and the cold filter<br />
plugging point (CFPP) or pour point<br />
(PP) for fu<strong>el</strong>s not suitable to <strong>de</strong>scribe<br />
cold flow properties of oils/fats, since<br />
the transition of the liquid to the solid<br />
phase can not be <strong>de</strong>finite.<br />
high iodine number in oils/fats for less<br />
age resisting than oils/fats with high<br />
<strong>de</strong>gree of saturation; informs about the<br />
ten<strong>de</strong>ncy of <strong>de</strong>posits in the combustion<br />
chamber and at injection nozzles.<br />
<strong>de</strong>creasing oxidation stability with rising<br />
portion of phospholipids; high amounts<br />
of phospholipids leading to disturbances<br />
with technical processes (e.g. blockages<br />
of filters and injection nozzles);<br />
avoidance of phosphorus compounds in<br />
waste water<br />
oxidation and polymerization procedures<br />
during fu<strong>el</strong> storage, which can lead to<br />
formation of insoluble compounds and<br />
thus cause e.g. filter blockage<br />
17
<strong>Potenciales</strong> y <strong>Viabilidad</strong> <strong><strong>de</strong>l</strong> <strong>Uso</strong> <strong>de</strong> <strong>Bioetanol</strong> y <strong>Biodies<strong>el</strong></strong> <strong>para</strong> <strong>el</strong> Transporte en México (SENER-BID-GTZ)<br />
Task C: <strong>Biodies<strong>el</strong></strong> production and end-use in Mexico; Task D: Potentials in r<strong>el</strong>ation to sustainability criteria<br />
Task E: Rationales, drivers and barriers for biodies<strong>el</strong> market introduction; Task F: Synthesis and recommendations<br />
3.1.2 Vegetables oils<br />
Vegetable oils suitable for producing biodies<strong>el</strong> inclu<strong>de</strong> the commodity oils such as based on<br />
palm, soy beans, rape seed, sunflower and safflower. Some oils such as olive and peanut oils<br />
are principally suitable for biodies<strong>el</strong> as w<strong>el</strong>l; however, they are too expensive at the market.<br />
Other oils like coconut oil can also be used, but the physical-chemical properties make them<br />
less attractive for biodies<strong>el</strong> production. The oil crops (i.e. seeds and fruits) are characterized<br />
by different total oil contents per tone which are in the range of e.g. 17 % for soy beans to<br />
about 38 % for rape seeds.<br />
Most of the vegetable oils have the advantage of low FFA contents and typically very low<br />
concentrations of other contaminants (e.g. water). Even so, some of the cru<strong>de</strong> oils need to be<br />
partially or fully refined to reduce the FFA content and the amount of phospholipids of the raw<br />
oil. The fatty acid profiles (cf. Fig. 3-3) of most temperate climate vegetable oils allow the<br />
esters to meet cold flow requirements without the need of winterization 2 agents. The<br />
polyunsaturated content <strong>de</strong>sirable for most vegetable oils can <strong>de</strong>crease the cetane number of<br />
the biodies<strong>el</strong> and may contribute to a lower storage stability for the product.<br />
Rape seed oil (also named canola oil) is the primary feedstock used in Europe for the<br />
production of biodies<strong>el</strong>. Industrial rape seed is used in a variety of high performance<br />
lubricants, corrosion inhibitors, and other products as w<strong>el</strong>l as biodies<strong>el</strong>. Through its high<br />
content of monounsaturated and low content of saturated fatty acids rape seed oil is one of the<br />
most suitable feedstocks for biodies<strong>el</strong> production regarding burn characteristics, oxidation<br />
stability and cold flow property. A by-product accumulating during rape seed processing to oil<br />
(e.g. by mechanical or extraction steps) is a protein-rich meal, which can be a substitute for<br />
soy bean meal by the intensive livestock industry (Mitt<strong>el</strong>bach, 2004).<br />
Soy bean oil is recovered as a by-product from the production of soy bean meal, a high<br />
protein food and fod<strong>de</strong>r material. This temperate seed oil has received the greatest attention as<br />
a source for biodies<strong>el</strong> in the U.S. because o f the extensive infrastructure for the recovery and<br />
refining of soy bean oils. The major fatty acids in soy bean oil triglyceri<strong>de</strong>s are polyunsaturated<br />
(57 to 61 %) and monounsaturated (22 to 26 %) acids. The fatty acid profile of soy<br />
bean oil yi<strong>el</strong>ds an ester product that requires minimal winterization. As far as soy bean oil<br />
mostly exceeds an iodine number above 120, it is not suitable as biodies<strong>el</strong> according the<br />
European biodies<strong>el</strong> standard EN 14214 (Mitt<strong>el</strong>bach, 2004).<br />
Palma africana is the largest volume triglyceri<strong>de</strong> resource in the world. As the name<br />
indicates, palm oil is seed oil <strong>de</strong>rived from the oil palm tree. Palm kern<strong>el</strong> oil is <strong>de</strong>rived from<br />
the seed kern<strong>el</strong>, while palm oil is recovered from the seed pulp. Palm oil is the material of<br />
interest for biodies<strong>el</strong> production. Palm oil is characterized by high saturated (38 to 52 %) and<br />
high monounsaturated (32 to 40 %) acid contents. The oil is semi-solid at room temperatures.<br />
The fatty acid profile of palm oil does not allow the esters to meet cold flow requirements<br />
without winterization in temperate regions (Kinast, 2003).<br />
2 Winterization means a process for reducing the crystallization temperature of biodies<strong>el</strong>.<br />
18
<strong>Potenciales</strong> y <strong>Viabilidad</strong> <strong><strong>de</strong>l</strong> <strong>Uso</strong> <strong>de</strong> <strong>Bioetanol</strong> y <strong>Biodies<strong>el</strong></strong> <strong>para</strong> <strong>el</strong> Transporte en México (SENER-BID-GTZ)<br />
Task C: <strong>Biodies<strong>el</strong></strong> production and end-use in Mexico; Task D: Potentials in r<strong>el</strong>ation to sustainability criteria<br />
Task E: Rationales, drivers and barriers for biodies<strong>el</strong> market introduction; Task F: Synthesis and recommendations<br />
Jatropha oil can be characterized by high portion of monounsaturated and polysaturated acids<br />
and high acid values. Since jatropha is not w<strong>el</strong>l known as biodies<strong>el</strong> feedstock, data on quality<br />
are rar<strong>el</strong>y. Jatropha oil has been found to have properties that enable conversion into biodies<strong>el</strong><br />
that conforms to most international standards and its use has all the advantages of rapeseed<br />
biodies<strong>el</strong> use.<br />
Safflower oil is thought to be one of the highest quality vegetable oils. There are two types of<br />
safflower: (i) one high in monounsaturated fatty acid (oleic acid) and (ii) the other high in<br />
polyunsaturated fatty acid (linoleic acid). Currently, the predominant oil market is for the oleic<br />
acid, which is e.g. lower in saturates and higher in monounsaturates than olive oil.<br />
Sunflower oil is com<strong>para</strong>ble with the physical characteristics of soy bean oil. At present, it is<br />
only marginally used for the biodies<strong>el</strong> production; but it is in discussion as feedstock in<br />
Southern Europe.<br />
3.1.3 Animal fats and fish oils<br />
Animal fats and fish oils are by-products of the meat packing and fishery industries. Animal<br />
fats (e.g. tallow) and fish oils are recovered from animal sources by a process called ren<strong>de</strong>ring<br />
(section 0).<br />
The primary animal fats inclu<strong>de</strong> edible and inedible tallow from processing cattle, lard and<br />
choice white grease from swine processing and poultry fat from the processing of chicken,<br />
turkey or other birds. The nature of animal fats does not lend its<strong>el</strong>f to making highly consistent<br />
product, because the input stream is too variable. Therefore, the <strong>de</strong>cision to use animal fats in<br />
a biodies<strong>el</strong> facility is a commitment to careful monitoring of each new lot of feed material.<br />
Because the fatty acid profiles of the most animal fats – animal fats tend to have high amounts<br />
of saturated fatty acids – they are generally semi-solid or solid at room temperature. While<br />
rape seed oil and soy bean unsaturated fatty acids, mainly oleic acid and linoleic acid, animal<br />
fats have a major content of saturated fatty acids (e.g. palmitic and stearic acid). The increased<br />
amount of saturated fatty acids shows a trend in the main fu<strong>el</strong> properties. While the oxidation<br />
stability of biodies<strong>el</strong> <strong>de</strong>rived from animal fats increases, the cold temperature performance<br />
<strong>de</strong>creases with a rising content of saturated fatty acids. Also FFA contents tend to be higher<br />
than vegetable oils because they have been cooked (ren<strong>de</strong>red) once in their pre<strong>para</strong>tion<br />
(Boyd, 2004).<br />
Fish oils could be used for biodies<strong>el</strong> but they tend to be priced at a premium therefore they are<br />
normally not getting used for biodies<strong>el</strong> production. As w<strong>el</strong>l they tend to have high amount of<br />
unsaturated fatty acids hence fish oil biodies<strong>el</strong> may lead to stability problems.<br />
3.1.4 Recycled or waste oils<br />
Recycled or waste oils/fats are produce by-products of the restaurant and food service industry<br />
that can be used for the production of biodies<strong>el</strong>.<br />
19
<strong>Potenciales</strong> y <strong>Viabilidad</strong> <strong><strong>de</strong>l</strong> <strong>Uso</strong> <strong>de</strong> <strong>Bioetanol</strong> y <strong>Biodies<strong>el</strong></strong> <strong>para</strong> <strong>el</strong> Transporte en México (SENER-BID-GTZ)<br />
Task C: <strong>Biodies<strong>el</strong></strong> production and end-use in Mexico; Task D: Potentials in r<strong>el</strong>ation to sustainability criteria<br />
Task E: Rationales, drivers and barriers for biodies<strong>el</strong> market introduction; Task F: Synthesis and recommendations<br />
The feedstocks used to make the grease products can hardly vary, even from a single plant.<br />
The fatty acid profile of the recycled or waste oils/fats is <strong>de</strong>termined by the composition of the<br />
used oils and fats. Like animal oils/fats it is therefore absolut<strong>el</strong>y necessary to monitor exact<br />
data concerning the physical and chemical characteristics. Recycled oils with a r<strong>el</strong>ativ<strong>el</strong>y low<br />
FFA content (1 to 5%) are called y<strong>el</strong>low greases while with high FFA content (above 20 %)<br />
they called brown or trap greases. Besi<strong>de</strong>s this the recycled or waste oils/fats can have an<br />
enormously variation concerning the cold flow properties, iodine number, phosphorus as w<strong>el</strong>l<br />
as chlori<strong>de</strong> content. Also the water content and total contamination can exhibit intolerable high<br />
values. Anyway, if these <strong>para</strong>meters are getting fixed within the limits recycled or waste oils<br />
can be a low price feedstock for biodies<strong>el</strong> production (Kinast, 2003; Falk, 2001; Zhang, 2003).<br />
3.2 <strong>Biodies<strong>el</strong></strong> production process<br />
Chemically, transesterification (also called alcoholysis) means taking a triglyceri<strong>de</strong> molecule<br />
or a complex fatty acid, neutralizing the free fatty acids, removing the glycerin and creating an<br />
alcohol ester. This process has been wi<strong><strong>de</strong>l</strong>y used to reduce the high viscosity of triglyceri<strong>de</strong>s.<br />
The transesterification reaction is represented by the general equation as follows (Fig. 3-4).<br />
Fig. 3-4 Chemical reaction of biodies<strong>el</strong> production (Markolwitz, 2004)<br />
There are three basic steps in the biodies<strong>el</strong> production from oils/fats – (trans)-esterification,<br />
alcohol ester processing, and glycerin purification (Fig. 3-5).<br />
20
<strong>Potenciales</strong> y <strong>Viabilidad</strong> <strong><strong>de</strong>l</strong> <strong>Uso</strong> <strong>de</strong> <strong>Bioetanol</strong> y <strong>Biodies<strong>el</strong></strong> <strong>para</strong> <strong>el</strong> Transporte en México (SENER-BID-GTZ)<br />
Task C: <strong>Biodies<strong>el</strong></strong> production and end-use in Mexico; Task D: Potentials in r<strong>el</strong>ation to sustainability criteria<br />
Task E: Rationales, drivers and barriers for biodies<strong>el</strong> market introduction; Task F: Synthesis and recommendations<br />
FEEDSTOCK SUPPLY<br />
Rape seed<br />
~3.3 t/tBD<br />
Sunflower<br />
~3.7 t/tBD<br />
Safflower<br />
~4.0 t/tBD<br />
Soy beans<br />
~9.1 t/tBD<br />
Jatropha<br />
~4.2 t/tBD<br />
Palm<br />
~5.9 t/tBD<br />
Tallow<br />
~1.0 t/tBD<br />
Grease<br />
~1.0 t/tBD<br />
Oil pressing<br />
(mechanical and/or solvent extraction)<br />
Ren<strong>de</strong>ring<br />
e.g.<br />
PRESS CAKE<br />
(TRANS)-ESTERFICATION<br />
FFA < 5% FFA > 5%<br />
Esterification<br />
Acid catalyst,<br />
Methanol<br />
Water<br />
Base catalyst,<br />
Methanol<br />
Trans-esterification<br />
METHYLESTER<br />
GLYCERIN PHASE<br />
ALCOHOL ESTER<br />
PROCESSING<br />
Water<br />
Washing<br />
Aqueous<br />
phase,<br />
Glycerin<br />
phase, Soaps<br />
GLYCERIN<br />
PURIFICATION<br />
e.g.<br />
H 2 SO 4<br />
Glycerin refining<br />
Drying<br />
Water<br />
Glyzerin phase<br />
Distillation<br />
Methanol<br />
Demethanolzing<br />
BIODIESEL<br />
1 t<br />
e.g. FERTILIZER<br />
(K2SO4)<br />
CRUDE GLYZERIN<br />
~ 0.12 t/tBD<br />
Fig. 3-5 General scheme of the biodies<strong>el</strong> production (IE, 2006)<br />
In the first process step the oil is charged to the reactor and mixed with the alcohol (e.g.<br />
methanol) and the catalyst. The reaction of the oils or fats and alcohol to biodies<strong>el</strong> and<br />
glycerin is a balance reaction, which is stopped, if about two thirds of the basic materials<br />
reacted. In or<strong>de</strong>r to increase the yi<strong>el</strong>d during the industrial conversion, a reaction product<br />
(usually glycerin) can be taken off or a reaction partner is used with a surplus. In most cases it<br />
is worked with a surplus on alcohol in or<strong>de</strong>r to affect the equilibrium in the <strong>de</strong>sired direction.<br />
A successful transesterification reaction produces two liquid phases: (i) alcohol ester and<br />
(ii) glycerin phase. At the end of the reaction the glycerin phase, which sediments due to<br />
<strong>de</strong>nsity differences, must be se<strong>para</strong>ted. This se<strong>para</strong>tion must have to be realized fast and<br />
complet<strong>el</strong>y, in or<strong>de</strong>r to prevent backward reactions. A centrifuge is typically used in this stage<br />
to speed se<strong>para</strong>tion (Berger, 2004).<br />
21
<strong>Potenciales</strong> y <strong>Viabilidad</strong> <strong><strong>de</strong>l</strong> <strong>Uso</strong> <strong>de</strong> <strong>Bioetanol</strong> y <strong>Biodies<strong>el</strong></strong> <strong>para</strong> <strong>el</strong> Transporte en México (SENER-BID-GTZ)<br />
Task C: <strong>Biodies<strong>el</strong></strong> production and end-use in Mexico; Task D: Potentials in r<strong>el</strong>ation to sustainability criteria<br />
Task E: Rationales, drivers and barriers for biodies<strong>el</strong> market introduction; Task F: Synthesis and recommendations<br />
Once se<strong>para</strong>ted from the glycerin the alcohol ester is washed to remove any soap formed<br />
during the reaction as w<strong>el</strong>l as the residual free glycerol and alcohol. The alcohol ester is then<br />
dried to remove all water. In some cases, the esters are distilled un<strong>de</strong>r vacuum to achieve even<br />
higher purity to reduce color bodies in the fu<strong>el</strong> and remove sulfur and/or phosphorus from the<br />
fu<strong>el</strong>. The washing step can be greatly affected by the FFA lev<strong>el</strong> of the feedstock, since all the<br />
FFA form soaps in the reaction.<br />
To further refine the glycerin, it is neutralized with an acid (usually hydrochloric or<br />
phosphoric) to form salts and sent to storage as cru<strong>de</strong> glycerin. After the aqueous glycerin<br />
phase has been neutralized, the glycerin is processed further by evaporation. The glycerin is<br />
than typically 80 to 88 wt-% pure and ready to be sold as cru<strong>de</strong> glycerin. The glycerin can<br />
again be further refined by drying it in a vacuum distillation unit and then cleaned in a<br />
continuous adsorption unit to receive a technical or pharmaceutical-gra<strong>de</strong> glycerin with a<br />
glycerin content of almost 100 wt-% (S&T, 2004).<br />
The excess methanol can be removed at different stages of the reaction – before or after the<br />
phase se<strong>para</strong>tion. In both cases, the methanol is recovered and reused using conventional<br />
equipment. Care must be taken to ensure no water accumulates in the recovered methanol<br />
stream.<br />
3.2.1 Auxiliary substances<br />
3.2.1.1 Alcohol<br />
Among the alcohols that can be used in the transesterification reaction methanol and ethanol<br />
are the most commonly used alcohols. Until the alcohol is se<strong>para</strong>ted for recirculation, the<br />
processing units required are the same. One important difference is the amount of each alcohol<br />
required for effective transesterification. The methyl ester process utilizes 100 % molar excess<br />
alcohol, whilst the ethyl ester process utilizes 70 % stoichiometric excess ethanol (both 100 %<br />
pure). In terms of volume, more ethanol is required per litre of oil than methanol causing a<br />
major increase in production cost. Furthermore, methanol has several advantages; the most<br />
important are its low price and the high reactivity. Methanol is easily available in an absolute<br />
pour form, so that hydrolysis and soap formation due to water contained in the alcohol can be<br />
minimized. Ethanolysis in contrast is more energy consuming than methanolysis, has<br />
problems regarding se<strong>para</strong>tion of the esters and glycerol phase is more <strong>de</strong>pend on water<br />
interferes (Gerpen et al., 2004a; Gerpen, 2004).<br />
3.2.1.2 Catalysts<br />
A catalyst is usually used to improve the reaction rate and yi<strong>el</strong>d. Catalysts may either be base,<br />
acid or enzymatic materials. The choice of the catalyst is mainly <strong>de</strong>termined by the content of<br />
FFA. While for transesterification of oils/fats with low FFA contents mainly base catalysts are<br />
used, fats and oils with high FFA contents are converted in a two-stage process of acid<br />
22
<strong>Potenciales</strong> y <strong>Viabilidad</strong> <strong><strong>de</strong>l</strong> <strong>Uso</strong> <strong>de</strong> <strong>Bioetanol</strong> y <strong>Biodies<strong>el</strong></strong> <strong>para</strong> <strong>el</strong> Transporte en México (SENER-BID-GTZ)<br />
Task C: <strong>Biodies<strong>el</strong></strong> production and end-use in Mexico; Task D: Potentials in r<strong>el</strong>ation to sustainability criteria<br />
Task E: Rationales, drivers and barriers for biodies<strong>el</strong> market introduction; Task F: Synthesis and recommendations<br />
esterification followed by base transesterification. Both processes can be operated in a batch or<br />
continuous mo<strong>de</strong>.<br />
Most of the biodies<strong>el</strong> produced in the world uses the base catalyzed process. Base catalysts<br />
processes have the advantage of high conversion rates in a short reaction time. Depending on<br />
temperature, concentration, mixing and alcohol-to-triglyceri<strong>de</strong> ratio, the resi<strong>de</strong>nce times for<br />
base catalysts range from about 5 minutes to 1 hour. Furthermore, while using base catalysts a<br />
strongly over-stochiometric portion of alcohol with the transesterification can be waived.<br />
Therefore, the reaction vess<strong>el</strong> can be dimensioned smaller, which leads to com<strong>para</strong>tiv<strong>el</strong>y low<br />
investment cost. The disadvantage of the basic catalysts is their sensitivity to the feedstock’s<br />
FFA that react with the base catalyst to form soaps. Soaps can g<strong>el</strong> at ambient temperatures<br />
causing the biodies<strong>el</strong> to form a semi-solid mass. Therefore, most base catalyst systems use<br />
vegetable oils – refined or cru<strong>de</strong> – as a feedstock (Gerpen et al, 2004b).<br />
The base catalysts are highly hygroscopic and they form chemical water when dissolved in the<br />
alcohol reactant. They also absorb water from the air during storage. If too much water has<br />
been adsorbed the catalyst will perform poorly and the biodies<strong>el</strong> may not meet the total<br />
glycerin standard.<br />
Catalysts of importance in industry for base transesterification are first and foremost sodium<br />
hydroxi<strong>de</strong> (NaOH), potassium hydroxi<strong>de</strong> (KOH) and alkoxi<strong>de</strong>s. Sodium hydroxi<strong>de</strong> for<br />
transesterification has the strong advantage that it is inexpensive while potassium hydroxi<strong>de</strong> is<br />
generally observed to be more efficient. Furthermore, when the catalyst is removed from the<br />
glycerin at the end of the process the use of KOH lead to the by-product potash, which can be<br />
further utilized as fertilizer. Potassium hydroxi<strong>de</strong> is a larg<strong>el</strong>y available product but to obtain<br />
the same conversion rate you need more catalyst compared to sodium hydroxi<strong>de</strong> products.<br />
Alkoxi<strong>de</strong>s (e.g. sodium methoxi<strong>de</strong> or potassium methoxi<strong>de</strong>) are, in chemical terms,<br />
compounds in which the hydroxyl hydrogen of an alcohol is replaced by a metal. If alkoxi<strong>de</strong>s<br />
are used for biodies<strong>el</strong> production, a solution of sodium methoxi<strong>de</strong> in methanol (NaOCH 3 in<br />
CH 3 OH) is preferred for process and commercial reasons while a solution of potassium<br />
methoxi<strong>de</strong> in methanol (KOCH 3 in CH 3 OH) is mainly used with recycled or waste oils. These<br />
catalysts can be consi<strong>de</strong>red at the most effective ones at reasonable prices (Markolwitz, 2004).<br />
Acid catalysts are used for esterification in or<strong>de</strong>r to convert feedstocks with a high FFA<br />
contents to esters, followed by a base catalyst transesterification to convert the remaining<br />
triglyceri<strong>de</strong>s to methyl esters. Contrary to base catalysts, acid catalyzed conversion runs more<br />
slowly, un<strong>de</strong>r higher temperatures and un<strong>de</strong>r much higher over-stoichiometric portion of<br />
alcohol. The mostly used sulfuric acid (H 2 SO 4 ) has two advantages: its low price and its<br />
hygroscopicity, whereby the water, which results during the esterification, is boun<strong>de</strong>d. The<br />
corrosiveness of the sulfuric acid is unfavorable; thus acid-resistant materials have to be<br />
applied, leading to increasing investment cost.<br />
23
<strong>Potenciales</strong> y <strong>Viabilidad</strong> <strong><strong>de</strong>l</strong> <strong>Uso</strong> <strong>de</strong> <strong>Bioetanol</strong> y <strong>Biodies<strong>el</strong></strong> <strong>para</strong> <strong>el</strong> Transporte en México (SENER-BID-GTZ)<br />
Task C: <strong>Biodies<strong>el</strong></strong> production and end-use in Mexico; Task D: Potentials in r<strong>el</strong>ation to sustainability criteria<br />
Task E: Rationales, drivers and barriers for biodies<strong>el</strong> market introduction; Task F: Synthesis and recommendations<br />
3.2.2 Feedstock pre<strong>para</strong>tion<br />
3.2.2.1 Vegetable oils<br />
The two main processes for extracting oil from seed feedstock are mechanical press extraction<br />
and/or solvent extraction.<br />
In small-scale mechanical press extraction, the oil seeds are optionally first heated and then<br />
crushed in a press. Presses range from small, hand-driven mo<strong><strong>de</strong>l</strong>s to power-driven commercial<br />
presses. Freshly extracted vegetable oil may inclu<strong>de</strong> contaminants, such as fine pulp, which<br />
are removed through <strong>de</strong>canter or filter. The presence of solid matter in oils leads invariably to<br />
<strong>de</strong>terioration. After most of the oil is removed, the remaining seed meal (with a residual oil<br />
content of 20 to 33 % <strong>de</strong>pending on extraction oil efficiency and oil content in the seed) can be<br />
used as an animal feed or energetic e.g. as substrate for biogas production. Small-scale oilseed<br />
processing is of interest as a potential on-farm or community enterprise that can increase<br />
income and employment in rural areas.<br />
Solvent extraction is the preferred oil extraction alternative for large-scale operation. The<br />
solvent process extracts more of the oil contained in the oil seed feedstock but requires more<br />
costly equipment. Hexane is currently the most commonly used extraction solvent for oil seeds<br />
because it is r<strong>el</strong>ativ<strong>el</strong>y cheap and abundant. After extraction, a distillation process se<strong>para</strong>tes<br />
the oil from the solvent. The solvent con<strong>de</strong>nses and can be recycled and reused in the process.<br />
Solvent extraction produces vegetable oil with a higher <strong>de</strong>gree of purity than the mechanical<br />
press process. In contrast, to the mechanical extraction the extraction yi<strong>el</strong>ds meals with<br />
1 to 4 % residual oil.<br />
Once the oil has been extracted, it is further refined to produce oil with the <strong>de</strong>sired chemical<br />
and physical properties. The oils may then be treated to remove components like<br />
phospholipids (<strong>de</strong>gumming) and free fatty acids (acid neutralization) as w<strong>el</strong>l to reduce color<br />
and odor (bleaching). The <strong>de</strong>gree of refining employed is <strong>de</strong>termined by the ultimate use for<br />
the oil. Firstly, the cru<strong>de</strong> oil from the extraction unit is <strong>de</strong>gummed to remove phospholipids or<br />
lecithin. The phospholipids are removed since they are strong emulsifiers which can lower the<br />
yi<strong>el</strong>d through the acid neutralization and can also have partially effects on the technical<br />
usefulness of the oils/fats. The second phase of refining is the neutralization where the FFA<br />
content in the cru<strong>de</strong> oil is reduced. An alkali solution (usually sodium hydroxi<strong>de</strong>) is ad<strong>de</strong>d that<br />
reacts with the FFA to produce soaps. The soaps are insoluble in the oil and easily se<strong>para</strong>ted<br />
by water washing. Pigments and remaining traces of gums, FFA and minerals are removed by<br />
bleaching, which is done by adding specially mined clays to the oil. A <strong>de</strong>odorization step is<br />
conducted in the food industry prior to oil shipment to remove volatile compounds that may<br />
advers<strong>el</strong>y affect odor and flavor. Mostly vegetable oils are partly refined (neutralized) because<br />
full refining is economically never compensated by the slightly lower consumption of catalyst<br />
and acid (Gerpen et al., 2004a; Kaltschmitt, 2001).<br />
All of the above named vegetable oils (cf. section 3.1.2) are characterized by quite different<br />
average crop yi<strong>el</strong>ds per hectare cultivated land and total oil contents per tonne of seeds or<br />
fruits respectiv<strong>el</strong>y and thus average oil yi<strong>el</strong>ds; moreover process specific extraction<br />
efficiencies as w<strong>el</strong>l as resulting oil yi<strong>el</strong>d are given b<strong>el</strong>ow (Tab. 3-2).<br />
24
<strong>Potenciales</strong> y <strong>Viabilidad</strong> <strong><strong>de</strong>l</strong> <strong>Uso</strong> <strong>de</strong> <strong>Bioetanol</strong> y <strong>Biodies<strong>el</strong></strong> <strong>para</strong> <strong>el</strong> Transporte en México (SENER-BID-GTZ)<br />
Task C: <strong>Biodies<strong>el</strong></strong> production and end-use in Mexico; Task D: Potentials in r<strong>el</strong>ation to sustainability criteria<br />
Task E: Rationales, drivers and barriers for biodies<strong>el</strong> market introduction; Task F: Synthesis and recommendations<br />
Tab. 3-2 Average crops and oil yi<strong>el</strong>d for mechanical and solvent extraction<br />
Feedstock<br />
Palma<br />
africana<br />
Jatropha Sunflower Rape seed Safflower Soy beans<br />
Crops yi<strong>el</strong>d [t/ha] 14.8 2.0 1.7 1.53 1.12 1.63<br />
Total oil content [%] 22 35 37.5 38 35 17<br />
Oil extraction efficiency<br />
mechanical extraction [%] 80 70 74 80 67 67<br />
Solvent extraction [%] 96 96 96 98 96 96<br />
Oil yi<strong>el</strong>d<br />
mechanical extraction<br />
Solvent extraction<br />
[kg Input /l] 5.2 4.1 3.0 3.0 3.6 8.1<br />
[l/ha] 2,825 533 513 506 315 202<br />
[kg Input /l] 4.4 2.7 2.6 2.5 2.7 5.6<br />
[l/ha] 3,390 730 665 619 409 289<br />
Based on this, although rape seeds dispose of the highest oil content, in terms of oil yi<strong>el</strong>d per<br />
hectare cultivated land oil extraction of palma africana leads to the highest amount of about<br />
3,400 l/ha due to the com<strong>para</strong>bly high crops yi<strong>el</strong>d. Despite of this, oil based on soy beans is<br />
less attractive in terms of oil productivity since both crops and oil yi<strong>el</strong>d are very low.<br />
However, as mentioned soy beans oil is produced as by-product of soy bean fod<strong>de</strong>r (cf.<br />
section 3.1.2).<br />
3.2.2.2 Animal fats or fish oils and waste oils<br />
Animal fats and waste oils are recycled into useable products through a process called<br />
ren<strong>de</strong>ring. Ren<strong>de</strong>ring processes may be categorized as either edible or inedible processes.<br />
Although edible and inedible ren<strong>de</strong>ring processes are generally similar, they differ in their<br />
feedstocks, end products and the applied equipment. In “edible” ren<strong>de</strong>ring processes, carcass<br />
by-products such as fat trimmings are ground into small pieces, m<strong>el</strong>ted and disintegrated by<br />
cooking processes to r<strong>el</strong>ease moisture and “edible” tallow or fat. Plants that employ “inedible”<br />
ren<strong>de</strong>ring processes convert the protein, fat, and keratin (i.e. hoof and horn) materials found in<br />
carcasses into tallow and carcass meal (used in e.g. livestock feed, soap, production of fatty<br />
acids and fertilizer). The main ren<strong>de</strong>ring processes inclu<strong>de</strong> size reduction followed by cooking<br />
and se<strong>para</strong>tion of fat, water and protein materials using techniques such as screening, pressing,<br />
sequential centrifugation, solvent extraction and drying (Gerpen et al., 2004a).<br />
3.2.3 <strong>Biodies<strong>el</strong></strong> production<br />
As mentioned in section 3.1.1 commercial biodies<strong>el</strong> plants can be grouped in <strong>de</strong>pen<strong>de</strong>ncy on<br />
which maximum FFA lev<strong>el</strong> they can handle. The two main biodies<strong>el</strong> technology mo<strong><strong>de</strong>l</strong>s are<br />
25
<strong>Potenciales</strong> y <strong>Viabilidad</strong> <strong><strong>de</strong>l</strong> <strong>Uso</strong> <strong>de</strong> <strong>Bioetanol</strong> y <strong>Biodies<strong>el</strong></strong> <strong>para</strong> <strong>el</strong> Transporte en México (SENER-BID-GTZ)<br />
Task C: <strong>Biodies<strong>el</strong></strong> production and end-use in Mexico; Task D: Potentials in r<strong>el</strong>ation to sustainability criteria<br />
Task E: Rationales, drivers and barriers for biodies<strong>el</strong> market introduction; Task F: Synthesis and recommendations<br />
(i) base catalyzed transesterification and (ii) acid esterification followed by base<br />
transesterification. Both are explained as follows.<br />
3.2.3.1 Base catalyzed transesterification<br />
A base catalyzed transesterification process dominates current commercial production of<br />
biodies<strong>el</strong> and is used for feedstock’s containing low lev<strong>el</strong>s of FFA. This inclu<strong>de</strong>s soy bean oil,<br />
rape seed oil and treated animal and recycled oils/fats (e.g. refined or upgra<strong>de</strong>d). The reaction<br />
is often carried out in two steps to provi<strong>de</strong> a very complete reaction with the potential of using<br />
less alcohol than single step systems.<br />
The main advantages are high conversion rates un<strong>de</strong>r mild conditions, low temperature and<br />
near atmospheric pressure with minimal si<strong>de</strong> reactions and short reaction time with no<br />
intermediate steps during conversion. Base catalyzed processes are less corrosive for the<br />
industrial equipment and need a small amount of alcohol, what result in a smaller reactor sizes<br />
comparing to acid catalyzed processes (Gerpen et al., 2004a; Zappi, 2003).<br />
Base catalysts are sensitive to water as w<strong>el</strong>l as on high FFA contents. High FFA feedstock’s<br />
react with the base catalyst and form soaps. Hence, the maximum amount of FFA acceptable<br />
in a base catalyzed system is less than 5 % (preferably less than 1 %) (Kinast, 2003).<br />
3.2.3.2 Acid esterification followed by base transesterification<br />
The combined process of acid esterification followed by base transesterification is used to<br />
produce biodies<strong>el</strong> from feedstock containing high FFA, such as palm oil or animal fats (cf.<br />
Fig. 3-5). Moreover, it enables the production of long branched-chain esters, which quite<br />
difficult to handle in a base catalyst transesterification process. The FFA are removed in the<br />
first step of the process, the acid esterification, while reacting with the alcohol in form of<br />
soaps until the FFA content is reduced at least until 0.5 %. The soaps are removed and then the<br />
base transesterification process follows (Gerpen et al., 2004).<br />
When a two-step process is used, water management becomes the technological challenge.<br />
The acid esterification has two negative effects while creating water as by-product. First of all,<br />
it reduces the yi<strong>el</strong>d of fatty acids to biodies<strong>el</strong> and leaves too many fatty acids behind in the<br />
feedstock as w<strong>el</strong>l the water will also reduce yi<strong>el</strong>ds in the transesterification step. Therefore, the<br />
equipment need to be constructed that water of reaction is removed during the acid<br />
esterification step. Futhermore, the fluid that proceeds into the transesterification step has a<br />
low water content (Gerpen, 2004, Zappi, 2003).<br />
26
<strong>Potenciales</strong> y <strong>Viabilidad</strong> <strong><strong>de</strong>l</strong> <strong>Uso</strong> <strong>de</strong> <strong>Bioetanol</strong> y <strong>Biodies<strong>el</strong></strong> <strong>para</strong> <strong>el</strong> Transporte en México (SENER-BID-GTZ)<br />
Task C: <strong>Biodies<strong>el</strong></strong> production and end-use in Mexico; Task D: Potentials in r<strong>el</strong>ation to sustainability criteria<br />
Task E: Rationales, drivers and barriers for biodies<strong>el</strong> market introduction; Task F: Synthesis and recommendations<br />
3.2.3.3 Batch versus continuous processes<br />
The production of biodies<strong>el</strong> can be either performed in a batch process or in continuous<br />
operation. As simplified rule, processing biodies<strong>el</strong> in batches is more suitable for small plants<br />
as simpler operating units are nee<strong>de</strong>d (500 to 10,000 t/a). Batch processes are r<strong>el</strong>ativ<strong>el</strong>y easy<br />
to compensate for differences in feedstock characteristics and it tends to be less expensive<br />
since all of the operations can be performed at atmospheric pressure in tanks. The<br />
disadvantage of batch processing is that the physical size of the plant tends to scale directly<br />
with the capacity of the plant; i.e. to double the capacity of the plant requires tanks that are<br />
twice as large. Batch processes provi<strong>de</strong> exc<strong>el</strong>lent opportunities for quality control if variations<br />
in feedstock quality are common, such as with y<strong>el</strong>low grease and animal fats<br />
(Mitt<strong>el</strong>bach, 2004).<br />
For lager plants continuous flow processing is favored (above 30,000 t/a). It uses utilities and<br />
other resources in a continuous manner at a lower peak rate, which usually is less expensive.<br />
Continuous flow plants usually operate at high temperatures (at least 65 °C) to shorten the<br />
processing time and can be characterized by a manufacturing efficiency with steady product<br />
quality as w<strong>el</strong>l as a high <strong>de</strong>gree of automation with small flexibility of the feedstock qualities.<br />
A continuous plant leads to better heat economization, better product purity from phase<br />
se<strong>para</strong>tion by removing only the portion of the layer furthest from the interface, better<br />
recovery of excess alcohol in or<strong>de</strong>r to save on alcohol cost and regulatory issues, minimal<br />
operator interference in adjusting plant <strong>para</strong>meters, and lower capital costs per unit of<br />
biodies<strong>el</strong> produced. Centrifugal se<strong>para</strong>tors are often used to do se<strong>para</strong>tions very quickly while<br />
taking very little plant space. However, the cost of the se<strong>para</strong>tors are very high. The equipment<br />
for continuous flow processing does not usually require a lot of space, and it can be scaled up<br />
to provi<strong>de</strong> increased capacity without taking a corresponding increase in space (Berger, 2004,<br />
Zappi, 2003, Gerpen, 2004).<br />
Finally, it can be stated that both batch and continuous flow processing can provi<strong>de</strong> a high<br />
quality product and successful plants have been <strong>de</strong>v<strong>el</strong>oped using both approaches.<br />
3.2.4 Reference concepts<br />
To <strong>de</strong>monstrate to current state of the art biodies<strong>el</strong> production technologies for a market entry<br />
in Mexico four principle reference concepts are i<strong>de</strong>ntified in the following sections 0 et seqq..<br />
The reference concepts were s<strong>el</strong>ected in r<strong>el</strong>ation to the state of the art biodies<strong>el</strong> technology<br />
<strong>de</strong>scribed in section 3.2. The concept furthermore represents a cross section of the current<br />
installed biodies<strong>el</strong> plants (Tab. 3-3).<br />
27
<strong>Potenciales</strong> y <strong>Viabilidad</strong> <strong><strong>de</strong>l</strong> <strong>Uso</strong> <strong>de</strong> <strong>Bioetanol</strong> y <strong>Biodies<strong>el</strong></strong> <strong>para</strong> <strong>el</strong> Transporte en México (SENER-BID-GTZ)<br />
Task C: <strong>Biodies<strong>el</strong></strong> production and end-use in Mexico; Task D: Potentials in r<strong>el</strong>ation to sustainability criteria<br />
Task E: Rationales, drivers and barriers for biodies<strong>el</strong> market introduction; Task F: Synthesis and recommendations<br />
Tab. 3-3 Production technology manufacturer<br />
Reference<br />
concepts<br />
Process technology<br />
company<br />
max.<br />
FFAcontent<br />
Degree of<br />
innovation<br />
References:<br />
Plants<br />
estabished<br />
Plant size in<br />
1000 t / a<br />
Lev<strong>el</strong> of<br />
plant cost<br />
I<br />
AGERATEC, Carry On, SE < 1 % low n. a. 0.26 - 5 low<br />
IBG Monforts Oekotec < 1 % low 10 0.45 - 3.6 low<br />
Westfalia - D < 1 % medium 3 100 - 120 high<br />
II + III<br />
De Smet Ballestra - B/I < 1 % low 1 100 medium<br />
Lurgi Life - D < 1 % low 3 100 high<br />
AT Agrartechnik - D < 3 % low 3 53 - 75 medium<br />
IV<br />
Energea - A > 20 % very high 3 40 - (250) low<br />
BDI - A > 20 % high 6 30 - 50 high<br />
3.2.4.1 Reference concept I: agricultural oil mill-biodies<strong>el</strong> plant<br />
The agriculture is not only potential user of biodies<strong>el</strong>, it produces also the feedstock’s to their<br />
production. In or<strong>de</strong>r to increase the regional ad<strong>de</strong>d value, it can be meaningful to integrate<br />
biodies<strong>el</strong> production in an optimized closed loop recycling management cycle within the<br />
agricultural system. It enables the point of production to be nearer to the point of consumption,<br />
making the process more efficient from an energy standpoint. It is becoming increasingly<br />
apparent that small-scale, localized, low-impact energy keeps more resources and revenue<br />
within communities, reduces damage to the environment and requires less waste management.<br />
An advantage of the agricultural oil mill-biodies<strong>el</strong> plant is that the by-products of the biodies<strong>el</strong><br />
production, like press cake or cru<strong>de</strong> glycerin, can be used as feeds or for energy production<br />
(e.g. for bio-chemical conversion to biogas). Moreover, it allows operations to be initiated<br />
with r<strong>el</strong>ativ<strong>el</strong>y low start-up cost that is within the reach of many dies<strong>el</strong> fu<strong>el</strong> consumers.<br />
28
<strong>Potenciales</strong> y <strong>Viabilidad</strong> <strong><strong>de</strong>l</strong> <strong>Uso</strong> <strong>de</strong> <strong>Bioetanol</strong> y <strong>Biodies<strong>el</strong></strong> <strong>para</strong> <strong>el</strong> Transporte en México (SENER-BID-GTZ)<br />
Task C: <strong>Biodies<strong>el</strong></strong> production and end-use in Mexico; Task D: Potentials in r<strong>el</strong>ation to sustainability criteria<br />
Task E: Rationales, drivers and barriers for biodies<strong>el</strong> market introduction; Task F: Synthesis and recommendations<br />
Fig. 3-6<br />
Closed loop recycling management of agricultural oil mill-biodies<strong>el</strong> plant<br />
As typical plant size for the agricultural annex plant concept can be s<strong>el</strong>ected with a capacity of<br />
approx. 3,600 t/a to 5,000 t/a <strong>de</strong>pending on annual load (Fig. 3-7).<br />
Seeds<br />
Auxiliary material<br />
Methanol<br />
Potassium hydroxi<strong>de</strong><br />
Phosphoric acid<br />
Water<br />
Auxiliary power<br />
Electricity<br />
Conditioning of the raw<br />
material<br />
(Production of vegetable oil)<br />
<strong>Biodies<strong>el</strong></strong> production<br />
(esterfication)<br />
Washing<br />
Drying<br />
Storage of the residues<br />
(Seed cake)<br />
Storage of the by-product<br />
(raw glycerine)<br />
Residues / by-product<br />
Seed cake<br />
Raw glycerine<br />
Efluent<br />
Destillation<br />
(Methanol recovery)<br />
<strong>Biodies<strong>el</strong></strong><br />
Fig. 3-7<br />
Reference concept I: agricultural oil mill-biodies<strong>el</strong> plant (annex plant)<br />
29
<strong>Potenciales</strong> y <strong>Viabilidad</strong> <strong><strong>de</strong>l</strong> <strong>Uso</strong> <strong>de</strong> <strong>Bioetanol</strong> y <strong>Biodies<strong>el</strong></strong> <strong>para</strong> <strong>el</strong> Transporte en México (SENER-BID-GTZ)<br />
Task C: <strong>Biodies<strong>el</strong></strong> production and end-use in Mexico; Task D: Potentials in r<strong>el</strong>ation to sustainability criteria<br />
Task E: Rationales, drivers and barriers for biodies<strong>el</strong> market introduction; Task F: Synthesis and recommendations<br />
3.2.4.2 Reference concepts II + III: industrial biodies<strong>el</strong> plants<br />
As with almost any process industry, a large plant is more efficient than a small plant due to<br />
economy of scale; therefore, the trend is towards large facilities instead of small. Most of the<br />
biodies<strong>el</strong> plants in United States and Europe have been <strong>de</strong>signed to use clean, high-quality<br />
feedstock (i.e. vegetable oil) with methanol. These large-scale biodies<strong>el</strong> plants can be divi<strong>de</strong>d<br />
concerning there input material – some biodies<strong>el</strong> plants are <strong>de</strong>signed as part of larger oilseed<br />
processing operations while others are stand alone plants. Through there plant size of around<br />
100,000 t/a they mainly are driven continuously (Fig. 3-8 et seq.).<br />
Total process<br />
<strong>Biodies<strong>el</strong></strong> conditioning<br />
Conversion plant<br />
Fig. 3-8<br />
Reference concept II: Industrial oil mill-biodies<strong>el</strong> plant (annex plant)<br />
30
<strong>Potenciales</strong> y <strong>Viabilidad</strong> <strong><strong>de</strong>l</strong> <strong>Uso</strong> <strong>de</strong> <strong>Bioetanol</strong> y <strong>Biodies<strong>el</strong></strong> <strong>para</strong> <strong>el</strong> Transporte en México (SENER-BID-GTZ)<br />
Task C: <strong>Biodies<strong>el</strong></strong> production and end-use in Mexico; Task D: Potentials in r<strong>el</strong>ation to sustainability criteria<br />
Task E: Rationales, drivers and barriers for biodies<strong>el</strong> market introduction; Task F: Synthesis and recommendations<br />
Fig. 3-9<br />
Reference concept III: Industrial biodies<strong>el</strong> plant<br />
3.2.4.3 Reference concepts III: industrial multi-feedstock biodies<strong>el</strong> plant<br />
Industrial multiple-feedstock plants allow more flexibility feedstock choice as operators of<br />
that plant type can react on price fluctuations for the different feedstock’s. However, multiple<br />
sources will require strict quality control for the feedstock’s as w<strong>el</strong>l as the final product. The<br />
process are more complex (cf. section 3.2.3.2), with provision for one or more pre-treatment<br />
steps available to ensure suitable feed to the primary transesterification. However, through this<br />
it is possible to handle feedstocks with high FFA content of up to 20 %. These plants mainly<br />
use recycled oil as feedstock and have a typical plant size of around 50,000 t/a (Fig. 3-10).<br />
31
<strong>Potenciales</strong> y <strong>Viabilidad</strong> <strong><strong>de</strong>l</strong> <strong>Uso</strong> <strong>de</strong> <strong>Bioetanol</strong> y <strong>Biodies<strong>el</strong></strong> <strong>para</strong> <strong>el</strong> Transporte en México (SENER-BID-GTZ)<br />
Task C: <strong>Biodies<strong>el</strong></strong> production and end-use in Mexico; Task D: Potentials in r<strong>el</strong>ation to sustainability criteria<br />
Task E: Rationales, drivers and barriers for biodies<strong>el</strong> market introduction; Task F: Synthesis and recommendations<br />
Recycled and<br />
waste oil<br />
Auxiliary material<br />
Methanol<br />
Potassium hydroxidc<br />
Phosphoric acid<br />
Sulphuric acid<br />
Water<br />
Nitrogen<br />
Auxiliary energy<br />
Electricity<br />
Steam<br />
Total process<br />
Conversion plant<br />
<strong>Biodies<strong>el</strong></strong> conditioning<br />
(Pre-)esterfication<br />
(Batch, acid. Cat.)<br />
Esterfication<br />
(Batch, bas. Cat.)<br />
Washing<br />
Storage of the by-product<br />
(Raw glycerine and und potassium<br />
sulfate)<br />
By-product<br />
Potasium sulfate<br />
Raw glycerin<br />
Residues<br />
Residues<br />
Efluent<br />
<strong>Biodies<strong>el</strong></strong><br />
Fig. 3-10 Reference concept IV: Industrial multi-feedstock biodies<strong>el</strong> plant<br />
The mass and energy flows for the reference concepts, i.e. all in- and out put flows such as<br />
feedstock, utilities (e.g. transesterification, catalytic and cleaning agents), auxiliary energy,<br />
biodies<strong>el</strong> product and by-products (e.g. press cake from vegetable oil production, glycerin and<br />
distillation residues can be displayed as follows.<br />
Tab. 3-4: Process data of the reference concepts<br />
Reference concept I II III IV<br />
Characteristic installation<br />
Mo<strong>de</strong> of operation discontinuous continuous continuous discontinuous<br />
Feedstock [-] oil seeds/fruits oil seeds/fruits oil tallow/grease<br />
Max. FFA-content < 1 < 1 < 1 < 20<br />
Capacity [t Bd /a] 3,600 93,750 93,750 46,875<br />
Full load hours [h/a] 6,000 7,500 7,500 7,500<br />
Mass & energy flows<br />
Input [t/t Bd ] ~3.3 to 9.1 ~2.9 to 6.8 ~1 ~1<br />
Electricity [kWh <strong>el</strong> /t Bd ] ~236 ~196 ~12 ~43<br />
Steam [kWh th /t Bd ] ~300 ~470 ~211 ~639<br />
Cru<strong>de</strong> glycerin [t/t Bd ] ~116 ~129 ~129 ~113<br />
32
<strong>Potenciales</strong> y <strong>Viabilidad</strong> <strong><strong>de</strong>l</strong> <strong>Uso</strong> <strong>de</strong> <strong>Bioetanol</strong> y <strong>Biodies<strong>el</strong></strong> <strong>para</strong> <strong>el</strong> Transporte en México (SENER-BID-GTZ)<br />
Task C: <strong>Biodies<strong>el</strong></strong> production and end-use in Mexico; Task D: Potentials in r<strong>el</strong>ation to sustainability criteria<br />
Task E: Rationales, drivers and barriers for biodies<strong>el</strong> market introduction; Task F: Synthesis and recommendations<br />
3.3 Product quality of biodies<strong>el</strong><br />
In the present section the impacts of important biodies<strong>el</strong> characteristics on engine operability<br />
and emissions will be discussed. Apart from that, limits within the current biodies<strong>el</strong> standards<br />
will be listed and the factors of influence on the biodies<strong>el</strong> quality according the feedstock and<br />
the technology will be discussed.<br />
3.3.1 International biodies<strong>el</strong> standards<br />
Standards are of high importance for the producers, suppliers and users of biodies<strong>el</strong>.<br />
Authorities need approved standards for the evaluation of safety risks and environmental<br />
pollution. Standards are necessary for approvals of vehicles operated with biodies<strong>el</strong> and are<br />
therefore a prerequisite for the market introduction and commercialization of biodies<strong>el</strong>. If new<br />
fu<strong>el</strong>s appear in the market engine and injection system manufacturer have to investigate the<br />
suitability. They also need standardized products with a homogenous quality. Unlike the<br />
process of setting fu<strong>el</strong> quality standards for petrol or dies<strong>el</strong>, there is currently no uniform<br />
industry accepted quality standards for biodies<strong>el</strong> in México. There are however examples of<br />
quality standards for biodies<strong>el</strong> internationally and these will be compared and discussed.<br />
There are two major biodies<strong>el</strong> standards that are most referred to, nam<strong>el</strong>y, the European<br />
standard for biodies<strong>el</strong> so called EN 14214 and the U.S. standard specifications for biodies<strong>el</strong><br />
Fu<strong>el</strong> so called ASTM 6751. The European standard for biodies<strong>el</strong> as automotive dies<strong>el</strong> fu<strong>el</strong><br />
<strong>de</strong>fines biodies<strong>el</strong> as fatty acid methyl ester (FAME) to be used either as pure fu<strong>el</strong> for dies<strong>el</strong><br />
engines in a 100% concentration or as an exten<strong>de</strong>r for automotive fu<strong>el</strong> for dies<strong>el</strong> engines in<br />
accordance with the requirements of EN 590 (CEN dies<strong>el</strong> standard), a blending of 5 %. As far<br />
EN 14214 <strong>de</strong>fines biodies<strong>el</strong> as FAME, therefore the standard is restricting biodies<strong>el</strong> to be<br />
produced with methanol. In Europe biodies<strong>el</strong> is predominantly produced from rapeseed oil,<br />
and most information and data available <strong>de</strong>als with the practical experience gained in the use<br />
of rapeseed oil methyl ester (RME). Therefore the biodies<strong>el</strong> standard in the EU was <strong>de</strong>v<strong>el</strong>oped<br />
based on rapeseed. US standard for biodies<strong>el</strong> is <strong>de</strong>fining biodies<strong>el</strong> as mono alkyl esters of long<br />
chain fatty acids <strong>de</strong>rived from vegetable oils or animal fats. In the U.S. soybean is the main<br />
feedstock for biodies<strong>el</strong> production therefore the <strong>para</strong>meters for the biodies<strong>el</strong> standard was<br />
fixed on soybean oil (Zhang, 2003).<br />
Another international standard is the Brazilian biodies<strong>el</strong> standard ANP 255 and was r<strong>el</strong>eased<br />
in 2003 by the National Petroleum Agency (Agência Nacional do Petróleo, ANP). The<br />
Brazilian biodies<strong>el</strong> fu<strong>el</strong> standards is based on ASTM D6751 and CEN EN 14212 that ensures<br />
good quality biodies<strong>el</strong> fu<strong>el</strong> used as blen<strong>de</strong>d fu<strong>el</strong> (FBDS, 2005).<br />
The <strong>para</strong>meters in specified in these standards are nearly the same and nearly in the same<br />
limits. The main differences between the standards are the intend fi<strong>el</strong>ds of application and the<br />
applied test methods. In comparison to the European standard the lower number of <strong>para</strong>meters<br />
(14 against 22 in Europe) is remarkably, which allows more flexibility in feedstocks being<br />
used for the production. In Tab. 3-5 limits in the European, the Brazilian and the US fatty<br />
methyl acid standard are listed. Comparing the limits, it has to be attested that the European<br />
standard tends to be stricter than the US norm, either displaying more stringent limits e.g.<br />
33
<strong>Potenciales</strong> y <strong>Viabilidad</strong> <strong><strong>de</strong>l</strong> <strong>Uso</strong> <strong>de</strong> <strong>Bioetanol</strong> y <strong>Biodies<strong>el</strong></strong> <strong>para</strong> <strong>el</strong> Transporte en México (SENER-BID-GTZ)<br />
Task C: <strong>Biodies<strong>el</strong></strong> production and end-use in Mexico; Task D: Potentials in r<strong>el</strong>ation to sustainability criteria<br />
Task E: Rationales, drivers and barriers for biodies<strong>el</strong> market introduction; Task F: Synthesis and recommendations<br />
viscosity, cetane number; or providing limits on <strong>para</strong>meters which are not regulated in the<br />
ASTM norm at all e.g. ash content, oxidation stability. ANP 255 contains most of the<br />
<strong>para</strong>meters listed in ASTM D6751 together with five other <strong>para</strong>meters from CEN EN 14212.<br />
Parameters inclu<strong>de</strong>d from CEN EN 14212 are: kinetic viscosity, acid number, cloud point,<br />
copper corrosion and specific gravity. The Brazilian standard ANP 255 is also more flexible in<br />
terms variety of vegetable lipid sources (EnAu, 2005, FBDS, 2005).<br />
Tab. 3-5: International quality standards for biodies<strong>el</strong> (FBDS, 2005, EnAu, 2003)<br />
PROPERTIES<br />
UNIT<br />
Brazilian<br />
standard<br />
ANP 255<br />
U.S. standard<br />
ASTM D- 6751<br />
European standard<br />
EN 14214<br />
Flash Point (ºC) min. 100 130 101<br />
Water and sediments (%-vol.) max. 0.05 0.05 -<br />
Viscosity cin. 40ºC (mm 2 /s) 2.5 to 5.5 1.9to6.0 3.5 to 5.0<br />
Sulphated Ashes (%m/m) max 0.02 0.02 0.02<br />
Sulphur (%m/m) 0.0001 0.05 0.0001<br />
Corrosivity to copper 3h – 50ºC, max. 1 3 1<br />
Cetane number min. 45 47 51<br />
Carbon residue (%m/m) max. 0.05 0.05 0.03<br />
Acidity<br />
(mg KOH/g)<br />
max<br />
0.8 0.8 0.5<br />
Free Glycerin (%m/m) max. 0.02 0.02 0.02<br />
Total Glycerin (%m/m) max. 0.38 0.24 0.25<br />
Distillation 95% of the recovered (ºC), max. 360 360 (90%rec.) -<br />
Specific mass at 20ºC (kg/m 3 ) 850 – 900 0 860 to 900 at 15ºC<br />
Methanol or ethanol content (%m/m) max. 0.5 - 0.2<br />
Iodine value max. Annotate - 120<br />
Monoglyceri<strong>de</strong>s (%m/m) max. 1.00 - 0.8<br />
Diglyceri<strong>de</strong>s (%m/m) max. 0.25 - 0.2<br />
Triglyceri<strong>de</strong>s (%m/m) max. 0.25 - 0.2<br />
Alkaline metal content (Na + K) (mg/kg) max. 10 - 5<br />
Ca + Mg (mg/kg) ----- 5<br />
Phosphor content (mg/kg) max 10 ----- 10<br />
Oxidation stability at 110ºC (h) min. 6 To be <strong>de</strong>fined 6<br />
Contaminants (mg/kg) max. ----- 24<br />
Ester content (%m/m) min. ---- 97<br />
Methyl Esters from linoleic acid (%m/m) max. ------- ------- 12<br />
Polyunsaturate (> 4 double<br />
bindings)<br />
max. ------- -------- 1<br />
3.3.2 Factors of influence on the biodies<strong>el</strong> quality<br />
This section of the technical feasibility outlines <strong>para</strong>meters for biodies<strong>el</strong> that can potentially be<br />
specified in a biodies<strong>el</strong> quality standard. As mentioned above the quality of biodies<strong>el</strong> is<br />
<strong>de</strong>pen<strong>de</strong>d on the one hand si<strong>de</strong> on the properties of the feedstock and on the other si<strong>de</strong> on the<br />
34
<strong>Potenciales</strong> y <strong>Viabilidad</strong> <strong><strong>de</strong>l</strong> <strong>Uso</strong> <strong>de</strong> <strong>Bioetanol</strong> y <strong>Biodies<strong>el</strong></strong> <strong>para</strong> <strong>el</strong> Transporte en México (SENER-BID-GTZ)<br />
Task C: <strong>Biodies<strong>el</strong></strong> production and end-use in Mexico; Task D: Potentials in r<strong>el</strong>ation to sustainability criteria<br />
Task E: Rationales, drivers and barriers for biodies<strong>el</strong> market introduction; Task F: Synthesis and recommendations<br />
production technology. The main properties of biodies<strong>el</strong> that are <strong>de</strong>termine by the structure of<br />
its component fatty esters inclu<strong>de</strong> the cold flow properties, cetane number, oxidation stability,<br />
iodine value and viscosity.<br />
One of the main <strong>para</strong>meter according quality issues are the cold flow properties. The low<br />
temperature operability of dies<strong>el</strong> fu<strong>el</strong> is commonly characterized by three tests used to<br />
measure the cold flow properties - the cloud point (CP), cold filter plugging point (CFPP) and<br />
pour point (PP). The value to be reached <strong>de</strong>pends on the region of use, but the result is directly<br />
r<strong>el</strong>ated to the type of oil, which was used for the biodies<strong>el</strong> production. High values could limit<br />
biodies<strong>el</strong> utilization in cold weather regions. Saturated fatty compounds have significantly<br />
higher m<strong>el</strong>ting points than unsaturated fatty compounds and in a mixture they crystallize at<br />
higher temperature than the unsaturated oils/fats. Thus biodies<strong>el</strong> fu<strong>el</strong>s <strong>de</strong>rived from fats or oils<br />
with significant amounts of saturated fatty compounds like animal fats or palm oil will display<br />
higher in comparison to e.g. rapeseed oil. Several approaches to the low-temperature problems<br />
of esters have been investigated including blending with conventional dies<strong>el</strong> fu<strong>el</strong>s,<br />
winterization, additives, branched-chain esters, ad bulky substituents in the chain<br />
(Tyson & McCormick, 2006).<br />
Fig. 3-11 R<strong>el</strong>ation between content of saturated fatty acids in biodies<strong>el</strong> (without additives) and its CFPP value<br />
(Hilber, 2005)<br />
A chemical property that also is corr<strong>el</strong>ated with the fatty acid composition of the feedstock is<br />
the cetane number. The cetane number is the indicator for ignition quality. High cetane<br />
numbers contribute to easy cold starting and low idle noise. As w<strong>el</strong>l they are corr<strong>el</strong>ated with<br />
reduced nitrogen oxi<strong>de</strong>s (NO X ) exhaust emissions. In general the cetane number oils/fats<br />
<strong>de</strong>crease with increasing saturation and increase with increasing chain length, i.e.<br />
uninterrupted CH 2 moieties (EnAu, 2003).<br />
Even if the oxidative stability is influence of <strong>para</strong>meters such as presence of air, heat and<br />
light the influence compound structure of the fatty esters is even greater. More in <strong>de</strong>tail the<br />
35
<strong>Potenciales</strong> y <strong>Viabilidad</strong> <strong><strong>de</strong>l</strong> <strong>Uso</strong> <strong>de</strong> <strong>Bioetanol</strong> y <strong>Biodies<strong>el</strong></strong> <strong>para</strong> <strong>el</strong> Transporte en México (SENER-BID-GTZ)<br />
Task C: <strong>Biodies<strong>el</strong></strong> production and end-use in Mexico; Task D: Potentials in r<strong>el</strong>ation to sustainability criteria<br />
Task E: Rationales, drivers and barriers for biodies<strong>el</strong> market introduction; Task F: Synthesis and recommendations<br />
oxidative stability <strong>de</strong>pends strongly on the rate of saturation of the feedstock used. The iodine<br />
value is an indicator of the saturation of the fu<strong>el</strong>, which has been linked with formation of<br />
engine <strong>de</strong>posits and problems in storing the fu<strong>el</strong>. <strong>Biodies<strong>el</strong></strong> with high iodine numbers also tend<br />
to polymerize and form <strong>de</strong>posits on injector nozzles, piston rings grooves. Iodine values have<br />
been found to corr<strong>el</strong>ate with viscosity and cetane number, which both <strong>de</strong>creases with<br />
increasing <strong>de</strong>gree of saturation. Palm and sunflower methyl esters have com<strong>para</strong>tiv<strong>el</strong>y low<br />
iodine values, rapeseed oil methyl esters have iodine values up to 120 what represent the limit<br />
according the European standard, and soybean- as w<strong>el</strong>l as sunflower oil- methyl esters have<br />
both iodine values around 130. Therefore EN 14214 exclu<strong>de</strong>s pure soybean-, sunflower- and<br />
safflower oil methyl esters from serving as a fu<strong>el</strong> (Zhang, 2003).<br />
160<br />
Iodine value [ mg/kg ]<br />
140<br />
120<br />
100<br />
80<br />
60<br />
40<br />
20<br />
0<br />
max. iodine value according EN 14214<br />
Rapssed Soybean Jatropha Saffflower Palm oil Lard Tallow<br />
Fig. 3-12 Iodine values of biodies<strong>el</strong> <strong>de</strong>rived from different types of oils/fats (Hilber, 2005; EnAu, 2003)<br />
<strong>Biodies<strong>el</strong></strong> viscosity is corr<strong>el</strong>ated to the iodine number of biodies<strong>el</strong>. One of the main reasons for<br />
processing oils/fats for use in engines is to reduce the viscosity thereby improving fu<strong>el</strong> flow<br />
characteristics. The viscosity of pure vegetable oils is 10 to 15 times greater than the viscosity<br />
of dies<strong>el</strong>. Transesterification of vegetable oils produces esters with a viscosity of<br />
approximat<strong>el</strong>y twice that of dies<strong>el</strong>. Viscosity is also an indicator of polymerisation of biodies<strong>el</strong><br />
and increases as a function of thermal and oxidative <strong>de</strong>gradation.<br />
Phosphorous content is <strong>de</strong>rived from the feedstock as w<strong>el</strong>l. Phosphorous in fatty acid methyl<br />
esters mainly stems from phospholipids containing in the feedstock. The type of oil recovery<br />
strongly influences the final phosphorous content. Cold pressed oils usually contain less<br />
amount of phosphorous than hot pressed one. <strong>Biodies<strong>el</strong></strong> with high phosphorous content are<br />
suspected of <strong>de</strong>creasing the efficiency of oxidation converters and causing higher particular<br />
matter emissions (TFZ, 2002).<br />
The impact of free fatty acids (FFA) on the biodies<strong>el</strong> production process has been discussed<br />
extensiv<strong>el</strong>y <strong>el</strong>sewhere. While the FFA content can impact the production process by<br />
<strong>de</strong>activating the catalyst, creating soap, and by r<strong>el</strong>easing water when they are converted to<br />
esters, they do not seem to impact the final acid value of the biodies<strong>el</strong>.<br />
36
<strong>Potenciales</strong> y <strong>Viabilidad</strong> <strong><strong>de</strong>l</strong> <strong>Uso</strong> <strong>de</strong> <strong>Bioetanol</strong> y <strong>Biodies<strong>el</strong></strong> <strong>para</strong> <strong>el</strong> Transporte en México (SENER-BID-GTZ)<br />
Task C: <strong>Biodies<strong>el</strong></strong> production and end-use in Mexico; Task D: Potentials in r<strong>el</strong>ation to sustainability criteria<br />
Task E: Rationales, drivers and barriers for biodies<strong>el</strong> market introduction; Task F: Synthesis and recommendations<br />
In summary the fu<strong>el</strong> properties of biodies<strong>el</strong> are strongly influenced by the properties of the<br />
feedstock that means the individual fatty ester profiles. In general the cetane number, m<strong>el</strong>ting<br />
point and viscosity of fatty esters increase with increasing chain length. Furthermore a i<strong>de</strong>al<br />
feedstock regarding combustion characteristics, oxidative stability and cold flow behavior<br />
consist only out of monosaturated fatty acids.<br />
The main important properties of biodies<strong>el</strong> r<strong>el</strong>ated to the production technology are, nam<strong>el</strong>y,<br />
the contents of free and total glycerin, the residual methanol content, the amount of phosphor,<br />
sulfated ash, water, flash point and the acid value.<br />
The content for free and total glycerin in biodies<strong>el</strong> <strong>de</strong>pends on the production process and is<br />
therefore a major criterion of fu<strong>el</strong> quality. On the one si<strong>de</strong> glycerin is formed due to hydrolysis<br />
of reaming mono, di- and triglycerids in stored fu<strong>el</strong>. On the other hand high values may stem<br />
from insufficient washing of the ester product. Free glycerol se<strong>para</strong>tes within the fu<strong>el</strong> tank and<br />
can causes damage to the injection system. A higher content of free glycerol may cause<br />
problems during storage or in the fu<strong>el</strong> system due to se<strong>para</strong>tion of glycerol, or can lead to<br />
injector fouling or the formation of higher al<strong>de</strong>hy<strong>de</strong> emissions.<br />
Residual methanol in the biodies<strong>el</strong> product is removed by distillation or by washing steps<br />
after the transesterfication. Residual methanol is a safety issue as even a very small amount<br />
will reduce the flash point greatly. Besi<strong>de</strong>s, methanol can also affect fu<strong>el</strong> pumps, seals and<br />
<strong>el</strong>astomers.<br />
Sulfur in biodies<strong>el</strong> is sourced from the crops and animal fats used as feedstock. Most virgin or<br />
first use vegetable oil and animal fat based biodies<strong>el</strong> has less than 15 ppm sulfur, however it<br />
has been found that recycled cooking oil can contain up to 40 ppm sulfur. This sulfur is<br />
suspected to originate from food cooked in the oil. Caution is also recommen<strong>de</strong>d for feedstock<br />
from slaughterhouse waste fats as hairs contain sulfur and will lead to higher values than<br />
10 ppm. Combustion of fu<strong>el</strong> containing sulfur causes emissions of sulfur dioxi<strong>de</strong> and<br />
particulate matter. Sulfurous emissions can also lead to poisoning of post-treatment <strong>de</strong>vices;<br />
however, this larg<strong>el</strong>y <strong>de</strong>pends on operating conditions.<br />
3.4 <strong>Biodies<strong>el</strong></strong> distribution and use<br />
In the following section aspects r<strong>el</strong>ated to the biodies<strong>el</strong> distribution to the end user and its<br />
application in vehicles fleets are consi<strong>de</strong>red (Fig. 3-13).<br />
Fig. 3-13 <strong>Biodies<strong>el</strong></strong> distribution and end-use<br />
37
<strong>Potenciales</strong> y <strong>Viabilidad</strong> <strong><strong>de</strong>l</strong> <strong>Uso</strong> <strong>de</strong> <strong>Bioetanol</strong> y <strong>Biodies<strong>el</strong></strong> <strong>para</strong> <strong>el</strong> Transporte en México (SENER-BID-GTZ)<br />
Task C: <strong>Biodies<strong>el</strong></strong> production and end-use in Mexico; Task D: Potentials in r<strong>el</strong>ation to sustainability criteria<br />
Task E: Rationales, drivers and barriers for biodies<strong>el</strong> market introduction; Task F: Synthesis and recommendations<br />
3.4.1 Generalities<br />
Generally, biodies<strong>el</strong> (B-100) or biodies<strong>el</strong> blends (e.g. B-20) can be distributed and used<br />
similar to petroleum dies<strong>el</strong>. However, the properties (i.e. particularly oxidation stability and<br />
viscosity) that are different <strong>de</strong>pending on feedstock applied for biodies<strong>el</strong> production are of<br />
importance. Thus, maintaining fu<strong>el</strong> quality is a key issue. Additional important issues of<br />
biodies<strong>el</strong> blending and handling are the stability and the cold flow properties of the pure<br />
biodies<strong>el</strong> and blends.<br />
As with petroleum dies<strong>el</strong>, biodies<strong>el</strong> has to be transported in a way that does not lead to<br />
contaminations. Basically, this is realized by conventional tank vehicles. The first biodies<strong>el</strong><br />
pip<strong>el</strong>ine (length about 2.7 km, capacity 95,000 t/a) in Europe was recently commissioned<br />
(June 2006) closed to the oil harbour Lobau (Austria). However, careful attention has to be<br />
ma<strong>de</strong> concerning biodies<strong>el</strong> mix with other fu<strong>el</strong>s as w<strong>el</strong>l as the injection of water. Moreover<br />
biodies<strong>el</strong> must be stored and handled using procedures which do not allow the temperature to<br />
drop b<strong>el</strong>ow its cloud point. In addition to that biodies<strong>el</strong> temperature, the ambient temperature,<br />
and the time the fu<strong>el</strong> is in transport should be taken into account (Tyson & McCormick, 2006).<br />
<strong>Biodies<strong>el</strong></strong> filling stations need to fulfill larg<strong>el</strong>y the same requirements as petrodies<strong>el</strong> filling<br />
stations; generally, individual states requirements concerning facilities for filling and<br />
transferring water-endangering substances need to be attend.<br />
<strong>Biodies<strong>el</strong></strong> with <strong>de</strong>fined quality (cf. section 3.3) can be used in existing dies<strong>el</strong> combustion<br />
engines. Since biodies<strong>el</strong> is a non-fossil fu<strong>el</strong> alternative to petrodies<strong>el</strong>, it can be used in pure<br />
form (B-100) or may be blen<strong>de</strong>d with petroleum dies<strong>el</strong> at any concentration in most mo<strong>de</strong>rn<br />
dies<strong>el</strong> engines (i.e. direct and indirect ignition as w<strong>el</strong>l as common rail engines).<br />
3.4.2 Experiences and recommendations<br />
3.4.2.1 Distribution<br />
Generally biodies<strong>el</strong> resistance materials have to be applied (e.g. synthetic rubber, aluminum,<br />
ste<strong>el</strong>); components ma<strong>de</strong> of zinc, copper and copper alloys should be avoi<strong>de</strong>d, since biodies<strong>el</strong><br />
can <strong>de</strong>compose some zinc layers and result in a formation of soap and copper acts as an<br />
oxidation catalyst and acc<strong>el</strong>erates drops in oxidation stability. Regarding filling stations<br />
standard hose's outer jacket is often not lastingly resistant to biodies<strong>el</strong> (AGQM, 2006;<br />
IEA, 2005).<br />
Free water in the fu<strong>el</strong> system causes corrosion and fu<strong>el</strong> <strong>de</strong>gradation; water enters in the tank<br />
mostly by air. It is thus recommen<strong>de</strong>d to all parties thereto of the biodies<strong>el</strong> transport chain to<br />
observe that water injection to biodies<strong>el</strong> will be <strong>el</strong>iminated during biodies<strong>el</strong> handling (i.e.<br />
loading and discharge of tank vess<strong>el</strong>, <strong><strong>de</strong>l</strong>ivery at fu<strong>el</strong>ing station) and transport. Unnecessary<br />
handling of biodies<strong>el</strong> should be avoi<strong>de</strong>d with regard to fu<strong>el</strong>s quality (AGQM, 2006).<br />
Moreover, following suggestions have been ma<strong>de</strong> by (Tyson & McCormick, 2006):<br />
38
<strong>Potenciales</strong> y <strong>Viabilidad</strong> <strong><strong>de</strong>l</strong> <strong>Uso</strong> <strong>de</strong> <strong>Bioetanol</strong> y <strong>Biodies<strong>el</strong></strong> <strong>para</strong> <strong>el</strong> Transporte en México (SENER-BID-GTZ)<br />
Task C: <strong>Biodies<strong>el</strong></strong> production and end-use in Mexico; Task D: Potentials in r<strong>el</strong>ation to sustainability criteria<br />
Task E: Rationales, drivers and barriers for biodies<strong>el</strong> market introduction; Task F: Synthesis and recommendations<br />
• proper inspection and/or washout as w<strong>el</strong>l as drying of tank, hoses and seals,<br />
• check for previous load carried and residuals (e.g. oils, gasoline, lubricants, water);<br />
only dies<strong>el</strong> fu<strong>el</strong> is acceptable as a residual,<br />
• <strong>de</strong>termination of need for insulation or method to heat truck or rail car contents if<br />
biodies<strong>el</strong> is shipped during cold weather.<br />
In the winter, most biodies<strong>el</strong> is shipped either (i) at least warm in trucks for immediate<br />
<strong><strong>de</strong>l</strong>ivery, (ii) hot in railcars for <strong><strong>de</strong>l</strong>ivery within a week or (iii) in a blend with winter dies<strong>el</strong>,<br />
kerosene, or other low cloud point fu<strong>el</strong> in either railcars or trucks (Tyson & McCormick,-<br />
2006).<br />
3.4.2.2 Use<br />
Although biodies<strong>el</strong> has combustion properties very similar to petrodies<strong>el</strong>, including<br />
combustion energy and cetane ratings, the combustion process is different compared with<br />
petroleum dies<strong>el</strong>. I<strong>de</strong>ally, engine and exhaust-gas re-treatment system has to be matched by<br />
the fu<strong>el</strong> <strong>para</strong>meters (as in the case of petroleum dies<strong>el</strong>) in or<strong>de</strong>r to ensure observance of<br />
emission limits (AGQM, 2006). However, due to the slightly lower calorific value compared<br />
to petrodies<strong>el</strong> efficiency losses or a slightly higher biodies<strong>el</strong> fu<strong>el</strong> <strong>de</strong>mand per km respectiv<strong>el</strong>y<br />
can be occur. The latter vary significantly <strong>de</strong>pending on the operational area of vehicles (e.g.<br />
passenger car, industrial vehicles and tractor); experiences values are in the range of few<br />
percent up to 5 %, s<strong>el</strong>dom even up to 10 %.<br />
<strong>Biodies<strong>el</strong></strong> is a better solvent than petrodies<strong>el</strong> and has been known to break down accumulated<br />
<strong>de</strong>posits of residue in the fu<strong>el</strong> lines of vehicles that have previously been run on petrodies<strong>el</strong>.<br />
Thus, fu<strong>el</strong> filters can be clogged with particulates in case of an expeditiously switch to pure<br />
biodies<strong>el</strong>. It is, therefore, recommen<strong>de</strong>d to change the fu<strong>el</strong> filter within e.g. 1,000 to 1,200 km<br />
after first switching to a biodies<strong>el</strong> blend.<br />
When applied in vehicles without r<strong>el</strong>ease of automobile manufacturer for biodies<strong>el</strong>, gaskets<br />
and hoses can become brittle and leaky owing to <strong>de</strong>grading of plasticizer of natural rubber<br />
(because of the solvent effect of biodies<strong>el</strong>). Thus, biodies<strong>el</strong> using cars should be equipped with<br />
materials (e.g. synthetic rubber) which are non-reactive to biodies<strong>el</strong>. However, most<br />
<strong>el</strong>astomers used after 1993 are compatible with B 100, the effect of blends (B-20) is less or<br />
non-existent (IEA, 2005).<br />
Long experiences in the sector of passenger cars and commercial vehicles show that longlasting<br />
use of biodies<strong>el</strong> can cause <strong>de</strong>terioration in vehicle fu<strong>el</strong> pumps; this is particularly true<br />
for direct fu<strong>el</strong> injection engine. Additionally, biodies<strong>el</strong> increases fu<strong>el</strong> lubricity even at very<br />
low blending lev<strong>el</strong>s (IEA, 2005). It can accumulate in engine lubricating oil especially during<br />
low-load operation by commercial vehicles 3 (e.g. resulting in higher abrasions of dies<strong>el</strong><br />
3 Since biodies<strong>el</strong> has a higher boiling point than petrodies<strong>el</strong>, it does not exhale out of the hot engine lubricating<br />
oil, which result in a creeping increase of biodies<strong>el</strong> content in the lubricating oil. This in turn can result in<br />
un<strong>de</strong>sirable <strong>de</strong>posits because of the <strong>de</strong>composition of biodies<strong>el</strong> due to its lower chemical stability of biodies<strong>el</strong>. As<br />
a final result dies<strong>el</strong> engine are exposed to higher abrasions.<br />
39
<strong>Potenciales</strong> y <strong>Viabilidad</strong> <strong><strong>de</strong>l</strong> <strong>Uso</strong> <strong>de</strong> <strong>Bioetanol</strong> y <strong>Biodies<strong>el</strong></strong> <strong>para</strong> <strong>el</strong> Transporte en México (SENER-BID-GTZ)<br />
Task C: <strong>Biodies<strong>el</strong></strong> production and end-use in Mexico; Task D: Potentials in r<strong>el</strong>ation to sustainability criteria<br />
Task E: Rationales, drivers and barriers for biodies<strong>el</strong> market introduction; Task F: Synthesis and recommendations<br />
engines).Thus, shorter intervals for changing engine lubricating oil are required when<br />
biodies<strong>el</strong> is applied (AGQM, 2006). Long-term effects of biodies<strong>el</strong> with an insufficient<br />
oxidation stability or soap <strong>de</strong>position (non-compliant proportions of alkaline and alkaline earth<br />
<strong>el</strong>ements) on injection pumps are exemplarily shown in Fig. 3-14.<br />
Fig. 3-14 Long-term effects of oxidation stability (left) or soap <strong>de</strong>position (right) on injection pumps<br />
(AGQM, 2006)<br />
The favorable bio<strong>de</strong>gradability can be <strong>de</strong>trimental when biodies<strong>el</strong> is used. Bio<strong>de</strong>gradability is<br />
associated to an adverse <strong>de</strong>terioration stability and bacteria <strong>de</strong>cay; oxidation and water<br />
injection also <strong>de</strong>teriorate biodies<strong>el</strong> properties in case of long-time storage. Accordingly,<br />
corrosion or abrasion (particularly within the injection pump) and thus malfunction can be<br />
occur.<br />
First experiences using biodies<strong>el</strong> in Mexican public buses have by all means shown positive<br />
results with regard to exhaust gas emissions (primarily particulate matter (PM), soot and the<br />
characteristic sm<strong>el</strong>l of dies<strong>el</strong> fu<strong>el</strong>).<br />
40
<strong>Potenciales</strong> y <strong>Viabilidad</strong> <strong><strong>de</strong>l</strong> <strong>Uso</strong> <strong>de</strong> <strong>Bioetanol</strong> y <strong>Biodies<strong>el</strong></strong> <strong>para</strong> <strong>el</strong> Transporte en México (SENER-BID-GTZ)<br />
Task C: <strong>Biodies<strong>el</strong></strong> production and end-use in Mexico; Task D: Potentials in r<strong>el</strong>ation to sustainability criteria<br />
Task E: Rationales, drivers and barriers for biodies<strong>el</strong> market introduction; Task F: Synthesis and recommendations<br />
4 ECONOMIC FEASIBILITY ANALYSIS<br />
In addition to quality criteria for the produced biodies<strong>el</strong>, specific biodies<strong>el</strong> production and<br />
provision costs are of importance for the implementation on a commercial transportation fu<strong>el</strong><br />
market in Mexico. Therefore, an economic feasibility analysis for biodies<strong>el</strong> production is<br />
carried out for the different reference concepts (cf. section 3.2.4). With respect to the process<br />
sheets the overall costs for biodies<strong>el</strong> production (i.e. all expenditures and revenues) are<br />
analyzed un<strong>de</strong>r Mexican frame conditions. Moreover, the cost analysis is exemplarily done for<br />
mo<strong><strong>de</strong>l</strong> production plants at agricultural as w<strong>el</strong>l as industrial scale. In practice the costs are<br />
r<strong>el</strong>ated to the specific local conditions and specific production plant <strong>de</strong>sign.<br />
4.1 Methodical approach<br />
According to the whole supply chain of biodies<strong>el</strong>, the economic analysis is focused on the cost<br />
analysis r<strong>el</strong>ated to biodies<strong>el</strong> production; the biodies<strong>el</strong> production costs its<strong>el</strong>f and the economic<br />
efficiency. Therefore, the same system boundary is applied as for the technical feasibility<br />
analysis (cf. chapter 3); i.e. all incoming feedstock as w<strong>el</strong>l as utilities and auxiliary energy<br />
flows as w<strong>el</strong>l as products (biodies<strong>el</strong>) and by-products (e.g. glycerin, press cake) flows are<br />
consi<strong>de</strong>red free plant gate. As follows a <strong>de</strong>scription of the applied calculation mo<strong><strong>de</strong>l</strong> as w<strong>el</strong>l as<br />
frame conditions is given.<br />
4.1.1 Calculation mo<strong><strong>de</strong>l</strong><br />
For the <strong>de</strong>termination of total biodies<strong>el</strong> production costs and the economic efficiencies of the<br />
different reference concept a calculation mo<strong><strong>de</strong>l</strong> is applied based. The specific biodies<strong>el</strong><br />
production costs are calculated by using the annuity method (VDI, 1996). Moreover, specific<br />
economic efficiencies are assessed with regard to the cash flow of the biodies<strong>el</strong> plant. This<br />
cash flow analysis involves the calculation of the annuity and the internal rate of return (IRR)<br />
as an indicator of the economic efficiency.<br />
The principle of the calculation mo<strong><strong>de</strong>l</strong> is shown in Fig. 4-1. Within this mo<strong><strong>de</strong>l</strong> for each<br />
reference concept main cost components to be involved are on the expenditure si<strong>de</strong> (i) capital<br />
investment for plant and plants periphery, (ii) operation and maintenance such as for utilities,<br />
waste, personal, (iii) feedstock and on the revenue si<strong>de</strong> (iv) credits for by-products. Based on<br />
this annual expenditures and revenues the specific biodies<strong>el</strong> production costs are calculated as<br />
average cost of all periods taking into account the annual biodies<strong>el</strong> production rate and the<br />
annual inflation rate. In addition, annuity and IRR are calculated for the comparison of the<br />
different concepts in terms of economic efficiency.<br />
41
<strong>Potenciales</strong> y <strong>Viabilidad</strong> <strong><strong>de</strong>l</strong> <strong>Uso</strong> <strong>de</strong> <strong>Bioetanol</strong> y <strong>Biodies<strong>el</strong></strong> <strong>para</strong> <strong>el</strong> Transporte en México (SENER-BID-GTZ)<br />
Task C: <strong>Biodies<strong>el</strong></strong> production and end-use in Mexico; Task D: Potentials in r<strong>el</strong>ation to sustainability criteria<br />
Task E: Rationales, drivers and barriers for biodies<strong>el</strong> market introduction; Task F: Synthesis and recommendations<br />
Fig. 4-1<br />
Calculation mo<strong><strong>de</strong>l</strong> for biodies<strong>el</strong> production cost<br />
Moreover, a sensitivity analysis is carried out to primarily evaluate the effect of potential<br />
uncertainties of the assumed <strong>para</strong>meters and secondly show the influence of future price<br />
evolutions (e.g. feedstock). For this purpose, reasonable <strong>para</strong>meters are varied by means of the<br />
applied calculation mo<strong><strong>de</strong>l</strong>. Regarding biodies<strong>el</strong> fu<strong>el</strong> costs, the main cost components (e.g.<br />
capital, feedstock, by-products) and the annual full load of the plant will be varied within<br />
realistic ranges. Additionally, this <strong>de</strong>termination is done for economic efficiency.<br />
To i<strong>de</strong>ntify whether subsidies are required for the implementation of biodies<strong>el</strong> on the Mexican<br />
market, the <strong>de</strong>termined biodies<strong>el</strong> production costs will be compared to present and projected<br />
dies<strong>el</strong> prices (coming from Task A). Furthermore, cost aspects of biodies<strong>el</strong> distribution and the<br />
use of biodies<strong>el</strong> as blends or straight fu<strong>el</strong> will be investigated.<br />
4.1.2 Frame conditions<br />
There are many aspects to be consi<strong>de</strong>red, such as scale, plants location, processing technology<br />
as w<strong>el</strong>l as feedstocks and any (by-)products that can be marketed. For instance, a biodies<strong>el</strong><br />
plant that is <strong>de</strong>pen<strong>de</strong>nt on purchasing the required feedstock faces different conditions than<br />
one that has an assured or captive feedstock supply. As mentioned within the technical<br />
feasibility analysis (cf. chapter 3), wi<strong>de</strong> experiences of mass and energy flow is known for<br />
biodies<strong>el</strong> production plants based on rape seed. This is also the case for the cost analysis.<br />
Since biodies<strong>el</strong> production cost primarily <strong>de</strong>pend on feedstock prices or provision costs<br />
respectiv<strong>el</strong>y the cost analysis of total capital investment as w<strong>el</strong>l as operation costs are based on<br />
reference mo<strong><strong>de</strong>l</strong> plants for rape seed.<br />
42
<strong>Potenciales</strong> y <strong>Viabilidad</strong> <strong><strong>de</strong>l</strong> <strong>Uso</strong> <strong>de</strong> <strong>Bioetanol</strong> y <strong>Biodies<strong>el</strong></strong> <strong>para</strong> <strong>el</strong> Transporte en México (SENER-BID-GTZ)<br />
Task C: <strong>Biodies<strong>el</strong></strong> production and end-use in Mexico; Task D: Potentials in r<strong>el</strong>ation to sustainability criteria<br />
Task E: Rationales, drivers and barriers for biodies<strong>el</strong> market introduction; Task F: Synthesis and recommendations<br />
4.1.2.1 General assumptions<br />
For the economic analysis it is assumed that the reference biodies<strong>el</strong> plants are new,<br />
disregarding their competition to existing plants and the plant utilization is consi<strong>de</strong>red to be in<br />
equivalent full load hours. Moreover, the current frame conditions are the basis for a common<br />
comparison of the biodies<strong>el</strong> concepts.<br />
In general, <strong>para</strong>meters such as specific taxes (e.g. petroleum tax subsidies) and tariffs,<br />
fluctuating revenues and expenditures incurred during start up, salvage and <strong>de</strong>commissioning<br />
of the plant are not taken into account. The economic lifetime (i.e. typical consi<strong>de</strong>ration period<br />
for investment sector) is assumed to be about 10 years.<br />
The annual inflation rate is in a wi<strong>de</strong> range for different industrial sectors (e.g. metal industry,<br />
import/export); moreover, they are subject to fluctuations. Regarding the assessment of the<br />
general economic feasibility, an average inflation rate of annually 5.5 % is assumed, that<br />
correspond to the general inflation rate, given as average of the time horizon of January 2000<br />
to May 2006 (Banco <strong>de</strong> Mexico, 2006).<br />
Furthermore, for the monetary profit a interest due of about 7 % is consi<strong>de</strong>red according to the<br />
“Certificados <strong>de</strong> la Tesorería <strong>de</strong> la Fe<strong>de</strong>ración” (CETES) (Banco <strong>de</strong> Mexico, 2006). If a<br />
biodies<strong>el</strong> company is listed on the stoke exchange interest dues of more than 30 % are realized<br />
within the last year. However, this case will be not addressed within this study.<br />
4.1.2.2 Capital-r<strong>el</strong>ated costs<br />
These costs are based on the total capital investment (i) of the biodies<strong>el</strong> plant its<strong>el</strong>f (either<br />
including oil mill and biodies<strong>el</strong> production unit or only the latter), (ii) costs for periphery or<br />
land respectiv<strong>el</strong>y as w<strong>el</strong>l as (iii) plant <strong>de</strong>v<strong>el</strong>opment and engineering costs. Moreover,<br />
maintenance costs for plant <strong>de</strong>vices those have to be periodic renewed during, equity and<br />
leverage as w<strong>el</strong>l as interest rate and consi<strong>de</strong>ration period are taken into account.<br />
Capital investment and maintenance costs<br />
For the cost calculation within this study capital investment for the biodies<strong>el</strong> plants of the<br />
different reference concepts are estimated for the appropriate reference concepts based on<br />
existing experiences from commercial plants in Europe, the U.S. and Mexico 4 . A higher<br />
capital investment can be assumed for biodies<strong>el</strong> plants including crusher and refining systems<br />
for oil production. Generally, due to economy of scale the specific capital investment<br />
<strong>de</strong>creases with increasing biodies<strong>el</strong> plant capacity. Land cost for industrial <strong>de</strong>v<strong>el</strong>opments and<br />
thus for biodies<strong>el</strong> plants strongly <strong>de</strong>pends on location and available infrastructure. For that<br />
purposes industrial parks in central Mexico have been investigated 5 , the land cost of which<br />
vary between 14 and 400 US$/m². For this study about 872 MX$/m² (80 US$/m²) is<br />
4 cf. section 2.2.<br />
5 An overview is given in the Appendix Table A-1<br />
43
<strong>Potenciales</strong> y <strong>Viabilidad</strong> <strong><strong>de</strong>l</strong> <strong>Uso</strong> <strong>de</strong> <strong>Bioetanol</strong> y <strong>Biodies<strong>el</strong></strong> <strong>para</strong> <strong>el</strong> Transporte en México (SENER-BID-GTZ)<br />
Task C: <strong>Biodies<strong>el</strong></strong> production and end-use in Mexico; Task D: Potentials in r<strong>el</strong>ation to sustainability criteria<br />
Task E: Rationales, drivers and barriers for biodies<strong>el</strong> market introduction; Task F: Synthesis and recommendations<br />
consi<strong>de</strong>red to be a representative cost. Moreover, according to existing biodies<strong>el</strong> plants typical<br />
factors for “required land per plant capacity” are taken into account:<br />
• agricultural scale: 0.33 m²/t fu<strong>el</strong> for plants including oil production,<br />
• industrial scale: range of 0.075 m²/t fu<strong>el</strong> for plants without and 0.27 m²/t fu<strong>el</strong> for plants<br />
including oil production; 0.085 m²/t fu<strong>el</strong> for multi-feedstock plants<br />
The assumed total investment costs are summarized as follows (Tab. 4-4).<br />
Moreover, annual maintenance costs are assumed to be 1.5 % of the total capital investment.<br />
Tab. 4-1 Total capital investment (average) reference concepts (IE, 2006)<br />
Reference concept Feedstock Capacity [t/a]<br />
Capital investment<br />
plant* [1,000 MX$]<br />
Land costs<br />
[1,000 MX$]<br />
Specific total capital<br />
investment<br />
[1,000 MX$/MW fu<strong>el</strong> ]<br />
Agricultural<br />
oil mill-biodies<strong>el</strong> plant<br />
(small-scale)<br />
Industrial<br />
oil mill-biodies<strong>el</strong> plant<br />
(large-scale)<br />
Industrial<br />
biodies<strong>el</strong> plant (largescale)<br />
oil seeds 3,600 11,800 1,040 2,100<br />
oil seeds 93,750 310,900 23,550 2,590<br />
vegetable oil 93,750 184,800 6,540 1,490<br />
Industrial<br />
multi-feedstock biodies<strong>el</strong><br />
plant (large-scale)<br />
(waste)<br />
vegetable oil,<br />
animal fats,<br />
tallow<br />
46,900 268,600 3,706 4,170<br />
* including plant <strong>de</strong>v<strong>el</strong>opment and engineering costs<br />
Capital share and interest rate<br />
Un<strong>de</strong>r the Mexican conditions small and medium-sized businesses tend to invest high equities<br />
as bank interests are r<strong>el</strong>ativ<strong>el</strong>y high and economical financing of banks are rar<strong>el</strong>y to access.<br />
Moreover, expectations with regard to capital return are at least of annually 15 to 20 %.<br />
Therefore, an equity of about 50 % of the total capital investment and return rate of 20 % is<br />
consi<strong>de</strong>red. For industrial and foreign companies an equity of about 30 % and return rate of<br />
15 % is assumed. This is also true for the typical bank interests for the appropriate leverage at<br />
industrial scale. More economical credits are also available from international <strong>de</strong>v<strong>el</strong>opment<br />
banks; For instance, the North American Dev<strong>el</strong>opment Bank offers credits for 50 % leverage<br />
(in the future up to 80 %) at the rate of annually 5 to 6%; however, this is only valid for<br />
project closed to the bor<strong>de</strong>r of the U.S. from up to 300 km.<br />
44
<strong>Potenciales</strong> y <strong>Viabilidad</strong> <strong><strong>de</strong>l</strong> <strong>Uso</strong> <strong>de</strong> <strong>Bioetanol</strong> y <strong>Biodies<strong>el</strong></strong> <strong>para</strong> <strong>el</strong> Transporte en México (SENER-BID-GTZ)<br />
Task C: <strong>Biodies<strong>el</strong></strong> production and end-use in Mexico; Task D: Potentials in r<strong>el</strong>ation to sustainability criteria<br />
Task E: Rationales, drivers and barriers for biodies<strong>el</strong> market introduction; Task F: Synthesis and recommendations<br />
4.1.2.3 Consumption-r<strong>el</strong>ated costs<br />
Feedstock<br />
As known from experiences and existing studies, the feedstock prices/costs are of most<br />
important influence to the total biodies<strong>el</strong> production costs. In the following information on<br />
representative (i) oilseeds prices, (ii) vegetable oil prices, (iii) animal fats (i.e. beef tallow) are<br />
given. Wholesale vegetable oil prices are r<strong>el</strong>evant if the feedstock is inten<strong>de</strong>d for processing at<br />
an industrial large-scale biodies<strong>el</strong> plant without oil mills, whereas prices for oilseeds paid<br />
directly to the farmer may be of greater interest for agricultural biodies<strong>el</strong> plants with oil mill.<br />
For industrial biodies<strong>el</strong> production plants it is assumed that vegetable oil is <strong><strong>de</strong>l</strong>ivered in a<br />
quality that is required for the appropriate reference concept. A summary of prices/costs<br />
assumed for this cost calculation is given in Tab. 4-2.<br />
45
<strong>Potenciales</strong> y <strong>Viabilidad</strong> <strong><strong>de</strong>l</strong> <strong>Uso</strong> <strong>de</strong> <strong>Bioetanol</strong> y <strong>Biodies<strong>el</strong></strong> <strong>para</strong> <strong>el</strong> Transporte en México (SENER-BID-GTZ)<br />
Task C: <strong>Biodies<strong>el</strong></strong> production and end-use in Mexico; Task D: Potentials in r<strong>el</strong>ation to sustainability criteria<br />
Task E: Rationales, drivers and barriers for biodies<strong>el</strong> market introduction; Task F: Synthesis and recommendations<br />
Tab. 4-2 Feedstock prices or costs respectiv<strong>el</strong>y (Lazcano, 2006; ITSEM, 2006; IE, 2006)<br />
Kind of feedstock<br />
Market price / costs<br />
Range<br />
Used for cost<br />
[MX$/t] a<br />
calculation [MX$/t]<br />
Notes<br />
(e.g. properties, market<br />
r<strong>el</strong>evance)<br />
Oil seeds/fruits b<br />
Sunflower 2,367 to 3,129 2,750<br />
Rape seed 2,839 to 3,927 3,380<br />
Safflower 2,255 to 2,875 2,570<br />
Soy bean 2,356 to 3,000 2,680 primarily imported today<br />
Oil / African palm 487 to 627 560 primarily private<br />
produced today<br />
Jatropha 1,660 1,660 not commercially<br />
produced today<br />
(Cru<strong>de</strong>) Vegetable oil c<br />
Sunflower oil 4,140 to 5,341 4,740<br />
Rape seed oil 4,578 4,580<br />
Safflower oil f 12,640 to 15,000 6,910 today primarily tra<strong>de</strong>d in<br />
very small charge units<br />
Soy bean oil 4,469 to 6,289 5,380<br />
Palm oil 3,270 to 4,750 4,010 production and whole sale<br />
price in Mexico<br />
Jatropha oil n.a. 3,800 not commercially<br />
produced today<br />
Grease/cooking oil<br />
Y<strong>el</strong>low grease 4,400 d 4,400<br />
FFA < 20 %<br />
Animal fats<br />
Beef tallow 3,500 e to 5,200 d 4,350 FFA < 10 to 12 %<br />
a<br />
b<br />
c<br />
d<br />
e<br />
f<br />
Currency exchange rate 2006: 1 US$ = 10.9 MX$<br />
Average rural price, data based on agricultural year 2004/2005<br />
most important wholesale vegetable oil and fat provi<strong>de</strong>rs in Mexico, many of which agreed to provi<strong>de</strong> prices<br />
exclusive VAT<br />
exclusive transport<br />
prices based on market prices for bottled safflower oil (á 12 l of 145 to 165 MX$) that is usually tra<strong>de</strong>d at<br />
present; for energetic use a whole sale price, which is of approx. 50 % cheaper per tone is assumed<br />
Auxiliary substances<br />
With regard to the technical analysis for biodies<strong>el</strong> production via esterification and<br />
transesterification specific auxiliary substances such as alcohol (i.e. methanol), acid and alkali<br />
catalysts (e.g. hydrogen sulfi<strong>de</strong>, sodium hydroxi<strong>de</strong> or potassium hydroxi<strong>de</strong>, for industrial<br />
large-scale also sodium methylate solution) as w<strong>el</strong>l as washing agents are used (cf.<br />
section 3.2.1). Since these prices do not significantly affect the total biodies<strong>el</strong> production<br />
price, international wholesale prices are implemented in the cost calculation mo<strong><strong>de</strong>l</strong> (Fig. 4-1).<br />
46
<strong>Potenciales</strong> y <strong>Viabilidad</strong> <strong><strong>de</strong>l</strong> <strong>Uso</strong> <strong>de</strong> <strong>Bioetanol</strong> y <strong>Biodies<strong>el</strong></strong> <strong>para</strong> <strong>el</strong> Transporte en México (SENER-BID-GTZ)<br />
Task C: <strong>Biodies<strong>el</strong></strong> production and end-use in Mexico; Task D: Potentials in r<strong>el</strong>ation to sustainability criteria<br />
Task E: Rationales, drivers and barriers for biodies<strong>el</strong> market introduction; Task F: Synthesis and recommendations<br />
Tab. 4-3 Wholesale prices auxiliary substances (Methanex, 2006; IE, 2006)<br />
Auxiliary substance<br />
Market price<br />
[MX$/unit]<br />
Notes<br />
(e.g. properties, market r<strong>el</strong>evance)<br />
Alcohol<br />
Methanol (CH 3 OH) 3,630 a non-discounted reference price<br />
Catalysts / Washing agents<br />
Hydrogen sulfi<strong>de</strong> (H 2 SO 4 ) 1,330<br />
Potassium hydroxi<strong>de</strong> (KOH) 9,970<br />
Sodium methylate (NaOCH 3 in CH 3 OH) 8,310<br />
a<br />
Currency exchange rate 2006: 1 US$ = 10.9 MX$<br />
Consumables for supply of process energy<br />
The following assumptions are ma<strong>de</strong> for auxiliary consumables that are given as average<br />
values (Presi<strong>de</strong>ncia, 2006; ITSEM, 2006):<br />
• <strong>el</strong>ectricity: approx. 0.75 MX$/kWh<strong>el</strong><br />
• natural gas for process heat provision at industrial (large-)scale: 75 MX$/GJ<br />
• oil for process heat provision at small-scale: 5.50 MX$/l<br />
4.1.2.4 Operation-r<strong>el</strong>ated and other costs<br />
Personn<strong>el</strong><br />
Personn<strong>el</strong> cost calculation is based on the official minimum wage in Mexico of 15,000 MX$/a<br />
(i.e. monthly 1,250 MX$), inclusive social insurance contribution of approximat<strong>el</strong>y 35 % this<br />
is about 20,250 MX$/a. Depending on the education or business <strong>de</strong>gree of the personn<strong>el</strong> the<br />
costs range from 40,500 MX$/a (e.g. semi-skilled worker), over 121,500 MX$/a (e.g.<br />
technician) to 2,025,000 MX$/a (e.g. manager of a medium or large sized company)<br />
(ITSEM, 2006). For the cost calculation the following personn<strong>el</strong> costs per employee are<br />
assumed:<br />
• agricultural plants: 81,000 MX$/a<br />
• industrial plants: 121,500 MX$/a<br />
Insurance and Services<br />
Regarding a common standard, annual costs for insurance and services are consi<strong>de</strong>red as each<br />
of 1 % of the total capital investment within the cost calculation.<br />
4.1.2.5 Credits for by-products<br />
According to the process <strong>de</strong>scription ma<strong>de</strong> in section 3.2.3 by-products accumulate during the<br />
production of vegetable oil (e.g. press cake) and – <strong>de</strong>pending on used auxiliaries (i.e. catalysts<br />
47
<strong>Potenciales</strong> y <strong>Viabilidad</strong> <strong><strong>de</strong>l</strong> <strong>Uso</strong> <strong>de</strong> <strong>Bioetanol</strong> y <strong>Biodies<strong>el</strong></strong> <strong>para</strong> <strong>el</strong> Transporte en México (SENER-BID-GTZ)<br />
Task C: <strong>Biodies<strong>el</strong></strong> production and end-use in Mexico; Task D: Potentials in r<strong>el</strong>ation to sustainability criteria<br />
Task E: Rationales, drivers and barriers for biodies<strong>el</strong> market introduction; Task F: Synthesis and recommendations<br />
and wash solvents) – during the biodies<strong>el</strong> production process steps (e.g. cru<strong>de</strong> glycerin,<br />
fertilizer). Generally, these by-products can be offered for sale. As follows typical market<br />
aspects and credits for by-products are analyzed.<br />
Press cake<br />
For reference concepts of biodies<strong>el</strong> production that inclu<strong>de</strong> oil production from oil seeds or<br />
plants respectiv<strong>el</strong>y press cake accumulates that can be offered as animal food. Within this cost<br />
calculation it is assumed that press cake can be disposed at current market prices. An overview<br />
is given as follows (Tab. 4-4). For press cake from palm fruit it is assumed that it cannot be<br />
used as animal food; the general possible to apply this cake for biomass combustion is not<br />
neglected. Therefore no credit can be achieved for that.<br />
Tab. 4-4 Receipts for press cake (SNIIM, 2006; Lazcano, 2006)<br />
Market price / costs<br />
Press cake<br />
Range<br />
[MX$/t]<br />
Used for cost calculation<br />
[MX$/t]<br />
Sunflower 2,500 2,500<br />
Rape seed 2,050 to 2,500 2,280<br />
Safflower 1,484 1,480<br />
Soy beans 2,155 to 3,000 2,580<br />
Jatropha 780 780<br />
Glycerin<br />
Glycerin is primarily used for cosmetics, food and beverages, urethane polyols,<br />
pharmaceuticals, alkyd resins, tobacco, explosives and c<strong>el</strong>lophane. The current world glycerin<br />
<strong>de</strong>mand is about is about 950,000 t/a. In 2005 an amount of approximat<strong>el</strong>y<br />
1 to 1.1 Million tons is produced from many sources, such as (Omni Tech, 2005):<br />
48<br />
• natural glycerin is a by-product of soap and oleochemical production from vegetable<br />
oils and animal fats or tallow,<br />
• synthetic glycerin is produced via hydrolysis of epichlorohydrin ma<strong>de</strong> from propylene<br />
and chlorine,<br />
• cru<strong>de</strong> glycerin – as already discussed – is produced as by-product of biodies<strong>el</strong><br />
production (approximat<strong>el</strong>y 10 % of biodies<strong>el</strong> amount).<br />
On the world market there is a growing imbalance of supply over <strong>de</strong>mand of cru<strong>de</strong> glycerin;<br />
this increasing disposal problem causes a <strong>de</strong>clining of market prices. Especially, biodies<strong>el</strong><br />
production and market <strong>de</strong>mand growth in Europe (about 28 % per year since 2000) and the<br />
U.S. (additional supply of ca. 36,000 to 50,000 tons) has commenced causing a major supply<br />
surplus of cru<strong>de</strong> glycerin without enough refining capacities or <strong>de</strong>mand on the market to<br />
absorb that growing volumes (EurObservER, 2006; Omni Tech, 2005). Although the glycerin<br />
consumption <strong>de</strong>creases consi<strong>de</strong>rably (e.g. because centers of cosmetics and pharmaceuticals<br />
production have been transferred to cheaper geographical locations such as Mexico or China),<br />
imports in the U.S. constitute at least 40 % of glycerin supply. The Europeans exported
<strong>Potenciales</strong> y <strong>Viabilidad</strong> <strong><strong>de</strong>l</strong> <strong>Uso</strong> <strong>de</strong> <strong>Bioetanol</strong> y <strong>Biodies<strong>el</strong></strong> <strong>para</strong> <strong>el</strong> Transporte en México (SENER-BID-GTZ)<br />
Task C: <strong>Biodies<strong>el</strong></strong> production and end-use in Mexico; Task D: Potentials in r<strong>el</strong>ation to sustainability criteria<br />
Task E: Rationales, drivers and barriers for biodies<strong>el</strong> market introduction; Task F: Synthesis and recommendations<br />
40,000 tons of glycerin in 2003. A price overview of cru<strong>de</strong> glycerin (content about 80 %) as<br />
w<strong>el</strong>l as the high quality pharmaceutical gra<strong>de</strong> glycerin (content 99.7 %) is shown in Fig. 4-2<br />
(Oleoline, 2004).<br />
Cru<strong>de</strong> glycerin price (bulk CFR Rotterdam) [US$/t]<br />
2,000<br />
1,800<br />
1,600<br />
1,400<br />
1,200<br />
1,000<br />
800<br />
600<br />
400<br />
200<br />
Cru<strong>de</strong> glycerin (CFR Rotterdam)<br />
Pharmaceut. gra<strong>de</strong> glycerin U.S.<br />
Pharmaceut. gra<strong>de</strong> glycerin E.U.<br />
2006 further price<br />
<strong>de</strong>cline to approx.<br />
150 US$/t,<br />
thereafter price<br />
pegging to approx.<br />
180 US$/t<br />
2,000<br />
1,800<br />
1,600<br />
1,400<br />
1,200<br />
1,000<br />
800<br />
600<br />
400<br />
200<br />
Pharmaceut. gra<strong>de</strong> glycerin price [€/t]<br />
Fig. 4-2<br />
0<br />
0<br />
12/95 12/96 12/97 12/98 12/99 12/00 12/01 12/02 12/03 12/04 12/05 12/06 12/07<br />
Price evolution of cru<strong>de</strong> and pharmaceutical gra<strong>de</strong> glycerin on the world market<br />
A global glycerin production of approximat<strong>el</strong>y 1.8 to 2.0 million tons is expected for the year<br />
2010. The key to creating new market <strong>de</strong>mand for growing cru<strong>de</strong> glycerin supplies is to<br />
discover alternative end uses (e.g. aircraft <strong>de</strong>icing fluids, conversion to polyols,<br />
bioremediation and other industrial applications) for 80 % cru<strong>de</strong> glycerin or an upgra<strong>de</strong>d<br />
glycerin as w<strong>el</strong>l as their <strong>de</strong>rivates (Graff, 2006).<br />
In Mexico companies 6 such as Aprotec <strong>de</strong> Mexico, Bayer <strong>de</strong> Mexico, Industrias Crown<br />
Chemical and Sigma-Aldrich Química are industrial users of glycerin, most of which is<br />
imported. According to information from Solvey <strong>de</strong> Mexico, the price of glycerin is<br />
17.69 MX$/kg (pharmaceutical gra<strong>de</strong>). However, for the following cost calculation only cru<strong>de</strong><br />
glycerin is taken into account for which a price of 1,635 MX$/t is assumed for disposal on the<br />
market.<br />
Other by-products<br />
As discussed within the technical analysis, the by-product (e.g. when using hydrogen sulfi<strong>de</strong><br />
potassium based catalysts potassium sulfate occurs) and resulting from glycerol and salt<br />
treatment can be used as fertilizer. For the different Mexican regions for potassium sulfate<br />
used as fertilizer there is a price range of 3,900 MX$/t for Michoacán (Sahuayo) up to<br />
9,200 MX$/t for Baja California Sur (La Paz) (SECOFI, 2006). With regard to sales<br />
6 For a complete list please see the Appendix Table A-2.<br />
49
<strong>Potenciales</strong> y <strong>Viabilidad</strong> <strong><strong>de</strong>l</strong> <strong>Uso</strong> <strong>de</strong> <strong>Bioetanol</strong> y <strong>Biodies<strong>el</strong></strong> <strong>para</strong> <strong>el</strong> Transporte en México (SENER-BID-GTZ)<br />
Task C: <strong>Biodies<strong>el</strong></strong> production and end-use in Mexico; Task D: Potentials in r<strong>el</strong>ation to sustainability criteria<br />
Task E: Rationales, drivers and barriers for biodies<strong>el</strong> market introduction; Task F: Synthesis and recommendations<br />
opportunities for biodies<strong>el</strong> producer a lower lev<strong>el</strong> of 4,000 MX$/t will be assumed for the cost<br />
calculation.<br />
4.1.2.6 <strong>Biodies<strong>el</strong></strong> distribution and use<br />
As mentioned in section 3.4, biodies<strong>el</strong> will be distributed similar to petrodies<strong>el</strong>. An estimated<br />
transport cost for cru<strong>de</strong> oil in tank trailers is 0.8 MX$/(kg⋅1,000 km) (ITSEM, 2006). The total<br />
costs for the distribution of biodies<strong>el</strong> from an industrial plant to a blend and/or fu<strong>el</strong> station can<br />
be assumed to be in the dimension of approx. 0.34 MX$/l. Concerning biodies<strong>el</strong> use, for<br />
biodies<strong>el</strong> blend (e.g. B-5) the existing vehicle fleet can be applied; thus no additional costs<br />
incurred.<br />
4.2 <strong>Biodies<strong>el</strong></strong> production costs and economic efficiency<br />
The following results for biodies<strong>el</strong> production costs and the economic efficiencies of the<br />
production plants (reference plants) are calculated by application of the above explained cost<br />
calculation mo<strong><strong>de</strong>l</strong> (cf. Fig. 4-1). Moreover, the results of the sensitivity analysis ma<strong>de</strong> for the<br />
production costs are <strong>de</strong>scribed.<br />
Production cost overview<br />
In Fig. 4-3 the biodies<strong>el</strong> production costs are shown in comparison to PEMEX dies<strong>el</strong> (without<br />
taxes and duties) in MX$ per liter PEMEX dies<strong>el</strong> equivalent (indicated as DE). Cost<br />
components such as feedstock costs, operation of the plant and capital r<strong>el</strong>ated costs are shown<br />
as expenditures, while the credits for by-products (i.e. for press cake, cru<strong>de</strong> glycerin and<br />
fertilizer) are shown as receipts; the sum of both is the outcome that are indicated as total<br />
biodies<strong>el</strong> production costs.<br />
50
<strong>Potenciales</strong> y <strong>Viabilidad</strong> <strong><strong>de</strong>l</strong> <strong>Uso</strong> <strong>de</strong> <strong>Bioetanol</strong> y <strong>Biodies<strong>el</strong></strong> <strong>para</strong> <strong>el</strong> Transporte en México (SENER-BID-GTZ)<br />
Task C: <strong>Biodies<strong>el</strong></strong> production and end-use in Mexico; Task D: Potentials in r<strong>el</strong>ation to sustainability criteria<br />
Task E: Rationales, drivers and barriers for biodies<strong>el</strong> market introduction; Task F: Synthesis and recommendations<br />
35<br />
30<br />
25<br />
20<br />
15<br />
10<br />
5<br />
0<br />
-5<br />
-10<br />
-15<br />
10.0<br />
6.5<br />
9.4 8.9<br />
10.0<br />
6.3<br />
8.4<br />
5.7<br />
7.8<br />
5.8<br />
7.8<br />
5.3<br />
6.6 6.8<br />
12.4<br />
7.6<br />
5.7 5.9<br />
Feedstock<br />
Operation<br />
Capital<br />
By-products<br />
Total<br />
7.9 7.9<br />
4.3<br />
-20<br />
-25<br />
Rape<br />
seed<br />
Sunflower<br />
Safflower<br />
Soy<br />
beans<br />
Jatropha<br />
Palm<br />
Rape<br />
seed<br />
Sunflower<br />
Safflower<br />
Soy<br />
beans<br />
Jatropha<br />
Palm<br />
Rape<br />
seed<br />
Sunflower<br />
Safflower<br />
Soy<br />
beans<br />
Jatropha<br />
Palm<br />
Tallow<br />
Grease<br />
PEMEX<br />
Dies<strong>el</strong>*<br />
<strong>Biodies<strong>el</strong></strong> production costs [MX$/l DE<br />
]<br />
Agricultural oil mill-biodies<strong>el</strong> plant Industrial oil mill-biodies<strong>el</strong> plant Industrial biodies<strong>el</strong> plant Industrial<br />
multifeedstock<br />
biodies<strong>el</strong><br />
plant<br />
Conv.<br />
Fig. 4-3<br />
<strong>Biodies<strong>el</strong></strong> production costs (PEMEX dies<strong>el</strong> for comparison, * exclusive taxes and duties)<br />
51
<strong>Potenciales</strong> y <strong>Viabilidad</strong> <strong><strong>de</strong>l</strong> <strong>Uso</strong> <strong>de</strong> <strong>Bioetanol</strong> y <strong>Biodies<strong>el</strong></strong> <strong>para</strong> <strong>el</strong> Transporte en México (SENER-BID-GTZ)<br />
Task C: <strong>Biodies<strong>el</strong></strong> production and end-use in Mexico; Task D: Potentials in r<strong>el</strong>ation to sustainability criteria<br />
Task E: Rationales, drivers and barriers for biodies<strong>el</strong> market introduction; Task F: Synthesis and recommendations<br />
The following main conclusions can be revealed:<br />
• The cost lev<strong>el</strong> of biodies<strong>el</strong> production is significantly higher (i.e. 5.3 to 12.4 MX$/l DE )<br />
than for PEMEX dies<strong>el</strong> (4.3 MX$/l DE ). Thus, when only biodies<strong>el</strong> is compared, it can<br />
be favorable based on palm, sunflower and soy beans. Jatropha shows in a higher cost<br />
range; however, since even the oil crop is not commercially produced today there is a<br />
high insecurity concerning the mass and cost data.<br />
• For annex plants (i.e. oil mill and biodies<strong>el</strong> plant) a production cost <strong>de</strong>crease occurs<br />
due to the use of different transesterification reactors (cf. section 3.2.4) and effects of<br />
economy of scale from agricultural to industrial plants.<br />
• Since market prices are used for vegetable oils converted in industrial biodies<strong>el</strong> plants<br />
single plants), the differences between the feedstocks show other r<strong>el</strong>ations (e.g. rape<br />
seed cheaper to the others when compared to annex plants).<br />
• The feedstock costs are the most important cost component and contribute to the<br />
expenditures to about 59 % for biodies<strong>el</strong> based on palm up to 91 % for biodies<strong>el</strong> based<br />
on soy beans.<br />
• In particular for biodies<strong>el</strong> based on oil plants, which have a high content of cake (i.e.<br />
soy beans, Rape seeds, sunflower and safflower), the total biodies<strong>el</strong> production costs<br />
are also dominated by the receipts for by-products. This is r<strong>el</strong>evant to annex plants; in<br />
single plants only cru<strong>de</strong> glycerin and fertilizer accumulates as by-product with only a<br />
marginal impact to the total biodies<strong>el</strong> production costs.<br />
In addition to that the results of the sensitivity analysis are exemplarily shown for jatropha<br />
biodies<strong>el</strong> produced in an agricultural annex plant as w<strong>el</strong>l as soy bean and palm biodies<strong>el</strong> in an<br />
industrial annex plant (Fig. 4-4 et seqq.).<br />
20<br />
18<br />
<strong>Biodies<strong>el</strong></strong> production costs [MX$/l DE<br />
]<br />
Fig. 4-4<br />
16<br />
14<br />
12<br />
10<br />
8<br />
6<br />
4<br />
2<br />
0<br />
10 30 50 70 90 110 130 150 170 190<br />
Variation of <strong>para</strong>meters [%]<br />
Sensitivity analysis – biodies<strong>el</strong> from jatropha in agricultural scale<br />
Capital investment<br />
Operation<br />
Feedstock<br />
By-products<br />
Annual load<br />
52
<strong>Potenciales</strong> y <strong>Viabilidad</strong> <strong><strong>de</strong>l</strong> <strong>Uso</strong> <strong>de</strong> <strong>Bioetanol</strong> y <strong>Biodies<strong>el</strong></strong> <strong>para</strong> <strong>el</strong> Transporte en México (SENER-BID-GTZ)<br />
Task C: <strong>Biodies<strong>el</strong></strong> production and end-use in Mexico; Task D: Potentials in r<strong>el</strong>ation to sustainability criteria<br />
Task E: Rationales, drivers and barriers for biodies<strong>el</strong> market introduction; Task F: Synthesis and recommendations<br />
20<br />
18<br />
<strong>Biodies<strong>el</strong></strong> production costs [MX$/l DE<br />
]<br />
16<br />
14<br />
12<br />
10<br />
8<br />
6<br />
4<br />
2<br />
0<br />
10 30 50 70 90 110 130 150 170 190<br />
Variation of <strong>para</strong>meters [%]<br />
Capital investment<br />
Operation<br />
Feedstock<br />
By-products<br />
Annual load<br />
Fig. 4-5 Sensitivity analysis – biodies<strong>el</strong> from soy beans in industrial scale 7<br />
20<br />
18<br />
<strong>Biodies<strong>el</strong></strong> production costs [MX$/l DE<br />
]<br />
16<br />
14<br />
12<br />
10<br />
8<br />
6<br />
4<br />
2<br />
0<br />
10 30 50 70 90 110 130 150 170 190<br />
Variation of <strong>para</strong>meters [%]<br />
Capital investment<br />
Operation<br />
Feedstock<br />
By-products<br />
Annual load<br />
Fig. 4-6<br />
Sensitivity analysis – biodies<strong>el</strong> from palm in industrial scale<br />
7 <strong>Biodies<strong>el</strong></strong> based on soy beans shows a special case since the cost r<strong>el</strong>ations of feedstock costs and credits for<br />
press cake can outweigh each other resulting in negative production costs.<br />
53
<strong>Potenciales</strong> y <strong>Viabilidad</strong> <strong><strong>de</strong>l</strong> <strong>Uso</strong> <strong>de</strong> <strong>Bioetanol</strong> y <strong>Biodies<strong>el</strong></strong> <strong>para</strong> <strong>el</strong> Transporte en México (SENER-BID-GTZ)<br />
Task C: <strong>Biodies<strong>el</strong></strong> production and end-use in Mexico; Task D: Potentials in r<strong>el</strong>ation to sustainability criteria<br />
Task E: Rationales, drivers and barriers for biodies<strong>el</strong> market introduction; Task F: Synthesis and recommendations<br />
Basically for all plants it can be resumed that (i) feedstock costs are most important, in many<br />
cases followed by (ii) receipts for by-products – mainly driven by the credits for cake and the<br />
oil plant specific mass content – and/or (iii) plant operation cost; (iv) capital investment is of<br />
only marginal influence which is in turn reflected in the low impact of reduced annual load.<br />
For the annual load of biofu<strong>el</strong> plants it is true that the higher the capital investment and thus<br />
the fixed costs, the higher the impact of annual load of a plant. For instance, bioethanol<br />
typically is more capital intensive; thus the operational availability is crucial for an economic<br />
efficient plant operation. This is different for biodies<strong>el</strong> plants.<br />
R<strong>el</strong>ated to the impact of capital investment, the financial <strong>para</strong>meters such as calculation<br />
period, leverage and bank interest for leverage are only of a very marginal influence. As<br />
follows examples are given for annex plants:<br />
• A variation of the calculation period from 10 years in base case to 20 years results in a<br />
<strong>de</strong>crease in biodies<strong>el</strong> costs of about 7 to 12 %. For 5 years this is about 4 to 6 %.<br />
• A variation of bank interest from 15 % in base case to 7.5 % results in a <strong>de</strong>crease in<br />
biodies<strong>el</strong> costs of approx. 0.5 % and can thus be neglected.<br />
Hence, favourable capital conditions can be used as financial incentive for the implementation<br />
of biodies<strong>el</strong> plants in Mexico. However, for the economic plant operation this is only<br />
marginally r<strong>el</strong>evant; here aspects of cost favourable feedstock as w<strong>el</strong>l as appropriate markets<br />
for press cake are of crucial importance.<br />
Economic efficiency<br />
The results of the economic efficiency consi<strong>de</strong>ration are shown in Fig. 4-7. Here the approach<br />
is applied to i<strong>de</strong>ntify the required sales price for biodies<strong>el</strong> (excluding possible taxes and<br />
duties) at a target IRR of 20 %. The results are compared to the price of PEMEX dies<strong>el</strong> (i.e.<br />
including taxes and duties). Thus it can be revealed, that biodies<strong>el</strong> industrial produced from<br />
palm, soy beans and sunflower can be competitive with PEMEX dies<strong>el</strong> if taxes and duties are<br />
neglected for biofu<strong>el</strong>s. This is also true for palm and sunflower dies<strong>el</strong> produced in agricultural<br />
plants as w<strong>el</strong>l as for the use of rape seed and jatropha oil in industrial biodies<strong>el</strong> plant un<strong>de</strong>r the<br />
assumed frame conditions. However, it is again noted that there is a high uncertainty for<br />
jatropha assumptions.<br />
Moreover, the plant specific annuity is indicated. The annuity corr<strong>el</strong>ates to the IRR and is<br />
according to production plant type and capacity in a range of 1.2 million MX$/a for<br />
agricultural plants to about 21 million MX$/a for industrial annex plants.<br />
54
<strong>Potenciales</strong> y <strong>Viabilidad</strong> <strong><strong>de</strong>l</strong> <strong>Uso</strong> <strong>de</strong> <strong>Bioetanol</strong> y <strong>Biodies<strong>el</strong></strong> <strong>para</strong> <strong>el</strong> Transporte en México (SENER-BID-GTZ)<br />
Task C: <strong>Biodies<strong>el</strong></strong> production and end-use in Mexico; Task D: Potentials in r<strong>el</strong>ation to sustainability criteria<br />
Task E: Rationales, drivers and barriers for biodies<strong>el</strong> market introduction; Task F: Synthesis and recommendations<br />
25,000<br />
Annuity<br />
Sale price for biodies<strong>el</strong><br />
12.50<br />
Annuity at IRR=20% [1,000 MX$/a]<br />
20,000<br />
15,000<br />
10,000<br />
5,000<br />
7.5<br />
4.9<br />
7.1<br />
6.7<br />
7.5<br />
4.7<br />
6.3<br />
4.3<br />
5.9<br />
4.3<br />
5.9<br />
4.0<br />
5.0 5.1<br />
9.3<br />
5.7<br />
4.3<br />
4.5<br />
5.9 6.0<br />
5.3<br />
10.00<br />
7.50<br />
5.00<br />
2.50<br />
<strong>Biodies<strong>el</strong></strong> sale price at IRR = 20% [MX$/l]<br />
0<br />
Rape seed<br />
Sunflower<br />
Safflower<br />
Soy beans<br />
Jatropha<br />
Palm<br />
Rape seed<br />
Sunflower<br />
Safflower<br />
Soy beans<br />
Jatropha<br />
Palm<br />
Rape seed<br />
Sunflower<br />
Safflower<br />
Soy beans<br />
Jatropha<br />
Palm<br />
Tallow<br />
Grease<br />
PEMEX Dies<strong>el</strong><br />
0.00<br />
Agricultural oil mill-biodies<strong>el</strong> plant Industrial oil mill-biodies<strong>el</strong> plant Industrial biodies<strong>el</strong> plant Industrial<br />
multifeedstock<br />
Conv.<br />
Fig. 4-7<br />
Required biodies<strong>el</strong> sales prices for economic efficient biodies<strong>el</strong> production plants (IRR of 20%; PEMEX dies<strong>el</strong> including tax and duties)<br />
55
<strong>Potenciales</strong> y <strong>Viabilidad</strong> <strong><strong>de</strong>l</strong> <strong>Uso</strong> <strong>de</strong> <strong>Bioetanol</strong> y <strong>Biodies<strong>el</strong></strong> <strong>para</strong> <strong>el</strong> Transporte en México (SENER-BID-GTZ)<br />
Task C: <strong>Biodies<strong>el</strong></strong> production and end-use in Mexico; Task D: Potentials in r<strong>el</strong>ation to sustainability criteria<br />
Task E: Rationales, drivers and barriers for biodies<strong>el</strong> market introduction; Task F: Synthesis and recommendations<br />
5 POTENTIALS IN RELATION TO SUSTAINIBILITY<br />
CRITERIA<br />
Even if the expectations with regard to biodies<strong>el</strong> as source of sustainable energy are high,<br />
there are also certain risks that may lead to damage to nature and the environment and to<br />
advers<strong>el</strong>y social and economic effects. In the following chapter r<strong>el</strong>evant economic,<br />
environmental and social problems of biodies<strong>el</strong> production in Mexico are i<strong>de</strong>ntified.<br />
5.1 Economic aspects of biodies<strong>el</strong> production<br />
The worldwi<strong>de</strong> concerns about energy cost, especially those of mineral oil, have led to a<br />
continuous search for alternative fu<strong>el</strong>s. Therefore, one benchmark for the macro-economic<br />
analysis of biodies<strong>el</strong> implementation in Mexico is the global mineral oil market. Furthermore,<br />
there is a conflict in the use of vegetable oils for the biofu<strong>el</strong> production, the use in food<br />
industry as w<strong>el</strong>l as in the industrial use. Those interactions among the markets are very<br />
complex; for a first estimation the different markets can be briefly <strong>de</strong>scribed as follows.<br />
5.1.1 Global and national mineral oil market<br />
<strong>Biodies<strong>el</strong></strong> has to compete with fossil fu<strong>el</strong>s, which are still dominant in the world wi<strong>de</strong> energy<br />
<strong>de</strong>mand in transport sector today – and are lik<strong>el</strong>y to remain so in the coming years. Whether or<br />
not biodies<strong>el</strong> can <strong>de</strong>v<strong>el</strong>op in Mexico and in what pace <strong>de</strong>pends larg<strong>el</strong>y on the <strong>de</strong>v<strong>el</strong>opment of<br />
the global mineral oil market. The period during the study was conducted this study is<br />
embossed by r<strong>el</strong>ativ<strong>el</strong>y high mineral oil prices. This is on the one hand si<strong>de</strong> based of the rapid<br />
growth on the <strong>de</strong>mand si<strong>de</strong>, especially the new emerging countries like India and China and on<br />
the other si<strong>de</strong> there is the not solved conflict in the Middle East where nearly 70 % of the<br />
worldwi<strong>de</strong> mineral oil resources are located.<br />
Mexico is the 4 th biggest cru<strong>de</strong> oil producer in the world, which is one strength of the Mexican<br />
political economy. About 187 million t cru<strong>de</strong> oil were produced, about 87 million t were used<br />
in Mexico whereas the rest is exported (primarily into the U.S.). In 2004 dies<strong>el</strong> represented<br />
approx. 15 % (62,500 PJ) of the final energy consumption of the country. The <strong>de</strong>mand of<br />
petroleum dies<strong>el</strong>, like <strong>de</strong>scribed in Task A (IMP, 2006), is going to increase from<br />
16.28 Mio t./a in 2005 up to 20.66 Mio t./a in 2014 (Figure 5-1).<br />
56
<strong>Potenciales</strong> y <strong>Viabilidad</strong> <strong><strong>de</strong>l</strong> <strong>Uso</strong> <strong>de</strong> <strong>Bioetanol</strong> y <strong>Biodies<strong>el</strong></strong> <strong>para</strong> <strong>el</strong> Transporte en México (SENER-BID-GTZ)<br />
Task C: <strong>Biodies<strong>el</strong></strong> production and end-use in Mexico; Task D: Potentials in r<strong>el</strong>ation to sustainability criteria<br />
Task E: Rationales, drivers and barriers for biodies<strong>el</strong> market introduction; Task F: Synthesis and recommendations<br />
Production and <strong>de</strong>mand of PEMEX dies<strong>el</strong> [million t/a]<br />
20<br />
18<br />
16<br />
14<br />
12<br />
10<br />
8<br />
6<br />
4<br />
2<br />
0<br />
Production<br />
Demand<br />
2000 2001 2002 2003 2004 2005 2006 2007 2008 2009 2010 2011 2012 2013 2014<br />
Fig. 5-1<br />
Dev<strong>el</strong>opment of the dies<strong>el</strong> production and <strong>de</strong>mand for the years 1994 to 2014 in Mexico<br />
(SENER, 2006)<br />
5.1.2 Global and national vegetable oil market<br />
In the area of agriculture, the oil and fat industries are among the fastest growing global<br />
growth sectors. In the last 20 years the worldwi<strong>de</strong> consumption of oils and fats has risen by an<br />
average of 4% per year. The increased <strong>de</strong>mand in oils and fats is larg<strong>el</strong>y due to consumer<br />
growth in the food sector in newly industrialised countries such as China and India 8 . In<br />
contrast, there is a rising <strong>de</strong>mand to use plant oils as raw materials for producing biodies<strong>el</strong> in<br />
the industrialised countries.<br />
5.1.2.1 Supply and <strong>de</strong>mand<br />
In the economic year 2004/05 approx. 379 million t of oilseeds were produced. Roughly 57 %<br />
of these oilseeds were covered by the production of soy beans, which are mainly cultivated in<br />
North and South America. Some distance behind this is followed by rape seeds production<br />
with 12 % of the global production volume. Peanuts supply 9 % (35 million t) and sunflower<br />
seeds 6 % (25 million t) of worldwi<strong>de</strong> oilseed <strong>de</strong>mand (Fig. 5-2).<br />
8<br />
Globally speaking approx. 80 % of oils and fats are used in the food sector.<br />
57
<strong>Potenciales</strong> y <strong>Viabilidad</strong> <strong><strong>de</strong>l</strong> <strong>Uso</strong> <strong>de</strong> <strong>Bioetanol</strong> y <strong>Biodies<strong>el</strong></strong> <strong>para</strong> <strong>el</strong> Transporte en México (SENER-BID-GTZ)<br />
Task C: <strong>Biodies<strong>el</strong></strong> production and end-use in Mexico; Task D: Potentials in r<strong>el</strong>ation to sustainability criteria<br />
Task E: Rationales, drivers and barriers for biodies<strong>el</strong> market introduction; Task F: Synthesis and recommendations<br />
Fig. 5-2 Global market for oilseeds in 2005<br />
Almost all of the oilseed harvest is used to produce oils and fats. According to estimation of<br />
the USDA the world-wi<strong>de</strong> production of the nine most important vegetable oils and fats<br />
reached 111.2 million t in 2005. The overall consumption of plant oils and fats over the last<br />
five years has risen by approx. 26 %, whereby China has experienced the largest growth in<br />
consumption of more than 40 % what is mainly based on <strong>de</strong>mand growth in the food sector. In<br />
the financial year 2005 again the palm oil production with 34.6 million t (plus 4.2 % in<br />
r<strong>el</strong>ation to previous year) exceeds the production of soy bean oil with 33.8 million t (plus<br />
5.6 %). For the future it is expected that due to the global aggressive renewable fu<strong>el</strong>s policy,<br />
the lev<strong>el</strong> of worlds vegetable oil <strong>de</strong>mand will increase faster even then in the past. There are<br />
certain effects combined with this so called biodies<strong>el</strong> effect (Fig. 5-3). The higher oilseed<br />
production will furthermore increase the availability of protein meals from oilseed crush.<br />
Moreover, the growing global bioethanol industry is also producing protein fod<strong>de</strong>r as byproduct.<br />
As far as the vegetable oil <strong>de</strong>mand will increase faster than protein meal <strong>de</strong>mand the<br />
prices for vegetable oil will increase, encouraged by stronger <strong>de</strong>mand and will lower protein<br />
meal price. Therefore, production of palm oil and high oil content seeds like rape seeds will<br />
grow faster than soy bean production.<br />
58
<strong>Potenciales</strong> y <strong>Viabilidad</strong> <strong><strong>de</strong>l</strong> <strong>Uso</strong> <strong>de</strong> <strong>Bioetanol</strong> y <strong>Biodies<strong>el</strong></strong> <strong>para</strong> <strong>el</strong> Transporte en México (SENER-BID-GTZ)<br />
Task C: <strong>Biodies<strong>el</strong></strong> production and end-use in Mexico; Task D: Potentials in r<strong>el</strong>ation to sustainability criteria<br />
Task E: Rationales, drivers and barriers for biodies<strong>el</strong> market introduction; Task F: Synthesis and recommendations<br />
Fig. 5-3<br />
Worlds projected consumption on vegetable oils<br />
5.1.2.2 Tra<strong>de</strong> for oilseeds and products<br />
The worldwi<strong>de</strong> tra<strong>de</strong> of oilseeds and its processed products is restricted to a few export/import<br />
countries and products. As with most agricultural products, the global tra<strong>de</strong> flows of oilseeds<br />
and its by-products are larg<strong>el</strong>y <strong>de</strong>termined by domestic foreign tra<strong>de</strong> policy (customs duties)<br />
and the market mechanism for supply and <strong>de</strong>mand.<br />
About 79 million t of oilseed and 42.2 million t of vegetable oils were tra<strong>de</strong>d in the economic<br />
year 2004/05. Soy bean is the most important tra<strong>de</strong>d product and constitutes 85 % of all tra<strong>de</strong>d<br />
oilseeds. The main export countries are the U.S., Brazil and Argentina, which s<strong>el</strong>l a major part<br />
of their produced seeds in China (27 million t) and the EU-25 (15.2 million t). On the one<br />
hand, the China has a large processing capacity; however, the available land for the further<br />
expansion of cultivation areas is limited. In particular, the continued increase in livestock<br />
numbers results in a rising <strong>de</strong>mand for soy meal; this inevitably creates a <strong>de</strong>pen<strong>de</strong>ncy on<br />
imports. Canada is the leading rape seeds (canola) exporter (3.5 million t), whereby Canadian<br />
rape seeds are mainly exported to Japan, Mexico as w<strong>el</strong>l as U.S.. The second largest global<br />
rape seeds exporter is Australia with 1.1 million t of rape seeds.<br />
Palm oil accounts for roughly half the tra<strong>de</strong> in plant oils (20 million t). This is followed by soy<br />
beans and sunflower oil with trading volumes of 10 million t and 2.6 million t respectiv<strong>el</strong>y.<br />
The trading volume of rape seed oil is only 1.4 million t, of which roughly 70 % is exported<br />
from Canada to mainly the U.S. (70 %) and China.<br />
As <strong>de</strong>scribed in Task B Mexico is currently up to 95 % <strong>de</strong>pen<strong>de</strong>d imports of vegetable<br />
oilseeds and products and it is forecasted that the <strong>de</strong>mand for oilseed products is going to<br />
increase in the coming years (Lazcano, 2006). Also the oil and meal imports are expected to<br />
increase in the near and middle term, as domestic <strong>de</strong>mand to outstrip increases in domestic<br />
production. Currently, soy beans are the main imported oilseed, representing 70 % of<br />
Mexico’s total oilseed imports. Nearly 50 % of the oil imports are palm oil followed by 23 %<br />
59
<strong>Potenciales</strong> y <strong>Viabilidad</strong> <strong><strong>de</strong>l</strong> <strong>Uso</strong> <strong>de</strong> <strong>Bioetanol</strong> y <strong>Biodies<strong>el</strong></strong> <strong>para</strong> <strong>el</strong> Transporte en México (SENER-BID-GTZ)<br />
Task C: <strong>Biodies<strong>el</strong></strong> production and end-use in Mexico; Task D: Potentials in r<strong>el</strong>ation to sustainability criteria<br />
Task E: Rationales, drivers and barriers for biodies<strong>el</strong> market introduction; Task F: Synthesis and recommendations<br />
of soy bean oil. The U.S. market is and will continue to be the major oilseed supplier to<br />
Mexico. Although the government of Mexico would like to achieve greater s<strong>el</strong>f-sufficiency in<br />
oilseed production, this may be difficult as the vast majority of Mexico production takes place<br />
on non-irrigated land. Thus, consi<strong>de</strong>rable investments in irrigation systems would be<br />
necessary to make any significant change in Mexico’s production to use ratio of oilseeds<br />
(USDA, 2006).<br />
To meet the <strong>de</strong>mand on B-5 approx. 4,000 kt of oil seeds (e.g. soy beans and rape seeds) are<br />
required (cf. Fig. 5-4). Un<strong>de</strong>r the present circumstances (i.e. non s<strong>el</strong>f sufficient supply)<br />
additionally 75 % of the current oilseed imports would be required (see chapter 0).<br />
Amount [1,000 t]<br />
8,500<br />
7,500<br />
6,500<br />
5,500<br />
4,500<br />
3,500<br />
2,500<br />
1,500<br />
500<br />
Production in Mexico<br />
Import (~70% soya, 30% rape seeds of oil seeds)<br />
Export (~ 12,000 t oil seeds; ~38,000 t oil)<br />
-500<br />
Oil seed total<br />
Oil seed <strong>de</strong>mand<br />
for B-5<br />
Oil total<br />
Fod<strong>de</strong>r/Meal<br />
Fig. 5-4 Mexican market for oilseeds and products - import and exports (USDA, 2006; IE, 2006)<br />
5.1.3 Institutional and Legal<br />
Currently, there is a <strong>de</strong> facto tax exemption for biofu<strong>el</strong>s since taxing applies to hydrocarbons<br />
only, not to fu<strong>el</strong>s in general. However, the lack of explicit regulations for this point may<br />
negativ<strong>el</strong>y impact on investor confi<strong>de</strong>nce.<br />
No national standard exists for biodies<strong>el</strong> today. However, the national automotive industry<br />
(due to its strong export orientation) is quite familiar with biodies<strong>el</strong> and its combustion<br />
properties. The <strong>de</strong>v<strong>el</strong>opment of a national standard therefore should not pose a major problem.<br />
The <strong>de</strong>v<strong>el</strong>opment of a national legal framework is in its early stage, but has shown significant<br />
progress recently. Principle of sustainability <strong>de</strong>v<strong>el</strong>opment <strong>de</strong>fined in national <strong>de</strong>v<strong>el</strong>opment<br />
plan 2001 to 2006 (so called PND).<br />
60
<strong>Potenciales</strong> y <strong>Viabilidad</strong> <strong><strong>de</strong>l</strong> <strong>Uso</strong> <strong>de</strong> <strong>Bioetanol</strong> y <strong>Biodies<strong>el</strong></strong> <strong>para</strong> <strong>el</strong> Transporte en México (SENER-BID-GTZ)<br />
Task C: <strong>Biodies<strong>el</strong></strong> production and end-use in Mexico; Task D: Potentials in r<strong>el</strong>ation to sustainability criteria<br />
Task E: Rationales, drivers and barriers for biodies<strong>el</strong> market introduction; Task F: Synthesis and recommendations<br />
• The law for the promotion and <strong>de</strong>v<strong>el</strong>opment of bioenergy (Ley <strong>de</strong> Promoción y<br />
Desarrollo <strong>de</strong> los Bioenergéticos, LPBD) which has been approved by the Senate<br />
(Cámara <strong>de</strong> Senadores).<br />
• Regarding biodies<strong>el</strong> feedstocks, different to vegetable oil crops, the use of animal fats<br />
(i.e. tallow) and waste vegetable oils (i.e. grease) is currently not foreseen within the<br />
LPBD and probably need to be addressed with regard to the existing biodies<strong>el</strong><br />
capacities (cf. section 2.2).<br />
• The law for the utilization of renewable energy sources (Ley Para <strong>el</strong> Aprovechamiento<br />
<strong>de</strong> las Fuentes Renovables <strong>de</strong> Energía). This law initiative is consi<strong>de</strong>rable broa<strong>de</strong>r and<br />
more ambitious and goes w<strong>el</strong>l beyond the LPBD. Particularly, it establishes specific<br />
terms for the funding of renewable technologies, the <strong>de</strong>ployment and research.<br />
Currently, this initiative is being <strong>de</strong>bated in the Lowe Chamber of the Mexican<br />
Parliament (Cámara <strong>de</strong> Diputados).<br />
• There are fonds of about 55 million US$ whereas e.g. about 7 % are foreseen for<br />
biocombustibles, 15 % for R&D of renewable energies and 20 % for the evaluation of<br />
potentials for renewable energy sources in Mexico.<br />
5.2 Environmental aspects of biodies<strong>el</strong> production<br />
An expanding biomass usage should also always follow environmental criteria. Next to the<br />
impacts r<strong>el</strong>ated to environment through the biodies<strong>el</strong> usage its<strong>el</strong>f preserving diversity,<br />
conservation of ecosystems, avoiding negative impacts of fertilizer, avoiding water pollution<br />
and avoiding soil erosion are basic sustainability criteria. Environmental impacts of any<br />
product or system are analyzed by life cycle assessments (LCA´s).<br />
5.2.1 Life cycle assessment<br />
5.2.1.1 Basics of life cycle assessment<br />
As the expression implicates does a life cycle assessment consi<strong>de</strong>r the full life cycle of a<br />
product from resource extraction to waste disposal. Its goal is to give an all inclusive picture<br />
of the environmental impacts of products or systems, by taking into account all significant<br />
‘‘upstream’’ and ‘‘downstream’’ impacts. The assessment should inclu<strong>de</strong> the production or<br />
extraction of primary sources (energy crops or residues), the processing, transportation and<br />
distribution of the fu<strong>el</strong>s, building of conversion plants and other, the usage of the fu<strong>el</strong> in motor<br />
engines and waste disposal. Furthermore by-products should appropriat<strong>el</strong>y be consi<strong>de</strong>red<br />
along the life cycle of the production of the fu<strong>el</strong>. All impacts are <strong>de</strong>pen<strong>de</strong>nt on the global or<br />
regional system, where the production takes place or whose resources are used. Therefore a<br />
<strong>de</strong>tailed knowledge of the “surrounding” system is necessary to evaluate the environmental<br />
impacts of a product or system accordingly.<br />
61
<strong>Potenciales</strong> y <strong>Viabilidad</strong> <strong><strong>de</strong>l</strong> <strong>Uso</strong> <strong>de</strong> <strong>Bioetanol</strong> y <strong>Biodies<strong>el</strong></strong> <strong>para</strong> <strong>el</strong> Transporte en México (SENER-BID-GTZ)<br />
Task C: <strong>Biodies<strong>el</strong></strong> production and end-use in Mexico; Task D: Potentials in r<strong>el</strong>ation to sustainability criteria<br />
Task E: Rationales, drivers and barriers for biodies<strong>el</strong> market introduction; Task F: Synthesis and recommendations<br />
5.2.1.2 Methodology of life cycle assessment<br />
The method of how to un<strong>de</strong>rtake a LCA is laid out in two international norms, the<br />
DIN EN ISO 14040 and DIN EN ISO 14044. According to these norms a LCA is generally<br />
divi<strong>de</strong>d into four phases: goal and scope <strong>de</strong>finition, inventory analysis, impact assessment, and<br />
interpretation. Following figure (Fig. 5-5) gives an impression of the structure.<br />
Fig. 5-5 Structure of LCA (DIN EN ISO 14044)<br />
In the goal and scope <strong>de</strong>finition, the aim and the subject of an LCA study are <strong>de</strong>termined and<br />
a “functional unit” is <strong>de</strong>fined. An example of a functional unit is “the driven distance of 1 km<br />
of a passenger car” with, for instance, the aim to compare the environmental impacts of<br />
different sorts of automotive fu<strong>el</strong>s.<br />
In the inventory analysis, for each of the product systems consi<strong>de</strong>red data are gathered for all<br />
the r<strong>el</strong>evant processes involved in the life cycle. A product system can be consi<strong>de</strong>red as a<br />
combination of processes nee<strong>de</strong>d for the functioning of a product or service. The outcome of<br />
the inventory analysis is a list of all extractions of resources and emissions of substances<br />
caused by the functional unit for every product system consi<strong>de</strong>red, generally disregarding<br />
place and time of the extractions and r<strong>el</strong>eases. The complexity of the process for the provision<br />
of biodies<strong>el</strong> may be regar<strong>de</strong>d in Fig. 5-6. Different pre-chains, by-products auxiliary energy<br />
sources and other utilities have to be taken into account.<br />
62
<strong>Potenciales</strong> y <strong>Viabilidad</strong> <strong><strong>de</strong>l</strong> <strong>Uso</strong> <strong>de</strong> <strong>Bioetanol</strong> y <strong>Biodies<strong>el</strong></strong> <strong>para</strong> <strong>el</strong> Transporte en México (SENER-BID-GTZ)<br />
Task C: <strong>Biodies<strong>el</strong></strong> production and end-use in Mexico; Task D: Potentials in r<strong>el</strong>ation to sustainability criteria<br />
Task E: Rationales, drivers and barriers for biodies<strong>el</strong> market introduction; Task F: Synthesis and recommendations<br />
Fig. 5-6<br />
Process chain of biodies<strong>el</strong> provision<br />
The impact assessment aims to improve the un<strong>de</strong>rstanding of the inventory results. Firstly, it<br />
is <strong>de</strong>termined which extractions and emissions contribute to which impact categories. An<br />
impact category can be <strong>de</strong>fined as “a class representing environmental issues of concern into<br />
which results from the inventory analysis may be assigned”. The next step in the impact<br />
assessment is the characterization. The aim of the characterization is to aggregate the r<strong>el</strong>eases<br />
of pollutants and the extractions of resources of a product system for a number of pre<strong>de</strong>fined<br />
environmental impact categories. Categories can be global warming, <strong>de</strong>pletion of stratospheric<br />
ozone, human toxicological impacts, ecotoxicological impacts, photo-oxidant formation,<br />
acidification, eutrophication or others.<br />
The final phase in an LCA study is the interpretation of the results from the previous three<br />
steps, to draw conclusions and to formulate recommendations for <strong>de</strong>cision makers.<br />
5.2.1.3 Estimation of primary energy <strong>de</strong>mand and GHG emissions<br />
In or<strong>de</strong>r to realize a LCA for the provision of biodies<strong>el</strong> in Mexico a <strong>de</strong>tailed data base of<br />
Mexican conditions for the analysis of pre-/main chain for biodies<strong>el</strong> production and use is<br />
required. Since this data base could not be provi<strong>de</strong>d sufficiently un<strong>de</strong>r existing conditions an<br />
alternative approach has been followed. An assessment based on existing LCA studies in<br />
com<strong>para</strong>ble countries with com<strong>para</strong>ble products has been established. It inclu<strong>de</strong>s interim<br />
estimations of LCA results on biodies<strong>el</strong> provision for fossil primary energy <strong>de</strong>mand and GHG<br />
emissions for s<strong>el</strong>ected feedstock. The results, based on these estimations, are presented in the<br />
following figures. Basic assumptions of the LCA are that agricultural areas have not been<br />
gained by <strong>de</strong>forestation of rainforest areas. The results are presented r<strong>el</strong>ated to two functional<br />
unit. Firstly, the primary energy <strong>de</strong>mand (Fig. 5-7) and GHG emissions (Fig. 5-8) of different<br />
feedstocks and conversion processes for the production of biodies<strong>el</strong> are r<strong>el</strong>ated to one liter of<br />
63
<strong>Potenciales</strong> y <strong>Viabilidad</strong> <strong><strong>de</strong>l</strong> <strong>Uso</strong> <strong>de</strong> <strong>Bioetanol</strong> y <strong>Biodies<strong>el</strong></strong> <strong>para</strong> <strong>el</strong> Transporte en México (SENER-BID-GTZ)<br />
Task C: <strong>Biodies<strong>el</strong></strong> production and end-use in Mexico; Task D: Potentials in r<strong>el</strong>ation to sustainability criteria<br />
Task E: Rationales, drivers and barriers for biodies<strong>el</strong> market introduction; Task F: Synthesis and recommendations<br />
dies<strong>el</strong> equivalent (W<strong>el</strong>l-to-tank). In the second step the GHG emissions of different biodies<strong>el</strong><br />
provisions chains and use are r<strong>el</strong>ated to one kilometer of transporting distance of a passenger<br />
car (W<strong>el</strong>l to whe<strong>el</strong>).<br />
50<br />
45<br />
W<strong>el</strong>l-to-tank, Primary energy <strong>de</strong>mand [MJ / l DE]<br />
40<br />
35<br />
30<br />
25<br />
20<br />
15<br />
10<br />
5<br />
0<br />
-5<br />
-10<br />
-15<br />
-20<br />
Soy beans<br />
Mexico<br />
Rape seeds<br />
Mexico<br />
Palm oil Mexico<br />
Palm oil opt.<br />
Mexico<br />
Rape seeds<br />
Western<br />
Europe<br />
Feedstock<br />
Operation<br />
Other inputs<br />
Transport<br />
By-products<br />
Total<br />
Fig. 5-7<br />
Primary energy <strong>de</strong>mand of biodies<strong>el</strong> production an arable land – W<strong>el</strong>l to tank (estimated figures)<br />
W<strong>el</strong>l-to-tank analyses (see Fig. 5-7) shows that feedstock, operation and by-products have<br />
great influence on the energy balance of rape seeds and soy beans. The balance of palm oil is<br />
almost in<strong>de</strong>pen<strong>de</strong>nt on feedstock but more <strong>de</strong>pen<strong>de</strong>nt on operation efforts. Other inputs (e.g.<br />
methanol, chemicals) have more influence on the primary energy <strong>de</strong>mand compared to<br />
transportation efforts.<br />
An optimization of the palm oil process (using sh<strong>el</strong>l and fibers to provi<strong>de</strong> operation efforts)<br />
has great positive influence on the primary energy <strong>de</strong>mand.<br />
Surplus energy forwar<strong>de</strong>d to the grid results in credits as by-products, feed or fertilizer do.<br />
The result of w<strong>el</strong>l-to-tank analyses concerning GHG emissions are similar (see Fig. 5-8). The<br />
influence of feedstock, operation effort and by-products increase. Other inputs (e.g. methanol,<br />
chemicals) have only marginal effects as transportation efforts do.<br />
64
<strong>Potenciales</strong> y <strong>Viabilidad</strong> <strong><strong>de</strong>l</strong> <strong>Uso</strong> <strong>de</strong> <strong>Bioetanol</strong> y <strong>Biodies<strong>el</strong></strong> <strong>para</strong> <strong>el</strong> Transporte en México (SENER-BID-GTZ)<br />
Task C: <strong>Biodies<strong>el</strong></strong> production and end-use in Mexico; Task D: Potentials in r<strong>el</strong>ation to sustainability criteria<br />
Task E: Rationales, drivers and barriers for biodies<strong>el</strong> market introduction; Task F: Synthesis and recommendations<br />
W<strong>el</strong>l-to-tank GHG-emissions [kg CO 2-Equ. / l DE]<br />
4.00<br />
3.50<br />
3.00<br />
2.50<br />
2.00<br />
1.50<br />
1.00<br />
0.50<br />
0.00<br />
-0.50<br />
-1.00<br />
-1.50<br />
-2.00<br />
Soy beans<br />
Mexico<br />
Rape seeds<br />
Mexico<br />
Palm oil Mexico<br />
Palm oil opt.<br />
Mexico<br />
Rape seeds<br />
Western<br />
Europe<br />
Feedstock<br />
Operation<br />
Other inputs<br />
Transport<br />
By-products<br />
Total<br />
Fig. 5-8<br />
Greenhouse gas emissions of biodies<strong>el</strong> production an arable land – W<strong>el</strong>l to tank (estimated figures)<br />
Efforts of operating the plant have a reasonable share, but are main source, when producing<br />
biodies<strong>el</strong> from palm oil.<br />
The process using palm oil can be optimized by supplying the energy <strong>de</strong>mand of the plant<br />
from nut-sh<strong>el</strong>ls and fibers. Surplus energy may be forwar<strong>de</strong>d to the grid.<br />
For palm oil production local specific soil effects (e.g. <strong>de</strong>forestation) are most r<strong>el</strong>evant (carbon<br />
storage). Therefore the actual GHG-emissions can be significant higher than in the given<br />
example.<br />
In Fig. 5-9 GHG emissions of the provision and use of biodies<strong>el</strong> are presented. The emissions<br />
are r<strong>el</strong>ated to the transport distance of one kilometer transport distance of a passenger car. The<br />
use of biodies<strong>el</strong> in the transport sector may reduce GHG emission by about 100 g CO2-equ.<br />
per km or even more. The GHG emissions of fossil petrol and dies<strong>el</strong> are presented in this<br />
figure for comparison.<br />
65
<strong>Potenciales</strong> y <strong>Viabilidad</strong> <strong><strong>de</strong>l</strong> <strong>Uso</strong> <strong>de</strong> <strong>Bioetanol</strong> y <strong>Biodies<strong>el</strong></strong> <strong>para</strong> <strong>el</strong> Transporte en México (SENER-BID-GTZ)<br />
Task C: <strong>Biodies<strong>el</strong></strong> production and end-use in Mexico; Task D: Potentials in r<strong>el</strong>ation to sustainability criteria<br />
Task E: Rationales, drivers and barriers for biodies<strong>el</strong> market introduction; Task F: Synthesis and recommendations<br />
GHG emissions of passenger cars [kg CO 2-eq. / km].<br />
0.22<br />
0.20<br />
0.18<br />
0.16<br />
0.14<br />
0.12<br />
0.10<br />
0.08<br />
0.06<br />
0.04<br />
0.02<br />
0.00<br />
Emissions vehicle<br />
Emissions dies<strong>el</strong> prod.<br />
Emissions petrol prod.<br />
Emissions biofu<strong>el</strong> prod.<br />
average GHG mitigation<br />
of 100 g CO 2<br />
-eq./km<br />
?<br />
Soya beans<br />
Rape seeds<br />
Palm oil<br />
Palm oil opt.<br />
Jatropha<br />
Petrol<br />
Dies<strong>el</strong><br />
<strong>Biodies<strong>el</strong></strong><br />
Fossil fu<strong>el</strong>s<br />
Fig. 5-9<br />
Greenhouse gas emissions of biodies<strong>el</strong> production an arable land – W<strong>el</strong>l to whe<strong>el</strong> (estimated figures)<br />
Those reduction show their main effects at the place of use, here private cars, but similar<br />
effects are estimated for heavy duty transportation.<br />
5.2.2 <strong>Biodies<strong>el</strong></strong> emission<br />
The mayor part of combustion engine exhaust streams consists of the components nitrogen,<br />
carbon dioxi<strong>de</strong> and water. The maximum amounts of certain pollutants in exhaust gases in<br />
Mexico are regulated in the “Normatividad Mexicana <strong>de</strong> Calidad <strong><strong>de</strong>l</strong> Aire” (Mexican<br />
regulation for air quality). Currently there is no regulation for automotive engines that use<br />
biodies<strong>el</strong> pure or as blends.<br />
In the past an enormous amount of data on biodies<strong>el</strong> exhaust components has been measured.<br />
But the results differ wi<strong><strong>de</strong>l</strong>y. Exhaust gas emissions are strongly <strong>de</strong>pen<strong>de</strong>d on the used engine<br />
type, test cycle and fu<strong>el</strong> gra<strong>de</strong>. Furthermore emission values are greatly influenced by the<br />
application of an exhaust gas after treatment system. In general it can be attest that the r<strong>el</strong>ative<br />
carbon monoxi<strong>de</strong> (CO) and hydrocarbons (HC) emissions for biodies<strong>el</strong> fu<strong>el</strong>s are reduced in<br />
comparison the fossil dies<strong>el</strong> usage. These can mainly be attributed to the oxygen content of the<br />
fatty acid ethyl ester, which leads to more complete combustion. In case of unburnt or partially<br />
oxidized hydrocarbons, also cetane number is consi<strong>de</strong>red to low emissions. For biodies<strong>el</strong><br />
fu<strong>el</strong>led engines nitrogen oxi<strong>de</strong>s tend to slightly increase, while the reason for higher emissions<br />
66
<strong>Potenciales</strong> y <strong>Viabilidad</strong> <strong><strong>de</strong>l</strong> <strong>Uso</strong> <strong>de</strong> <strong>Bioetanol</strong> y <strong>Biodies<strong>el</strong></strong> <strong>para</strong> <strong>el</strong> Transporte en México (SENER-BID-GTZ)<br />
Task C: <strong>Biodies<strong>el</strong></strong> production and end-use in Mexico; Task D: Potentials in r<strong>el</strong>ation to sustainability criteria<br />
Task E: Rationales, drivers and barriers for biodies<strong>el</strong> market introduction; Task F: Synthesis and recommendations<br />
are not fully un<strong>de</strong>rstood yet. Oxidation catalytic converters can diminish emissions form 60 %<br />
up to 100 % (Mitt<strong>el</strong>bach 2004).<br />
In the following figure an overview of the emissions limits which are currently in force for<br />
European dies<strong>el</strong>-powered passenger cars and heavy duty vehicles, as w<strong>el</strong>l as the changes to<br />
these limits due to be enacted in the course of the EURO IV an V standards.<br />
Fig. 5-10 European emissions limits for regulated exhaust components of dies<strong>el</strong> powered passenger cars<br />
(Dies<strong>el</strong>net, 2006)<br />
To analyze the exhaust gas emission of biodies<strong>el</strong> measurements from an internal combustion<br />
engine have been conducted at Tecnológico <strong>de</strong> Monterrey (ITESM). For the test of B100 and<br />
B20 formulations virgin soy bean oil and waste vegetable oil (WVO) were used as feedstock.<br />
The measurements were performed according to Mexican norm NOM-047-ECOL-1999 with<br />
two alternative measurement protocols (i.e. based on no-load and on dynamic). Consi<strong>de</strong>ring<br />
only “pure” feedstocks (soy bean oil or waste vegetable oil with no coconut admixture) all<br />
formulation show also a very similar picture with reduction in CO emissions of 70 to 90%<br />
reductions in total hydrocarbons of 20% slight <strong>de</strong>crease in NO x emissions. Therefore the<br />
results according NO x display contrary to measurements reported in literature.<br />
5.2.3 Loss of biodiversity<br />
A market introduction of biodies<strong>el</strong> in Mexico based on national feedstock will result in<br />
expanding agricultural area for energy crop production whereby loss of biodiversity due to<br />
land use changes can result. This mainly affected by loss of migration corridors, habitats and<br />
buffer zones <strong>de</strong>pending on crop varieties, rotation schemes, pest management, fertilizer use,<br />
irrigation, fi<strong>el</strong>d size and harvest procedure. Mainly the transformation of extensive used areas<br />
to intensive mono-cropping is characterized by loss of biodiversity. Conversion of primary<br />
forest by means a forest that has never been logged, for example into palm oil plantations will<br />
lead to similar effects (Öko, 2006).<br />
67
<strong>Potenciales</strong> y <strong>Viabilidad</strong> <strong><strong>de</strong>l</strong> <strong>Uso</strong> <strong>de</strong> <strong>Bioetanol</strong> y <strong>Biodies<strong>el</strong></strong> <strong>para</strong> <strong>el</strong> Transporte en México (SENER-BID-GTZ)<br />
Task C: <strong>Biodies<strong>el</strong></strong> production and end-use in Mexico; Task D: Potentials in r<strong>el</strong>ation to sustainability criteria<br />
Task E: Rationales, drivers and barriers for biodies<strong>el</strong> market introduction; Task F: Synthesis and recommendations<br />
To minimize the loss of biodiversity a more extensive forms of cultivation, even if this result<br />
in an increased land requirement should be established. The mixing of the crop varieties and<br />
rotation schemes, and small-scale structuring of the cultivation cold further avoid a loss of<br />
biodiversity.<br />
5.2.4 Soil erosion and other soil <strong>de</strong>gradation<br />
Soil erosion is a natural process but in many places it is increased by human land use. Changes<br />
in the kind of vegetation are one of the main causes for soil erosion. That can be shifting<br />
cultivation for agricultural purposes which sometimes can incorporate with clearing of forest.<br />
Furthermore is soil erosion a huge problem in dry regions with limited and unstable soil cover<br />
that ero<strong>de</strong> due to heavy rains (EEA, 2006).<br />
To reduce the effects of soil erosion in connection with energy crop cultivation standards<br />
should be addressed to e.g. exclusion or restriction of intensive vegetable oil production,<br />
application of farming and harvesting practice which reduced erosion risks and maximum<br />
slope limits.<br />
5.2.5 Water use and water contamination<br />
In arid and semi-arid regions in Mexico an increase in irrigated land could lead to water<br />
scarcity and furthermore could cause to lowering of water tables as w<strong>el</strong>l as reduced water<br />
lev<strong>el</strong>s in rivers and lakes. Irrigation competes with all other water uses. Several studies<br />
(Lazcano, 2006; USDA, 2006) indicate that there is need for important inversions in Mexican<br />
irrigation systems. Irrigation corresponds to 84% of the total water consumption (agriculture,<br />
domestic and industrial sectors). To due water availability problems regulations for the<br />
controlled use of water are expected, therefore irrigated areas should be primarily <strong>de</strong>stined for<br />
food production (section 5.3.2). Therefore water scarcity in several regions in Mexico will<br />
lead to limitations in the potential area for energy crop cultivation. Among the s<strong>el</strong>ected oil<br />
crops especially sunflower, soy bean and rape seed have r<strong>el</strong>ativ<strong>el</strong>y high water needs. In this<br />
context Jatropha with com<strong>para</strong>tiv<strong>el</strong>y high oil yi<strong>el</strong>ds, may be grown successfully without<br />
irrigation in many semi-arid humid regions (300 to 700 mm/a). Palm oil as another high<br />
yi<strong>el</strong>ding crop, can only be cultivated in southern humid regions of Mexico, there should be no<br />
conflict concerning water us conflict.<br />
Next to water scarcity the use of agrochemicals (i.e. fertilizers, pestici<strong>de</strong>s) can result in water<br />
contamination. Moreover biomass processing facilities e.g. palm oil mills could cause<br />
significant discharges of organically contaminated waste water.<br />
Therefore, energy crop cultivation should always be combined with methods that avoid critical<br />
irrigation needs in semi-dry and dry regions and minimize the impacts of agrochemicals by<br />
timing and quantity of application. In addition the biomass processing units should be engaged<br />
by a strict corpus of legislation to dispose their waste water stream in an environmentally<br />
acceptable way (e.g. by further conversion in biogas plants).<br />
68
<strong>Potenciales</strong> y <strong>Viabilidad</strong> <strong><strong>de</strong>l</strong> <strong>Uso</strong> <strong>de</strong> <strong>Bioetanol</strong> y <strong>Biodies<strong>el</strong></strong> <strong>para</strong> <strong>el</strong> Transporte en México (SENER-BID-GTZ)<br />
Task C: <strong>Biodies<strong>el</strong></strong> production and end-use in Mexico; Task D: Potentials in r<strong>el</strong>ation to sustainability criteria<br />
Task E: Rationales, drivers and barriers for biodies<strong>el</strong> market introduction; Task F: Synthesis and recommendations<br />
5.3 Social aspects of biodies<strong>el</strong> production<br />
5.3.1 Employment aspects<br />
The estimated employment generation effect through biodies<strong>el</strong> is variable according to the<br />
agriculture business studied and technology s<strong>el</strong>ected. Consequently the following <strong>de</strong>scription<br />
of employment effects can be seen as a rough estimation. Soy cultivation is highly mechanized<br />
and need big areas what is resulting in low job generation (0.07 jobs per hectare). It favors the<br />
land concentration, but does not present any advantage for socialization of its use<br />
(FBDS, 2005). The cultivation of palma africana in the small-scale production is more labor<br />
intensiv<strong>el</strong>y than production in plantations, between 3,000 to 5,000 hectares. Small rural<br />
systems a worker is nee<strong>de</strong>d for 0.4 hectare while one worker in plantations is responsible for<br />
0.2 hectare (TAB, 2002). For employment effects of jatropha cultivation only rare experience<br />
could be gained in the past. It is estimated that, jatropha cultivation will generate 0.8 jobs per<br />
hectare during the first year and about 0.20 jobs per hectare in the subsequent years<br />
(Becker, 2005). If employment generation should be one main goal for biodies<strong>el</strong> market<br />
introduction certain mechanism supporting extensive forms of oil crop cultivation should be<br />
implemented. In this context the Brazilian biodies<strong>el</strong> supporting scheme, where family<br />
agricultural farms enjoy special tax incentives with up to 100 % mineral tax reduction.<br />
But just the evaluation of the employment effects does not reflect the quality of jobs.<br />
Therefore it is necessary that production efforts in small properties are accompanied by<br />
programs for workers qualification. Moreover it is necessary to introduce mo<strong>de</strong>rn techniques<br />
of handling and mechanization what in<strong>de</strong>ed is linked with reduction of the number of jobs<br />
created but with quality earnings for the remaining. Furthermore it should be aspired to<br />
complet<strong>el</strong>y inclu<strong>de</strong> the local people in the distribution of economic revenues from biodies<strong>el</strong><br />
production.<br />
5.3.2 Food security<br />
One main area of conflicts according biofu<strong>el</strong> production is the competition between land use<br />
for food, and for energy purposes. The use of vegetable oil in the food industry in Mexico as<br />
w<strong>el</strong>l as worldwi<strong>de</strong> has increased constantly over a long period of time mainly driven by<br />
<strong>de</strong>mographic and income growth. As incomes have grown the <strong>de</strong>mand for livestock products<br />
and vegetable oil has outstripped basic food grains. Next to the rapid growth in world<br />
vegetable oil consumption in the food sector the <strong>de</strong>mand of oils/fats for fu<strong>el</strong> use will sizeable<br />
growth as w<strong>el</strong>l (section 5.1.2). Some growth in annual oilseed production will come from the<br />
upward trend in yi<strong>el</strong>ds, but to supply the rapid growth the planted area had to go up. This will<br />
result in partly due to shifts other crops and partly by bringing new land in production.<br />
Institutional agricultural support in Mexico was greatly reduced, together with land ownership<br />
structure. In the last 10 years the imports of main basic grain and oil seeds have doubled. The<br />
food products export/import balance shows a <strong>de</strong>ficit of 2,440 million US$ (Macedo, 2006).<br />
For s<strong>el</strong>f-sufficient in food production more than 5 million hectares have to be brought into<br />
cultivation. In this respect huge institutional changes have to attempt to achieve structural shift<br />
in the Mexican agricultural structure towards oil crop extension. To minimize the direct<br />
69
<strong>Potenciales</strong> y <strong>Viabilidad</strong> <strong><strong>de</strong>l</strong> <strong>Uso</strong> <strong>de</strong> <strong>Bioetanol</strong> y <strong>Biodies<strong>el</strong></strong> <strong>para</strong> <strong>el</strong> Transporte en México (SENER-BID-GTZ)<br />
Task C: <strong>Biodies<strong>el</strong></strong> production and end-use in Mexico; Task D: Potentials in r<strong>el</strong>ation to sustainability criteria<br />
Task E: Rationales, drivers and barriers for biodies<strong>el</strong> market introduction; Task F: Synthesis and recommendations<br />
competition of energy crop and food production Jatropha seems be promising, at least if the<br />
non-edible form is cultivated, which is furthermore adaptable to a large variety of soils,<br />
altitu<strong>de</strong> and climates (even semi-arid areas). But it has to be in mind that because of r<strong>el</strong>ativ<strong>el</strong>y<br />
limited experiences on Jatropha cultivation in Mexico presentable cultivation achievements<br />
will take at least 5 years. And although jatropha has com<strong>para</strong>tiv<strong>el</strong>y low water <strong>de</strong>mand a<br />
sophisticated water management systems has to be provi<strong>de</strong>d in some regions.<br />
5.3.3 Land ownership<br />
Next to the questions of land use, the issue of land ownership structures has to be consi<strong>de</strong>red<br />
when launching a national biodies<strong>el</strong> program. The industrialized form of vegetable oil<br />
production like soy bean cultivation is often un<strong>de</strong>r control by large land owners, or<br />
(trans)national companies. In this respect this might conflict with the right to <strong>de</strong>mocratically<br />
regulate land access, what in turn can result in loss of food basis for the for rural population.<br />
Also loss of diversity is connected to land expropriation processes thru industrial-style<br />
cultivation. Rural communities and family businesses aiming a s<strong>el</strong>f sufficient supply of food<br />
and gaining income for local population is also connected to a manifold agriculture system,<br />
what lead to an increase concerning biodiversity.<br />
To avoid land ownership conflicts clearly <strong>de</strong>fined, and legally established tenure use rights<br />
should be documented. For avoidance of these conflicts again the Brazilian biodies<strong>el</strong> program<br />
should be mentioned, with a strong focus on small farmers’ oil crop production. If necessary a<br />
biodies<strong>el</strong> promotion scheme should be complementary to the national land use reform<br />
program, so that the lands <strong>de</strong>stined to this program have a rational use.<br />
5.3.4 Labor conditions and rights of children<br />
Labor conditions comprise aspects like wages, illegal overtime, children work or slavery. In<br />
the following, some problematic aspects of biomass farming are <strong>de</strong>scribed. Workers on<br />
plantations have increased in r<strong>el</strong>ation to the number of permanent workers, who are exposed to<br />
greater risks. Women often h<strong>el</strong>p their husbands: Neither they do enter a contract with the<br />
company nor do they receive remuneration. Domestic estate companies do not provi<strong>de</strong><br />
working tools and safety equipment to the workers. Permanent workers in foreign estates<br />
working tools are supplied with working tools; there is no safety training for workers in<br />
foreign companies. Some migrant workers have to pay for recruiting agencies and to sign<br />
contracts which are often in a foreign language. In many cases migrants sign whatever they are<br />
offered from the companies.<br />
As regards labor conditions it is important to protect workers against forced labor, unequal<br />
paying and illegal overtime. Minimum wages, rights of pregnant woman, <strong>el</strong>imination of child<br />
labor should inclu<strong>de</strong> in a social view on biomass production. Often children and women work<br />
on the fi<strong>el</strong>d. Especially for them it is necessary to reword standards for sustainable and also<br />
social biomass farming.<br />
70
<strong>Potenciales</strong> y <strong>Viabilidad</strong> <strong><strong>de</strong>l</strong> <strong>Uso</strong> <strong>de</strong> <strong>Bioetanol</strong> y <strong>Biodies<strong>el</strong></strong> <strong>para</strong> <strong>el</strong> Transporte en México (SENER-BID-GTZ)<br />
Task C: <strong>Biodies<strong>el</strong></strong> production and end-use in Mexico; Task D: Potentials in r<strong>el</strong>ation to sustainability criteria<br />
Task E: Rationales, drivers and barriers for biodies<strong>el</strong> market introduction; Task F: Synthesis and recommendations<br />
6 SCENARIO BUILDING AND ANALYSIS<br />
In the following chapter the potential <strong>de</strong>mand of biodies<strong>el</strong> assuming several scenarios of small<br />
and large scale plants will be <strong>de</strong>v<strong>el</strong>oped. The domestic biodies<strong>el</strong> consumption will be<br />
estimated on the basis of projections till 2014 for a 5 %, a 10 % and a 20 % blending of<br />
biodies<strong>el</strong> in petroleum dies<strong>el</strong> (B-5, B-10, B-20).<br />
The future biodies<strong>el</strong> <strong>de</strong>mand is first of all <strong>de</strong>pen<strong>de</strong>d on the <strong>de</strong>v<strong>el</strong>opment of the future<br />
petroleum dies<strong>el</strong> consumption. As <strong>de</strong>scribed in section 5.1.1 the <strong>de</strong>mand of petroleum dies<strong>el</strong>,<br />
is going to increase from 16.28 Mio t./a in 2005 up to 20.66 million t/a in 2014 (Fig. 5-1)<br />
(IMP, 2006). According to that prognosis, the increment of the balance offer-<strong>de</strong>mand between<br />
2004 and 2014 the <strong>de</strong>mand will increase in 2.5 % and 2.7 % respectiv<strong>el</strong>y. Based on the<br />
petroleum dies<strong>el</strong> <strong>de</strong>mands in 2014 a B-5 scenario would result in approx. 1 million t/a; B-10 in<br />
1.819 million t/a and for B-20 in 3.638 million t/a (Tab. 6-1).<br />
Tab. 6-1 Scenarios on potential biodies<strong>el</strong> <strong>de</strong>mand<br />
PEMEX dies<strong>el</strong><br />
consumption<br />
Current state<br />
2006<br />
Estimations for 2010 Estimations for 2014<br />
[1,000 t/a] 14,604 16,274 18,189<br />
Blending scenario B-5 B-10 B-20 B-5 B-10 B-20<br />
<strong>Biodies<strong>el</strong></strong> <strong>de</strong>mand [1,000 t/a] 814 1,627 3,255 909 1,819 3,638<br />
Next to the expected petroleum dies<strong>el</strong> consumption the future biodies<strong>el</strong> production is also<br />
strongly <strong>de</strong>pen<strong>de</strong>d on the availability of feedstock. The availability of feedstock is on the one<br />
hand si<strong>de</strong> <strong>de</strong>pen<strong>de</strong>d on the availability of cultivable land for oilseed production and as w<strong>el</strong>l as<br />
the amount of animal fats and recycled oils/fats available for biodies<strong>el</strong> production. Currently<br />
Mexico is highly <strong>de</strong>pen<strong>de</strong>nt on imports of oilseeds and products (approx. 90 % oilseeds and<br />
approx. 35 % fod<strong>de</strong>r) (section 5.1.2.2). As it is <strong>de</strong>scribed in section 2.2 there is a ten<strong>de</strong>ncy of<br />
biodies<strong>el</strong> production in Mexico based on animal and recycled oils/fats as feedstock. However<br />
it is difficult to make estimations about the available volumes for biodies<strong>el</strong> production.<br />
Because of the existing import <strong>de</strong>pen<strong>de</strong>ncy for animal and recycled oils/fats it is assumed that<br />
they are going to play a minor role as feedstock for a national biodies<strong>el</strong> implementation<br />
strategy in Mexico.<br />
Assuming the specific biodies<strong>el</strong> yi<strong>el</strong>ds per hectare for the different oilseeds (Tab. 3-2) and<br />
s<strong>el</strong>f-sufficient biodies<strong>el</strong> production based only on vegetable oil the following acreages are<br />
nee<strong>de</strong>d to achieve a the different blending assumed (Tab. 6-2). Un<strong>de</strong>r these circumstances it<br />
can be implicit that in the nearer future a s<strong>el</strong>f-sufficient supply of feedstock for biodies<strong>el</strong><br />
production in Mexico seems only be possible if intensive agricultural supporting schemes are<br />
going to be established. To estimate the required agricultural land that need take un<strong>de</strong>r<br />
cultivation three scenarios are going to be <strong>de</strong>fined.<br />
71
<strong>Potenciales</strong> y <strong>Viabilidad</strong> <strong><strong>de</strong>l</strong> <strong>Uso</strong> <strong>de</strong> <strong>Bioetanol</strong> y <strong>Biodies<strong>el</strong></strong> <strong>para</strong> <strong>el</strong> Transporte en México (SENER-BID-GTZ)<br />
Task C: <strong>Biodies<strong>el</strong></strong> production and end-use in Mexico; Task D: Potentials in r<strong>el</strong>ation to sustainability criteria<br />
Task E: Rationales, drivers and barriers for biodies<strong>el</strong> market introduction; Task F: Synthesis and recommendations<br />
Tab. 6-2 Required, current and potential agricultural area for different oil crops<br />
B-5 B-10 B-20<br />
Current<br />
growing area<br />
Potenzial area<br />
Palm oil 304,881 609,762 1,219,524 15,000 2,500,000<br />
Jatropha 1,415,717 2,831,434 5,666,868 n.s. 1,000,000<br />
Sunflower 1,554,095 3,108,190 6,216,381 900 n.s.<br />
Rape seeds 1,669,585 3,339,171 6,678,341 10,050 n.s.<br />
Safflower 2,526,830 5,053,659 10,107,319 224,000 n.s.<br />
Soy beans 3,576,032 7,152,065 14,304,129 110,000 > 1,000,000<br />
Consequently it can be state that even a market introduction of B-5 un<strong>de</strong>r the current situation<br />
seems to be rather difficult. Assuming a biodies<strong>el</strong> production based on soy beans the current<br />
acreage has to increase by 30-times, what can be appraised critical as far as the maximum ever<br />
farmed area was 350.000 hectare. Looking at the potential area suitable for an increase<br />
cultivation of the consi<strong>de</strong>red energy crops only based on palm oil a expan<strong>de</strong>d market<br />
introduction seems to be conceivable. This course has to inclu<strong>de</strong> clear frame conditions to<br />
ensure oil palm cultivation on agricultural or <strong>de</strong>gra<strong>de</strong>d land and to avoid any effects the rain<br />
forest. Jatropha, with its r<strong>el</strong>ativ<strong>el</strong>y high yi<strong>el</strong>ds, could also be consi<strong>de</strong>red as a potential energy<br />
crop, but the experiences for the cultivation of jatropha in Mexico are r<strong>el</strong>ativ<strong>el</strong>y small.<br />
Looking at the several scenarios for small or large scale biodies<strong>el</strong> production significant<br />
differences are obvious. Whereas for a B-5 blending up to 10 industrial plants with a capacity<br />
of 100.000 t/a have to installed, a scenario with small scale agricultural oil mill-biodies<strong>el</strong> plant<br />
with a capacity of 5,000 t/a would result in more than 140 plants. To optimize the supply of<br />
feedstocks as w<strong>el</strong>l as the removal of the biodies<strong>el</strong> and the by-products it’s essential to locate<br />
the industrial plants close to the refineries or the oil mill industries and thus close to the main<br />
oil crops growing areas. From the logistic point of view agricultural oil mill-biodies<strong>el</strong> plants<br />
are advantageous since the enables nearly i<strong>de</strong>al material flows.<br />
Fig. 6-1<br />
Schematic illustration of the potential location for industrial and agricultural transesterfication plants<br />
72
<strong>Potenciales</strong> y <strong>Viabilidad</strong> <strong><strong>de</strong>l</strong> <strong>Uso</strong> <strong>de</strong> <strong>Bioetanol</strong> y <strong>Biodies<strong>el</strong></strong> <strong>para</strong> <strong>el</strong> Transporte en México (SENER-BID-GTZ)<br />
Task C: <strong>Biodies<strong>el</strong></strong> production and end-use in Mexico; Task D: Potentials in r<strong>el</strong>ation to sustainability criteria<br />
Task E: Rationales, drivers and barriers for biodies<strong>el</strong> market introduction; Task F: Synthesis and recommendations<br />
The specific economic and environmental effects coupled to the different scenarios are<br />
summarized for 2010 and 2014 in Tab. 6-3. A rapid expansion of energy plantations for<br />
biodies<strong>el</strong> production requires an important volume of financing. Assuming average investment<br />
cost of 311 million MX$ per biodies<strong>el</strong> (100.000 t/a), at least 2.5 billion MX$ have to be<br />
invested for a B-5 market introduction. In Mexico, the <strong>de</strong>v<strong>el</strong>opment bank with the largest<br />
impact on agricultural and rural projects is FIRA (Fi<strong>de</strong>icomisos Instituidos con la<br />
Agricultura), a subsidiary of Mexico’s National Bank. Clearly, a w<strong>el</strong>l-<strong>de</strong>signed and operated<br />
special program at FIRA can have a significant impact on the <strong>de</strong>v<strong>el</strong>opment of biodies<strong>el</strong>.<br />
Following finical schemes seems to be promising for the promotion of biodies<strong>el</strong> in Mexico:<br />
• Preferential interest rates. FIRA provi<strong>de</strong>s a 6% discount on the interest rate of its<br />
loans to the financial intermediaries (as referenced to the inter-bank equilibrium<br />
interest rate, TIE) for small producer projects. It can be recommen<strong>de</strong>d that this<br />
discount should be exten<strong>de</strong>d to specially tagged biodies<strong>el</strong> projects which comply with<br />
sustainability criteria.<br />
• Direct marketing of credits and bundling. The effectiveness of FIRA loans can be<br />
potentially increased significantly if the loans are marketed directly by FIRA, thereby<br />
avoiding costly overheads. <strong>Biodies<strong>el</strong></strong> projects may access FIRA’s TIE−6% loans<br />
directly during a start-up phase of 5 to 10 years, without utilizing financial<br />
intermediaries. This incentive should be limited to smaller projects in or<strong>de</strong>r to<br />
stimulate <strong>de</strong>v<strong>el</strong>opment in rural areas. Direct marketing to smaller projects may require<br />
additional staff at FIRA (as a part of a national subsidy set), but should foremost<br />
concentrate on the bundling of loans, achievable, e.g. through lending to agricultural<br />
cooperatives.<br />
• Technical assistance. FIRA already operates technology and training centers. Similar<br />
centers <strong>de</strong>dicated to the local promotion of biodies<strong>el</strong> or enhancing existing centers in<br />
certain regions with new facilities and staff can be supportive for a biodies<strong>el</strong> market<br />
implementation.<br />
It is expected that the production of dies<strong>el</strong> till 2014 will not only cover the country <strong>de</strong>mands<br />
but also will have surpluses for exportation (approx. 0.2 to 0.6 million t/a). Assuming an<br />
export price for dies<strong>el</strong> of 4.3 MX$ a B-5 blending could contribute positive to export revenues<br />
for PEMEX dies<strong>el</strong> (approx. 4 million MX$/a). Also the export of biodies<strong>el</strong> to the growing<br />
markets in Europe and the U.S. America could be a possible scenario. Although this<br />
alternative is certainly <strong>de</strong>sirable, the focus of the national biodies<strong>el</strong> program in Mexico should<br />
be on the national utilization of the fu<strong>el</strong>.<br />
<strong>Biodies<strong>el</strong></strong> implementation is potentially w<strong>el</strong>l suited to provi<strong>de</strong> sinks for CO 2 if plantations<br />
replace idle or <strong>de</strong>gra<strong>de</strong>d lands. Based on the estimated LCA results of average GHG<br />
mitigation of 100 g CO2-Eq. /km for biodies<strong>el</strong> use (cf. section 5.2.1) a total mitigation potential of<br />
at least 1,680 t CO2-Eq. /a in 2010 to about 7,500 t CO2-Eq. /a in 2014 can be assumed. The therewith<br />
associated mitigation costs of approx. 2,000 MX$/ t CO2-Eq are calculated based on the average<br />
biodies<strong>el</strong> production costs compared to the PEMEX dies<strong>el</strong> costs as w<strong>el</strong>l as the average<br />
mitigation potential. In total the annual costs for CO 2 mitigation are in the range of<br />
3.3 million MX$ in 2010 to 15 million MX$ in 2014 theoretically. If the marketing of GHG<br />
certificates is to be part of the national biodies<strong>el</strong> promotion campaign, it is important to<br />
streamline the accreditation process for biodies<strong>el</strong> projects and keep the transaction costs low.<br />
73
<strong>Potenciales</strong> y <strong>Viabilidad</strong> <strong><strong>de</strong>l</strong> <strong>Uso</strong> <strong>de</strong> <strong>Bioetanol</strong> y <strong>Biodies<strong>el</strong></strong> <strong>para</strong> <strong>el</strong> Transporte en México (SENER-BID-GTZ)<br />
Task C: <strong>Biodies<strong>el</strong></strong> production and end-use in Mexico; Task D: Potentials in r<strong>el</strong>ation to sustainability criteria<br />
Task E: Rationales, drivers and barriers for biodies<strong>el</strong> market introduction; Task F: Synthesis and recommendations<br />
Tab. 6-3 Economic and ecological effects<br />
Estimations for 2010 Estimations for 2014<br />
Blending scenario B-5 B-10 B-20 B-5 B-10 B-20<br />
<strong>Biodies<strong>el</strong></strong> <strong>de</strong>mand [1,000 t/a] 814 1,627 3,255 909 1,819 3,638<br />
Required capital<br />
investment<br />
[million MX$]<br />
Type agricultural<br />
(á 16 million MX$)<br />
Type industrial annex<br />
(á 311 million MX$)<br />
Add. revenues for PEMEX<br />
dies<strong>el</strong> export<br />
CO 2 mitigation potential<br />
(á 100 g CO2-Eq ./km)<br />
2,604 5,208 10,415 2,910 5,821 11,641<br />
2,531 5,061 10,123 2,828 5,657 11,314<br />
[billion X$] 4.0 8.0 15.9 4.4 8.9 17.8<br />
[t CO2 -Eq./a] 1,677 3,354 6,709 1,874 3,749 7,498<br />
CO 2 mitigation costs<br />
(á 2,000 MX$/t CO2-Eq )<br />
[million<br />
MX$/a]<br />
3.3 6.7 13.4 3.7 7.5 15<br />
Near term a regional market implementation of biodies<strong>el</strong> based on domestic feedstock -<br />
vegetable oils as w<strong>el</strong>l as for animal and recycled oils/fats - is conceivably. Mid term a market<br />
introduction of B-5 in Mexico seems to be feasibility in particular if an extensive agricultural<br />
supporting scheme is going to be established. This situation is not substantially different from<br />
that in other countries, but is aggravated by the fact that fossil <strong>de</strong>rived dies<strong>el</strong> fu<strong>el</strong> is still fairly<br />
inexpensive in Mexico. Moreover, dies<strong>el</strong> fu<strong>el</strong> is subsidized in special sectors, such as the<br />
agriculture and fishing sectors where the fu<strong>el</strong> tax (IEPS) is being reimbursed to the final user.<br />
Two general premises are consi<strong>de</strong>red indispensable for a successful national biodies<strong>el</strong><br />
program: (a) A positive ecological balance and (b) a stimulus for the national economy. As to<br />
the first point, the net effect of a biodies<strong>el</strong> program will <strong>de</strong>pend to a great extent on the way<br />
the required massive plantations for vegetable oil production are established and maintained.<br />
Specifically, it has to be avoi<strong>de</strong>d categorically that native forests be clear cut to make room for<br />
energy plantations, particularly oil palm plantations. Even though it may not be possible to<br />
complet<strong>el</strong>y avoid clear cutting for energy plantations (due to administrative inefficiencies and<br />
law enforcement problems), it least it should be difficult for such plantations to access<br />
subsidies and other national financial incentives. As to the stimulation of the national<br />
economy, it should be clear that a stronger <strong>de</strong>v<strong>el</strong>opment of agriculture and rural areas is<br />
essential due to a host of issues of national security. A w<strong>el</strong>l-<strong>de</strong>signed and conducted biodies<strong>el</strong><br />
program may contribute to the solutions of these problems.<br />
For a further broad biodies<strong>el</strong> <strong>de</strong>v<strong>el</strong>opment an expansion of energy crop production in the<br />
various edapha-climatic regions has to be initiated. Energy crop production, oriented towards<br />
diversity, should be supported by broad spectrum of <strong>de</strong>mand on the one hand si<strong>de</strong>, and on the<br />
other hand by establishment of various cultivation systems. To improve the energy crop<br />
productivity agricultural research innovations should be emerged as w<strong>el</strong>l – especially towards<br />
broad variety of the different species. The emphasis of a national biodies<strong>el</strong> program should be<br />
on the creation of value in Mexico and particularly in its agricultural regions. Therefore, it is<br />
74
<strong>Potenciales</strong> y <strong>Viabilidad</strong> <strong><strong>de</strong>l</strong> <strong>Uso</strong> <strong>de</strong> <strong>Bioetanol</strong> y <strong>Biodies<strong>el</strong></strong> <strong>para</strong> <strong>el</strong> Transporte en México (SENER-BID-GTZ)<br />
Task C: <strong>Biodies<strong>el</strong></strong> production and end-use in Mexico; Task D: Potentials in r<strong>el</strong>ation to sustainability criteria<br />
Task E: Rationales, drivers and barriers for biodies<strong>el</strong> market introduction; Task F: Synthesis and recommendations<br />
recommen<strong>de</strong>d that biodies<strong>el</strong> from Mexican oil crop cultivation be produced with locally<br />
<strong>de</strong>signed and built technology. Technology transfer from international partners should be<br />
encouraged, but direct import of producing facilities should be avoi<strong>de</strong>d.<br />
The implementation of a biodies<strong>el</strong> scenario <strong>de</strong>mands the establishment of oil seed production<br />
capacities and biodies<strong>el</strong> production plants as w<strong>el</strong>l:<br />
• With regard to the oil seed production perennial crops (palm, jatropha) seems to be<br />
promising for Mexico, but those crops need more time for establishment<br />
• For the different crops specific solution for specific regions need to be <strong>el</strong>aborated in<br />
<strong>de</strong>tail. This is much more important than for the bioethanol resources (Best, 2006)<br />
• The conversion of perennial crops to biodies<strong>el</strong> is not mature yet; additional technical<br />
<strong>de</strong>v<strong>el</strong>opment is nee<strong>de</strong>d to<br />
• Ad<strong>de</strong>d value in rural regions can be gained by training the farmers and encourage them<br />
to build new co-operatives. Therefore additional information (and time) is necessary as<br />
w<strong>el</strong>l.<br />
It can be estimated, that the establishment of a domestic biodies<strong>el</strong> production in Mexico will<br />
need 5 years at least, even if all activities are <strong>de</strong>v<strong>el</strong>oped in <strong>para</strong>ll<strong>el</strong>. As strategic goal for a<br />
national biodies<strong>el</strong> implementation a substitution of 2.00 % of the mineral dies<strong>el</strong> <strong>de</strong>mand in<br />
2014 seems to be realistic. Based on this, a possible time frame for a market <strong>de</strong>v<strong>el</strong>opment can<br />
be drawn as follows (Fig. 6-2). Starting from setting the legal framework conditions in 2007<br />
(e.g. realistic targets in form of a biofu<strong>el</strong> directive, quality standards and subsidies for the<br />
agricultural sector) over the <strong>de</strong>v<strong>el</strong>opment of a domestic biodies<strong>el</strong> feedstock production<br />
industry on <strong>de</strong>fined arable land (i.e. including R&D and training activities) and building of a<br />
basic biodies<strong>el</strong> infrastructure in the time horizon of 2008 to 2010 to a biodies<strong>el</strong> production to<br />
meet the <strong>de</strong>mand of 2 % in 2014. In the meanwhile, biodies<strong>el</strong> production based on imported<br />
oil crops products as w<strong>el</strong>l as on animal fats and recycled oils and fats will be carried out.<br />
75
<strong>Potenciales</strong> y <strong>Viabilidad</strong> <strong><strong>de</strong>l</strong> <strong>Uso</strong> <strong>de</strong> <strong>Bioetanol</strong> y <strong>Biodies<strong>el</strong></strong> <strong>para</strong> <strong>el</strong> Transporte en México (SENER-BID-GTZ)<br />
Task C: <strong>Biodies<strong>el</strong></strong> production and end-use in Mexico; Task D: Potentials in r<strong>el</strong>ation to sustainability criteria<br />
Task E: Rationales, drivers and barriers for biodies<strong>el</strong> market introduction; Task F: Synthesis and recommendations<br />
3<br />
Mineral dies<strong>el</strong> substitution in %<br />
2<br />
1<br />
0<br />
2006 2007 2008 2009 2010 2011 2012 2013 2014<br />
Fig. 6-2<br />
<strong>Biodies<strong>el</strong></strong> implementation strategy for Mexico<br />
76
<strong>Potenciales</strong> y <strong>Viabilidad</strong> <strong><strong>de</strong>l</strong> <strong>Uso</strong> <strong>de</strong> <strong>Bioetanol</strong> y <strong>Biodies<strong>el</strong></strong> <strong>para</strong> <strong>el</strong> Transporte en México (SENER-BID-GTZ)<br />
Task C: <strong>Biodies<strong>el</strong></strong> production and end-use in Mexico; Task D: Potentials in r<strong>el</strong>ation to sustainability criteria<br />
Task E: Rationales, drivers and barriers for biodies<strong>el</strong> market introduction; Task F: Synthesis and recommendations<br />
7 RATIONALES, DRIVERS AND BARRIERS FOR<br />
BIODIESEL MARKET INDRODUCTION<br />
With emphasis to, e. g, economic, energy, environmental, social, legal aspects and their<br />
inter<strong>de</strong>pen<strong>de</strong>ncies for the market implementation of biodies<strong>el</strong> specific barriers (that have to be<br />
overcome) and drivers (that have to be further encouraged) will be i<strong>de</strong>ntified and discussed.<br />
Furthermore, opportunities and threats will be analysed. These parts of a so called SWOT<br />
analysis (strength, weakness, opportunities and threats) will also be used to sharpen the view<br />
on required instruments for the successful implementation of biodies<strong>el</strong> in the forthcoming<br />
years.<br />
The results of this task can be summarised in form of a matrix for the biodies<strong>el</strong> production and<br />
use for Mexico. To analyse the strength, weakness, opportunities and threats at different lev<strong>el</strong>s<br />
of production all aspects are group in Feedstock utilisation, Production and End-use.<br />
Strenght F P E<br />
• Great variety of feedstocks for biodies<strong>el</strong> production (i.e.<br />
vegetable oils, animal fats as w<strong>el</strong>l as recycled oils and fats)<br />
• Feedstock cultivation and processing facilities may<br />
represent a new significant source of jobs in rural<br />
environments, strengthening rural economies and mitigating<br />
migration<br />
• Com<strong>para</strong>tiv<strong>el</strong>y low investment costs (e.g. when compared to<br />
bioethanol) and low personn<strong>el</strong> costs<br />
• Some feedstocks may be grown successfully without<br />
irrigation in many semi-arid regions (e.g. jatropha)<br />
• Large areas of currently or sub utilized land can be used for<br />
biodies<strong>el</strong> feedstock production, thereby increasing<br />
vegetation cover and mitigating erosion<br />
• Residues from biodies<strong>el</strong> processing can be used for energy<br />
production e.g. biogas or as organic fertilizer (i.e.<br />
agricultural cycle)<br />
• Conflicts with food production may be avoi<strong>de</strong>d or<br />
minimized if flexible production (refined edible vegetable<br />
oil vs. biodies<strong>el</strong>) is implemented<br />
77
<strong>Potenciales</strong> y <strong>Viabilidad</strong> <strong><strong>de</strong>l</strong> <strong>Uso</strong> <strong>de</strong> <strong>Bioetanol</strong> y <strong>Biodies<strong>el</strong></strong> <strong>para</strong> <strong>el</strong> Transporte en México (SENER-BID-GTZ)<br />
Task C: <strong>Biodies<strong>el</strong></strong> production and end-use in Mexico; Task D: Potentials in r<strong>el</strong>ation to sustainability criteria<br />
Task E: Rationales, drivers and barriers for biodies<strong>el</strong> market introduction; Task F: Synthesis and recommendations<br />
Weaknesses F P E<br />
• Early stage of framework <strong>de</strong>v<strong>el</strong>opment and specific<br />
regulations to promote renewables and biofu<strong>el</strong>s.<br />
• High import <strong>de</strong>pen<strong>de</strong>ncy on oilseeds and products; future<br />
global vegetable oil prices will be higher driven by stronger<br />
<strong>de</strong>mand; but protein prices lower.<br />
• Ecological and economic advantageousness <strong>de</strong>pends on the<br />
usage of the by-product.<br />
• Com<strong>para</strong>tiv<strong>el</strong>y high production cost in comparison to<br />
current PEMEX dies<strong>el</strong> prices when no specific incentives<br />
are taken into account.<br />
• For some oil crops (e.g. palma african, soy beans) intensive<br />
usage of agricultural land including irrigation and<br />
fertilization; aspects of sustainability.<br />
• Lower oil yi<strong>el</strong>ds per hectare (lack of irrigation) in the global<br />
context; however, high yi<strong>el</strong>ds generally require irrigation,<br />
which may limit the dissemination of energy plantations<br />
and/or create new water utilization conflicts.<br />
• For certain feedstocks (i.e. jatropha) the agricultural<br />
<strong>de</strong>mands and technical conversion effort is not very w<strong>el</strong>l<br />
known yet.<br />
• Currently Mexico does not have a national standard for<br />
biodies<strong>el</strong>.<br />
• Even though sufficient scientific and technological expertise<br />
for biodies<strong>el</strong> production exists in Mexico, there is little<br />
coordinated effort.<br />
78
<strong>Potenciales</strong> y <strong>Viabilidad</strong> <strong><strong>de</strong>l</strong> <strong>Uso</strong> <strong>de</strong> <strong>Bioetanol</strong> y <strong>Biodies<strong>el</strong></strong> <strong>para</strong> <strong>el</strong> Transporte en México (SENER-BID-GTZ)<br />
Task C: <strong>Biodies<strong>el</strong></strong> production and end-use in Mexico; Task D: Potentials in r<strong>el</strong>ation to sustainability criteria<br />
Task E: Rationales, drivers and barriers for biodies<strong>el</strong> market introduction; Task F: Synthesis and recommendations<br />
Opportunities F P E<br />
• Protection of finite non-renewable resources.<br />
• Generation of a great number of jobs along the whole<br />
biodies<strong>el</strong> supply chain (i.e. feedstock cultivation, provision,<br />
biodies<strong>el</strong> processing and use).<br />
• Dev<strong>el</strong>opment opportunities for agricultural regions<br />
contribution to regional value ad<strong>de</strong>d).<br />
• Reclaiming of <strong>de</strong>gra<strong>de</strong>d land with suitable low- or nonirrigation<br />
plantations (e.g. Jatropha); first major initiatives<br />
by the Government of Michoacán.<br />
• Availability of suitable climates in Mexico with potentials<br />
for growing high-yi<strong>el</strong>d crops like palm africana or coconut<br />
palm.<br />
• Implementation of biodies<strong>el</strong> (e.g. as B100 and blend) into<br />
existing fu<strong>el</strong> distribution infrastructure and fleets of e.g.<br />
heavy duty machinery, trucks and buses without major<br />
modifications of transport technology.<br />
• Noticeable lower GHG-emission for all biodies<strong>el</strong> compared<br />
to PEMEX dies<strong>el</strong>.<br />
• Improved urban air quality, contributing to improved public<br />
health.<br />
79
<strong>Potenciales</strong> y <strong>Viabilidad</strong> <strong><strong>de</strong>l</strong> <strong>Uso</strong> <strong>de</strong> <strong>Bioetanol</strong> y <strong>Biodies<strong>el</strong></strong> <strong>para</strong> <strong>el</strong> Transporte en México (SENER-BID-GTZ)<br />
Task C: <strong>Biodies<strong>el</strong></strong> production and end-use in Mexico; Task D: Potentials in r<strong>el</strong>ation to sustainability criteria<br />
Task E: Rationales, drivers and barriers for biodies<strong>el</strong> market introduction; Task F: Synthesis and recommendations<br />
Threats F P E<br />
• A key barrier to uptake of biofu<strong>el</strong>s into the market, cited by<br />
both oil companies and biofu<strong>el</strong> producers, is the high lev<strong>el</strong><br />
of commercial risk associated with market entry.<br />
• Strong <strong>de</strong>pen<strong>de</strong>ncy on global vegetable oil market. A<br />
stronger <strong>de</strong>mand for oilseeds may lead to a shortage of<br />
supply for vegetable oil producers (a concern put forward by<br />
industry representatives).<br />
• International competition; if no protection measures are<br />
introduced for domestic producers, Mexico may end up<br />
importing all its biodies<strong>el</strong> needs.<br />
• Quality control not implement yet, which could result in<br />
quality fluctuations as w<strong>el</strong>l as in loss of acceptance on the<br />
end user si<strong>de</strong>.<br />
• Promotion of acceptance of biodies<strong>el</strong> production and use in<br />
the population.<br />
• Unregulated / unsupervised introduction of energy<br />
plantations may lead to unsustainable situations, e.g.<br />
<strong>de</strong>forestation in tropical regions to make room for palm oil<br />
plantations (as e.g. in Malaysia).<br />
• Non-economic use of by-products (e.g. for energy purposes,<br />
fod<strong>de</strong>r) may cause a residue or emission problem.<br />
• Implementation of oil seed production that is harmonized<br />
with the WTO regulations.<br />
Recapitulating the feedstock issues are the key question of the success of the market<br />
implementation of biodies<strong>el</strong> in Mexico. Moreover, in terms of production and end-use<br />
activities should be focused on the distribution of information to stakehol<strong>de</strong>rs along the whole<br />
biodies<strong>el</strong> supply chain.<br />
80
<strong>Potenciales</strong> y <strong>Viabilidad</strong> <strong><strong>de</strong>l</strong> <strong>Uso</strong> <strong>de</strong> <strong>Bioetanol</strong> y <strong>Biodies<strong>el</strong></strong> <strong>para</strong> <strong>el</strong> Transporte en México (SENER-BID-GTZ)<br />
Task C: <strong>Biodies<strong>el</strong></strong> production and end-use in Mexico; Task D: Potentials in r<strong>el</strong>ation to sustainability criteria<br />
Task E: Rationales, drivers and barriers for biodies<strong>el</strong> market introduction; Task F: Synthesis and recommendations<br />
8 CONCLUSIONS AND RECOMMENDATIONS<br />
Based on the shown results of the different aspects associated to the production and<br />
implementation of biodies<strong>el</strong> into the Mexican energy system the following conclusions and<br />
recommendations are drawn with regard to technical, economic and environmental<br />
perspectives as w<strong>el</strong>l as the role of the seed crushing and oil refining industry, agricultural<br />
perspectives and research and technology <strong>de</strong>v<strong>el</strong>opment.<br />
Technical perspectives<br />
• <strong>Biodies<strong>el</strong></strong> production based on rape seeds and soy beans is technical matured worldwi<strong>de</strong>.<br />
Apart from few <strong>para</strong>meters jatropha-biodies<strong>el</strong> is technical conceivable; Palm-biodies<strong>el</strong><br />
does not allow the esters to meet cold flow requirements without winterization in<br />
temperate region.<br />
• It is necessary to <strong>de</strong>v<strong>el</strong>op a national standard for biodies<strong>el</strong> (B-100) and blends of biodies<strong>el</strong><br />
and conventional (fossil) dies<strong>el</strong> fu<strong>el</strong> (e.g. B-5). This standard may be based on the US or<br />
European experiences but should specifically address the following points<br />
• The cold flow properties in a subtropical/tropical country like Mexico are much less<br />
critical than in the U.S. or Europe; therefore much less stringent requirements may be<br />
written into the co<strong>de</strong>. This may allow to use higher fractions of palm oil- or tallowbased<br />
biodies<strong>el</strong> in biodies<strong>el</strong>/dies<strong>el</strong> blends.<br />
• To account for the different climate zones in Mexico a zonified standard may be<br />
<strong>de</strong>v<strong>el</strong>oped.<br />
• The standard has to be <strong>de</strong>v<strong>el</strong>oped in close consultation with the national automotive<br />
industry.<br />
• Additionally specific standards and tests for blends should be <strong>de</strong>v<strong>el</strong>oped to mitigate<br />
the utilization of inappropriate residues as part of the fu<strong>el</strong> formulation (straight<br />
vegetable oil, residues from petroleum refining etc.).<br />
Economic perspectives<br />
• Currently, as in most countries, biodies<strong>el</strong> production from virgin vegetable oils is not<br />
economically viable without suitable incentives from the government (e.g. tax reduction).<br />
The key reasons are the strong <strong>de</strong>pen<strong>de</strong>ncy of the biodies<strong>el</strong> cost on feedstock prices<br />
(which are essentially at international lev<strong>el</strong>s in Mexico) and the very low price of fossil<br />
dies<strong>el</strong> fu<strong>el</strong>. Even though currently biodies<strong>el</strong> is not taxed as a fu<strong>el</strong>, this rather coinci<strong>de</strong>ntal<br />
situation (arisen in a strongly oil-<strong>de</strong>pen<strong>de</strong>nt country) should be turned into a permanent or<br />
time-limited tax exemption guaranteed by an explicit law. Without such proper legal<br />
previsions there may be no security for potential investors.<br />
• The feasibility of the biodies<strong>el</strong> production also <strong>de</strong>pends on the revenues of by-products,<br />
which are forwar<strong>de</strong>d to the fod<strong>de</strong>r market. One effect of the international biodies<strong>el</strong><br />
activities is a global surplus of those by-products (and very low prices of fod<strong>de</strong>r). With<br />
regard to this feedstock with lower by-product rates seams to be more promising.<br />
81
<strong>Potenciales</strong> y <strong>Viabilidad</strong> <strong><strong>de</strong>l</strong> <strong>Uso</strong> <strong>de</strong> <strong>Bioetanol</strong> y <strong>Biodies<strong>el</strong></strong> <strong>para</strong> <strong>el</strong> Transporte en México (SENER-BID-GTZ)<br />
Task C: <strong>Biodies<strong>el</strong></strong> production and end-use in Mexico; Task D: Potentials in r<strong>el</strong>ation to sustainability criteria<br />
Task E: Rationales, drivers and barriers for biodies<strong>el</strong> market introduction; Task F: Synthesis and recommendations<br />
Environmental perspectives<br />
• The production of biodies<strong>el</strong> can contribute to the GHG-emission reduction significantly.<br />
A general reduction in the range of 100g CO 2 -equivalent per km combined with an<br />
average CO 2 reduction costs of 2.000 MX$ per ton CO 2 -equivalent can be expected.<br />
• <strong>Biodies<strong>el</strong></strong> from palm oil can contribute to the GHG-emission reduction significantly. But,<br />
if the cultivation of oil palms lead to significant carbon losses of the soil this might be<br />
converted into negative. So, to ensure the effects on climate gas reduction, certain criteria<br />
for the production of palm oil should be <strong>de</strong>v<strong>el</strong>oped and applied.<br />
Agriculture perspectives<br />
The bottleneck for a biodies<strong>el</strong> introduction in Mexico is the agricultural sector. Therefore an<br />
extensive agricultural supporting scheme has to be established to achieve a domestic supply of<br />
feedstock. If so, the <strong>de</strong>v<strong>el</strong>opment of a biodies<strong>el</strong> sector can be a significant <strong>de</strong>v<strong>el</strong>opment<br />
opportunity for Mexico and its rural sector. The stimuli for a more dynamic rural economy<br />
should inclu<strong>de</strong> the following aspects:<br />
• All activities according the support of oil seed production as w<strong>el</strong>l as biodies<strong>el</strong> production<br />
have to be initiated in respect a sustainable <strong>de</strong>v<strong>el</strong>opment. In this context <strong>de</strong>forestation<br />
aspects which could be connected with the industrial palm oil production should be<br />
consi<strong>de</strong>red. Therefore <strong>de</strong>fined land use criteria’s should be part of a national oil crop<br />
supporting mechanism. To support small scale oil crop cultivations, which in particular<br />
increase the rural agricultural value ad<strong>de</strong>d and support the biodiversity a specific<br />
promotion scheme should be initiated (e.g. Brazilian biodies<strong>el</strong> program).<br />
• For some oil crops a better un<strong>de</strong>rstanding of the cultivation is nee<strong>de</strong>d (palma africana,<br />
jatropha). The knowledge out of those research activities need to be transferred thru<br />
educationally programs to the rural population.<br />
• The formation of specialized cooperatives, allowing for synergies through the joint<br />
utilization of machinery, access to financing and technical assistance should be<br />
encouraged.<br />
• The financing agencies, especially FIRA, should be encouraged to create special programs<br />
tagged for the biodies<strong>el</strong> or biofu<strong>el</strong> production at preferential interest rates. As an<br />
additional feature, it is suggested that these credits be marketed directly by FIRA and/or<br />
its consultants, avoiding costly overheads at the commercial banks generally used as<br />
intermediaries. Training activities are nee<strong>de</strong>d too.<br />
• The integration of oilseed production and seed crushing/oil refining/biodies<strong>el</strong> production<br />
(wherever economically viable) should be encouraged to create a stronger retention of<br />
ad<strong>de</strong>d value in rural areas.<br />
• A <strong>de</strong>tail register of the potential area for oil crop production un<strong>de</strong>r consi<strong>de</strong>ration of all<br />
sustainability criteria’s should be accomplished to <strong>de</strong>fine w<strong>el</strong>l-balanced goals for a<br />
biodies<strong>el</strong> extension. Only plots of land contained in this register should qualify for fe<strong>de</strong>ral<br />
or state incentives. The <strong>el</strong>aboration of this census should be overseen by an interministerial<br />
commission formed by members from the Ministries of the Environment<br />
(SEMARNAT), Agriculture (SAGARPA) and Energy (SENER).<br />
82
<strong>Potenciales</strong> y <strong>Viabilidad</strong> <strong><strong>de</strong>l</strong> <strong>Uso</strong> <strong>de</strong> <strong>Bioetanol</strong> y <strong>Biodies<strong>el</strong></strong> <strong>para</strong> <strong>el</strong> Transporte en México (SENER-BID-GTZ)<br />
Task C: <strong>Biodies<strong>el</strong></strong> production and end-use in Mexico; Task D: Potentials in r<strong>el</strong>ation to sustainability criteria<br />
Task E: Rationales, drivers and barriers for biodies<strong>el</strong> market introduction; Task F: Synthesis and recommendations<br />
The role of the seed crushing and oil refining industry<br />
Mexico currently imports most of its oilseeds. Due to the latter, a tax exemption for biodies<strong>el</strong><br />
alone is not a suitable measure to promote biodies<strong>el</strong> production and utilization. Therefore, an<br />
increased oilseed production (in response to, e.g., government incentives/programs) should be<br />
stimulated in general, consi<strong>de</strong>ring the following effects:<br />
• The national seed crushing and refining industry will be willing to provi<strong>de</strong> their<br />
(necessary) collaboration only if their concerns regarding their core business are properly<br />
addressed. Vegetable oil producers are natural allies and collaborators in the biodies<strong>el</strong><br />
business, but may turn into adversaries if the promotion process is not conducted<br />
properly.<br />
• Flexible production at vegetable oil crushing and refining facilities lowers the investment<br />
cost, minimizes risk and may benefit from a host of synergies process integration,<br />
utilization of existing staff and analytic facilities. Additionally, vegetable oil producers<br />
have an intimate knowledge of the (agricultural) oilseed sector. Flexible production has<br />
been a key factor for the success of the Brazilian sugar/ethanol industry. Flexible<br />
production may allow vegetable oil producers to harvest benefits from the purchase of<br />
subsidized oilseeds for biodies<strong>el</strong> production, allowing to strengthen its core business<br />
instead of harming it.<br />
• The implementation of a new market can lead to short term shortage of supply of oilseeds<br />
and fluctuation of prices. At the current low lev<strong>el</strong> of domestic oilseed production,<br />
however, this threat is consi<strong>de</strong>red to be minor.<br />
Research and technology <strong>de</strong>v<strong>el</strong>opment<br />
Regarding R&D, activities should be emphasised to e.g.:<br />
• the establishment of agricultural research to improve the energy crop productivity<br />
especially towards broad variety of the different species and the establishment of new<br />
cultivation systems<br />
• the cooperation with PEMEX investigations on the un<strong>de</strong>rstanding of the hydrogenation<br />
options especially for the use of palm oil should be initiated.<br />
• the creation of regional research and <strong>de</strong>v<strong>el</strong>opment centres for biodies<strong>el</strong> and provi<strong>de</strong><br />
continuous funding. Private industries should be w<strong>el</strong>comed to participate but basic<br />
funding should be provi<strong>de</strong>d by government to assure to the availability of information<br />
r<strong>el</strong>evant to the interested public. This bas<strong>el</strong>ine funding could be provi<strong>de</strong>d by a small state<br />
tax on fu<strong>el</strong>s.<br />
• the institute outreach and technical assistance programs at these R&D centres. Part of this<br />
effort may be combined with the existing agricultural research and technology centers<br />
operated by the Fi<strong>de</strong>icomisos Instituidos en R<strong>el</strong>ación con la Agricultura en <strong>el</strong> Banco <strong>de</strong><br />
México (FIRA).<br />
• the creation of technology companies, both national and joint-ventures with foreign<br />
companies, through seed funding and soft credits. Preference should be given to small and<br />
medium-size companies.<br />
83
<strong>Potenciales</strong> y <strong>Viabilidad</strong> <strong><strong>de</strong>l</strong> <strong>Uso</strong> <strong>de</strong> <strong>Bioetanol</strong> y <strong>Biodies<strong>el</strong></strong> <strong>para</strong> <strong>el</strong> Transporte en México (SENER-BID-GTZ)<br />
Task C: <strong>Biodies<strong>el</strong></strong> production and end-use in Mexico; Task D: Potentials in r<strong>el</strong>ation to sustainability criteria<br />
Task E: Rationales, drivers and barriers for biodies<strong>el</strong> market introduction; Task F: Synthesis and recommendations<br />
• address the automotive industry an important and powerful potentially. Even though no<br />
specific need for “flex-fu<strong>el</strong>” vehicles exists in the biodies<strong>el</strong> sector (as opposed to the<br />
ethanol sector) the automakers do clear their dies<strong>el</strong> vehicles for a certain percentage of<br />
biodies<strong>el</strong> content only. Therefore, a request or possibly requirement should be issued to<br />
introduce such “more flexible” vehicles into the market.<br />
Financing and incentives<br />
A host of incentives is required to create a functioning national biodies<strong>el</strong> program.<br />
Summarizing, we the following incentives could support the biodies<strong>el</strong> market introduction:<br />
• Direct marketing of FIRA loans at TIE−6% for (smaller) biodies<strong>el</strong> projects.<br />
• Technology transfer through regional biodies<strong>el</strong> centres.<br />
However, these incentives are lik<strong>el</strong>y to be insufficient for a wi<strong>de</strong>r introduction of biodies<strong>el</strong><br />
(other than the one produced from waste vegetable oil), since the lion’s share of the biodies<strong>el</strong><br />
production cost can be attributed to the cost of raw materials, particularly vegetable oil.<br />
84
<strong>Potenciales</strong> y <strong>Viabilidad</strong> <strong><strong>de</strong>l</strong> <strong>Uso</strong> <strong>de</strong> <strong>Bioetanol</strong> y <strong>Biodies<strong>el</strong></strong> <strong>para</strong> <strong>el</strong> Transporte en México (SENER-BID-GTZ)<br />
Task C: <strong>Biodies<strong>el</strong></strong> production and end-use in Mexico; Task D: Potentials in r<strong>el</strong>ation to sustainability criteria<br />
Task E: Rationales, drivers and barriers for biodies<strong>el</strong> market introduction; Task F: Synthesis and recommendations<br />
REFERENCES<br />
(AGQM, 2006)<br />
(Banco <strong>de</strong> México, 2006)<br />
(Berger, 2004)<br />
(Becker 2005)<br />
(Best 2006)<br />
(Boyd, 2004)<br />
<strong>Biodies<strong>el</strong></strong> Quality Management Work Group AGQM):<br />
Running vehicles successfully on biodies<strong>el</strong>. Berlin, 2006<br />
Banco <strong>de</strong> México: Índice nacional <strong>de</strong> precios al consumidor<br />
mensual), 2006<br />
Peter Christian Berger: Best Case Fallbeispi<strong>el</strong> <strong>de</strong>r<br />
Europäischen <strong>Biodies<strong>el</strong></strong>industrie. Schriftenreihe<br />
Umw<strong>el</strong>tschutz und Rsourcenökonoimie, Band 42, Wien 2004<br />
Becker, K. Francis, G.: <strong>Biodies<strong>el</strong></strong> from Jatropha plantations on<br />
<strong>de</strong>gra<strong>de</strong>d land; Universität Hohenheim; Stuttgart; 2005.<br />
Best Gustavo.: Presentation at the UN Foundation Conference<br />
Sustainable Bioenergy Challenges + Oppertunities, Bonn<br />
October 2006.<br />
Mike Boyd, <strong>Biodies<strong>el</strong></strong> in British Columbia - Feasibility Study<br />
Report, Eco-Literacy Canada, April 27, 2004<br />
(Cámara <strong>de</strong> Diputados, 2005) Cámara <strong>de</strong> Diputados <strong><strong>de</strong>l</strong> Congreso <strong>de</strong> laUnión LIX<br />
Legislatura. Ley <strong>de</strong> Promoción y Desarrollo <strong>de</strong> los<br />
Bioenergéticos. México DF, December 2005<br />
(EEA, 2006)<br />
European Environment Agency).: How much bioenergy con<br />
Europe produce without harming the environment?<br />
Cophenhagen; 2006.<br />
(EnAu, 2003) Environment Australia.: National Standard for <strong>Biodies<strong>el</strong></strong> –<br />
Discussion Paper; Commonwealth of Australia; March 2003<br />
(EurObservER, 2006) EurObserv’ER: Biofu<strong>el</strong>s Barometer. Systèmes solaires n°<br />
173, Paris, France, May 2006<br />
(Falk, 2001)<br />
(FBDS, 2005)<br />
O. Falk, G. Sutor, S. Wiegland.: Studie – Altspeisefette:<br />
Aufkommmen und Verteilung, Technische Universität<br />
München, April 2001<br />
FBDS – Fundação Brasileira <strong>para</strong> o Desenvolvimento<br />
Sustentáv<strong>el</strong>.: Liquid Biofu<strong>el</strong>s for Transportation in Brazil;<br />
German Technical Cooperation GTZ), November 2005<br />
85
<strong>Potenciales</strong> y <strong>Viabilidad</strong> <strong><strong>de</strong>l</strong> <strong>Uso</strong> <strong>de</strong> <strong>Bioetanol</strong> y <strong>Biodies<strong>el</strong></strong> <strong>para</strong> <strong>el</strong> Transporte en México (SENER-BID-GTZ)<br />
Task C: <strong>Biodies<strong>el</strong></strong> production and end-use in Mexico; Task D: Potentials in r<strong>el</strong>ation to sustainability criteria<br />
Task E: Rationales, drivers and barriers for biodies<strong>el</strong> market introduction; Task F: Synthesis and recommendations<br />
(Foon, 2005)<br />
(FBDS, 2005)<br />
(Gerpen et al., 2004a)<br />
(Gerpen et al., 2004b)<br />
(Gerpen, 2004)<br />
(Graff, 2006)<br />
(Hilber 2005)<br />
(IEA, 2005)<br />
(IE, 2006)<br />
(IMP, 2006)<br />
(ITSEM, 2006)<br />
Cheg Sit Foon et. al.: Palm biodies<strong>el</strong>: Geraring towards<br />
malaysian biodies<strong>el</strong> standard. Malysian palm oil board. 2005<br />
Fundacao Brasileira <strong>para</strong> Desenvolvimento Sustentav<strong>el</strong>;<br />
Commissioned German Technical Cooperation (GTZ); Rio <strong>de</strong><br />
Janeiro; 2005<br />
Gerpen, J. van; Clements, D; Knothe, G.: <strong>Biodies<strong>el</strong></strong><br />
Production Technology August 2002-January 2004, National<br />
Renewable Energy Laboratory, NREL/SR-510-36244, July<br />
2004<br />
Gerpen, J. van; Clements, D; Knothe, G.: <strong>Biodies<strong>el</strong></strong> Analytic<br />
Methods August 2002-January 2004, National Renewable<br />
Energy Laboratory, NREL/SR-510-36240, July 2004<br />
Gerpen, J. van.: <strong>Biodies<strong>el</strong></strong> Management for <strong>Biodies<strong>el</strong></strong><br />
Producers August 2002- January 2004, National Renewable<br />
Energy Laboratory, NREL/SR-510-36242, July 2004<br />
Graff, G.: Glycerin glut send price plummenting. Article from<br />
the pages of Purchasing Magazine Online, June 2006<br />
T. Hilber, et. al.: Animal fats perform w<strong>el</strong>l in biodies<strong>el</strong>;<br />
Ren<strong>de</strong>rmagazine; Fbruary 2006<br />
International Energy Agency IEA); Wörgetter, M. &<br />
Bacovsky, D.: Report on the National <strong>Biodies<strong>el</strong></strong> Conference<br />
and Expo 2005. Conference and Expo Summary, For the IEA<br />
Bioenergy Task 39 “Liquid Biofu<strong>el</strong>s”, 2005<br />
Institute for Energy and Environment gGmbH: Grafics,<br />
Assumptions, Data basis, 2006<br />
Instituto Mexicano <strong><strong>de</strong>l</strong> Petroleo: Feasability of biomass<br />
<strong>de</strong>rived ethanol as fu<strong>el</strong> for transportation. Project ME-T1007 -<br />
ATN/DO-9375-ME, Activity 2. México’s Energy Picture,<br />
April, 2006<br />
Instituto Tecnologico y <strong>de</strong> Estudios Superiores <strong>de</strong> Monterrey:<br />
Photos, Data basis, 2006<br />
(Kaltschmitt, 2001) M. Kaltschmitt, H. Hartmann.: Energie aus Biomasse –<br />
Grundlagen, Techniken, Verfahren; Springer, Berlin, 2001.<br />
(Kinast, 2003)<br />
86<br />
J.A. Kinast Production of <strong>Biodies<strong>el</strong></strong>s from Multiple<br />
Feedstocks and Properties of <strong>Biodies<strong>el</strong></strong>s and<strong>Biodies<strong>el</strong></strong>/Dies<strong>el</strong><br />
Blends, Final Report, Report 1 in a series of 6, Gas
<strong>Potenciales</strong> y <strong>Viabilidad</strong> <strong><strong>de</strong>l</strong> <strong>Uso</strong> <strong>de</strong> <strong>Bioetanol</strong> y <strong>Biodies<strong>el</strong></strong> <strong>para</strong> <strong>el</strong> Transporte en México (SENER-BID-GTZ)<br />
Task C: <strong>Biodies<strong>el</strong></strong> production and end-use in Mexico; Task D: Potentials in r<strong>el</strong>ation to sustainability criteria<br />
Task E: Rationales, drivers and barriers for biodies<strong>el</strong> market introduction; Task F: Synthesis and recommendations<br />
Technology Institute, National Renewable Energy Laboratory,<br />
NREL/SR-510-31460, March 2003<br />
(LatinFocus, 2006)<br />
(Lazcano, 2006)<br />
(Macedo, 2006)<br />
(Markolwitz, 2004)<br />
(Mitt<strong>el</strong>bach, 2004)<br />
(NOM, 1994)<br />
(Oleoline, 2004)<br />
(Omni Tech, 2005)<br />
(Öko, 2006)<br />
(Po<strong>de</strong>r Ejecutivo<br />
Fe<strong>de</strong>ral, 1994)<br />
(Po<strong>de</strong>r Ejecutivo<br />
Fe<strong>de</strong>ral, 1998)<br />
(Promar International, 2005)<br />
Consumer Prices and Producer Prices, 1997 – 2006, Banco <strong>de</strong><br />
México and LatinFocus calculations, 2006<br />
I. Lazcano: Aspectos agrícolas y recursos potenciales <strong>para</strong> <strong>el</strong><br />
propósito”; Desarrollo <strong>de</strong> un estudio <strong>de</strong> factibilidad <strong>para</strong> <strong>el</strong><br />
uso <strong><strong>de</strong>l</strong> <strong>Biodies<strong>el</strong></strong> como combustible <strong>para</strong> <strong>el</strong> transporte en<br />
México. - July 2006.<br />
Macedo, Isaias <strong>de</strong> Carvalho.: Feasibility of Biomass-Derived<br />
as Fu<strong>el</strong> for Transportation; Mexico, July 2006<br />
M. Markolwitz, Dr. Johannes Ruwwe.: Herst<strong>el</strong>lung von<br />
<strong>Biodies<strong>el</strong></strong> mit Alkoholat-Katalysatoren; Degussa<br />
Aktienges<strong>el</strong>lschaft, Nie<strong>de</strong>rkass<strong>el</strong>-Lülsdorf, Bun<strong>de</strong>srepublik<br />
Deutschland<br />
Martin Mitt<strong>el</strong>bach, Claudia Remschmidt.: <strong>Biodies<strong>el</strong></strong> - The<br />
comprehensive handbook, Institut for Chemistrz Universitz<br />
Gray, 2004.<br />
Secretaría <strong>de</strong> Desarrollo Social. Norma Oficial Mexicana.<br />
NOM-086-ECO-1994<br />
Oleoline: Glycerin market report. Issue N°65, Montmorency,<br />
France June 2004<br />
Omni Tech International Ltd.: A Survey of Recent Chemical<br />
Price Trends – The Potential Impact of Rising Petrochemical<br />
Prices on Soy Use for Industrial Applications. Report<br />
prepared for the United Soybean Board, Midland; USA;<br />
December 2005<br />
Fritsche et. al.: Sustainability Standards for Bioenergy;<br />
commissioned WWF Germany; August 2006<br />
Po<strong>de</strong>r Ejecutivo Fe<strong>de</strong>ral. Reglamento <strong>de</strong> la Ley Reglamentaria<br />
<strong><strong>de</strong>l</strong> Artículo 27 Constitucional <strong><strong>de</strong>l</strong> Ramo <strong><strong>de</strong>l</strong> Petróleo. México<br />
D.F., 1994<br />
Po<strong>de</strong>r Ejecutivo Fe<strong>de</strong>ral: Reglamento <strong>de</strong> la Ley General <strong>de</strong><br />
Equilibrio Ecológico y la Protección al Ambiente en Materia<br />
<strong>de</strong> Residuos P<strong>el</strong>igrosos, México DF, 1998.<br />
Promar International: Evaluation and analysis of vegetable oil<br />
markets: The implications of increased <strong>de</strong>mand for industrial<br />
87
<strong>Potenciales</strong> y <strong>Viabilidad</strong> <strong><strong>de</strong>l</strong> <strong>Uso</strong> <strong>de</strong> <strong>Bioetanol</strong> y <strong>Biodies<strong>el</strong></strong> <strong>para</strong> <strong>el</strong> Transporte en México (SENER-BID-GTZ)<br />
Task C: <strong>Biodies<strong>el</strong></strong> production and end-use in Mexico; Task D: Potentials in r<strong>el</strong>ation to sustainability criteria<br />
Task E: Rationales, drivers and barriers for biodies<strong>el</strong> market introduction; Task F: Synthesis and recommendations<br />
uses on markets & USB strategy, Alexandria, USA,<br />
November 2005<br />
(S&T, 2004)<br />
(Senado, 2006)<br />
(Senado, 2006a)<br />
(Senado, 2006b)<br />
S&/T² Consultants Inc..: <strong>Biodies<strong>el</strong></strong> in North America:<br />
Implementation Issues; IEA Bioenergy Task 39,February<br />
2004<br />
Comisión <strong>de</strong> Medio Ambiente, Recursos Naturales y Pesca.<br />
Senado <strong>de</strong> la República LIX Legislatura<br />
http://www.senado.gob.mx/comisiones/directorio/<br />
comarnap/content/agenda/minutas.htm<br />
Senado <strong>de</strong> la República LIX Legislatura: Comisión <strong>de</strong> Medio<br />
Ambiente, Recursos Naturales y Pesca.<br />
http://www.senado.gob.mx/comisiones/directorio/<br />
comarnap/content/agenda/minutas.htm<br />
Senado <strong>de</strong> la República Gaceta Parlamentaria: Dictámenes <strong>de</strong><br />
Primera Lectura. Decreto que expi<strong>de</strong> la Ley <strong>de</strong> Promoción y<br />
Desarrollo <strong>de</strong> los Bioenergéticos, April 2006<br />
(SENER, 2006) Secretaría <strong>de</strong> Energia: Prospectiva <strong>de</strong> petrolíferos 2005-2014,<br />
2006<br />
(SMARN, 2004)<br />
(SPEDT, 2005)<br />
(TAB, 2002)<br />
(TFZ, 2002)<br />
(TrabsEnergética, 2006)<br />
(Tyson, 2002)<br />
Secretaría <strong>de</strong> Medio Ambiente y Recursos Naturales.<br />
Importancia <strong>de</strong> la reducción <strong><strong>de</strong>l</strong> contenido <strong>de</strong> azufre en<br />
gasolina y dies<strong>el</strong>. México DF. 2004.<br />
Subsecretaría <strong>de</strong> Planeación Energética y Desarrollo<br />
Tecnológico. Balance Nacional <strong>de</strong> Energía 2004. México D.F.<br />
2005<br />
Technikfolgenabschatzung „Bioenergieträger und<br />
Entwicklungsöän<strong>de</strong>r; Deutscher Bun<strong>de</strong>stag; Drucksache<br />
14/9953; 2002<br />
A. Widmann; K. Thuneke; E. Remm<strong>el</strong>e Pflanzenölbetrieben<br />
Blockheizkraftwerke - Leitpfa<strong>de</strong>n / B TU München-<br />
Weihenstephan / Bayrische Lan<strong>de</strong>sanstalt für Landtechnik /<br />
April 2002<br />
Transición Energética: De Ley <strong>de</strong> Promoción y Desarrollo <strong>de</strong><br />
los Bioenergéticos, a cargo <strong><strong>de</strong>l</strong> diputado cruz lópez aguilar,<br />
<strong><strong>de</strong>l</strong> grupo parlamentario <strong><strong>de</strong>l</strong> pri, August 2006<br />
http://www.funtener.org/pdfs/leybioenergeticos.pdf<br />
K. Shaine Tyson, Brown Grease Feedstocks for <strong>Biodies<strong>el</strong></strong>,<br />
June 19, 2002<br />
88
<strong>Potenciales</strong> y <strong>Viabilidad</strong> <strong><strong>de</strong>l</strong> <strong>Uso</strong> <strong>de</strong> <strong>Bioetanol</strong> y <strong>Biodies<strong>el</strong></strong> <strong>para</strong> <strong>el</strong> Transporte en México (SENER-BID-GTZ)<br />
Task C: <strong>Biodies<strong>el</strong></strong> production and end-use in Mexico; Task D: Potentials in r<strong>el</strong>ation to sustainability criteria<br />
Task E: Rationales, drivers and barriers for biodies<strong>el</strong> market introduction; Task F: Synthesis and recommendations<br />
(Tyson & McCormick, 2006) Tyson, K.S. & McCormick, R.L.: <strong>Biodies<strong>el</strong></strong> handling and use<br />
gui<strong><strong>de</strong>l</strong>ines. Second Edition, National Renewable Energy<br />
Laboratory NREL), DoE Energy Efficiency and Renewable<br />
Energies, NREL/TP-540-38836, Cole Blvd.Gol<strong>de</strong>n, March<br />
2006<br />
(UFOP, 2004)<br />
(UFOP, 2005)<br />
(USDA, 2006)<br />
(VDI, 1996)<br />
(Zappi, 2003)<br />
Union zur För<strong>de</strong>rung von O<strong>el</strong>- und Proteinpflanzen e.V.:<br />
Ölsäure einfach gut.<br />
Union for the Promotion of Oil and Protein Plants UFOP):<br />
<strong>Biodies<strong>el</strong></strong> Fakten und Argumente – das Wichtigste in Kürze.<br />
Berlin, October 2005<br />
USDA Foreign Agricultural Service; GAIN Report: “México<br />
Oilseeds and Products Annual 2006; April 2006.<br />
Verein Deutscher Ingenieure: Betriebswirtschaftliche<br />
Berechnungen für Investionsgüter und Anlagen VDI 6025).<br />
VDI-Ges<strong>el</strong>lschaft Technische Gebäu<strong>de</strong>ausrüstung, Verein<br />
Deutscher Ingenieure, Düss<strong>el</strong>dorf, 1996<br />
M. Zappi, et. al.: A Review of the Engineering Aspects of the<br />
<strong>Biodies<strong>el</strong></strong> Industry, MSU E-TECH Laboratory Report ET-03-<br />
003, Mississippi Biomass Council, August 2003.<br />
(Zhang, 2003) Y. Zhang.: <strong>Biodies<strong>el</strong></strong> production from waste cooking oil: 1.<br />
Process <strong>de</strong>sign and technological assessment Bioresource<br />
Technology 89 2003) 1–16, 21 January 2003<br />
89
<strong>Potenciales</strong> y <strong>Viabilidad</strong> <strong><strong>de</strong>l</strong> <strong>Uso</strong> <strong>de</strong> <strong>Bioetanol</strong> y <strong>Biodies<strong>el</strong></strong> <strong>para</strong> <strong>el</strong> Transporte en México (SENER-BID-GTZ)<br />
Task C: <strong>Biodies<strong>el</strong></strong> production and end-use in Mexico; Task D: Potentials in r<strong>el</strong>ation to sustainability criteria<br />
Task E: Rationales, drivers and barriers for biodies<strong>el</strong> market introduction; Task F: Synthesis and recommendations<br />
APPENDIX<br />
Table A-1 Land costs (Data examples ITESM, 2006)<br />
Parque Industrial Tepeji<br />
Address Km 60.5 autopista Méx.-Qro, Tepejil <strong><strong>de</strong>l</strong> Río <strong>de</strong> Ocampo HGO<br />
Location 108 km <strong>de</strong> Pachuca, 60 km <strong>de</strong> la Cd. <strong>de</strong> Mexico y 140 km <strong>de</strong> Qro.<br />
US$/m 2 30-35<br />
Lot size (m 2 ) Aproximadamente <strong>de</strong> 10,000 cada uno<br />
Infrastructure Electricity, rain and sanitary drainage, drinking water, partially paved roads, t<strong>el</strong>ephone<br />
and support services<br />
Parque Industrial Hidalgo<br />
Address Calle periférica esquina libramiento Calpulalpan, Tepeapulco HGO<br />
Location 80 km <strong>de</strong> Pachuca, 60 km <strong>de</strong> Tulancingo y 15 km <strong>de</strong> APAN<br />
US$/m 2 14-22<br />
Lot size (m 2 ) 5,000<br />
Infrastructure<br />
Electricity, drinking water, partially paved roads, t<strong>el</strong>ephone and support services<br />
Parque Industrial Atitalaquia, S.A <strong>de</strong> C.V<br />
Address Carretera Jorobas-Tula Km 24.5, Atitalaquia HGO<br />
Location 103 km <strong>de</strong> Pachuca, 124 km <strong>de</strong> Tulancingo, 8 km <strong>de</strong> Tula, 82 km DF<br />
US$/m 2 25-30<br />
Lot size (m 2 ) 5,000-10,000-11,000-20,000<br />
Infrastructure<br />
Electricity, rain and sanitary drainage, drinking water, partially paved roads, t<strong>el</strong>ephone<br />
and support services<br />
Parque Industrial Toluca 2000<br />
Address Carretera Toluca-Naucalpan Km 52.8, Toluca Edo. Méx.<br />
Location 50 km DF, 10 km Toluca, 52 km Naucalpan<br />
US$/m 2 400<br />
Lot size (m 2 ) 10,000-11,000-12,000-13,500-14,500-15,300-16,300<br />
Infrastructure<br />
Electricity, rain and sanitary drainage, industrial waste water discharge, drinking water,<br />
100% paved roads, t<strong>el</strong>ephone and exc<strong>el</strong>lent support services<br />
Cedros Business Park<br />
Address Autopista Méx.-Qro. km 41.88<br />
Location 30 km DF, 80 km Toluca, 170 km Querétaro<br />
US$/m 2 250<br />
Lot size (m 2 ) 2,000-3,000-3,500-4,000-6,500-8,800<br />
Infrastructure Electricity, sanitary drainage, drinking water, partially paved roads, t<strong>el</strong>ephone and<br />
support services<br />
90
<strong>Potenciales</strong> y <strong>Viabilidad</strong> <strong><strong>de</strong>l</strong> <strong>Uso</strong> <strong>de</strong> <strong>Bioetanol</strong> y <strong>Biodies<strong>el</strong></strong> <strong>para</strong> <strong>el</strong> Transporte en México (SENER-BID-GTZ)<br />
Task C: <strong>Biodies<strong>el</strong></strong> production and end-use in Mexico; Task D: Potentials in r<strong>el</strong>ation to sustainability criteria<br />
Task E: Rationales, drivers and barriers for biodies<strong>el</strong> market introduction; Task F: Synthesis and recommendations<br />
Nor-T Parque Industrial<br />
Address Av. José López Portillo y Calle Olivo, Tultitlán Edo. Méx.<br />
Location 20 km DF, 80 km Toluca, 180 km Querétaro<br />
US$/m 2 80<br />
Lot size (m 2 ) 8,600-15,400-23,000-30,000<br />
Infrastructure<br />
Electricity, water treatment plant, sanitary drainage, industrial waste water discharge,<br />
drinking water, partially paved roads, t<strong>el</strong>ephone and support services<br />
Table A-2 Companies with <strong>de</strong>mand on glycerin (Data examples ITESM, 2006)<br />
Companies<br />
Avon Cosmetics S.A. <strong>de</strong> C.V.,<br />
Aprotec <strong>de</strong> Mexico S.A. <strong>de</strong> C.V.,<br />
Bayer <strong>de</strong> Mexico, S.A. <strong>de</strong> C.V.,<br />
Casa Rocas, S.A. <strong>de</strong> C.V.,<br />
Dow Química Mexicana, S.A. <strong>de</strong> C.V.,<br />
Enmex, S.A. <strong>de</strong> C.V.,<br />
Grupo Warner Lambert Mexico, S.A. <strong>de</strong> C.V.,<br />
Holland Chemical Mexicana, S.A. <strong>de</strong> C.V.,<br />
Industrias Crown Chemical, S.A. <strong>de</strong> C.V.,<br />
Kimberly Clark Printing Technology, Lexmark International, S.A. <strong>de</strong> C.V.,<br />
Polioles, S.A. <strong>de</strong> C.V.,<br />
Resinas Sinteticas, S.A. <strong>de</strong> C.V.,<br />
Sigma-Aldrich Química S.A. <strong>de</strong> C.V.<br />
91
5 Advisory Board Sessions
Comité Consultivo sobre Biocombustibles en México<br />
Martes 14 <strong>de</strong> marzo 2006<br />
Secretaría <strong>de</strong> Energía (SENER)<br />
Sala <strong>de</strong> <strong>Uso</strong>s Multiples (planta baja)<br />
Insurgentes Sur 890, Col. D<strong>el</strong> Valle<br />
Ciudad <strong>de</strong> México<br />
9:00 Registro<br />
9:30 Bienvenida (Dr. Alejandro Dieck Assad, Subsecretario SENER)<br />
9:45 Introducción – Estudios <strong>de</strong> <strong>Viabilidad</strong> <strong>de</strong> Producción y Aprovechamiento <strong>de</strong> los<br />
Biocombustibles en México (Mo<strong>de</strong>ración: Juan Mata)<br />
• Bernhard Bösl (GTZ – Cooperación Técnica Alemana)<br />
• Arnaldo Vieira (BID)<br />
• Juan Mata (SENER)<br />
10:30 Coffee Break<br />
1ª SESIÓN DE TRABAJO DEL COMITÉ CONSULTIVO SOBRE BIOCOMBUSTIBLES EN MÉXICO<br />
11:00 Apertura (Mo<strong>de</strong>ración: Omar Masera)<br />
• Bienvenida (Juan Mata)<br />
• Presentación <strong>de</strong> los Participantes<br />
• Funcionamiento <strong><strong>de</strong>l</strong> Comité Consultivo (Omar Masera)<br />
12:00 Biocombustibles – Ten<strong>de</strong>ncias Internacionales y Perspectivas <strong>para</strong> México<br />
(Mo<strong>de</strong>ración: Omar Masera)<br />
• La Situación Internacional y Visiones <strong>para</strong> México (Consultores internacionales)<br />
• Primeros Escenarios <strong>para</strong> México (Nicolás Rodríguez)<br />
• Experiencia y Perspectivas <strong>para</strong> México (Participantes)<br />
14:00 Comida<br />
15:30 ¿Biocombustibles – Una Oportunidad <strong>para</strong> México? (Mo<strong>de</strong>ración: Omar Masera)<br />
• Discusión Pan<strong>el</strong><br />
• Preguntas y Respuestas<br />
16:30 Clausura (Juan Mata)
Comité Consultivo sobre Biocombustibles en México<br />
2ª Reunión <strong>de</strong> Trabajo<br />
ORDEN DEL DÍA<br />
Martes 30 <strong>de</strong> mayo 2006<br />
Centro <strong>de</strong> Capacitación en Calidad. SENER<br />
9:30 Registro<br />
10:00 Bienvenida<br />
Alejandro Dieck Assad. Subsecretario <strong>de</strong> Planeación Energética y Desarrollo Tecnológico<br />
10:10 Presentación <strong><strong>de</strong>l</strong> Or<strong>de</strong>n <strong><strong>de</strong>l</strong> Día e Introducción<br />
Juan Mata Sandoval. Director General <strong>de</strong> Investigación, Desarrollo Tecnológico y Medio Ambiente<br />
10:25 Estudio <strong>de</strong> <strong>Viabilidad</strong> <strong>de</strong> Producción y Aprovechamiento <strong>de</strong> los Biocombustibles<br />
en México<br />
11:50 Receso<br />
• Avances Generales<br />
Omar Masera. Coordinador <strong><strong>de</strong>l</strong> Estudio<br />
• Panorama Económico <strong>de</strong> México<br />
Omar Masera. Coordinador <strong><strong>de</strong>l</strong> Estudio<br />
• Análisis <strong>de</strong> Combustibles Líquidos en México, Perspectiva <strong><strong>de</strong>l</strong><br />
Consumo <strong>de</strong> Energía<br />
Nicolás Rodríguez. Consultor IMP<br />
• Situación Agrícola <strong>de</strong> México Etanol/<strong>Biodies<strong>el</strong></strong><br />
Ignacio Lazcano. Consultor<br />
12:00 • Insumos <strong>Potenciales</strong> <strong>para</strong> Etanol/<strong>Biodies<strong>el</strong></strong><br />
Ignacio Lazcano. Consultor<br />
• Escenarios <strong>de</strong> Producción Basados en Mezclas (<strong>Biodies<strong>el</strong></strong>)<br />
Micha<strong>el</strong> Weber. Consultor. Instituto <strong>de</strong> Leipzig. Alemania<br />
12:50 Status y Comentarios sobre <strong>el</strong> Proyecto <strong>de</strong> ley <strong>de</strong> Promoción y Desarrollo <strong>de</strong> los<br />
Bioenergéticos<br />
Juan Mata Sandoval. Director General <strong>de</strong> Investigación, Desarrollo Tecnológico y Medio Ambiente<br />
13:00 Proyecto <strong>de</strong> Producción <strong>de</strong> <strong>Biodies<strong>el</strong></strong>. Estado <strong>de</strong> Michoacán<br />
Rubén Lazos. Coordinador <strong>de</strong> R<strong>el</strong>aciones Interinstitucionales Oficina <strong><strong>de</strong>l</strong> Gobernador <strong>de</strong><br />
Michoacán<br />
13:15 Pan<strong>el</strong> <strong>de</strong> Discusión.<br />
Mo<strong>de</strong>rador: Omar Masera. Coordinador <strong><strong>de</strong>l</strong> Proyecto.<br />
• Intervenciones <strong>de</strong> los Miembros <strong><strong>de</strong>l</strong> Comité.<br />
• Sesión <strong>de</strong> Preguntas y Respuestas<br />
13:55 Clausura<br />
Juan Mata Sandoval. Director General <strong>de</strong> Investigación, Desarrollo Tecnológico y Medio Ambiente<br />
Nota: se anexa mapa <strong><strong>de</strong>l</strong> CECAL
Comité Consultivo sobre Biocombustibles en México<br />
3ª Reunión <strong>de</strong> Trabajo<br />
ORDEN DEL DÍA<br />
Martes 15 <strong>de</strong> Agosto 2006<br />
Salón <strong>de</strong> <strong>Uso</strong>s Múltiples <strong>de</strong> la SENER<br />
9:30 Registro<br />
9:45 Bienvenida<br />
Alejandro Dieck Assad. Subsecretario <strong>de</strong> Planeación Energética y Desarrollo Tecnológico<br />
10:00 Presentación <strong><strong>de</strong>l</strong> Or<strong>de</strong>n <strong><strong>de</strong>l</strong> Día e Introducción<br />
Juan Mata Sandoval. Director General <strong>de</strong> Investigación, Desarrollo Tecnológico y Medio Ambiente<br />
10:15 Estudio <strong>de</strong> <strong>Viabilidad</strong> <strong>de</strong> Producción y Aprovechamiento <strong>de</strong> los Biocombustibles<br />
en México<br />
• Avances Generales (aprox. 10 min.)<br />
Omar Masera. Coordinador <strong><strong>de</strong>l</strong> Estudio<br />
• Producción y Utilización <strong>de</strong> Etanol e ETBE en México: Situación<br />
Actual y Perspectivas Futuras (pendiente título. Aprox. 20 min.)<br />
Luiz Augusto Horta Nogueira. Consultor<br />
• Análisis <strong><strong>de</strong>l</strong> Potencial <strong>de</strong> Biocombustibles Líquidos en México,<br />
Perspectiva <strong><strong>de</strong>l</strong> Consumo <strong>de</strong> Energía (pendiente título. Aprox. 20 min.)<br />
Isaías C. Macedo. Consultor<br />
11:15 Receso<br />
11:30 • Problemas y Oportunida<strong>de</strong>s <strong><strong>de</strong>l</strong> Etanol como Combustible en México<br />
Sergio C. Trinda<strong>de</strong>. Consultor<br />
• Producción y Utilización <strong>de</strong> <strong>Biodies<strong>el</strong></strong> en México: Situación Actual y<br />
Perspectivas Futuras<br />
Dani<strong>el</strong>a Thrän. Consultor<br />
12:15 • <strong>Uso</strong> <strong>de</strong> Bicombustibles en <strong>el</strong> Sector Transporte (pendiente confirmación)<br />
Nemesio Ruíz. AMIA / Arturo Massutier. ANPACT<br />
12:50 Pan<strong>el</strong> <strong>de</strong> Discusión (<strong>de</strong>jar más tiempo <strong>para</strong> discusión)<br />
Mo<strong>de</strong>rador: Omar Masera. Coordinador <strong><strong>de</strong>l</strong> Proyecto<br />
• Intervenciones <strong>de</strong> los Miembros <strong><strong>de</strong>l</strong> Comité<br />
• Sesión <strong>de</strong> Preguntas y Respuestas<br />
14:20 Clausura<br />
Juan Mata Sandoval. Director General <strong>de</strong> Investigación, Desarrollo Tecnológico y Medio Ambiente
Asistentes a las Sesiones <strong><strong>de</strong>l</strong> Comité Consultivo<br />
sobre Biocombustibles en México<br />
• Alberto Llerena V.<br />
Gestor y Operador<br />
Universidad Autónoma <strong>de</strong> Chapingo<br />
T<strong>el</strong>/Fax: (55) 59-5952-1558<br />
E-mail: allerena@correo.chapingo.mx; f.allerenav@gmail.com<br />
• Alejandro Dieck<br />
Subsecretario <strong>de</strong> Planeación Energética y Desarrollo Tecnológico<br />
SENER<br />
T<strong>el</strong>/Fax: (55) 5000-6000<br />
E-mail: adieck@energia.gob.mx<br />
• Ama<strong>de</strong>o Ibarra Hallal<br />
Director General – Presi<strong>de</strong>nte<br />
Asociación Nacional <strong>de</strong> Industriales <strong>de</strong> Aceites y Mantecas Comestibles (ANIAME)<br />
Presi<strong>de</strong>ncia <strong><strong>de</strong>l</strong> Comité Nacional <strong><strong>de</strong>l</strong> Sistema Producto <strong>de</strong> Oleaginosas<br />
T<strong>el</strong>/Fax: (55) 5533-2859<br />
E-mail: aibarra@aniame.com<br />
• André Eckermann<br />
Asesor GTZ – México<br />
<strong>el</strong>/Fax: (55) 5000-6000 Ext. 2160<br />
E-mail: andre.eckermann@gtz.<strong>de</strong><br />
• Antonio Sierra<br />
General Motors<br />
T<strong>el</strong>/Fax: (55) 5901-3195<br />
E-mail: antoniorra@gm.com<br />
• Arnaldo Vieira <strong>de</strong> Carvalho<br />
Especialista <strong>de</strong> Energía<br />
BID<br />
T<strong>el</strong>/Fax: 1-202-623-1719<br />
E-mail: arnaldovc@iedb.org<br />
• Bernhard Bösl<br />
Director General<br />
GTZ – México<br />
T<strong>el</strong>/Fax: (55) 58 03 99 35<br />
E-mail: bernhard.boesl@gtz.<strong>de</strong><br />
• Carlos Blackaller Ayala<br />
Presi<strong>de</strong>nte<br />
Unión Nacional <strong>de</strong> Cañeros<br />
T<strong>el</strong>/Fax: (55) 5564-6995<br />
E-mail: cblackaller@caneros.org.mx
• Carlos Gómez Flores<br />
Presi<strong>de</strong>nte <strong><strong>de</strong>l</strong> Comité Directivo <strong>para</strong> <strong>el</strong> Desarrollo Sustentable<br />
CANACINTRA<br />
T<strong>el</strong>/Fax: 5243-4087<br />
E-mail: cgomez@gen.tv<br />
• Claudio Alatorre Frenk<br />
Instituto <strong>de</strong> Ingeniería, UNAM<br />
T<strong>el</strong>/Fax: 01(443)319-1125<br />
E-mail: caf@pumas.ii.unam.mx<br />
• David Magaña Lemus<br />
Especialista FIRA<br />
T<strong>el</strong>/Fax: 01 (443) 322 2512 Ext. 3402<br />
E-mail: dmagana@correo.fira.gob.mx<br />
• Dani<strong>el</strong>a Thrän<br />
Consultora<br />
IE – Leipzig<br />
T<strong>el</strong>/Fax: 49 (0) 341 - 2434 – 435<br />
E-mail: Dani<strong>el</strong>a.Thraen@ie-leipzig.<strong>de</strong><br />
• Dani<strong>el</strong> Gómez Bilbaw<br />
Subdirector<br />
PEMEX<br />
T<strong>el</strong>/Fax: 1944-2500 Ext. 53159<br />
• Eduardo López Pérez<br />
Asociación Nacional <strong>de</strong> Industriales <strong>de</strong> Aceites y Mantecas Comestibles (ANIAME)<br />
T<strong>el</strong>/Fax: (55) 5533-2847, 5525-7551<br />
E-mail: aniame@aniame.com<br />
• Fernando Marty Ordoñez<br />
Coordinador <strong>de</strong> Asesores <strong><strong>de</strong>l</strong> Secretario<br />
SENER<br />
T<strong>el</strong>/Fax: 5000 6000 ext 1217<br />
E-mail: fmarty@energia.gob.mx<br />
• Fi<strong><strong>de</strong>l</strong> Flores Cotera<br />
Coordinador <strong>de</strong> Asesores <strong>de</strong> la Subdirección <strong>de</strong> Planeación, Coordinación y Evaluación<br />
PEMEX Refinación<br />
T<strong>el</strong>/Fax: (55) 1944- 8353, (55) 1944-2500 Ext. 58857<br />
E-mail: ffloresc@ref.pemex.com<br />
• Francisco López Tostada<br />
Subsecretario <strong>de</strong> Agricultura<br />
SAGARPA<br />
T<strong>el</strong>/Fax: 9183-1084<br />
E-mail: flopez@sagarpa.gob.mx
• Francisco Mere<br />
Director General<br />
FIRA<br />
T<strong>el</strong>/Fax: 5499-1901<br />
E-mail: fmere@correo.fira.gob.mx<br />
• Gerardo Hiriart<br />
Investigador<br />
Instituto <strong>de</strong> Ingeniería UNAM<br />
T<strong>el</strong>/Fax: 5623-3500 ext. 1650<br />
E-mail: ghiriarte@ii.unam.mx<br />
• Gloria Margarita Álvarez<br />
Subdirectora<br />
CEDRSSA<br />
E-mail: gloria.alvarez@congreso.gob.mx<br />
• Guillermo Campos Coy<br />
Director <strong>de</strong> Ca<strong>de</strong>nas Agroindustriales<br />
Secretaría <strong>de</strong> Economía<br />
T<strong>el</strong>/Fax: (55) 5229-6100 Ext. 34209<br />
E-mail: gccoy@economia.gob.mx<br />
• Hugo Bautista Cavaría<br />
Gerente<br />
Asociación Nacional <strong>de</strong> Industriales <strong>de</strong> Aceites y Mantecas Comestibles (ANIAME)<br />
Presi<strong>de</strong>ncia <strong><strong>de</strong>l</strong> Comité Nacional <strong><strong>de</strong>l</strong> Sistema Producto <strong>de</strong> Oleaginosas<br />
T<strong>el</strong>/Fax: (55) 5533-2847, 5525-7551<br />
E-mail: hbautista@oleaginosas.org<br />
• Ignacio Lazcano Martinez<br />
Consultor In<strong>de</strong>pendiente<br />
Mesón <strong><strong>de</strong>l</strong> Prado 188 Col. Villas <strong><strong>de</strong>l</strong> Mesón. Querétaro, Qro.<br />
T<strong>el</strong>/Fax: 01 (442) 234 - 2576; 01 (442) 234 - 3112; 044-55- 2508-9484<br />
E-mail: ilazcano29@yahoo.com.mx<br />
• Isaías C. Macedo<br />
Consultor<br />
UNICAMP<br />
T<strong>el</strong>/Fax: (19) 3289 3125 / 5499<br />
E-mail: isaiasmacedo22@terra.co.br<br />
• Javier Aguillón<br />
Secretario General <strong>de</strong> la Red Mexicana <strong>de</strong> Bioenergía - I.I (Rembio)<br />
UNAM<br />
T<strong>el</strong>/Fax: (55) 5623-3500 Ext. 1111<br />
E-mail: jea@pumas.ii.unam.mx
• Javier Chávez Navarro<br />
Subdirector <strong>de</strong> Comisiones y Representaciones<br />
CANACINTRA<br />
T<strong>el</strong>/Fax: (55) 54 82 30 00 Ext. 1437 y 1439<br />
E-mail: jchavez@canacintra.org.mx<br />
• Juan Cristóbal Mata Sandoval<br />
Director General <strong>de</strong> Investigación, Desarrollo Tecnológico y Medio Ambiente<br />
SENER<br />
T<strong>el</strong>/Fax: 5000-6000 Ext. 1057<br />
E-mail: jmata@energia.gob.mx<br />
• Juan Francisco Ortega<br />
Asesor<br />
PEMEX<br />
T<strong>el</strong>/Fax: 1944-2500 Ext. 53159<br />
E-mail: jfortega@ref.pemex.com<br />
• Juan Manu<strong>el</strong> Ávalos A.<br />
Asesor Unión Nacional <strong>de</strong> Cañeros<br />
T<strong>el</strong>/Fax: (55) 5564-6995<br />
E-mail: javalos@caneros.org.mx<br />
• Jorge Terrones<br />
Consultor<br />
OleoSur, S.A. <strong>de</strong> C.V.<br />
T<strong>el</strong>/Fax: 5525-5425, 5525-5412<br />
E-mail: jfterronesm@prodigy.net.mx<br />
• Kevin C. Smith<br />
Managing Director<br />
Energy Sistems Internacional<br />
T<strong>el</strong>/Fax: 831 - 656 – 9588<br />
E-mail: Kcssac@aol.com<br />
• Luiz Augusto Horta Nogueira<br />
Consultor<br />
CERNE / UNIFEI<br />
T<strong>el</strong>/Fax: (035) 3622 – 4321<br />
E-mail: horta@unifei.edu.br<br />
• Manu<strong>el</strong>a Prehn<br />
Colaboradora<br />
Red Mexicana <strong>de</strong> Bioenergía (REMBIO)<br />
Antigüa Carretera a Pátzcuaro No. 8701 Mor<strong>el</strong>ia, Michoacán. México<br />
T<strong>el</strong>/Fax: (01) 44 33 22 27 09<br />
E-mail: mprehn@oikos.unam.mx
• Manu<strong>el</strong> Enríquez Poy<br />
Vicepresi<strong>de</strong>nte<br />
Cámara Nacional <strong>de</strong> la Industria Azucarera y Alcoholera (CNIAA)<br />
T<strong>el</strong>/Fax: (55) 5519-7835<br />
E-mail: poymanu<strong>el</strong>@prodigy.net.mx<br />
E-mail: cmsamex@prodigy.net.mx<br />
• Manu<strong>el</strong> José Molano Ruíz<br />
Director General <strong><strong>de</strong>l</strong> Fi<strong>de</strong>icomiso Comercializador FICO<br />
T<strong>el</strong>/Fax: (55) 5062-6792 y 88<br />
• María Elena Sierra<br />
Directora <strong>de</strong> Energía y Medio Ambiente<br />
SENER<br />
T<strong>el</strong>/Fax: 5000-6000 Ext. 2165<br />
E-mail: esierra@energia.gob.mx<br />
• Martha Gris<strong>el</strong>da Alva <strong>de</strong> la S<strong>el</strong>va<br />
Directora <strong>de</strong> la Industria Química y Farmacéutica<br />
Secretaría <strong>de</strong> Economía<br />
T<strong>el</strong>/Fx: (55) 5229-6100 Ext, 34203<br />
E-mail: mgalva@economia.gob.mx<br />
• Migu<strong>el</strong> Hernán<strong>de</strong>z Storey<br />
Director <strong>de</strong> Banca Corporativa y <strong>de</strong> Inversiones<br />
FIRA<br />
T<strong>el</strong>/Fax: (443) 3222336<br />
E-mail: Mherna<strong>de</strong>z<br />
• Nemesio Ruíz Aguilar<br />
Director Técnico<br />
Asociación Mexicana <strong>de</strong> la Industria Automotriz, A.C.<br />
T<strong>el</strong>/Fax: (55) 5272-1144, (55) 5272-7139<br />
E-mail: nemesio@amia.com.mx<br />
• Nicolás Rodríguez Martínez<br />
Director <strong>de</strong> Seguridad y Medio Ambiente<br />
IMP<br />
T<strong>el</strong>/Fax: 9175-0139<br />
E-mail: nrmartin@imp.mx<br />
• Omar Masera Cerutti<br />
Coordinador <strong>de</strong> Consultores<br />
Red Mexicana <strong>de</strong> Bioenergía (REMBIO)<br />
T<strong>el</strong>/Fax: 5623-2709<br />
E-mail: omasera@oikos.unam.mx
• Oliver Flores Parra B.<br />
Desarrollo <strong>de</strong> Mercado<br />
FEESA – SAGARPA<br />
T<strong>el</strong>/Fax: 5062 – 6791<br />
E-mail: oflores@feesa.com<br />
• Oliver Probst<br />
Director <strong>de</strong> Departamento<br />
ITESM – Monterrey<br />
T<strong>el</strong>/Fax: (01-81) 8358-2000 Ext. 4630<br />
E-mail: oprobst@itesm.mx<br />
• Oscar Fernán<strong>de</strong>z<br />
Volkswagen<br />
T<strong>el</strong>/Fax: 01 (222) 230-6561<br />
E-mail: oscar.fernan<strong>de</strong>z@vw.com.mx<br />
• Pascual Alvarado<br />
Asesor UPCACNC, AC<br />
T<strong>el</strong>/Fax: (55) 2775 – 2469<br />
E-mail: pas_alvarado@yahoo.com<br />
• Ramón Carlos Torres Flores<br />
Dirección General <strong>de</strong> Energía y Activida<strong>de</strong>s Extractivas<br />
SEMARNAT<br />
T<strong>el</strong>/Fax: (55)5628-0663 (55)5628-0737 (55)5628-0600 Ext.12143<br />
E-mail: rctorres@semarnat.gob.mx<br />
• Ramón Torres Enríquez<br />
Subdirector P. Sectoriales<br />
SENER<br />
T<strong>el</strong>/Fax: 5000 – 6000 Ext. 1382<br />
E-mail: ctorres@energia.gob.mx<br />
• Raúl Cortés García<br />
Coordinador <strong>de</strong> Reconversión y Diversificación <strong>de</strong> la Industria Cañera<br />
Universidad Veracruzana Centro Virtual <strong>de</strong> Investigación Multidisciplinaria<br />
T<strong>el</strong>/Fax: (01-228)815-3662 y 841-8931<br />
E-mail: rcortesg50@yahoo.com.mx; racortes@uv.mx<br />
• Raúl Rodríguez García<br />
Director <strong>de</strong> Impacto Ambiental y Fuentes Renovables<br />
SEMARNAT<br />
T<strong>el</strong>./Fax: (55) 5628-0772<br />
E-mail: mrodriguez@semarnat.gob.mx<br />
• Roberto Capuano<br />
Consultor<br />
Secretaría <strong>de</strong> Medio Ambiente y Recursos Naturales – SEMARNAT<br />
E-mail: rcapuano@rntgors.edu
• Rosario Con<strong>de</strong> B.<br />
Consultor In<strong>de</strong>pendiente<br />
T<strong>el</strong>/Fax: 01 (442) 234 - 2576; 01 (442) 234 - 3112; 044-55- 2508-9484<br />
E-mail: ilazcano29@yahoo.com.mx<br />
• Sergio c. Trinda<strong>de</strong><br />
Presi<strong>de</strong>nte<br />
SE 2T International, LTD<br />
T<strong>el</strong>/Fax: 1-914-725-8230<br />
E-mail: strinda<strong>de</strong>@alum.mit.edu<br />
• Wiebke Mai<br />
Practicante<br />
GTZ – México<br />
T<strong>el</strong>/Fax: (55) 5000-6000 Ext. 1088<br />
E-mail: wiebke_mai@yahoo.<strong>de</strong>