Potenciales y Viabilidad del Uso de Bioetanol y Biodiesel para el ...
Potenciales y Viabilidad del Uso de Bioetanol y Biodiesel para el ...
Potenciales y Viabilidad del Uso de Bioetanol y Biodiesel para el ...

Create successful ePaper yourself
Turn your PDF publications into a flip-book with our unique Google optimized e-Paper software.
<strong>Potenciales</strong> y <strong>Viabilidad</strong> <strong><strong>de</strong>l</strong> <strong>Uso</strong> <strong>de</strong> <strong>Bioetanol</strong> y <strong>Biodies<strong>el</strong></strong> <strong>para</strong> <strong>el</strong> Transporte en México (SENER-BID-GTZ)<br />
Task 1: Economic Overview<br />
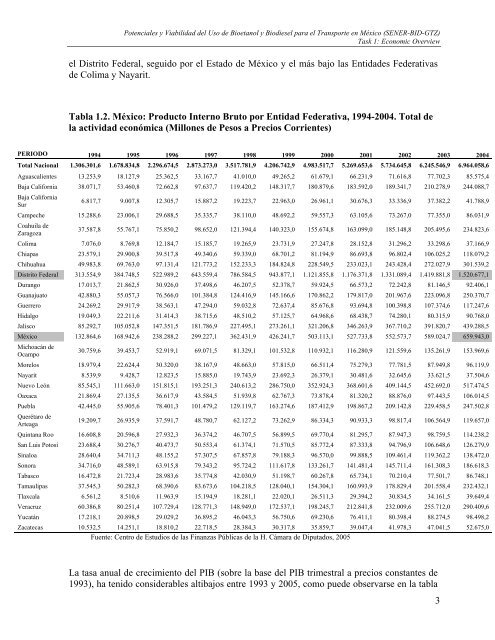
<strong>el</strong> Distrito Fe<strong>de</strong>ral, seguido por <strong>el</strong> Estado <strong>de</strong> México y <strong>el</strong> más bajo las Entida<strong>de</strong>s Fe<strong>de</strong>rativas<br />
<strong>de</strong> Colima y Nayarit.<br />
Tabla 1.2. México: Producto Interno Bruto por Entidad Fe<strong>de</strong>rativa, 1994-2004. Total <strong>de</strong><br />
la actividad económica (Millones <strong>de</strong> Pesos a Precios Corrientes)<br />
PERIODO 1994 1995 1996 1997 1998 1999 2000 2001 2002 2003 2004<br />
Total Nacional 1.306.301,6 1.678.834,8 2.296.674,5 2.873.273,0 3.517.781,9 4.206.742,9 4.983.517,7 5.269.653,6 5.734.645,8 6.245.546,9 6.964.058,6<br />
Aguascalientes 13.253,9 18.127,9 25.362,5 33.167,7 41.010,0 49.265,2 61.679,1 66.231,9 71.616,8 77.702,3 85.575,4<br />
Baja California 38.071,7 53.460,8 72.662,8 97.637,7 119.420,2 148.317,7 180.879,6 183.592,0 189.341,7 210.278,9 244.088,7<br />
Baja California<br />
Sur<br />
6.817,7 9.007,8 12.305,7 15.887,2 19.223,7 22.963,0 26.961,1 30.676,3 33.336,9 37.382,2 41.788,9<br />
Campeche 15.288,6 23.006,1 29.688,5 35.335,7 38.110,0 48.692,2 59.557,3 63.105,6 73.267,0 77.355,0 86.031,9<br />
Coahuila <strong>de</strong><br />
Zaragoza<br />
37.587,8 55.767,1 75.850,2 98.652,0 121.394,4 140.323,0 155.674,8 163.099,0 185.148,8 205.495,6 234.823,6<br />
Colima 7.076,0 8.769,8 12.184,7 15.185,7 19.265,9 23.731,9 27.247,8 28.152,8 31.296,2 33.298,6 37.166,9<br />
Chiapas 23.579,1 29.900,8 39.517,8 49.340,6 59.339,0 68.701,2 81.194,9 86.693,8 96.802,4 106.025,2 118.079,2<br />
Chihuahua 49.983,8 69.763,0 97.131,4 121.773,2 152.233,3 184.824,8 228.549,5 233.023,1 243.428,4 272.027,9 301.539,2<br />
Distrito Fe<strong>de</strong>ral 313.554,9 384.748,5 522.989,2 643.559,4 786.584,5 943.877,1 1.121.855,8 1.176.371,8 1.331.089,4 1.419.881,8 1.520.677,1<br />
Durango 17.013,7 21.862,5 30.926,0 37.498,6 46.207,5 52.378,7 59.924,5 66.573,2 72.242,8 81.146,5 92.406,1<br />
Guanajuato 42.880,3 55.057,3 76.566,0 101.384,8 124.416,9 145.166,6 170.862,2 179.817,0 201.967,6 223.096,8 250.370,7<br />
Guerrero 24.269,2 29.917,9 38.563,1 47.294,0 59.032,8 72.637,4 85.676,8 93.694,8 100.398,8 107.374,6 117.247,6<br />
Hidalgo 19.049,3 22.211,6 31.414,3 38.715,6 48.510,2 57.125,7 64.968,6 68.438,7 74.280,1 80.315,9 90.768,0<br />
Jalisco 85.292,7 105.052,8 147.351,5 181.786,9 227.495,1 273.261,1 321.206,8 346.263,9 367.710,2 391.820,7 439.288,5<br />
México 132.864,6 168.942,6 238.288,2 299.227,1 362.431,9 426.241,7 503.113,1 527.733,8 552.573,7 589.024,7 659.943,0<br />
Michoacán <strong>de</strong><br />
Ocampo<br />
30.759,6 39.453,7 52.919,1 69.071,5 81.329,1 101.532,8 110.932,1 116.280,9 121.559,6 135.261,9 153.969,6<br />
Mor<strong>el</strong>os 18.979,4 22.624,4 30.320,0 38.167,9 48.663,0 57.815,0 66.511,4 75.279,3 77.781,5 87.949,8 96.119,9<br />
Nayarit 8.539,9 9.428,7 12.823,5 15.885,0 19.743,9 23.692,3 26.379,1 30.481,6 32.645,6 33.621,5 37.504,6<br />
Nuevo León 85.545,1 111.663,0 151.815,1 193.251,3 240.613,2 286.750,0 352.924,3 368.601,6 409.144,5 452.692,0 517.474,5<br />
Oaxaca 21.869,4 27.135,5 36.617,9 43.584,5 51.939,8 62.767,3 73.878,4 81.320,2 88.876,0 97.443,5 106.014,5<br />
Puebla 42.445,0 55.905,6 78.401,3 101.479,2 129.119,7 163.274,6 187.412,9 198.867,2 209.142,8 229.458,5 247.502,8<br />
Querétaro <strong>de</strong><br />
Arteaga<br />
19.209,7 26.935,9 37.591,7 48.780,7 62.127,2 73.262,9 86.334,3 90.933,3 98.817,4 106.564,9 119.657,0<br />
Quintana Roo 16.608,8 20.596,8 27.932,3 36.374,2 46.707,5 56.899,5 69.770,4 81.295,7 87.947,3 98.759,5 114.238,2<br />
San Luis Potosí 23.688,4 30.276,7 40.473,7 50.553,4 61.374,1 71.570,5 85.772,4 87.333,8 94.796,9 106.648,6 126.279,9<br />
Sinaloa 28.640,4 34.711,3 48.155,2 57.307,5 67.857,8 79.188,3 96.570,0 99.888,5 109.461,4 119.362,2 138.472,0<br />
Sonora 34.716,0 48.589,1 63.915,8 79.343,2 95.724,2 111.617,8 133.261,7 141.481,4 145.711,4 161.308,3 186.618,3<br />
Tabasco 16.472,8 21.723,4 28.983,6 35.774,8 42.030,9 51.198,7 60.267,8 65.734,1 70.210,4 77.501,7 86.748,1<br />
Tamaulipas 37.545,3 50.282,3 68.390,6 83.673,6 104.218,5 128.040,1 154.304,1 160.993,9 178.829,4 201.558,4 232.432,1<br />
Tlaxcala 6.561,2 8.510,6 11.963,9 15.194,9 18.281,1 22.020,1 26.511,3 29.394,2 30.834,5 34.161,5 39.649,4<br />
Veracruz 60.386,8 80.251,4 107.729,4 128.771,3 148.949,0 172.537,1 198.245,7 212.841,8 232.009,6 255.712,0 290.409,6<br />
Yucatán 17.218,1 20.898,5 29.029,2 36.895,2 46.043,3 56.750,6 69.230,6 76.411,1 80.398,4 88.274,5 98.498,2<br />
Zacatecas 10.532,5 14.251,1 18.810,2 22.718,5 28.384,3 30.317,8 35.859,7 39.047,4 41.978,3 47.041,5 52.675,0<br />
Fuente: Centro <strong>de</strong> Estudios <strong>de</strong> las Finanzas Públicas <strong>de</strong> la H. Cámara <strong>de</strong> Diputados, 2005<br />
La tasa anual <strong>de</strong> crecimiento <strong><strong>de</strong>l</strong> PIB (sobre la base <strong><strong>de</strong>l</strong> PIB trimestral a precios constantes <strong>de</strong><br />
1993), ha tenido consi<strong>de</strong>rables altibajos entre 1993 y 2005, como pue<strong>de</strong> observarse en la tabla<br />
3